chapter 2 effects of prescription drug coverage …groups, income levels, and health statuses....
TRANSCRIPT
39
CHAPTER 2
EFFECTS OF PRESCRIPTION DRUG COVERAGEON SPENDING AND UTILIZATION
Insurance coverage that includes coverage of prescription drugs plays a critical role inassuring access to needed medications. People with coverage not only fill moreprescriptions than people without coverage; they are likely to have access to a broaderarray of therapies, including more costly therapies. People without drug coverage facegreater financial burdens and may sometimes be unable to follow the courses oftreatment ordered by their physicians. There are even some indications that physiciansthemselves may recommend different therapies to people with and without coverage.
As will be seen, the effects of prescription drug coverage persist across different agegroups, income levels, and health statuses. Coverage increases prescription drugutilization, changes the mix of different drugs received, and reduces financial burdensfor all population groups. However, access to drug coverage is most important for theelderly, simply because they require more medications, including a higher prevalenceof long-term maintenance drugs for chronic conditions.
This chapter will first present detailed comparisons of utilization and spending forMedicare beneficiaries and the total population with and without drug coverage.Second, it will examine some of the possible reasons for those differences and willconsider the consequences of being without coverage. Finally, it will summarize trendsin utilization and spending and some of the factors that influence these changes.
Key findings include:
• Medicare beneficiaries with coverage fill nearly one-third more prescriptions thanthose without coverage.
• Although total drug spending for beneficiaries with coverage is nearly two-thirdshigher, those without coverage pay nearly twice as much out of pocket ($463 versus$253).
• On average, beneficiaries with coverage pay out of pocket for about one-third oftheir total spending on drugs. However, the share of spending paid out of pocketvaries by source of coverage, from 58 percent for those with Medigap coverage to 20percent for those with Medicaid.

40
• Differences in utilization and spending between Medicare beneficiaries with andwithout drug coverage generally hold up across different income levels, ages,health status, and other categories.
• Drug insurance makes an especially large difference in dollar terms for those in thepoorest health. Among beneficiaries with five or more chronic conditions, thosewith coverage had much higher total spending ($1,402 versus $944) and much lowerout-of-pocket spending ($412 versus $944) than beneficiaries without coverage.
• Among people who are not Medicare beneficiaries, similar differences in utilizationand spending exist between prescription drug users with and without coverage.Those with coverage for drugs fill two-thirds more prescriptions but spend a thirdless out of pocket than those without coverage.
• About a third of Medicare beneficiaries accounted for three-fourths of beneficiaries’total drug spending in 1996. Only 13 percent had no spending at all. Spending onprescription drugs in the non-Medicare population is even less evenly distributed.
• Self-selection does not explain the difference in spending between Medicarebeneficiaries with and without drug coverage. Even among beneficiaries with thesame poor health status, more prescriptions are written for people with coverage,and people without coverage are less likely to fill prescriptions.
• Prescription drugs take up about one sixth of all health spending by the elderly.Out of pocket spending for prescription drugs is a larger proportion of healthspending for the elderly than for younger people. Prescription drug spending alsoaccounts for a larger share of spending by people with low incomes than it does forpeople with higher incomes.
• The burden of prescription drug costs creates access problems for somebeneficiaries. High spenders with incomes below the poverty line spend more thanone-fourth of their income on drugs. Among Medicare beneficiaries, 10 percent ofthose with only Medicare coverage report not being able to afford a needed drug,compared to 2 percent of those with a non-Medicaid supplement.
• Drug spending has grown more quickly than other health spending throughout the1990’s. Price increases, higher utilization, and the use of newer, more expensivedrugs all play a part in increasing drug spending.
COMPARISONS OF UTILIZATION AND SPENDING
This section will present, for Medicare beneficiaries and for the non-Medicarepopulation, comparisons of utilization by covered and noncovered people grouped by

41
various demographic and health characteristics. Unless otherwise noted, all resultsreported in this chapter are statistically significant at the 0.05 level, based on atwo-tailed test. See the Introduction of this report for details.
The comparisons here are limited to simple descriptive tables, primarily focusing onthe ratio between people with and without drug coverage. It is important to note thatthese descriptive comparisons, which look at one factor at a time, may not isolate thekey determinants of drug spending. Multivariate analysis would be needed toestablish which factors are most important in explaining differences between thecovered and noncovered populations.
Most of the estimates provided in this chapter are drawn from Medicare CurrentBeneficiary Survey (MCBS) and Medical Expenditure Panel Survey (MEPS) data onprescription drugs. It should be noted that over-the-counter drugs are not includedhere. Drugs that are available both over-the-counter and in prescription strength areincluded if the drug was obtained in prescription strength.
MCBS and MEPS use different methods to gather data on utilization and spending.However, both find the same patterns in utilization and spending for people with andwithout coverage. Their estimates of the magnitude of the gaps between the coveredand uncovered are sometimes different, though rarely contradictory. A detailedsummary of the survey methods and of the differences in results is provided inappendix B.
Overall differences
Table 2-1, drawn from 1996 MCBS data, compares drug utilization and spending forMedicare beneficiaries with and without drug coverage. As in the previous chapter,beneficiaries are included in the covered category if they had drug coverage at anypoint during the year. The next section of this chapter will explore the differences inspending and utilization depending on the duration of their coverage.

42
Table 2-1. Utilization and Spending for Prescription DrugsBy Medicare Beneficiaries with and without Drug Coverage, 1996
All Medicare beneficiariesBeneficiaries who filledat least one prescription
CoveredNot
covered
Ratio,covered/
notcovered Covered
Notcovered
Ratio,covered/
notcovered
Percent who filled at leastone prescription
89.4% 80.3% 1.11 100% 100% 1.00
Average # of prescriptions 21.14 16.01 1.32 23.64 19.93 1.19
Average annual spending $768.90 $463.15 1.66 $859.99 $576.43 1.49
Retail price per prescription $36.37 $28.93 1.26 $36.37 $28.93 1.26
Average out-of-pocketspending
$252.65 $463.15 0.55 $282.58 $576.43 0.49
% out-of-pocket 33% 100% 0.33 33% 100% 0.33
Average out-of-pocket perprescription
$11.95 $28.93 0.41 $11.95 $28.93 0.41
Source: Information and Methods Group, Office of Strategic Planning, Health Care FinancingAdministration: Medicare Current Beneficiary Survey Cost and Use File, 1996.
The table shows that:
• Beneficiaries who have prescription drug coverage fill nearly one-third moreprescriptions than those who do not have coverage, and total drug spending forbeneficiaries with coverage is nearly two-thirds higher.
• The cost of prescriptions filled by beneficiaries with coverage is higher onaverage than the cost of prescriptions filled by beneficiaries without coverage.This is not because the price of any specific medication is higher for people withcoverage. Instead, the difference seems to come from the fact that people withdrug coverage receive a different mix of drugs than noncovered people receive,or different size prescriptions. The next chapter will show that for a givenprescription, prices are generally lower for people with third-party coveragethan for people who purchase their own drugs.
• Beneficiaries with coverage pay out of pocket for 33 percent of their totalspending on prescription drugs; those without coverage, of course, pay 100percent. For each prescription they fill, beneficiaries without coverage pay onaverage more than twice as much out of pocket as those who have coverage.Overall, their annual out-of-pocket costs are nearly twice as high -- $200 more --even though they use fewer medications (see Figure 2-1).

43
Figure 2-1. Out-of-pocket and Insurer Spending on Prescription Drugs by MedicareBeneficiaries with and without Drug Coverage, 1996
Source: Information and Methods Group, Office of Strategic Planning, Health Care FinancingAdministration: Medicare Current Beneficiary Survey Cost and Use File, 1996.
$ 4 6 3
$ 2 5 3
$ 5 1 6
$0
$200
$400
$600
$800
N o R x c o v e r a g e W i t h R x c o v e r a g e
Av
era
ge
Sp
en
din
g p
er
Be
ne
fic
iary
InsurerSpending
Out-of-PocketSpending

44
• Beneficiaries with coverage are more likely to fill at least one prescription. Thedifferences between those with and without coverage persist even when lookingonly at beneficiaries who fill prescriptions (see Figure 2-2).
Figure 2-2. Medicare Beneficiaries Who Filled a Prescription and Number ofPrescriptions Filled, by Coverage Status, 1996
Source: Information and Methods Group, Office of Strategic Planning, Health Care FinancingAdministration: Medicare Current Beneficiary Survey Cost and Use File, 1996
Table 2-2 presents similar information for the non-Medicare population.1 Thedifferences in utilization and total spending are much greater. This is because a verylarge number of non-Medicare individuals without coverage — nearly two-thirds —receive no prescription drugs at all. In contrast, only 13 percent of Medicarebeneficiaries fill no prescription during the year.2 If one considers only users ofprescription drugs, the patterns are more similar to those shown in Table 2-1. Thosewho have coverage receive more, and more costly, prescriptions.3 Those withoutcoverage pay over twice as much out-of-pocket for each prescription they fill (seeFigure 2-3).
1 This and subsequent MEPS-based tables on the non-Medicare population are limited to nonelderly peoplewithout Medicare. They omit the very small number of elderly people—an estimated 150,000—who are notcovered by Medicare.
2 Appendix B contains a further discussion of use rates and how users are treated in this report.
3 The difference in the price of prescriptions purchased by covered people compared to those purchased bynoncovered people is only statistically significant at the five percent level on a one-tail test.
89.4%
80.3%
Covered Not covered
23.6
19.9
Covered Not covered
Beneficiaries who filled a prescriptionAverage number of prescriptions filled
by beneficiaries who used drugs

45
Table 2-2. Utilization and Spending for Prescription DrugsBy Non-Medicare Individuals with and without Drug Coverage, 1996
Total non-Medicare populationPeople who filled
at least one prescription
CoveredNot
covered
Ratio,covered/
notcovered Covered
Notcovered
Ratio,covered/
notcovered
Percent who filled at leastone prescription
70.0 33.9 2.06 100% 100% 1.00
Average # of prescriptions 6.80 2.02 3.36 9.73 5.92 1.64
Average annual spending $222.01 $58.94 3.77 $317.64 $172.64 1.84
$ per prescription $32.65 $29.17 1.12 $32.65 $29.17 1.12
Average out-of-pocketspending
$80.59 $58.94 1.37 $115.30 $172.64 0.67
% out-of-pocket 36% 100% 0.36 36% 100% 0.36
Average out-of-pocket perprescription
$11.85 $29.17 0.41 $11.85 $29.17 0.41
Source: Center for Cost and Financing Studies, Agency for Healthcare Research and Quality: MedicalExpenditure Panel Survey Household Component, 1996.
Figure 2-3. Out-of-pocket and Insurer Spending on Prescription Drugs by Non-Medicare Beneficiaries with and without Drug Coverage, 1996
Source: Center for Cost and Financing Studies, Agency for Healthcare Research and Quality: MedicalExpenditure Panel Survey Household Component, 1996.
$ 5 9$ 8 1
$ 1 7 3
$ 1 1 5
$ 1 4 1
$ 2 0 2
U n c o v e r e d C o v e r e d U n c o v e r e d C o v e r e d
Av
era
ge
Sp
en
din
g p
er
Pe
rso
n
I n s u r e rS p e n d i n g
O u t o f
P o c k e tS p e n d i n g
Total non-Medicarepopulation
Non-Medicareprescription drug
users

46
It should be emphasized that, throughout this chapter, “out-of-pocket costs” includeonly the net costs to an individual, after any insurance payments, for any prescriptionsreceived. Premiums paid for insurance coverage are not included. This analysisexcludes premiums because it is difficult with survey data to separate drug premiumsfrom overall insurance premiums. In fact, in many cases, calculating truly separatedrug premiums would be impossible even with complete information. In many benefitpackages, prescription drugs are considered a key piece, and the interactions withother benefits make it difficult to separate the incremental cost of a drug benefit fromthe package as a whole.4 Moreover, the insurance that these premiums buy has a valuein and of itself, even if there is no drug utilization.
Duration of coverage
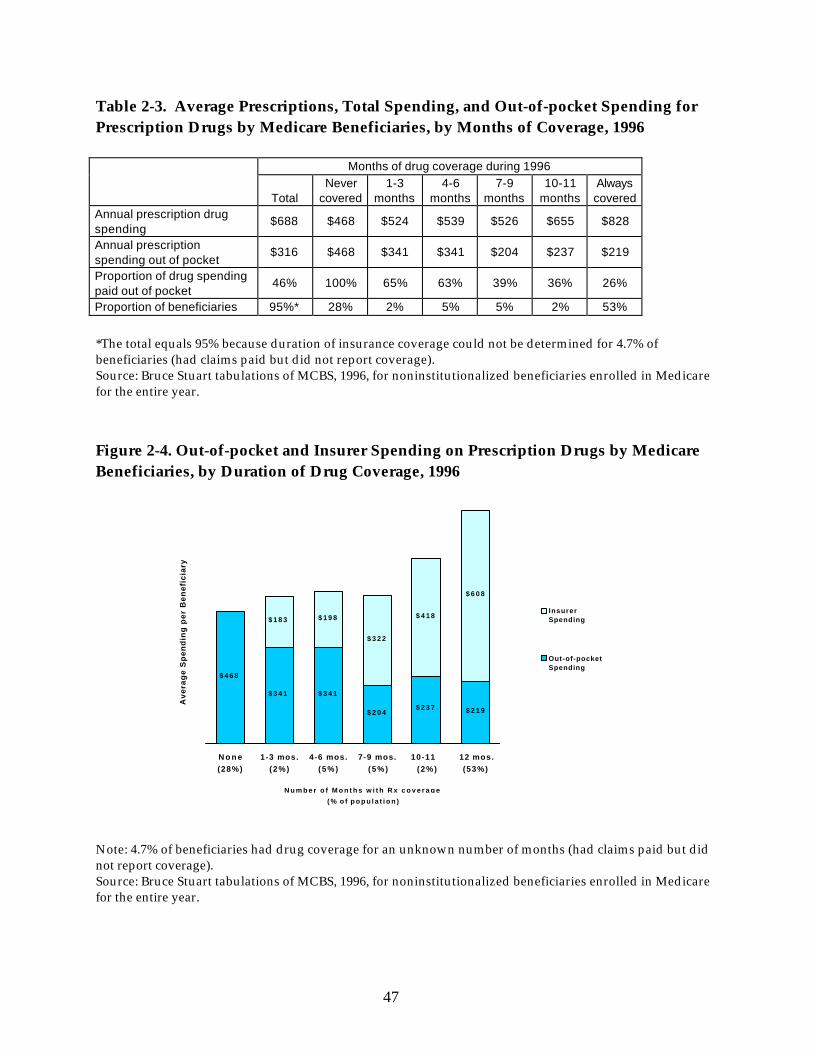
Table 2-3, drawn from an independent analysis of MCBS data by Bruce Stuart et al. forthe Commonwealth Fund, shows differences in utilization and spending for Medicarebeneficiaries who had drug coverage throughout 1996, during part of the year, or at notime during the year. It has been observed for other types of medical coverage thatpeople with part-year coverage use more services during their covered period thanpeople with full-year coverage use during a similar period; in effect, they are usingtheir coverage to deal with previously unattended problems. However, this sort ofcatch-up effect does not appear to be applicable for prescription drugs. While someonecan postpone elective surgery, for example, people who do not obtain neededmedications during a period without coverage cannot make up for this when theyobtain coverage.
Instead, it seems likely that people who have coverage for only part of a year will actlike noncovered people during their period without coverage and like other coveredpeople during their period with coverage. In fact, beneficiaries even with 7 to 9 monthsof coverage spend only 12 percent ($58) more than beneficiaries who are uncovered allyear. Table 2-3 and Figure 2-4 show that the more substantial increase in utilizationoccurs when a beneficiary has drug coverage for at least 10 months.
4 In some cases, people with supplemental insurance may even be paying premiums for the addition of adrug benefit that cost more on average than the maximum value of the drug benefit.
47
Table 2-3. Average Prescriptions, Total Spending, and Out-of-pocket Spending forPrescription Drugs by Medicare Beneficiaries, by Months of Coverage, 1996
Months of drug coverage during 1996
TotalNever
covered1-3
months4-6
months7-9
months10-11
monthsAlwayscovered
Annual prescription drugspending
$688 $468 $524 $539 $526 $655 $828
Annual prescriptionspending out of pocket
$316 $468 $341 $341 $204 $237 $219
Proportion of drug spendingpaid out of pocket
46% 100% 65% 63% 39% 36% 26%
Proportion of beneficiaries 95%* 28% 2% 5% 5% 2% 53%
*The total equals 95% because duration of insurance coverage could not be determined for 4.7% ofbeneficiaries (had claims paid but did not report coverage).Source: Bruce Stuart tabulations of MCBS, 1996, for noninstitutionalized beneficiaries enrolled in Medicarefor the entire year.
Figure 2-4. Out-of-pocket and Insurer Spending on Prescription Drugs by MedicareBeneficiaries, by Duration of Drug Coverage, 1996
Note: 4.7% of beneficiaries had drug coverage for an unknown number of months (had claims paid but didnot report coverage).Source: Bruce Stuart tabulations of MCBS, 1996, for noninstitutionalized beneficiaries enrolled in Medicarefor the entire year.
$ 4 6 8
$ 3 4 1 $ 3 4 1
$ 2 0 4$ 2 3 7 $ 2 1 9
$ 1 8 3 $ 1 9 8
$ 3 2 2
$ 4 1 8
$ 6 0 8
N o n e(28%)
1-3 mos.(2%)
4-6 mos.(5%)
7-9 mos.(5%)
10-11 (2%)
12 mos.(53%)
N u m b e r o f M o n t h s w i t h R x c o v e r a g e
( % o f p o p u l a t i o n )
Av
era
ge
Sp
en
din
g p
er
Be
ne
fic
iary
InsurerSpending
Out-of-pocketSpending

48
Much of the MCBS data presented elsewhere in this report, and all the MEPS data, treatindividuals as having drug coverage if they have coverage at any time during the year.Because people with part-year coverage have lower utilization and spending thanthose with full-year coverage, their inclusion lowers the averages for the coveredgroup. As a result, the real differences between people who do and do not havecoverage at a given point in time are understated throughout this report.
Source of Coverage
Table 2-4 and Figure 2-5 show that utilization and spending by Medicare beneficiariesvaries according to their primary source of supplemental coverage.5 The gaps betweenbeneficiaries with and without drug coverage also vary.
Table 2-4. Average Number of Prescriptions, Total Spending, and Out-of-pocketSpending for Prescription Drugs by Medicare Beneficiaries with and without DrugCoverage, by Primary Source of Supplemental Coverage, 1996
Covered Not covered Ratio, covered/not covered
Source ofcoverage
Averagenumber of
prescriptions
Averagetotal
spending
Averageout-of-pocket
spending
Out-of-pocketas % of
totalspending
Averagenumber of
prescriptions
Averagetotal
spending(all out-of-
pocket)
Averagenumber of
prescriptions
Averagetotal
spending
Averageout-of-pocket
spending
TOTAL 21.14 $768.90
$252.65 33% 16.01 $463.15 1.32 1.66 0.55
Risk HMO 17.43 $573.02
$188.90 33% * $151.33 * 3.79 1.25
Medicaid 28.50 $882.13
$177.57 20% 14.95 $380.05 1.91 2.32 0.47
EmployerSponsored
19.07 $805.89
$238.72 30% 17.42 $530.03 1.10 1.52 0.45
IndividuallyPurchased
20.78 $711.28
$416.41 58% 17.61 $524.70 1.18 1.36 0.79
Other 27.43 $790.96
$292.71 37% 17.87 $543.66 1.53 1.45 0.54
MedicareOnly
12.39 $326.65
* Sample size is too small to produce a reliable estimate.Source: Information and Methods Group, Office of Strategic Planning, Health Care FinancingAdministration: Medicare Current Beneficiary Survey Cost and Use File, 1996.
5 Note that not every beneficiary with drug coverage obtained that coverage through the same source thatprovided his or her primary Medicare supplemental coverage.

49
Among beneficiaries with drug coverage, both total spending and the proportion thatbeneficiaries pay out-of-pocket vary by type of insurance. Beneficiaries who haveindividually purchased (mostly Medigap) insurance pay a higher proportion of theirdrug costs than any other covered group and have relatively low total spendingcompared to other coverage groups. Beneficiaries enrolled in Medicaid who have drugcoverage have the highest utilization and spending and the lowest out-of-pocket costsof any covered group.6
Figure 2-5. Out-of-pocket and Insurer Spending on Prescription Drugs by MedicareBeneficiaries, by Type of Drug Coverage, 1996
Source: Information and Methods Group, Office of Strategic Planning, Health Care FinancingAdministration: Medicare Current Beneficiary Survey Cost and Use File, 1996.
With few exceptions, Medicare beneficiaries with drug coverage had moreprescriptions, higher spending, and lower out-of-pocket costs than those without drugcoverage as a whole and within each coverage group.7
6 However, Medicaid beneficiaries’ spending, utilization, and out-of-pocket spending is not significantlydifferent from the next closest group in each case: their spending is only different from spending by thosewith employer-sponsored coverage on a one-tail test, their utilization is not significantly different frombeneficiaries with other public insurance, and their out-of-pocket spending is not significantly differentfrom beneficiaries enrolled in an HMO.
7 Differences among beneficiaries enrolled in Medicare HMOs are not statistically significant, primarilybecause of the small number of beneficiaries in HMOs without drug coverage.
$178$239
$416
$293
$384
$704 $567$295
$498
$189
$463
N o c o v e r a g e Med icare
H M O
Medica id E m p l o y e r M e d i g a p O t h e r
c o v e r a g e
Type of Prescript ion Drug Coverage
Av
era
ge
Sp
en
din
g p
er
Be
ne
fic
iary
I n s u r e rS p e n d i n g
Out-of -p o c k e tS p e n d i n g

50
• The spending differences between Medicaid beneficiaries with and without drugcoverage are dramatic. Beneficiaries who have Medicaid with drug coverage getnearly twice as many prescriptions and spend over twice as much on drugs asbeneficiaries who receive Medicaid assistance only with cost sharing orpremiums. Very low-income people who lack drug coverage may be least likelyto be able to purchase needed medications on their own.
• Beneficiaries with employer-sponsored supplemental insurance show thesmallest utilization difference between those with and without a drug benefit;the difference in the number of prescriptions per person is not statisticallysignificant. The difference in total spending is much larger, becauseprescriptions received by those with a drug benefit were 39 percent more costlythan those received by retirees without a drug benefit. Despite their higher totalspending, those with drug coverage had out-of-pocket spending less than half ofwhat uncovered beneficiaries in this group spent.
• The utilization difference for people with individually purchased coverage withand without a drug benefit is also quite small. In contrast to those withemployer-sponsored insurance, however, those with drug coverage spendnearly as much out of pocket (almost 80 percent as much) as those without it.This is partly due to the deductible and cost-sharing requirements imposed bystandard Medigap plans. On average, beneficiaries with a drug benefit andMedigap pay 58 percent of their costs out of pocket.
There are also notable differences among beneficiaries without drug coverage based onwhether they had other supplemental coverage. With the exception of beneficiaries inHMOs, people with no drug coverage but some supplemental coverage had higherspending than people who had only Medicare coverage. One possible explanation isthat people with no supplement are healthier than people who choose to obtain someform of supplemental coverage. Another possible factor is that beneficiaries without asupplement were less likely to see a physician, and hence less likely to receive aprescription. The issues of self-selection, moral hazard, and lack of access will beconsidered further below.
Income
Table 2-5 and Figure 2-6 show average prescription drug spending and average out-of-pocket spending for Medicare beneficiaries by income.8 Average spending for people
8 Income is given as a percentage of the federal poverty threshold, which differs by age and household size.For beneficiaries over 65, these calculations use a poverty threshold of $7,525 for an individual, and $9,491

51
with coverage is consistently higher than for people without coverage across incomegroups.9 It might be expected that spending differences would diminish steadily withhigher income, because higher-income people without coverage are better able to payfor drugs on their own. The difference in average spending for covered and noncoveredbeneficiaries in poverty is indeed greater than for other income groups. However,among the higher income groups, there is no significant difference in the size of thespending gap between covered and noncovered beneficiaries. This suggests thatinsurance coverage for prescription drugs matters, irrespective of income.
Table 2-5. Average Total Spending and Out-of-pocket Spendingfor Prescription Drugs by Medicare Beneficiaries with and without Drug Coverage,by Family Income as a Percent of Poverty, 1996
Covered Not Covered Ratio, Covered/Not Covered
Income as apercent ofpoverty
AverageTotal
Spending
Average Out-of-pocketSpending
Out-of-pocketas % of Total
Spending
AverageTotal
Spending(all out-of-
pocket)
AverageTotal
Spending
Average Out-of-pocketSpending
Total $769 $253 33% $463 1.66 0.55
<Poverty $800 $200 25% $368 2.18 0.54
Poverty-135% $767 $269 35% $476 1.61 0.57
136-150% $673 $272 40% $555 1.21 0.49
151-175% $790 $279 35% $453 1.74 0.62
176-200% $791 $255 32% $512 1.54 0.50
201-300% $778 $284 36% $487 1.60 0.58
301-400% $782 $264 34% $453 1.72 0.58
>400% $717 $248 35% $525 1.37 0.47
Source: Information and Methods Group, Office of Strategic Planning, Health Care FinancingAdministration: Medicare Current Beneficiary Survey Cost and Use File, 1996.
for those who lived with others. For beneficiaries under 65 they use $8,163 for an individual, and $10,564for those who lived with others.
9 In the income range between 136 percent and 150 percent of poverty, the difference in spending betweenbeneficiaries with and without coverage is not statistically significant.

52
Figure 2-6. Out-of-pocket and Insurer Spending on Prescription Drugs by MedicareBeneficiaries with and without Drug Coverage, by Income, 1996
Source: Information and Methods Group, Office of Strategic Planning, Health Care FinancingAdministration: Medicare Current Beneficiary Survey Cost and Use File, 1996.
Among covered beneficiaries, those below the poverty threshold pay the smallest shareof their own costs out of pocket. Poor beneficiaries are more likely to have drugcoverage through Medicaid, which imposes only nominal copayments. Still, even withdrug coverage, beneficiaries in poverty paid 25 percent of their own costs. This may bepartly because people are counted as covered if they have coverage for any part of theyear. The out-of-pocket costs might have been incurred by part-year eligibles during aperiod without coverage. Another possible factor is the fact that some state Medicaidprograms limit the number of prescriptions beneficiaries may receive in a given period.
Table 2-6 shows spending by income for the non-Medicare population. Again, it ishelpful to look at people who used any prescription drugs, rather than at the totalpopulation. Among users, patterns for the non-Medicare population are similar tothose shown in Table 2-5 for the Medicare population as a whole. In all income ranges,there is a difference between spending by those with coverage and those without.10
Like Medicare beneficiaries, covered non-Medicare beneficiaries pay the smallest shareof their own costs – just over a fourth – when they are in poverty. However, actual out-
10 However, the smallest difference, between users with and without coverage with incomes between 100and 200 percent of poverty, is statistically significant only on a one-tail test.
$ 2 6 8
$ 4 7 6$ 5 5 5
$ 4 8 4 $ 4 8 7 $ 4 9 4
$ 0
$ 2 0 0$ 2 6 9 $ 2 7 2 $ 2 6 7 $ 2 8 4 $ 2 5 4
$ 6 0 0$ 4 9 8
$ 4 0 1
$ 5 2 4 $ 4 9 4$ 4 8 9
$ 0
$ 2 0 0
$ 4 0 0
$ 6 0 0
$ 8 0 0
$ 1 , 0 0 0
Income as percent of poverty threshold
Av
era
ge
Sp
en
din
g p
er
Be
ne
fic
iary
I nsure r spend ing
Out -o f -pocket spending , w i th coverage
Out-of -pocket ( tota l ) spending, wi thout coverage
<100% 100-135% 136-150% 151-200% 201-300% >300%

53
of-pocket spending for drug users in this group is only $76 on average, as opposed to$200 for covered Medicare beneficiaries in poverty.
Table 2-6. Average Total Spending and Out-of-pocket Spendingfor Prescription Drugs by Non-Medicare Individuals with and without DrugCoverage, by Family Income as a Percent of Poverty, 1996
Covered Not Covered Ratio, Covered/Not Covered
Income as apercent of poverty
Averagetotal
spending
Average out-of-pocketspending
Out-of-pocketas % of total
spending
Average totalspending (allout of pocket)
Averagetotal
spending
Average out-of-pocketspending
Total non-Medicarepopulation $222.01 $80.59 36% $58.94 3.77 1.37 <Poverty $191.14 $49.64 26% $62.18 3.07 0.80 100-200% $195.96 $76.98 39% $63.45 3.09 1.21 200-400% $210.66 $79.10 38% $51.33 4.10 1.54 >400% $252.34 $93.58 37% $61.36 4.11 1.53
People usingprescription drugs $317.64 $115.30 36% $172.64 1.84 0.67 <Poverty $291.65 $75.74 26% $176.60 1.65 0.43 100-200%
$285.74 $112.26 39% $187.13 1.53 0.60 200-400% $305.98 $114.89 38% $156.70 1.95 0.73 >400% $346.89 $128.65 37% $172.10 2.02 0.75
Note: The totals include persons with negative family income.Source: Center for Cost and Financing Studies, Agency for Healthcare Research and Quality: MedicalExpenditure Panel Survey Household Component, 1996.
Health status and other health indicators
Not surprisingly, as health status worsens, beneficiaries use more drugs. However,Table 2-7 and Figure 2-7 show that while utilization rises, a gap remains betweenbeneficiaries with and without coverage. Within each health status category,beneficiaries with coverage are more likely to fill at least one prescription, and fill moreprescriptions when they do use drugs. Beneficiaries without coverage who are in fair orpoor health are as likely to fill no prescriptions as covered beneficiaries in very goodhealth.

54
Table 2-7. Medicare Beneficiaries Filling at Least One Prescription and Number ofPrescriptions Filled, by Drug Coverage and Self-Reported Health Status, 1996
% filling at least one prescription Number of prescriptions filled by users
Covered Not covered Covered Not covered
Ratio,covered/
not coveredExcellent 80% 67% 13.76 11.42 1.20Very Good 86% 79% 17.18 15.45 1.11Good 92% 84% 22.40 20.36 1.10Fair 96% 86% 33.22 26.44 1.26Poor 96% 86% 39.67 31.43 1.26
Source: Information and Methods Group, Office of Strategic Planning, Health Care FinancingAdministration: Medicare Current Beneficiary Survey Cost and Use File, 1996.
Figure 2-7. Percentage of Medicare Beneficiaries with and without Drug CoverageFilling at Least One Prescription, by Health Status, 1996
Source: Information and Methods Group, Office of Strategic Planning, Health Care FinancingAdministration: Medicare Current Beneficiary Survey Cost and Use File, 1996.
Table 2-8 and Figure 2-8 show that spending follows the utilization pattern: asMedicare beneficiaries report poorer health, their spending on prescription drugsincreases. Again, within each health status category, beneficiaries with drug coveragehave higher spending than the noncovered. Spending for beneficiaries in poor healthwho had drug coverage was $590 more than for those who lacked coverage; forbeneficiaries with fair health, the difference was $480. Beneficiaries spent nearly twiceas much out of pocket as those who had coverage unless they were in excellent health.
67%
86%
80%
86%
92%
96% 96%
79%
84%86%
E x c e l l e n t V e r y G o o d G o o d F a i r P o o r
Self - reported heal th status
Ben
efic
iari
es F
illi
ng
An
y P
resc
rip
tio
n
Uncovered
Covered

55
Table 2-8. Average Total Spending and Out-of-pocket Spending for PrescriptionDrugs by Medicare Beneficiaries with and without Drug Coverage, by Self-ReportedHealth Status, 1996
CoveredNot Covered
Ratio, Covered/Not Covered
Self-reportedhealth status
Averagetotal
spending
Average out-of-pocketspending
Out-of-pocketas % of total
spending
Average totalspending (allout-of-pocket) Average total
spending
Average out-of-pocketspending
Total $769 $253 33% $463 1.66 0.55Excellent $414 $141 34% $207 2.01 0.68
Very Good $554 $190 34% $382 1.45 0.50
Good $759 $256 34% $497 1.53 0.51
Fair $1,120 $350 31% $640 1.75 0.55
Poor $1,340 $423 32% $749 1.79 0.56
Source: Information and Methods Group, Office of Strategic Planning, Health Care FinancingAdministration: Medicare Current Beneficiary Survey Cost and Use File, 1996.
Figure 2-8. Out-of-pocket and Insurer Spending for Medicare Beneficiaries with andwithout Drug Coverage, by Health Status, 1996
Source: Information and Methods Group, Office of Strategic Planning, Health Care FinancingAdministration: Medicare Current Beneficiary Survey Cost and Use File, 1996.
$ 2 0 7
$ 3 8 2
$ 4 9 7
$ 6 4 0
$ 7 4 9
$ 1 4 1 $ 1 9 0$ 2 5 6
$ 3 5 0$ 4 2 3
$ 2 7 3
$ 3 6 4
$ 5 0 3
$ 7 7 0
$ 9 1 7
$0
$300
$600
$900
$1,200
$1,500
Sel f - reported Heal th Status
Ave
rag
e S
pen
din
g p
er B
enef
icia
ry
I n s u r e r s p e n d i n g
Out -o f -pocket , covered
Out -o f -pocke t , uncovered
Excellent Very Good Good Fair Poor

56
Table 2-9 shows that the same patterns are reinforced when beneficiaries are splitaccording to the duration of their drug coverage. Beneficiaries who always had drugcoverage had nearly twice the spending of beneficiaries who never had drug coverageat any time during the year, regardless of health status. Those in fair or poor healthwho were covered for only part of the year had total spending slightly closer to thosewho never had coverage.
Table 2-9. Average Total Spending and Out-of-pocket Spendingfor Prescription Drugs by Medicare Beneficiaries by Duration of Drug Coverage andSelf-Reported Health Status, 1996
Always Covered Sometimes CoveredNever
Covered
Self-reportedhealth status
Averagetotal
spending
Averageout-of-pocket
spending
Out-of-pocket as% of totalspending
Averagetotal
spending
Averageout-of-pocket
spending
Out-of-pocket as% of totalspending
Averagetotal
spending(all out-of-
pocket)Total $828 $219 26% $626 $358 57% $468
Excellent/Good $655 $184 28% $480 $282 59% $386
Fair/Poor $1,327 $318 24% $1,003 $552 55% $732
Source: Bruce Stuart, Dennis Shea, and Becky Briesacher, “Prescription Drug Costs for MedicareBeneficiaries: Coverage and Health Status Matter,” New York, Commonwealth Fund Issue Brief, January2000.
That spending and utilization differences persist across different health statusessuggests that the overall difference in spending for covered and noncovered peoplecannot simply be attributed to different levels of need for prescription drugs betweenthose with and without drug coverage. However, self-reported health status is notnecessarily a good indicator of relative need for drugs or other health services. Table 2-10 uses three other indicators to compare spending by covered and noncoveredMedicare beneficiaries: number of chronic conditions, number of functional limitations,and use of inpatient services during the year.

57
Table 2-10. Average Total Spending and Out-of-pocket Spendingfor Prescription Drugs by Medicare Beneficiaries with and without Drug Coverage,by Other Indicators of Health Status, 1996
Covered Not covered Ratio, covered/not covered
Averagetotal
spending
Average out-of-pocketSpending
Out-of-pocket as% of totalspending
Average totalspending (allout-of-pocket)
Averagetotal
spending
Average Out-of-pocketSpending
Total $769 $253 33% $463 1.66 0.55
ChronicConditions0 $222 $83 37% $148 1.50 0.56
1-2 $600 $191 32% $342 1.76 0.56
3-4 $932 $325 35% $617 1.51 0.53
5+ $1,401 $412 29% $944 1.48 0.44
Functional status
No Limitations $662 $218 33% $415 1.60 0.53
IADL Only1 $1,160 $394 34% $666 1.74 0.59
1 or 2 ADLs2 $1,051 $348 33% $582 1.80 0.60
3+ ADLs2 $1,190 $378 32% $674 1.77 0.56
Inpatient use
No admission $699 $230 33% $412 1.70 0.56
Admission $1,097 $361 33% $694 1.58 0.52
1 Beneficiaries who need assistance with one or more instrumental activities of daily living, such as mealpreparation or managing money.2 Beneficiaries who need assistance with activities of daily living, such as bathing, dressing, toileting, oreating.
Source: Information and Methods Group, Office of Strategic Planning, Health Care FinancingAdministration: Medicare Current Beneficiary Survey Cost and Use File, 1996.
On all three measures, the pattern is the same as for self-reported health status.Beneficiaries who report more chronic conditions, worse functional status, or a hospitalstay during the year spend more on drugs whether or not they have coverage. In eachcategory, beneficiaries with drug coverage spend much more than uncoveredbeneficiaries in the same category; at the same time, their out-of-pocket spending ismuch lower.
Because spending rises so dramatically with worsening health status, the dollar gapsbetween the covered and the noncovered rise with poorer health. For example, amongbeneficiaries with five or more chronic conditions, those with coverage had averagetotal spending $457 higher than that for beneficiaries without coverage, while the

58
difference for beneficiaries with no chronic conditions was only $74. Out of pocketspending for uncovered beneficiaries with five or more chronic conditions was $532higher than for those with coverage. Drug insurance clearly makes an importantdifference for people with severe health problems.
Table 2-11 provides MEPS data for the total population (including people with andwithout Medicare) by self-reported health status. The figures include only people whoused any prescription drugs. Again, spending rises with poorer health status for boththe covered and the noncovered population,11 and the dollar difference in spending isgreatest for those in poor health.12
Table 2-11. Average Number of Prescriptions and Average Total Spendingfor Prescription Drugs by Prescription Drug Users with and without Drug Coverage,by Self-Reported Health Status, 1996
Covered Not covered Ratio, covered/not covered
Averagenumber of
prescriptions
Averageannual
spending
Averagenumber of
prescriptions
Averageannual
spending
Averagenumber of
prescriptions
Average annualspending
TOTAL 12.59 $427.75 8.77 $269.04 1.43 1.59
Excellent 6.00 $175.75 4.34 $144.38 1.38 1.22
Very good 10.22 $339.21 7.66 $220.50 1.33 1.54
Good 14.59 $528.28 8.09 $221.31 1.80 2.39
Fair 25.11 $875.10 16.80 $584.61 1.49 1.50
Poor 37.86 $1,309.97 25.80 $793.25 1.47 1.65
Source: Center for Cost and Financing Studies, Agency for Healthcare Research and Quality: MedicalExpenditure Panel Survey Household Component, 1996.
Age
Table 2-12 and Figure 2-9 show data on spending for prescription drugs by age. Thereis a notable difference between elderly and non-elderly Medicare beneficiaries. Non-elderly Medicare beneficiaries qualify for the program on the basis of disability or endstage renal disease, and thus may be more likely to need prescription drugs. Thespending gap between covered and noncovered beneficiaries is largest for nonelderlybeneficiaries, particularly those under 45. Nonelderly beneficiaries with drug coverage
11 For persons without coverage, the difference in spending between those with good health status and thosewith very good health status is not statistically significant, nor is the difference between persons with fairhealth and those with poor health.
12 Among beneficiaries with the same health status, the spending difference between those with and withoutcoverage is statistically significant for all beneficiaries except those in excellent health.

59
spend much more than elderly beneficiaries with drug coverage; beneficiaries under 45without coverage spend much less than elderly noncovered beneficiaries.
Table 2-12. Average Total Spending and Out-of-pocket Spendingfor Prescription Drugs by Medicare Beneficiaries with and without Drug Coverage,by Age, 1996
Covered Not covered Ratio, covered/not covered
Age
Averagetotal
spending
Average out-of-pocketSpending
Out-of-pocketas % of total
spending
Average totalspending (allout-of-pocket)
Averagetotal
spending
Average Out-of-pocketSpending
Total $769 $253 33% $463 1.66 0.55
0-44 $1,077 $241 22% $268 4.01 0.90
45-64 $1,300 $347 27% $588 2.21 0.59
65-69 $662 $218 33% $395 1.68 0.55
70-74 $692 $229 33% $483 1.43 0.47
75-79 $762 $276 36% $461 1.65 0.60
80-84 $743 $264 36% $519 1.43 0.51
85+ $708 $280 40% $487 1.45 0.58
Source: Information and Methods Group, Office of Strategic Planning, Health Care FinancingAdministration: Medicare Current Beneficiary Survey Cost and Use File, 1996.
Figure 2-9. Out-of-pocket and Insurer Spending for Medicare Beneficiaries with andwithout Drug Coverage, by Age, 1996
Source: Information and Methods Group, Office of Strategic Planning, Health Care FinancingAdministration: Medicare Current Beneficiary Survey Cost and Use File, 1996.
$ 4 7 4$ 3 9 5
$ 4 8 3 $ 4 6 1$ 5 1 9 $ 4 8 7
$ 3 1 2$ 2 1 8 $ 2 2 9
$ 2 7 6 $ 2 6 4 $ 2 8 0
$ 9 1 4
$ 4 4 4 $ 4 6 3$ 4 8 6 $ 4 7 9 $ 4 2 8
$ 0
$300
$600
$900
$1 ,200
$1 ,500
A g e
Av
era
ge
Sp
en
din
g p
er
Be
ne
fic
iary
I n s u r e r s p e n d i n gO u t - o f - p o c k e t , c o v e r e dO u t - o f - p o c k e t , u n c o v e r e d
0-64 65-69 70-74 75-79 80-84 85+

60
Among elderly beneficiaries, spending by those with coverage rises with age, exceptthat it drops slightly for those aged 80 and older.13 This may be because the sickestamong the oldest beneficiaries are likely to be in institutions and are therefore omittedfrom the data. A similar, but slightly less clear, pattern is present for the elderlywithout coverage. The gap between those with and without coverage persists, but doesnot seem to follow any pattern as beneficiaries age.
Race
Table 2-13 shows spending by covered and noncovered beneficiaries by race. AmongMedicare beneficiaries, average spending by people with coverage is slightly higher forwhites than for blacks or people of other races, but the difference in spending for thecovered and the noncovered is slightly greater for nonwhites. However, thesedifferences are not statistically significant. Multivariate analysis would be needed todetermine the extent to which any spending differences by race are associated withother factors, such as income, health status, or source of coverage.
Table 2-13. Average Total Spending and Out-of-pocket Spendingfor Prescription Drugs by Medicare Beneficiaries with and without Drug Coverage,by Race/Ethnicity, 1996
Covered Not covered Ratio, covered/not covered
Race/ethnicity
Averagetotal
spending
Average out-of-pocketSpending
Out-of-pocketas % of total
spending
Average totalspending (allout-of-pocket)
Averagetotal
spending
Average Out-of-pocketSpending
Total $769 $253 33% $463 1.66 0.55
White $781 $263 34% $478 1.63 0.55
Black $699 $199 28% $369 1.90 0.54
Other $699 $192 27% $330 2.12 0.58
Note: “Other” includes Asian, Hispanic, and North American Native.Source: Information and Methods Group, Office of Strategic Planning, Health Care FinancingAdministration: Medicare Current Beneficiary Survey Cost and Use File, 1996.
DISTRIBUTION OF SPENDING
Table 2-14 and Figure 2-10 show the distribution of spending by beneficiaries with andwithout drug coverage in 1996. Only 4 percent of Medicare beneficiaries accounted foralmost a quarter of all beneficiaries’ drug spending in 1996, and the top third ofbeneficiaries spent three-fourths of the total spent on drugs. The distribution of
13 The difference between spending by covered beneficiaries aged 65 to 69 and those aged 85 and over is notstatistically significant.

61
spending is different for covered beneficiaries compared to those without coverage.Compared to beneficiaries with coverage, those without coverage were almost twice aslikely to spend nothing, and about half as likely to spend over $1,000.
Table 2-14. Distribution of Medicare Beneficiaries with and without Drug Coverageby Amount of Prescription Drug Spending, 1996
Percent of population Percent of SpendingSpending onPrescription Drugs Total Covered Not covered Total Covered Not covered
Total 100% 100% 100% 100% 100% 100%
No Spending on Drugs 13% 11% 20% 0% 0% 0%
$1 – 249 27% 26% 29% 4% 4% 6%
$250 – 499 17% 16% 19% 9% 8% 15%
$500 – 749 12% 12% 11% 11% 10% 15%
$750 – 999 9% 9% 8% 11% 10% 15%
$1,000 - 1,249 6% 6% 4% 9% 9% 9%
$1,250 - 1,499 4% 5% 3% 8% 8% 8%
$1,500 - 1,749 3% 3% 2% 6% 7% 5%
$1,750 - 1,999 2% 3% 2% 7% 7% 8%
$2000 - 2,499 3% 3% 2% 9% 10% 7%
$2,500+ 4% 5% 1% 24% 28% 10%
Source: Information and Methods Group, Office of Strategic Planning, Health Care FinancingAdministration: Medicare Current Beneficiary Survey Cost and Use File, 1996.

62
Figure 2-10. Distribution of Medicare Beneficiaries and Prescription DrugExpenditures by Amount of Spending, 1996
Source: Information and Methods Group, Office of Strategic Planning, Health Care FinancingAdministration: Medicare Current Beneficiary Survey Cost and Use File, 1996.
Tables 2-15 through 2-17 provide a fuller picture of the characteristics of the subset ofMedicare beneficiaries with the highest spending. They compare the 20 percent of thepopulation with the highest spending (those with annual expenditures over $1,066)with the total population. The top 20 percent group is referred to as the “highest drugspenders” in these tables. Overall, 24 percent of covered beneficiaries fell into thisgroup, and 12 percent of noncovered beneficiaries. Of the high spenders, 82 percenthad drug coverage, compared to 69 percent of all beneficiaries.
The data show that, in general, the differences explored in this report betweenMedicare beneficiaries with and without drug coverage do not appear to be driven byhigh spenders. In other words, the gaps in spending and utilization between Medicarebeneficiaries with and without drug coverage do not appear to result because ofunique characteristics of those with higher spending. Differences in source ofsupplemental coverage for high spenders with and without drug coverage mirror thedifferences seen between all beneficiaries with and without drug coverage, as shown inTable 2-15. Overall, the highest spenders are more likely to have employer basedinsurance or Medicaid, and less likely to have individually purchased insurance or bein a risk HMO.
2 7
3 8
3 1
1 8
3 9
2 4
4
4
Percent of Benef ic iar ies Percent of Tota lExpenditures
O v e r $ 2 5 0 0
$ 1 0 0 0 - 2 4 9 9
$ 2 5 0 - 9 9 9
$ 1 - 2 4 9
N o s p e n d i n g
13

63
Table 2-15. Medicare Beneficiaries with and without Drug Coverage, as Share ofTotal Population and Share of the Highest Drug Spenders, by Primary Source ofSupplemental Coverage, 1996
Covered Not covered Total
PrimaryMedicaresupplement
Percent of allbeneficiaries
Percent ofhighest drug
spendersPercent of allbeneficiaries
Percent ofhighest drug
spendersPercent of allbeneficiaries
Percent ofhighest drug
spenders
TOTAL 100% 100% 100% 100% 100% 100%
Risk 15% 10% 2% * 11% 8%
Medicaid 17% 19% 4% 5% 13% 17%
EmployerSponsored
47% 50% 13% 18% 36% 44%
IndividuallyPurchased
16% 16% 54% 61% 28% 24%
Other 5% 5% 2% * 4% 5%
FFS Medicare 0% 0% 25% 14% 8% 3%
*Less than 1 percent; sample is too small to produce a stable estimate.Source: Information and Methods Group, Office of Strategic Planning, Health Care FinancingAdministration: Medicare Current Beneficiary Survey Cost and Use File, 1996.
For the demographic characteristics shown in Table 2-16, the highest spenders do notdiffer very much from the general Medicare population. Across the total populationwith and without drug coverage, high spenders’ income distribution is similar; so istheir age distribution, except that high spenders are slightly more likely to benonelderly. Their distribution by race, sex, and metropolitan residence is alsocomparable. Within both the covered and the non-covered categories, the highestspenders are also similar to the general population of Medicare beneficiaries, exceptthat people without coverage who are below poverty are less likely to be highspenders. This suggests that beneficiaries in all income and socioeconomic groups areat risk of having high drug spending, but that both health status and drug coverage caninfluence that spending.
In contrast, as might be expected, the highest spenders tend to have poorer health thanother Medicare beneficiaries, as measured by each of the indicators used. Table 2-17shows that these beneficiaries are more likely to report poorer health status, multiplechronic conditions, and more functional limitations, and they are more likely to havehad an inpatient admission. This is true for beneficiaries with and without coverage.

64
Table 2-16. Medicare Beneficiaries with and without Drug Coverage, as Share ofTotal Population and Share of the Highest Drug Spenders, by Selected DemographicCharacteristics, 1996
Covered Not covered Total
Percentof all
beneficiaries
Percent ofhighest
drugspenders
Percentof all
beneficiaries
Percent ofhighest
drugspenders
Percentof all
beneficiaries
Percent ofhighest drug
spenders
Total 100% 100% 100% 100% 100% 100%
Poverty/Income
<Poverty 21% 22% 23% 18% 22% 22%
Poverty-135% 11% 11% 15% 17% 12% 12%
136-150% 4% 3% 6% 7% 5% 4%
151-175% 7% 7% 8% 7% 7% 7%
176-200% 7% 8% 9% 9% 8% 8%
201-300% 20% 21% 19% 20% 20% 21%
301-400% 12% 12% 9% 9% 11% 12%
>400% 17% 16% 12% 13% 16% 16%
Age
0-44 4% 5% 4% 2% 4% 5%
45-64 8% 13% 7% 11% 8% 13%
65-69 27% 23% 23% 18% 25% 22%
70-74 24% 21% 23% 23% 23% 21%
75-79 18% 18% 19% 17% 18% 18%
80-84 12% 12% 14% 16% 12% 13%
85+ 8% 8% 11% 12% 9% 8%
Sex
Male 45% 40% 42% 39% 44% 40%
Female 55% 60% 58% 61% 56% 60%
Race
White 85% 88% 88% 92% 86% 88%
Black 9% 8% 9% 6% 9% 8%
Other 6% 4% 4% 2% 5% 4%
Metro status
Metro 78% 77% 64% 62% 73% 74%
Nonmetro 22% 23% 36% 38% 26% 25%
Source: Information and Methods Group, Office of Strategic Planning, Health Care FinancingAdministration: Medicare Current Beneficiary Survey Cost and Use File, 1996.

65
Table 2-17. Medicare Beneficiaries Reporting Selected Measures of Health Status, asShare of Total Population and Share of the Highest Drug Spenders, by DrugCoverage, 1996
Covered Not covered Total
Percent of allbeneficiaries
Percent ofhighest drug
spendersPercent of allbeneficiaries
Percent ofhighest drug
spendersPercent of allbeneficiaries
Percent ofhighest drug
spenders
Health Status
Excellent 16% 7% 17% 3% 17% 6%
Very Good 26% 17% 27% 17% 27% 17%
Good 30% 30% 30% 32% 30% 30%
Fair 18% 28% 17% 31% 17% 28%
Poor 10% 18% 9% 17% 9% 18%
FunctionalStatusNo Limitations 76% 65% 77% 63% 77% 64%
IADL Only 4% 8% 4% 8% 4% 8%
1 or 2 ADLs 12% 16% 12% 17% 12% 17%
3+ ADLs 7% 11% 7% 12% 7% 11%
ChronicConditions0 9% 2% 11% 2% 10% 2%
1-2 44% 30% 46% 26% 45% 30%
3-4 36% 45% 34% 50% 35% 46%
5+ 11% 22% 8% 21% 10% 22%
Inpatient Stay
No 82% 74% 82% 67% 82% 73%
Yes 18% 26% 18% 33% 18% 27%
Source: Information and Methods Group, Office of Strategic Planning, Health Care FinancingAdministration: Medicare Current Beneficiary Survey Cost and Use File, 1996.
The distribution of drug spending is even more concentrated for the non-Medicarepopulation. Table 2-18 shows the distribution for the non-Medicare population in threecoverage groups: coverage other than Medicaid, Medicaid, and no coverage. Thehighest spenders account for much of the spending in each category. Amongindividuals with Medicaid or with other drug coverage, the top 5 percent account forover half of total spending. The top 5 percent of individuals without drug coverageaccount for almost three-quarters of total spending for people without drug coverage.People with Medicaid are somewhat more likely than people with other coverage tohave had no drug spending during the year, while people without coverage are muchmore likely to have had no drug spending.

66
Table 2-18. Distribution of Non-Medicare Individuals with and without DrugCoverage by Amount of Prescription Drug Spending, 1996
Percent of population Percent of total spendingAmount ofprescriptiondrugspending Covered Medicaid Not covered Covered Medicaid Not coveredTotal 100% 100% 100% 100% 100% 100%$0 29% 36% 66% 0% 0% 0%$1-250 51% 50% 29% 16% 16% 27%$250-500 9% 4% 2% 14% 8% 13%$500-1,000 6% 4% 2% 19% 17% 18%$1,000 -2,000 3% 3% 1% 20% 24% 19%$2,000+ 2% 2% <1% 32% 34% 24%
Note: The total includes persons with negative family income. Percents may not add to 100 because ofrounding.Source: Center for Cost and Financing Studies, Agency for Healthcare Research and Quality: MedicalExpenditure Panel Survey Household Component, 1996.
EXPLAINING UTILIZATION AND SPENDING DIFFERENCES
There are a number of reasons why people with prescription drug coverage might havehigher utilization and spending than people without coverage:
• People who anticipate large drug expenditures might be more likely to seek drugcoverage than people who do not expect to spend much on drugs. Thisphenomenon is known as adverse selection or self-selection.
• More prescriptions, or prescriptions for more costly drugs, might be written forpeople with coverage. This could be because physicians consider a patient’scoverage when deciding on appropriate treatment. People with coverage may alsobe more likely to request drug therapies, especially more costly therapies. Higherdemand by the consumer in these situations is also known as moral hazard.
• People without coverage may be less likely to fill the prescriptions they receive, orthey may make a prescription last longer by not taking the recommended dosage.Those who have no health insurance at all (a large share of the nonelderly withoutdrug coverage) may never visit a physician to obtain a prescription in the first place.These problems will be referred to here as lack of access.
All of these factors probably play a part in the observed utilization and expendituredifferences. They are notoriously difficult to disentangle, both for drugs and formedical care in general. Distinguishing between self-selection, moral hazard, and lack

67
of access requires information about the relative quantity of drugs actually needed bypeople with and without coverage. This would require a much higher level of clinicaldetail than is available in the data used for this report. Some factors will be presentedhere to highlight fruitful areas for further analysis, not necessarily to resolve the issues.The emphasis will be on the Medicare population.
Adverse Selection
People without Medicare may decide whether or not to obtain health insurance, andanticipated need is certainly a factor in this choice. However, most non-Medicareindividuals do not make a separate decision about whether to obtain coveragespecifically for prescription drugs. The vast majority who have insurance are coveredthrough employer plans or Medicaid programs and automatically receive whateverlevel of drug coverage their insurance provides. The primary exceptions are peoplewhose employers offer cafeteria plans where drugs are an option, and people who havea choice of benefit packages when they seek out individual policies.
The story is similar for those Medicare beneficiaries who have employer-basedcoverage or Medicaid: they often do not control whether or not drugs are a part of theirbenefit package. However, a larger proportion of Medicare beneficiaries do not haveaccess to these two sources of coverage. These beneficiaries must decide whether toobtain coverage to supplement their Medicare benefits, and whether that supplementalcoverage should include drugs. It would be reasonable to expect that this decisionwould be influenced by the amount of health and drug spending that the beneficiaryexpects to incur. However, as Chapter 1 discussed, Medigap rules may make coveragemore difficult to obtain for those in poor health. It is also likely that many Medicarebeneficiaries who choose to buy supplemental coverage that includes drug coveragedo so because they want to insure against the possibility of having high costs, notbecause they already know that their costs will be high.
Research to date has not focused specifically on the question of adverse selection intoprescription coverage by Medicare beneficiaries. There is, however, a substantial bodyof research on selection into Medicare supplemental policies independent of drugcoverage. Recent studies of Medicare HMO enrollment find strong evidence offavorable rather than adverse selection – that is, that enrollees in Medicare HMOs areactually healthier than average.14 Indications of adverse selection in the Medigapmarket have been found by some researchers but not others.15 Most researchers assume 14 Hellinger (1995), PPRC (1996), Riley (1996), Hamilton (1999), and Call et al (1999); see bibliography inAppendix A for detailed citations.
15 Ettner (1997), Wolfe and Goddeeris (1991), and Atherly (1999) found evidence of selection. Cartwright,Hu, and Huang (1992), Hurd and McGarry (1997), and Lillard et al. (1999) did not. See bibliography inAppendix A for detailed citations.

68
that there is no selection into retiree plans given the nature of plan sponsorship, butone recent work finds evidence of adverse selection in this market.16 These thoroughlymixed findings do little to clarify the issue of possible adverse selection intoprescription drug coverage.
As Chapter 1 showed (see Tables 1-8 through 1-11), Medicare beneficiaries are slightlymore likely to have coverage if they report poorer health status or more chronicconditions, but many of the differences are not statistically significant. Further analysisis needed to explore whether there is evidence of adverse selection when controllingfor other factors.
Given the small differences in health status between beneficiaries with and withoutcoverage, the spending differences between the covered and noncovered cannot beexplained by assuming that sick people obtain coverage and healthy people forgo it.Furthermore, data presented earlier in this chapter in Tables 2-7 through 2-11 indicatepoor health does not appear to explain the significant differences in utilization andspending among the covered and uncovered.17 This suggests that other factors, such ashigher demand by those with coverage and lack of access by those without coverage,are also at work.
Moral Hazard and Barriers to Access
The RAND Health Insurance Experiment of the late 1970’s and early 1980’s found thateven in the absence of adverse selection, insurance can lead to higher rates of use.18 Inthe experiment, higher cost-sharing deterred people from obtaining both necessary andunnecessary care.19 Several studies focusing on drug use by Medicare beneficiariesreach the same basic conclusion — drug coverage increases the probability of drug use. 16 Atherly, A. (1999). “The Effect of Medicare Supplemental Insurance on Medicare Expenditures.”Department of Health Policy and Management. School of Public Health. Emory University. Atlanta, GA.Unpublished Paper.
17None of the measures used are direct indicators of the need for prescription drugs. However, that drugspending rises with deteriorating health for both covered and noncovered people suggests that themeasures are at least strongly correlated with prescription drug need.
18The experimental design allowed researchers to eliminate the effects of self-selection by randomlyassigning participants to plans that required various levels of copayment, ranging from full first-dollarcoverage to 95 percent coinsurance (to simulate non-coverage).
19 Brook, Robert, et al., “Does Free Care Improve Adults’ Health? Results from a Randomized ControlledTrial,” NEJM, 309 (23), Dec. 8, 1983, 1426-1434; Lohr, Kathleen, et al., “Use of Medical Care in the RANDHealth Insurance Experiment: Diagnosis and Service-Specific Analyses in a Randomized Controlled Trial,”Medical Care 24(9) (Supplement), Sept. 1986, S74-S77; Manning, Willard G., et al. "Health Insurance and theDemand for Medical Care: Evidence from a Randomized Experiment," American Economic Review, 77(3),June 1987, 251-277.

69
The empirical estimates of insurance effects produced by the studies vary within arelatively narrow range. The addition of drug coverage is estimated to increase theprobability of any prescription being filled by between 4 and 16 percent, depending onpopulation subgroup and generosity of drug coverage.20 In a study of Pennsylvaniaelderly, prescription coverage increased drug use by approximately 3 percent for every10 percent reduction in out-of-pocket cost to beneficiaries, all else being equal.21
It is difficult to separate whether these effects are due to higher demand by people withcoverage, or lack of access for people without coverage. If two people have similarcharacteristics, and the one with coverage receives more drugs than the one withoutcoverage, is this because the one with coverage is receiving the appropriate drugs andthe one without coverage is not? Or is it because the person with coverage isencouraged to receive excessive or unnecessary treatments and the one withoutcoverage is thriftily purchasing only the care he or she needs? Both answers could becorrect. Many people without coverage report difficulty in obtaining neededmedications; data on the extent of this problem will be presented in the next section ofthis chapter. At the same time, however, studies have shown that some elderly peoplereceive inappropriate drugs or inappropriately large dosages, with potential adverseeffects.22
CONSEQUENCES OF LACK OF DRUG COVERAGE
There are several ways to explore the burden that drug spending places on Medicarebeneficiaries without coverage as compared to those who do have coverage: drugspending as a proportion of income, drug spending as a proportion of other spending,self-reported problems in affording drugs, and self-reported differences in the mix ofdrugs used. These measures show that beneficiaries without drug coverage are likelyto have more trouble meeting their prescription drug costs, and are more likely to forgofilling a prescription as a result.
Out-Of-pocket Drug Spending and Income
20 Stuart and Grana (1998), Stuart and Zacker (1999), Ya-chen (1999), and Lillard, Rogowski, and Kingston(1999); see bibliography in Appendix A for detailed citations.
21 Coulson NE. and Stuart, BC. (1995) “Insurance Choice and the Demand for Prescription Drugs.” SouthernEconomic Journal. 61(4): 1146-1157.
22 General Accounting Office. Prescription Drugs and the Elderly: Many Still Receive Potentially Harmful DrugsDespite Recent Improvements, March 1996.

70
This report has shown that, while people without drug coverage have lower total drugspending than those with coverage, they incur higher out-of-pocket costs. Tables 2-20through 2-23 show this out-of-pocket spending as a share of income for covered andnoncovered Medicare beneficiaries, in the total population and in the 20% with thehighest spending. Among all beneficiaries, those without coverage spend over twice asmuch of their income for drugs as those with coverage (2.2 percent versus 1 percent ofincome). Among the highest spenders, the ratio is over three to one (8.1 percent versus2.6 percent of income). Within the group of high spenders, some classes ofbeneficiaries without coverage are spending a significant proportion of income(frequently over 10 percent, and sometimes over 20 percent) on out-of-pocket paymentsfor drugs.
Table 2-19 and Figure 2-11 show that at all income levels, beneficiaries with no drugcoverage spend a larger proportion of their income on out-of-pocket prescription drugcosts. Beneficiaries in the high spending group whose incomes are below the povertythreshold spend more than a quarter of their income on prescription drugs.
Table 2-19. Out-of-pocket Spending for Prescription Drugs as a Percent of Income,for all Medicare Beneficiaries and for the Highest Drug Spenders, by Income, 1996
All beneficiaries Highest drug spenders
Income Covered Not covered Covered Not covered
TOTAL 1.0% 2.2% 2.6% 8.1%
<Poverty 3.3% 5.8% 7.8% 27.8%
Poverty-135% 2.6% 4.6% 6.2% 16.5%
136-150% 2.1% 4.4% 6.3% 15.9%
151-175% 2.0% 3.1% 4.7% 12.4%
176-200% 1.5% 3.1% 3.7% 11.8%
201-300% 1.3% 2.2% 3.2% 7.7%
301-400% 0.8% 1.5% 2.1% 5.8%
>400% 0.4% 0.7% 1.0% 2.8%
Source: Information and Methods Group, Office of Strategic Planning, Health Care FinancingAdministration: Medicare Current Beneficiary Survey Cost and Use File, 1996.

71
Figure 2-11. Out-of-pocket Spending on Prescription Drugs as a Proportion ofIncome for Medicare Beneficiaries With and Without Drug Coverage, by IncomeLevel, 1996
Source: Information and Methods Group, Office of Strategic Planning, Health Care FinancingAdministration: Medicare Current Beneficiary Survey Cost and Use File, 1996.
Table 2-20 shows the relative income share by type of coverage. Shares of incomedevoted to out-of-pocket spending are quite close for beneficiaries with individuallypurchased coverage that does and does not include a drug benefit. This result isconsistent with earlier results showing that Medigap coverage tends to offer the leastprotection against drug costs. High spenders with no supplemental insurance spendalmost 12 percent of their income on prescription drugs; those who are enrolled inMedicaid but have no drug coverage spend 23 percent of their income on drugs.
5.8%
4.6%4.4%
3.2% 3.1%
2.2%
1.5%
0.8%
0.4%
0.8%
1.3%
1.5%
2.0%2.1%
2.6%
3.3%
< 1 0 0 % 1 0 0 - 1 3 5 % 1 3 6 - 1 5 0 % 1 5 1 - 1 7 5 % 1 7 6 - 2 0 0 % 2 0 1 - 3 0 0 % 3 0 1 - 4 0 0 % > 4 0 0 %
Income as percent of poverty level
Ou
t-o
f-p
ock
et s
pen
din
g a
s a
pro
po
rtio
n o
f in
com
e
U n c o v e r e d
C o v e r e d

72
Table 2-20. Out-of-pocket Spending for Prescription Drugs as a Percent of Income,for all Medicare Beneficiaries and for the Highest Drug Spenders, by Source ofSupplemental Coverage, 1996
All beneficiaries Highest drug spendersSource ofsupplementalcoverage With drug coverage
Without drugcoverage With drug coverage
Without drugcoverage
Total 1.0% 2.2% 2.6% 8.1%
Risk HMO 0.8% * 2.1% *
Medicaid 2.2% 4.3% 5.5% 23.0%
EmployerSponsored
0.7% 1.7% 1.8% 6.2%
IndividuallyPurchased
1.7% 2.2% 4.7% 7.8%
Other 1.7% 3.2% 3.8% *
FFS Medicare; nosupplement
2.4% 11.6%
*Sample size too small for a reliable estimate.Source: Information and Methods Group, Office of Strategic Planning, Health Care FinancingAdministration: Medicare Current Beneficiary Survey Cost and Use File, 1996.
Table 2-21 shows out-of-pocket spending on prescription drugs as a proportion ofincome for different demographic groups. For Medicare beneficiaries as a whole, therelative income share for the covered and noncovered is fairly constant across thesesubgroups. Those without coverage almost always spend a higher percentage of theirincome on drugs. Among the highest spenders who have no drug coverage, certaindemographic groups have extraordinarily high costs as a proportion of their income.The youngest and oldest beneficiaries in this group both spend more than 10 percent oftheir income on drugs. Non-white beneficiaries without coverage in the high spendinggroup spend over 15 percent of their income on prescription drugs.

73
Table 2-21. Out-of-pocket Spending for Prescription Drugs as a Percent of Income,for all Medicare Beneficiaries and for the Highest Drug Spenders, by SelectedDemographic Characteristics, 1996
All beneficiaries Highest drug spenders
Covered Not covered Covered Not covered
TOTAL 1.0% 2.2% 2.6% 8.1%
Age
0-44 2.0% 2.0% 4.2% 13.6%
45-64 2.0% 3.2% 3.7% 8.4%
65-69 0.7% 1.7% 2.2% 9.8%
70-74 0.8% 2.0% 2.1% 6.6%
75-79 1.1% 2.2% 2.5% 7.3%
80-84 1.3% 2.6% 2.7% 8.2%
85+ 1.3% 2.8% 3.5% 10.3%
Sex
Male 0.8% 1.8% 2.1% 6.8%
Female 1.3% 2.5% 3.0% 9.3%
Race
White 1.0% 2.1% 2.5% 7.7%
Black 1.4% 3.1% 4.1% 15.9%
Other 1.3% 2.3% 3.8% 15.4%
Metro status
Metro 0.9% 2.0% 2.3% 7.7%
NonMetro 1.4% 2.5% 3.8% 8.8%
Source: Information and Methods Group, Office of Strategic Planning, Health Care FinancingAdministration: Medicare Current Beneficiary Survey Cost and Use File, 1996.

74
Table 2-22 shows spending on drugs as a percent of income by various measures ofhealth status. Uncovered high spenders who have the worst health or functional statusor the most chronic conditions spend over a tenth of their income on prescriptiondrugs.
Table 2-22. Out-of-pocket Spending for Prescription Drugs as a Percent of Income,for all Medicare Beneficiaries and for the Highest Drug Spenders, by SelectedIndicators of Health Status, 1996
All beneficiaries Top 20% by spending
Covered Not covered Covered Not covered
Health status
Excellent 0.4% 0.9% 1.0% 7.4%
Very Good 0.7% 1.5% 1.9% 5.3%
Good 1.1% 2.6% 2.5% 7.4%
Fair 1.9% 3.7% 3.2% 9.8%
Poor 2.6% 3.9% 4.3% 12.5%
Functional status
No Limitations 0.8% 1.9% 2.1% 7.7%
IADL Only 2.2% 3.7% 3.8% *
1 or 2 ADLs 1.9% 3.2% 3.7% 8.4%
3+ ADLs 2.3% 3.6% 4.3% 12.2%
Chronicconditions0 0.3% 0.7% 3.0% 8.1%
1-2 0.7% 1.6% 2.0% 6.9%
3-4 1.4% 2.8% 2.8% 7.8%
5+ 2.0% 4.7% 3.1% 11.0%
Inpatient stay
No 0.9% 1.9% 3.0% 8.1%
Yes 1.7% 3.4% 2.3% 6.8%
*Cell size is too small to produce a reliable estimateSource: Information and Methods Group, Office of Strategic Planning, Health Care FinancingAdministration: Medicare Current Beneficiary Survey Cost and Use File, 1996.
Even some people with coverage are devoting a considerable share of their income toprescription drugs. MCBS estimates that 8 percent of beneficiaries with drug coveragehave total spending of $2,000 per year or more. Table 2-23 shows the out-of-pocketcosts that would be incurred by someone with $2,000 in spending under different typesof drug coverage. Beneficiaries with Medigap plans would pay over half this cost outof pocket.

75
Table 2-23. Illustration of Out-of-pocket Costs under Different Coverage Sources fora Beneficiary with Total Spending of $2,000
Source of drug coverage Deductible Copay Over capTotal out-of-pocket
Percentpaid out-of-pocket
HMO ($7.50 copay, $1,500 cap)1 -- $412 $88 $500 25% Medigap H/I/J ($250 deductible, $1,250or $3,000 cap, 50% coinsurance) 2
$250 $875 -- $1,125 56%
Employer ($7.50 copay)1 -- $412 -- $412 21% Medicaid ($2 copay)1 -- $110 -- $110 6% Medicare FFS only -- -- -- $2,000 100%
1 For non-Medigap plans, typical cost-sharing rules are assumed; there are plans with higher and lower costsharing. The $2,000 spending was divided by the average cost of prescriptions for Medicare beneficiarieswith drug coverage ($36.37) to generate the number of prescriptions (55) used for the examples in this table.The cap on HMO payments applies to spending by the plan.2 For Medigap plans, out-of-pocket spending in this table is calculated directly from the dollar amount ofspending ($2,000). After the beneficiary has met the $250 deductible, Plans H and I will cover 50% of $2500in total spending, for a total plan payment of $1250. Plan J will pay a total of $3000.
NOTE: This table does not attempt to account for premiums paid or the different purchasing power that$2000 might have under different discount arrangements negotiated by HMOs, employers, and Medicaid.
Table 2-24 shows data from MEPS on out-of-pocket spending as a proportion of incomefor non-Medicare beneficiaries. Overall, this group spends a lower share of theirincome on drugs than Medicare beneficiaries spend. Among all non-Medicare drugusers, those with coverage spend about half as much of their income on prescriptiondrugs as people without coverage. The difference between covered and noncoveredusers persists across all income levels.23
Table 2-24. Out-of-pocket Spending as a Percent of Income for Non-MedicareIndividuals with and without Drug Coverage, by Income Quintile, 1996
Total Population Users
Income quintile Covered Noncovered Covered Noncovered
TOTAL 0.98% 0.93% 1.41% 2.72%
20% * * * *
40% 0.41% 0.28% 0.59% 0.84%
60% 0.23% 0.15% 0.33% 0.46%
80% 0.14% 0.08% 0.19% 0.29%
100% 0.08% 0.06% 0.11% 0.14%
* Estimates are not stable.Source: Center for Cost and Financing Studies, Agency for Healthcare Research and Quality: Medical ExpenditurePanel Survey Household Component, 1996.
23 The difference between covered and noncovered users in the next to highest quintile is significant only ona one tail test.

76
Out-of-pocket Drug Spending and Other Health Spending
Spending for drugs is a substantial component of total out-of-pocket health spendingfor all ages and income levels. The following tables and charts were prepared usingthe Consumer Expenditure Survey (CEX) data prepared by the Bureau of LaborStatistics. This analysis differs in several respects from others reported in this chapter.Expenditures are for the consumer unit (basically a family or unrelated individualswho share living expenses) rather than the individual. Consumer units are groupedhere according to age of the reference person.24 A unit with an elderly reference personmay contain non-elderly individuals, and vice versa.
Table 2-25 shows the average breakdown of spending by consumer units in 1997-98.Spending for non-health necessities -- defined here as food, shelter, utilities,transportation, and clothing -- makes up a majority of total spending for all ages andincome groups.25 Out-of-pocket health spending, including insurance premiums aswell as out-of-pocket payments for drugs and other medical services and supplies, isan important component of discretionary spending (spending other than for non-healthnecessities) for all ages and incomes. Payments for over-the-counter drugs areincluded in the total for out-of-pocket health spending. As in the rest of this chapter,they are not included in spending on prescription drugs.
24 A consumer unit comprises either: (1) all members of a household who are related by blood, marriage,adoption, or other legal arrangements; (2) a person living alone, or a person sharing a household who isfinancially independent; or (3) two or more persons living together who pool their income to make jointexpenditure decisions. The reference person is the person named when the respondent is asked to "Startwith the name of the person or one of the persons who owns or rents the home." It is with respect to thisperson that the relationship of the other consumer unit members is determined.
25 Total reported spending for units with reported income below $15,000 actually exceeds $15,000. Data inthe tables are for complete income reporters. These are units that provide values for at least one of the majorsources of their income. However, even complete income reporters do not necessarily provide fullaccounting of their income. In addition, some units may spend more than their income by borrowing or byusing up assets; the latter may be more likely for the elderly.

77
Table 2-25. Components of Average Consumer Unit Spending, by Income and Ageof Reference Person, 1997-19981
Consumer units whose reference person is:Under age 65 Age 65 or over
Average expenditures perconsumer unit
Allincomes
Income<$15,0002
Income>$40,0002*
Allincomes
Income<$15,0002
Income>$40,0002
*
Total expenditures $37,306 $16,746 $53,740 $25,598 $15,999 $51,377
Spending for non-healthnecessities
$23,602 $12,184 $32,247 $15,032 $9,986 $27,573
Discretionary spending (includinghealth)3
$13,704 $4,562 $21,493 $10,566 $6,013 $23,804
Health spending4 $1,499 $703 $2,045 $2,993 $2,178 $4,210 Prescription drug spending $154 $117 $173 $516 $438 $502
Drugs as % of all spending 0.4% 0.7% 0.3% 2.0% 2.7% 1.0%Drugs as % of discretionary 1.1% 2.6% 0.8% 3.8% 5.3% 1.8%Drugs as % of health 10.2% 16.6% 8.5% 17.2% 20.1% 11.9%
* The statistics in this income group are less reliable than for other series, due to a lower sample size.1 Estimates of single-year prescription drug expenditures are unpublished data that do not meet the reliabilitystandards of published estimates. Therefore, data are presented as averages of two years to generate sufficientsample size needed to make the prescription drug estimates meet the Bureau of Labor Statistics’ reliabilitystandards.2 All income ranges are before taxes.3 Health spending is included with discretionary spending because spending for health is frequently forgoneby low income households.4 Out-of-pocket health care spending includes out of pocket insurance payments, prescription andnonprescription drug expenses, and payments for all other medical services and supplies.Source: Consumer Expenditure Survey data from the Bureau of Labor Statistics as analyzed by the Office of theActuary, HCFA.
As Figure 2-12 shows, out-of-pocket spending for prescription drugs is a largerproportion of health spending for units with an elderly reference person than for unitswith a younger reference person.26 Prescription drug spending also accounts for alarger share for people with low incomes than for people with higher incomes. For thelower income units with an elderly reference person, spending for drugs accounted for20 percent of health spending, and 5 percent of all discretionary spending.
26 Note that these figures cannot be compared to the MCBS and MEPS out-of-pocket numbers for individualsbecause the year is different, and many units have more than one individual.

78
Figure 2-12. Out-of-pocket Prescription Drug Spending as a Proportion of HealthSpending, by Age and Income, 1997-1998
Note: Expenditures are for the consumer unit and shown by the age of the reference person (see text).Source: Office of the Actuary, Health Care Financing Administration: Bureau of Labor Statistics ConsumerExpenditure Survey, 1997-1998
Because the CEX information on drug coverage is not definitive, this analysis is notable to compare spending by those with coverage to those without coverage. However,this chapter showed earlier for Medicare beneficiaries that as a percentage of income,drug spending for those without coverage was double the spending of those withcoverage (see Table 2-19). This implies that for uncovered beneficiaries, an even largerproportion of spending goes to prescription drugs than is shown here.
Table 2-26 shows changes in the components of spending for units with an elderlyreference person between 1992-93 and 1997-98. Out-of-pocket spending for drugs rosemuch more rapidly than out-of-pocket health spending. This was particularly true forlow income families. In dollar terms, out-of-pocket drug spending for higher-incomeunits increased more than for lower-income units. As a share of health spending,however, the increase was much greater for the lowest-income units: increasedspending for drugs accounted for 92 percent of the total increase in health spendingduring the period. As a result, drugs as a share of health spending rose from 16.3
16.6%
12.0%
8.5%
20.0%
18.0%
12.0%
<$15,000 $15,000-$40,000 >$40,000
Income
Pe
rce
nt
of
ou
t-o
f-p
oc
ke
t h
ea
lth
sp
en
din
g Under 65
Over 65

79
percent to 17.2 percent for all consumer units with an elderly reference person, andfrom 17.6 percent to 20.1 percent for the subset of these units with the lowest incomes.
Table 2-26. Change in Components of Average Consumer Unit Spending for Unitswith a Reference Person Age 65 or Older, 1992-1993 to 1997-19981
All income groups Income <$15,000 beforetaxes
Average expendituresper consumer unit
1992-93 1997-98 % change
1992-93 1997-98 % change
Total expenditures $21,214
$25,598 20.7% $14,054
$15,999 13.8%
Spending for non-health necessities $12,520
$15,032 20.1% $8,760 $9,986 14.0%
Discretionary spending (includinghealth)2
$8,694 $10,566 21.5% $5,294 $6,013 13.6%
Health spending3 $2,644 $2,993 13.2% $2,106 $2,178 3.4% Prescription drug spending $432 $516 19.4% $372 $438 17.9%
Drugs as % of all spending 2.0% 2.0% 2.6% 2.7%Drugs as % of discretionary 5.0% 4.9% 7.0% 7.3%Drugs as % of health 16.3% 17.2% 17.6% 20.1%
1 Estimates of single-year prescription drug expenditures are unpublished data that do not meet the reliabilitystandards of published estimates. Therefore, data are presented as averages of two years to generate sufficientsample size needed to make the prescription drug estimates meet the Bureau of Labor Statistics’ reliabilitystandards.2 Health spending is included with discretionary spending because spending for health is frequently forgoneby low income households.3 Out-of-pocket health care spending includes out of pocket insurance payments, prescription andnonprescription drug expenses, and payments for all other medical services and supplies.Source: Consumer Expenditure Survey data from the Bureau of Labor Statistics as analyzed by the Office ofthe Actuary, HCFA.
Access to Needed Drugs
Because out-of-pocket spending for prescription drugs can take up a significant shareof spending, some people may not be able to buy all of the medications they need.Data from the 1997 National Health Interview Survey confirm that, both amongMedicare beneficiaries and in the total population, people without coverage are goingwithout medications because they cannot afford them.27
27 The MCBS Access to Care component for 1996 asked whether the respondent had failed to fill one or moreprescriptions during the year, and why. By contrast, the NHIS question asks whether a respondent failed to

80
Table 2-27 shows, for the total (Medicare and non-Medicare) population, NHISestimates of people who reported that they needed prescription drugs but did not getthem because they could not afford to. These data do not necessarily reflect cases inwhich people postponed filling a prescription, purchased less than the quantityprescribed, or took the medication less often than prescribed. About 3 percent of allpeople with health insurance, and 16 percent of people without health insurance, failedto get needed prescription medicine because they could not afford it. Note that healthinsurance in this table includes insurance that does not cover prescription drugs; thusall elderly people with Medicare fall into the insured column. If data were available ondrug coverage, the differences would likely be even larger.
Table 2-27. Percent of Population Not Receiving Prescription Medicine Because ofCost, by Insurance Coverage and Selected Characteristics, 1997
Percent reporting that they needed prescription medicine in the last 12months but did not get it because they (or a parent) could not afford it
All persons With health insurance Without health insurance
Total 4.9% 3.0% 16.4%
Income (as % of Poverty)
<Poverty 11.5% 7.6% 21.0%
100-150% 11.2% 8.0% 19.2%
150-200% 7.0% 4.8% 14.9%
200-300% 5.2% 3.4% 17.0%
300-400% 2.7% 1.9% 12.2%
>400% 1.4% 0.9% 13.7%
Health Status
Excellent 2.1% 1.1% 8.9%
Very Good 3.7% 2.1% 13.7%
Good 6.9% 4.2% 19.6%
Fair 13.3% 9.2% 35.7%
Poor 21.9% 16.1% 60.5%
Source: Division of Health Interview Statistics, National Center for Health Statistics, Centers for DiseaseControl, National Health Interview Survey (NHIS), 1997.
People without insurance are consistently more likely than people with insurance toreport that they couldn’t afford needed medicines. Among the uninsured, the problemis greatest for people with low incomes and for people in poor health. Over 60 percentof uninsured people in poor health reported not getting medicines they needed.
receive a needed drug. This study does not include an analysis of the MCBS question because it does notdirectly capture people who might never have had a drug prescribed because they did not go to the doctor.

81
Table 2-28 and Figure 2-13 show the responses by more detailed insurance categoriesand income. Again, for both Medicare beneficiaries and the non-Medicare population,people without insurance and those with the lowest incomes were most likely to gowithout a prescription drug.28 About a sixth of low-income beneficiaries withoutsupplemental coverage, and just over a fifth of low-income uninsured non-Medicarebeneficiaries, reported not receiving a needed drug because of cost.
Figure 2-13. Medicare Beneficiaries Who Did Not Get a Needed Drug Because TheyCould Not Afford It, by Source of Insurance and Income, 1997
Note: Medicaid is not included at higher income level because sample size is too small to produce reliableestimates.Source: Division of Health Interview Statistics, National Center for Health Statistics, Centers for DiseaseControl, National Health Interview Survey (NHIS), 1997.
28 The exception is for people with Medicaid, for whom the difference between income groups is notstatistically significant.
17%
8 %
9 %
7 %
1 %
FFS Only Supplement Medicaid FFS Only Supplement
Ben
efic
iari
es N
ot
Get
tin
g a
Nee
ded
Dru
g
Income below 150% of poverty Income over 150% of poverty

82
Table 2-28. Percent of Population Not Receiving Prescription Medicine Because ofCost, by Detailed Insurance Status, 1997
Percent reporting that they needed prescription medicine in the last 12months but did not get it because they (or a parent) could not afford it
Health InsuranceTotal 0-150% of poverty 150-300% of
poverty300% of poverty
or moreMedicare beneficiaries
Medicare FFS only 9.9% 16.9% 7.6% *
Medicare + non-Medicaid supplement
2.2% 7.8% 2.4% 0.6%
Medicare + Medicaid 8.8% 8.6% * *
Non-MedicarepopulationMedicaid 6.2% 6.6% 7.6% *
Private 2.4% 7.1% 3.8% 1.2%
No Insurance 16.4% 20.3% 16.0% 13.0%
* Small cell size; estimates not reliableSource: Division of Health Interview Statistics, National Center for Health Statistics, Centers for DiseaseControl, National Health Interview Survey (NHIS), 1997.Medicare beneficiaries with no supplemental coverage were over four times as likelyas those with a non-Medicaid supplement to report not receiving a drug they needed.Among the non-Medicare population, people without any insurance were almost eighttimes as likely as people with private insurance to report going without a needed drug.
Again, this difference between people with and without coverage would likely be evenstronger if information were available on which supplements included drug coverage.As Chapter 1 showed, while many Medicare beneficiaries with supplemental coveragehave drug coverage, most beneficiaries with an individually purchased policy do nothave coverage for their drugs. This distinction may be less important for non-Medicarebeneficiaries, who usually have drug coverage if they have health insurance.
Mix of Drugs
Another consequence of not having drug coverage may be the use of a different mix ofdrugs. In addition to not filling some prescriptions, some people without drugcoverage may obtain different prescriptions compared to the prescriptions that peoplewith drug coverage get. Preliminary analysis of MCBS data on Medicare beneficiaryutilization of medications commonly associated with the treatment of hypertension

83
(categorized as diuretics, calcium channel blockers, beta blockers andanti-hypertensives)29 suggests that:
• Beneficiaries with prescription drug coverage were more likely to be dispensed ageneric drug for all of the drug categories; beneficiaries without coverage weremore likely to be dispensed a brand name product. Presumably, beneficiaries withcoverage are more likely to be encouraged (or required) to use generic products bythe health plan or pharmacy benefit manager.30
• The average number of units dispensed per prescription was higher for people withprescription drug coverage. Individuals with prescription drug coverage may bepurchasing a supply of drugs to last a longer period of time (for example, a 30 daysupply rather than a 14 day supply). Individuals without coverage also may beskipping doses to avoid higher out-of-pocket costs (for example, taking medicationonce per day instead of twice per day).
One issue the analysis raises for future work is the possibility of a connection betweeninsurance status and “step therapy.” That is, beneficiaries with insurance could bemore likely to have a drug or combination of drugs prescribed and dispensed that ismore responsive to a particular patient (and perhaps more expensive). For example, aphysician may prescribe an increased drug dose, substitute another drug, or add asecond agent from a different class of drugs if a patient is not responding adequately tocurrent drug therapy. More work is necessary to discern whether or not beneficiarieswith drug coverage are more likely to be prescribed or fill those additionalprescriptions, and take them at appropriate dosages.
TRENDS IN PRESCRIPTION DRUG SPENDING
Prescription drug spending and utilization have become increasingly important issuesin part because of their rapid growth. Spending on prescription drugs has risen fasterthan spending on other types of health care throughout the 1990’s. This sectionexplores growth in spending for the total population and for Medicare beneficiaries. Itwill also examine some of the components of this growth.
29 Note that the analysis included beneficiary use of drugs associated with hypertension, but some of thesemedications may have been prescribed for purposes other than treatment of hypertension. For example,diuretics could be prescribed for a number of purposes.
30 However, Chapter 3 will show that people with and without coverage purchase a similar mix of brand-name and generic drugs. More analysis is needed on this issue.

84
Growth in Drug Spending for the Total Population
The nation’s spending for prescription drugs has grown dramatically in recent years.Table 2-29 shows estimated total national health expenditures and prescription drugexpenditures for selected years from 1965 through 1998, along with HCFA’s projectionsto 2008. All numbers are in nominal dollars and thus reflect general inflation duringthis period. Figure 2-14 shows the trend in drug spending in 1998 dollars: even whencontrolling for general inflation, there has been a dramatic increase in drug spending,especially since the mid-1980s.
Figure 2-14. Real Spending for Prescription Drugs for the Total Population, 1965-1998and Projected 1999-2008, in 1998 Dollars
Source: National Health Statistics Group, Office of the Actuary, Health Care Financing Administration:National Health Accounts . Adjusted for inflation using the historical CPI-U through 1998 and OMBprojections of CPI-U for 1999 through 2008.
$0.00
$20.00
$40.00
$60.00
$80.00
$100.00
$120.00
$140.00
$160.00
$180.00
$200.00
1965 1970 1975 1980 1985 1990 1995 2000 2005
Sp
end
ing
in b
illi
ons,
199
8 d
olla
rs

85
Table 2-29. Growth in National Health Expenditures and Prescription DrugExpenditures, 1970-1998 and Projected 1999-2008
National health expenditures Drug expenditures
Year Total (millions) Annual change Total (millions) Annual changeDrugs as % of
NHE1965 $41,100 $3,715 9.0%
1970 $73,243 12.2% $5,497 8.2% 7.5%
1980 $247,273 12.9% $12,049 8.2% 4.9%
1990 $699,361 11.0% $37,677 12.1% 5.4%
1991 $766,783 9.6% $42,148 11.9% 5.5%
1992 $836,537 9.1% $46,598 10.6% 5.6%
1993 $898,496 7.4% $50,632 8.7% 5.6%
1994 $947,717 5.5% $55,189 9.0% 5.8%
1995 $993,725 4.9% $61,060 10.6% 6.1%
1996 $1,042,522 4.9% $69,111 13.2% 6.6%
1997 $1,092,385 4.8% $78,888 14.1% 7.2%
1998 $1,149,100 5.1% $90,648 14.9% 7.9%
2003 (proj.) $1,590,359 6.7% $152,363 11.1% 9.6%
2008 (proj.) $2,176,620 6.5% $243,437 9.8% 11.2%
Source: National Health Statistics Group, Office of the Actuary, Health Care Financing Administration:National Health Accounts.
Through the 1970s and 1980s, drug spending grew somewhat more slowly than overallhealth spending—at an annual rate of 10 percent a year, compared to 12 percent for allhealth spending. In the 1990s, growth in drug spending began to outpace growth inspending for other kinds of health services. As a result, the share of healthexpenditures going to prescription drugs increased throughout the 1990’s, growingfrom 5.4 percent in 1990 to 7.8 percent in 1998 (see Figure 2-15). Part of this trend maybe attributed to a slowing of the growth in health expenditures associated with theexpansion of managed care. Some analysts contend that growth in drug spending alsocontributed to the moderation in spending growth for other services. They suggest thatsome new drug therapies replaced more costly treatments; for example, new asthmadrugs may have reduced emergency room utilization. While these substitution effectshave been identified in specific instances, it is not possible to assess the aggregatedegree of substitution that may be occurring. This could be a fruitful area for futureresearch.

86
Figure 2-15. Prescription Drug Expenditures as a Percent of National HealthExpenditures, 1965-1997
Source: National Health Statistics Group, Office of the Actuary, Health Care Financing Administration:National Health Accounts.
HCFA projects that growth in drug spending will moderate slightly in the comingyears. This is partly because the patent protection for many top-selling brand-namedrugs will expire over the next decade. The likely appearance of generic equivalentsfor these drugs will depress spending growth slightly. Still, many new medications areexpected to appear, and drug spending is projected to consume a steadily larger shareof total spending by all the major payment sources.
Between 1965 and 1998, spending on drugs by every major payment source – privateinsurers, Medicaid, consumers’ out-of-pocket payments, and other sources – increasedfaster than general inflation. However, expenditures by some sources have increasedmuch faster than others. As Table 2-30 and Figure 2-16 show, the result has been asubstantial shift in the share of drug expenditures that each source accounts for.
0%
1%
2%
3%
4%
5%
6%
7%
8%
9%
10%
1965 1970 1975 1980 1985 1990 1995
Pre
scri
pti
on
Dru
gs
as a
Sh
are
of
Nat
ion
al H
ealt
h E
xpen
dit
ure
s

87
Table 2-30. Growth in Prescription Drug Expenditures by Source of Payment, 1970-1998 and Projected 1999-2008
Annual Growth Share of Drug Spending
YearPrivate
Insurance MedicaidOut-of-pocket All Other
PrivateInsurance Medicaid
Out-of-pocket All Other
1965 3.5% 0.0% 92.6% 3.9%
1970 30.1% - 5.7% -14.4% 8.8% 7.6% 82.4% 1.2%
1975 15.3% 15.9% 6.0% 13.8% 12.2% 10.8% 75.4% 1.6%
1980 19.8% 10.1% 5.5% 16.1% 20.1% 11.7% 66.0% 2.2%
1985 21.1% 12.1% 8.1% 17.8% 29.9% 11.8% 55.4% 2.9%
1990 15.4% 15.2% 9.2% 19.1% 34.4% 13.5% 48.3% 3.8%
1991 17.0% 21.7% 6.1% 4.0% 36.0% 14.7% 45.8% 3.6%
1992 18.1% 8.6% 5.7% 4.2% 38.5% 14.4% 43.8% 3.4%
1993 12.2% 15.6% 3.8% 2.2% 39.7% 15.3% 41.8% 3.2%
1994 16.6% 10.4% 1.1% 12.8% 42.5% 15.5% 38.8% 3.3%
1995 21.9% 12.9% -3.3% 15.4% 46.8% 15.8% 33.9% 3.4%
1996 17.5% 14.7% 5.3% 16.1% 48.8% 16.1% 31.6% 3.5%
1997 18.7% 17.2% 4.9% 16.2% 50.8% 16.5% 29.1% 3.6%
1998 19.7% 19.2% 5.4% 18.0% 52.7% 17.1% 26.6% 3.6%
2003 (proj.) 11.1% 13.0% 8.8% 14.1% 53.0% 18.7% 24.1% 4.2%
2008 (proj.) 10.0% 11.6% 8.2% 8.9% 53.3% 20.3% 22.4% 4.1%
Source: National Health Statistics Group, Office of the Actuary, Health Care Financing Administration:National Health Accounts.

88
Figure 2-16. Spending for Prescription Drugs by Payment Source, Total Population,1965-1998, in 1998 Dollars
*Nominal spending in 1965 was $3.7 billion.Source: National Health Statistics Group, Office of the Actuary, Health Care Financing Administration:National Health Accounts. Adjusted for inflation using the CPI-U.
Private insurance payments accounted for only 3.5 percent of all prescription drugexpenditures in 1965; by 1998, private insurers paid just over half of all drug costs. Oneof the major factors in this shift has been the addition of outpatient prescription drugsto the standard benefit package that private insurers offer. In 1965, it was much lesscommon than it is today for health plans to include drugs in their benefit package.More recently, the trend toward an increasing insurer share may also be related to theshift to managed care and the corresponding move from benefit packages withdeductibles and coinsurance to no-deductible plans with fixed copayments.31
31 Copayments are not necessarily less burdensome than coinsurance. On a $35 prescription, 20 percentcoinsurance would be $7, less than the copayments imposed by many plans. However, the elimination ofdeductibles probably reduced consumer liabilities considerably. In addition, coinsurance risesautomatically with drug inflation, while insurers have to change copayments periodically to keep pace withinflation.
$ 0
$ 1 0
$ 2 0
$ 3 0
$ 4 0
$ 5 0
$ 6 0
$ 7 0
$ 8 0
$ 9 0
$ 1 0 0
1 9 6 5 1 9 7 0 1 9 7 5 1 9 8 0 1 9 8 5 1 9 9 0 1 9 9 5
Re
al
Sp
en
din
g,
19
98
Do
lla
rs,
in B
illi
on
s
1998 spending: $91 billion
PrivateInsurance:$48 billion (53%)
Out of pocket:$24 billion (27%)
Medicaid:$16 billion (17%)Other: $3 billion(4%)
1965 spending: $19 billion*
Out of pocket:$18 billion (93%)

89
Medicaid has also covered an increasing share of prescription drug expenditures sinceits creation in 1965. In 1975, Medicaid paid for just over a tenth of all drugexpenditures. The program now covers almost a fifth of all drug costs.
While the population’s out-of-pocket spending on prescription drugs grewsignificantly between 1965 and 1998 in dollar terms, the share of total drugexpenditures that were paid out-of-pocket dropped from 93 percent to only 27 percent.HCFA projects that out-of-pocket spending will begin to grow more rapidly than it hasin recent years, as insurers and employers respond to higher drug costs by passingsome of these costs on to health plan enrollees. However, HCFA projects that insurerspending on drugs will grow even more rapidly, continuing the slow shift from out-of-pocket expenditures to other sources of payment.
It is not possible to separate Medicare beneficiaries from the rest of the population inthe National Health Expenditures data. However, some of the findings of this reportsuggest that the sources of spending have been different for Medicare beneficiariescompared to the rest of the population. As Chapter 1 showed, many beneficiariescontinue to lack access to a source of coverage for their prescription drug costs. As aresult, the trend toward increasing coverage of drug costs by insurers has likely beenmuch less dramatic over time for Medicare beneficiaries than for the rest of thepopulation. The next section will explore overall spending and utilization trends forMedicare beneficiaries more recently, using the Medicare Current Beneficiary Survey.
Spending Trends for Medicare Beneficiaries
Table 2-31 shows MCBS data on changes in drug utilization and spending for Medicarebeneficiaries between 1992 (the first year of MCBS) and 1996, results that are generallyconsistent with the National Health Expenditures estimates for the total population.Total per beneficiary drug spending (including both third-party and out-of-pocketspending) rose at an annual rate of 9 percent in this period. Utilization grew 4.1 percenta year, slightly faster than the 3.9 percent annual growth in total retail prescriptionsover the same period (NACDS). Spending per prescription grew 4.7 percent — wellabove general inflation, which averaged 2.8 percent from 1992 to 1996. Figure 2-17shows that expenditures per Medicare beneficiary grew more rapidly thanprescriptions per beneficiary throughout this period.
As it did for the total population, out-of-pocket spending on prescription drugs byMedicare beneficiaries grew less rapidly than total spending. This is due both to agrowth in prescription drug coverage and particularly to shifts into managed care,including expanding Medicare risk HMO enrollment and increased use of managedcare in retiree health benefit plans. Thus, this slower growth in out-of-pocket spendingby Medicare beneficiaries may not reflect current or future trends.

90
Figure 2-17. Growth in Drug Spending and Number of Prescriptions per MedicareBeneficiary, 1993-1996
Source: Information and Methods Group, Office of Strategic Planning, Health Care FinancingAdministration: Medicare Current Beneficiary Survey Cost and Use File, 1992-1996.
Table 2-31. Growth in Utilization and Spending for Prescription Drugs by MedicareBeneficiaries, 1992-1996
1992 1993 1994 1995 1996
AverageAnnual
ChangePer Capita Total Expenditures $477 $513 $550 $600 $674 9.0%
Per Capita Out-of-pocket $277 $284 $287 $303 $318 3.5%
Per Capita Scripts 16.62 16.94 17.60 18.52 19.54 4.1%
Total Exp./Script $28.66 $30.30 $31.22 $32.39 $34.47 4.7%
Out-of-pocket/Script $16.67 $16.77 $16.28 $16.34 $16.29 -0.6%
Percent Out-of-pocket 58% 55% 52% 50% 47% -5.1%
Source: Information and Methods Group, Office of Strategic Planning, Health Care FinancingAdministration: Medicare Current Beneficiary Survey Cost and Use File, 1992-1996.
Table 2-32 shows changes in spending between 1995 and 1996, by primary source ofsupplemental coverage and whether or not the beneficiary had drug coverage. Totalspending and out-of-pocket spending both grew more rapidly between 1995 and 1996than in the preceding two years. Spending growth was highest for enrollees in risk
7 . 7 %
7 . 1 %
9 . 1 %
12.3%
1 . 9 %
5 . 6 %5 . 2 %
3 . 9 %
0 %
2 %
4 %
6 %
8 %
10%
12%
14%
1 9 9 3 1 9 9 4 1 9 9 5 1 9 9 6
% c
han
ge
fro
m p
revi
ou
s ye
ar
Expenditures per capita
Prescr ipt ions per capi ta

91
HMOs and for Medicaid beneficiaries, and enrollees in other public programs.Spending actually declined for beneficiaries with no supplemental coverage.
Table 2-32. Percent Change in Average Expenditures and Out-of-pocketExpenditures for Prescription Drugs for Medicare Beneficiaries with and withoutDrug Coverage, by Primary Medicare Supplement, 1995-19961
Growth in per capita total drugexpenditures
Growth in per capita out-of-pocketdrug expenditures
Primary Medicare Supplement Total CoveredNot
covered Total CoveredNot
covered
All Beneficiaries 12.3% 11.6% 7.0% 5.2% 8.5% 7.0%
No Supplemental Coverage(FFS Medicare only)
-7.2% na -7.2% -7.2% na -7.2%
Supplemental Coverage:
Medicare Risk HMO 17.9% 19.7% * -4.8% -4.1% *
Medicaid2 17.0% 16.4% 38.5% 16.1% 11.4% 38.5%
Employer-sponsored3 11.1% 10.2% 10.6% 4.5% 5.9% 10.6%
Individually-purchased only 10.3% 6.1% 11.2% 11.7% 16.3% 11.2%
All other4 27.9% 25.4% 45.1% 24.7% 21.6% 45.1%
1Each person has been assigned to one supplementary insurance category but they may or may not obtaintheir drug insurance coverage from that source.2 Includes beneficiaries receiving full Medicaid benefits, as well as QMBs and SLMBs.3 Includes those who only had employer-sponsored supplemental insurance and those who had bothemployer-sponsored and individually-purchased supplemental insurance.4 Includes other public programs such as VA, DOD, and State Pharmaceutical Assistance Programs for low-income elderly, as well as non-risk HMOs (cost and HCPP plans).* Number is unreliable because of small sample size.Source: Information and Methods Group, Office of Strategic Planning, Health Care FinancingAdministration: Medicare Current Beneficiary Survey Cost and Use File, 1995 and 1996.
Factors in Spending Growth
The very rapid growth in drug spending in recent years has been attributed to a varietyof factors:
• Part of the growth in drug spending is attributable to price increases for existingdrugs. Although price increases have been less than one percentage point abovegeneral inflation since 1994, these increases (including the effect of general inflation)still contribute significantly to the total increase in drug spending.32
32 HCFA, based on the CPI and the GDP deflator.

92
• Second, the nature of the drugs people receive has changed. There has been a shifttoward newer drugs. The number of new drugs introduced each year has grownrapidly, from 23 new drugs introduced in 1990 to 53 new drugs introduced in 1996;the Pharmaceutical Research and Manufacturers of America (PhRMA) estimates that100 new drugs were introduced in 1997 and 1998.33 Many of these drugs have beenbreakthrough treatments; others are merely incremental improvements over existingtherapies, or “me too” drugs that offer little improvement over existing options.New drugs are often more costly than older ones. Profitable drugs have to covertheir own development costs as well as costs for drugs that do not receive FDAapproval and those that are not profitable after approval.
• Finally, utilization has grown dramatically. The number of prescriptions filled byretail and mail-order pharmacies grew by 32 percent between 1992 and 1998(NACDS). There are a number of possible reasons. An aging population may havea higher incidence of chronic conditions for which drug therapy is appropriate,although these demographic changes are occurring only gradually. The use ofprescription drugs is also likely growing because of changes in medical practice,including the rise in managed care, early intervention, and the substitution ofmedications for other therapies – including new medications that offer therapies notpreviously available. As noted earlier, demand may have increased because of thelower cost-sharing requirements of managed care plans. Another factor related toincreased demand may be greater consumer awareness of therapies, both because ofincreased media coverage of medical news and the growth of direct-to-consumeradvertising of prescription drugs.
A recent study by the Barents Group for the National Institute for Health CareManagement (NIHCM) attempted to measure the relative importance of differentfactors in the growth of drug spending, as shown in Table 2-33. In general, the studysplit inflation into two categories: “price” effects and “utilization” effects. Each of theseeffects were further split between older drugs (drugs that entered the market before1992) and new drugs (drugs that entered the market in 1992 or later).
The study found that about two thirds of spending growth from 1993 to 1998 wasattributable to price. Of this portion, 22 percentage points were attributable to pureprice increases for older drugs. Another 42 percentage points reflected the fact thatnewer drugs cost more than older drugs: the study estimated that the average 1998price for drugs introduced in 1992 or later was $71.49 per prescription, compared to$30.47 for previously existing drugs. This difference reflects higher initial introductionprices as well as price increases after introduction. The study did not attempt to
33 PhRMA, Drug Utilization And Managed Care, Sept. 1998.

93
measure how much of this difference reflects changes in quality as better, newer drugsreplace older, less effective medications.
The study reported that increased utilization accounted for about one third of spendinggrowth. If price levels and the mix of prices had not changed between 1993 and 1998, 36percent of the total spending growth would still have occurred as a result of theincreased number of prescriptions. Increased utilization of newer drugs contributedalmost twice as much as utilization of older drugs to this increase.
Table 2-33. Percentage Contribution of Changes in Price and Utilization to1993-98 Increase in Prescription Drug Spending
Percent of rise in drug spendingattributable to prices (at
introduction and subsequentincreases)
Percent of rise in drugspending attributable to
utilization TotalNew drugs (1992 orlater)
42% 23% 65%
Older drugs 22% 13% 35%Total 64% 36% 100%
Source: National Institute for Health Care Management Research and Educational Foundation, FactorsAffecting the Growth of Prescription Drug Expenditures, Washington, 1999.
Table 2-34 shows some of the components of spending growth for Medicarebeneficiaries. Both utilization and cost per prescription grew from 1995 to 1996. Thisanalysis did not attempt to measure changes in the mix of drugs. Average cost perprescription grew by 6.4 percent, more rapidly than during the preceding years. Thecost change was larger than the change in utilization for HMO enrollees and those inemployer plans. The reverse was true for Medicaid beneficiaries and purchasers ofindividual coverage; for these groups utilization grew faster than price. Forbeneficiaries with no Medicare supplement, both utilization and average pricedropped. This may mean that these beneficiaries were less able to afford prescriptiondrugs. However, it might also suggest that the highest spenders in 1995 weredisproportionately represented among beneficiaries who newly gained drug coveragein 1996.

94
Table 2-34. Percent Change in Average Number of Prescriptions and Expenditure perPrescription for Medicare Beneficiaries with and without Drug Coverage, by PrimaryMedicare Supplement, 1995-19961
Growth in Average Number ofPrescriptions Per Beneficiary
Growth in Average Expenditureper Prescription
Type of Insurance CoverageTotal Covered
Notcovered Total Covered
NotCovered
All Beneficiaries 5.5% 4.2% 4.4% 6.4% 7.1% 2.5%
No Supplemental Coverage (FFSMedicare only)
-2.8% -2.8% -4.6% -4.6%
Supplemental Coverage:
Medicare Risk HMO 7.9% 8.5% * 9.3% 10.3% *
Medicaid2 8.5% 8.1% 20.6% 7.8% 7.7% 14.9%
Employer-sponsored3 2.9% 2.5% 3.9% 8.0% 7.4% 6.5%
Individually-purchased only 7.2% 6.0% 6.8% 2.9% 0.2% 4.1%
All other4 19.0% 17.4% 27.6% 7.4% 6.9% 13.7%
1Each person has been assigned to one supplementary insurance category but they may or may not obtaintheir drug insurance coverage from that source.2 Includes beneficiaries receiving full Medicaid benefits, as well as QMBs and SLMBs.3 Includes those who only had employer-sponsored supplemental insurance and those who had bothemployer-sponsored and individually-purchased supplemental insurance.4 Includes other public programs such as VA, DOD, and State Pharmaceutical Assistance Programs for low-income elderly, as well as non-risk HMOs (cost and HCPP plans).* Number is unreliable because of small sample size.Source: Information and Methods Group, Office of Strategic Planning, Health Care FinancingAdministration: Medicare Current Beneficiary Survey Cost and Use File, 1995 and 1996.