chapter 2 job order costing · job order costing is used by firms that sell custom goods and...
TRANSCRIPT

CHAPTER 2 JOB ORDER COSTING
DISCUSSION QUESTIONS
1. a. Job order cost system and process cost system.
b. The job order cost system provides a separate record of each quantity of product
that passes through the factory.
c. Process cost systems accumulate costs for each department or process within a factory.
2. Job order costing is used by firms that sell custom goods and services to customers. The
job order system is frequently associated with firms that will produce a product or service
specifically to a customer order.
3. Work in process
4. a. Purchase invoice or receiving report b. Materials requisition
5. A job cost sheet is the subsidiary ledger to the work in process control account. The cost of
materials, labor, and overhead are listed on each separate job cost sheet for each job. A
summary of all the job cost sheets during an accounting period is the basis for journal entries
to the control accounts.
6. The clock card is a means of recording the hours spent by employees in the factory. The
time ticket is a means of recording the time the employee spends on a specific job.
7. The predetermined overhead rate is computed using estimated amounts at the beginning of the
period. This is because managers need timely information on the product costs of each job. If
a company waited until all overhead costs were known at the end of the period, the allocated
factory overhead would be accurate, but not timely. Only through timely reporting can
managers adjust manufacturing methods or product pricing.
8. a. The predetermined factory overhead rate is determined by dividing the estimated total factory
overhead costs for the forthcoming year by an estimated activity base, one that reflects the
consumption or use of factory overhead costs.
b. Direct labor cost, direct labor hours, and machine hours.
9. a. (1) If the amount of factory overhead applied is greater than the actual factory overhead
incurred, factory overhead is overapplied.
(2) If the amount of actual factory overhead is greater than the amount applied,
factory overhead incurred is underapplied.
b. Underapplied c. Deferred credit
17-1 © 2014 Cengage Learning. All Rights Reserved. May not be scanned, copied or duplicated, or posted to a publicly accessible website, in whole or in part.

DISCUSSION QUESTIONS (Continued)
10. Job order cost accumulation would be most appropriate for professional service firms that
provide extended, project-type services for clients. Examples would be architectural,
consulting, advertising, or legal services. Job cost sheets would accumulate all direct costs
of servicing the client. Such costs would include labor, materials, travel, and subcontracted
services. In addition, overhead would be applied using a predetermined overhead rate. The
costs accumulated by the job cost sheet would be treated as work in process (a current
asset) until the service is completed. Once completed, the cost would be transferred to the
cost of services on the income statement.
17-2 © 2014 Cengage Learning. All Rights Reserved. May not be scanned, copied or duplicated, or posted to a publicly accessible website, in whole or in part.

PRACTICE EXERCISES
PE 17–1A (FIN MAN); PE 2–1A (MAN)
Feb. 8 Materials 576,000
Accounts Payable 576,000
$576,000 = 72,000 × $8.
19 Work in Process* 520,000
Materials 520,000
* Job 60 $224,000 = 32,000 × $7 Job 61 296,000 = 37,000 × $8
Total $520,000
PE 17–1B (FIN MAN); PE 2–1B (MAN)
Aug. 4 Materials 168,000
Accounts Payable 168,000
$168,000 = 12,000 × $14.
24 Work in Process* 126,800
Materials 126,800
* Job 40 $ 40,000 = 5,000 × $8 Job 42 86,800 = 6,200 × $14
Total $126,800
PE 17–2A (FIN MAN); PE 2–2A (MAN)
Work in Process* 837,000
Wages Payable 837,000
* Job 60 $360,000 = 15,000 hours × $24.00 Job 61 477,000 = 18,000 hours × $26.50
Total $837,000
PE 17–2B (FIN MAN); PE 2–2B (MAN)
Work in Process* 186,200
Wages Payable 186,200
* Job 40 $ 87,500 = 3,500 hours × $25 Job 42 98,700 = 4,200 hours × $23.50
Total $186,200
17-3 © 2014 Cengage Learning. All Rights Reserved. May not be scanned, copied or duplicated, or posted to a publicly accessible website, in whole or in part.

PE 17–3A (FIN MAN); PE 2–3A (MAN)
Factory Overhead 186,000
Materials 34,000
Wages Payable 81,000
Utilities Payable 10,000
Accumulated Depreciation—Factory 61,000
PE 17–3B (FIN MAN); PE 2–3B (MAN)
Factory Overhead 66,600
Materials 17,500
Wages Payable 22,000
Utilities Payable 9,600
Accumulated Depreciation—Factory 17,500
PE 17–4A (FIN MAN); PE 2–4A (MAN) a. $5.50 per direct labor hour = $2,200,000 ÷ 400,000 direct labor hours
b. Job 60 $ 82,500 = 15,000 hours × $5.50 per hour
Job 61 99,000 = 18,000 hours × $5.50 per hour
$ 181,500
c.
Work in Process 181,500
Factory Overhead 181,500
PE 17–4B (FIN MAN); PE 2–4B (MAN) a. $9.00 per direct labor hour = $810,000 ÷ 90,000 direct labor hours
b. Job 40 $31,500 = 3,500 hours × $9.00 per hour
Job 42 37,800 = 4,200 hours × $9.00 per hour
$69,300
c.
Work in Process 69,300
Factory Overhead 69,300
17-4 © 2014 Cengage Learning. All Rights Reserved. May not be scanned, copied or duplicated, or posted to a publicly accessible website, in whole or in part.

PE 17–5A (FIN MAN); PE 2–5A (MAN)
a. Job 60 Job 61
Direct materials……………………………………………………… $224,000 $296,000
Direct labor…………………………………………………………… 360,000 477,000
Factory overhead…………………………………………………… 82,500 99,000
Total costs………………………………………………………… $666,500 $872,000
b. Job 60 $26.66 = $666,500 ÷ 25,000 units
Job 61 $27.25 = $872,000 ÷ 32,000 units
PE 17–5B (FIN MAN); PE 2–5B (MAN)
a. Job 40 Job 42
Direct materials……………………………………………………… $ 40,000 $ 86,800
Direct labor…………………………………………………………… 87,500 98,700
Factory overhead…………………………………………………… 31,500 37,800
Total costs………………………………………………………… $159,000 $223,300
b. Job 40 $15.90 = $159,000 ÷ 10,000 units
Job 42 $20.30 = $223,300 ÷ 11,000 units
PE 17–6A (FIN MAN); PE 2–6A (MAN)
$24,400,000 = $1,600,000 + (475,000 × $48.00)*
* Cost per unit of goods produced during the year = $48.00 = $24,000,000 ÷ 500,000 units
PE 17–6B (FIN MAN); PE 2–6B (MAN)
$3,085,000 = $310,000 + (185,000 × $15.00)*
* Cost per unit of goods produced during the year = $15.00 = $3,000,000 ÷ 200,000 units
17-5 © 2014 Cengage Learning. All Rights Reserved. May not be scanned, copied or duplicated, or posted to a publicly accessible website, in whole or in part.

EXERCISES
Ex. 17–1 (FIN MAN); Ex. 2–1 (MAN)
a. Materials requisitioned for use (both direct and indirect).
b. Factory labor used (both direct and indirect).
c. Application of factory overhead costs to jobs.
d. Jobs completed.
e. Goods sold.
Ex. 17–2 (FIN MAN); Ex. 2–2 (MAN)
a. Cost of goods sold:
Sales………………………………………………………………… $4,500,000
Less gross profit………………………………………………… 810,000
Cost of goods sold……………………………………………… $3,690,000
b. Direct materials cost:
$1,530,000 Materials purchased……………………………………………
$117,000 Less: Indirect materials………………………………………
Materials inventory……………………………………… 113,400 230,400
Direct materials cost…………………………………………… $1,299,600
c. Direct labor cost:
Total manufacturing costs for the period……………………
$1,299,600
$3,330,000
Less: Direct materials cost……………………………………
Factory overhead*……………………………………… 441,000 1,740,600
Direct labor cost………………………………………………… $1,589,400
* $117,000 + $270,000 + $54,000
17-6 © 2014 Cengage Learning. All Rights Reserved. May not be scanned, copied or duplicated, or posted to a publicly accessible website, in whole or in part.

Ex. 17–3 (FIN MAN); Ex. 2–3 (MAN)
a.
RECEIVED ISSUED BALANCE
Materials
Receiving Requi-
Report Unit sition Unit Number Quantity Price Number Quantity Amount Date Quantity Price Amount
July 1 300 $18.00 $5,400
31 200 $20 July 2 300 $18.00 5,400
200 $20.00 4,000
106 320 $5,800* July 6 180 $20.00 3,600
37 140 32 July 12 180 $20.00 3,600
140 $32.00 4,480
115 200 4,240** July 21 120 $32.00 3,840
* July 6 issuance 300 at $18.00 $5,400 20 at $20.00 400
$5,800
** July 21 issuance 180 at $20.00 $3,600 20 at $32.00 640
$4,240
b. Ending wire cable balance:
$3,840
120 at $32.00……………………………………………………………………
c. Work in Process ($5,800 + $4,240) 10,040
Materials 10,040 d. Comparing quantities on hand as reported in the materials ledger with
predetermined order points enables management to order materials before a
lack of materials causes idle time. Also, the subsidiary ledger can include
columns for recording quantities ordered, so that management can have
easy access to information about materials on order.
Ex. 17–4 (FIN MAN); Ex. 2–4 (MAN)
Work in Process 155,050
Factory Overhead 2,800
Materials 157,850
17-7 © 2014 Cengage Learning. All Rights Reserved. May not be scanned, copied or duplicated, or posted to a publicly accessible website, in whole or in part.

Ex. 17–5 (FIN MAN); Ex. 2–5 (MAN)
a.
Materials* 1,471,540
Accounts Payable 1,471,540
* $282,240 + $392,000 + $770,000 + $27,300
b. Work in Process 1,463,750
Factory Overhead 29,000
Materials 1,492,750
c. Polyester
Fabric Filling Lumber Glue
Balance, May 1………………………… $ 56,000 $ 16,800 $ 125,300 $ 5,460 May purchases……………………… 282,240 392,000 770,000 27,300
Less May requisitions……………… (263,750) (354,100) (845,900) (29,000)
Balance, May 31……………………… $ 74,490 $ 54,700 $ 49,400 $ 3,760
Ex. 17–6 (FIN MAN); Ex. 2–6 (MAN)
Work in Process 69,960
Factory Overhead 7,200
Wages Payable 77,160
17-8 © 2014 Cengage Learning. All Rights Reserved. May not be scanned, copied or duplicated, or posted to a publicly accessible website, in whole or in part.

Ex. 17–7 (FIN MAN); Ex. 2–7 (MAN)
a.
Work in Process 3,815
Factory Overhead 385
Wages Payable 4,200
Supporting Calculations:
Labor Costs (Hourly Rate × Hours)
Direct Labor
Hourly Job Job Job (sum of Indirect
Rate 501 502 503 job costs) Labor
Frank Davis……… $35 $420 $490 $385 $1,295 $105 Miles Coultrain… 40 560 400 480 1,440 160
John Morgan…… 30 300 360 420 1,080 120
$3,815 $385
b. The direct labor costs for the completed jobs would become part of the finished
goods inventory. The direct labor costs for Job 503 would remain part of the work
in process inventory.
Ex. 17–8 (FIN MAN); Ex. 2–8 (MAN)
a.
Work in Process 22,600
Factory Overhead 3,900
Wages Payable 26,500
b. Work in Process 11,300
Factory Overhead 11,300
$22,600 ÷ $40 per hour = 565 hours
565 hours × $20 per hour = $11,300
17-9 © 2014 Cengage Learning. All Rights Reserved. May not be scanned, copied or duplicated, or posted to a publicly accessible website, in whole or in part.

Ex. 17–9 (FIN MAN); Ex. 2–9 (MAN)
a. Factory 1: $24.00 per machine hour ($1,008,000 ÷ 42,000 machine hours) b. Factory 2: $41.00 per direct labor hour ($861,000 ÷ 21,000 direct labor hours) c. Factory 1:
Work in Process 73,200
Factory Overhead 73,200
($24.00 × 3,050).
Factory 2:
Work in Process 82,000
Factory Overhead 82,000
($41.00 × 2,000). d. Factory 1—$1,280 debit (underapplied) ($74,480 – $73,200)
Factory 2—$4,500 credit (overapplied) ($77,500 – $82,000)
Ex. 17–10 (FIN MAN); Ex. 2–10 (MAN)
The estimated shop overhead is determined as follows:
Shop and repair equipment depreciation……………………………………………… $ 53,500
Shop supervisor salaries………………………………………………………………… 140,000
Shop property taxes……………………………………………………………………… 26,300
Shop supplies……………………………………………………………………………… 20,200
Total shop overhead…………………………………………………………………… $240,000
The engine parts and shop labor are direct to the jobs and are not included in
the shop overhead rate. The advertising and administrative expenses are
selling and administrative expenses that are not included in the shop overhead
but are treated as period expenses. The estimated activity base is determined by dividing the shop direct labor
cost by the direct labor rate, as follows:
$750,000
= 30,000 hours $25 per hour
The predetermined shop overhead rate is:
$240,000
= $8.00 per direct labor hour 30,000 hours
17-10 © 2014 Cengage Learning. All Rights Reserved. May not be scanned, copied or duplicated, or posted to a publicly accessible website, in whole or in part.

Ex. 17–11 (FIN MAN); Ex. 2–11 (MAN)
a. Estimated annual operating room overhead: $873,600
Estimated operating room activity base, number of operating room hours:
Hours per day………………………………………………………… Days per week……………………………………………………… Weeks per year (net of maintenance weeks)…………………… Estimated annual operating room hours………………………
Predetermined surgical overhead rate:
$873,600
= $325 per hour 2,688 hours
8
× 7 × 48
2,688
b. Wayne Lawrence’s procedure:
Number of surgical room hours………………………………… 4
Predetermined surgical room overhead rate…………………… × 325
Procedure overhead………………………………………………… $1,300
232 c. Actual hours used in January………………………………………………………
Predetermined surgical room overhead rate…………………………………… × $ 325
Surgical room overhead applied, January………………………………………
$75,400 65,500
$ 9,900

Actual surgical room overhead incurred, January…………………………… Overapplied surgical room overhead (credit balance)…………………………
17-11 © 2014 Cengage Learning. All Rights Reserved. May not be scanned, copied or duplicated, or posted to a publicly accessible website, in whole or in part.

Ex. 17–12 (FIN MAN); Ex. 2–12 (MAN)
a.
Finished Goods* 753,000
Work in Process 753,000
* $160,000 + $175,000 + $100,000 + $318,000
b. Cost of unfinished jobs at June 30: Balance in Work in Process at June 1………………………
Add: Direct materials…………………………………………
Direct labor…………………………………………… Factory overhead………………………………………
Less: Jobs finished during June…………………………… Balance in Work in Process at June 30……………………
Ex. 17–13 (FIN MAN); Ex. 2–13 (MAN)
$ 40,000 270,000 320,000 176,000 $806,000
753,000 $ 53,000
a. Work in Process 25,990
Factory Overhead 2,000
Materials 27,990
b.
Work in Process 10,200
Factory Overhead 9,000
Wages Payable 19,200
c.
Work in Process 7,140
Factory Overhead 7,140
Predetermined overhead rate:
Job 401: $2,240 ÷ $3,200 = 70% or
Job 402: $2,100 ÷ $3,000 = 70%
Direct labor cost × Predetermined factory overhead rate:
$10,200 × 70% = $7,140
d.
Finished Goods* 22,580
Work in Process 22,580
* $13,680 + $8,900
17-12 © 2014 Cengage Learning. All Rights Reserved. May not be scanned, copied or duplicated, or posted to a publicly accessible website, in whole or in part.
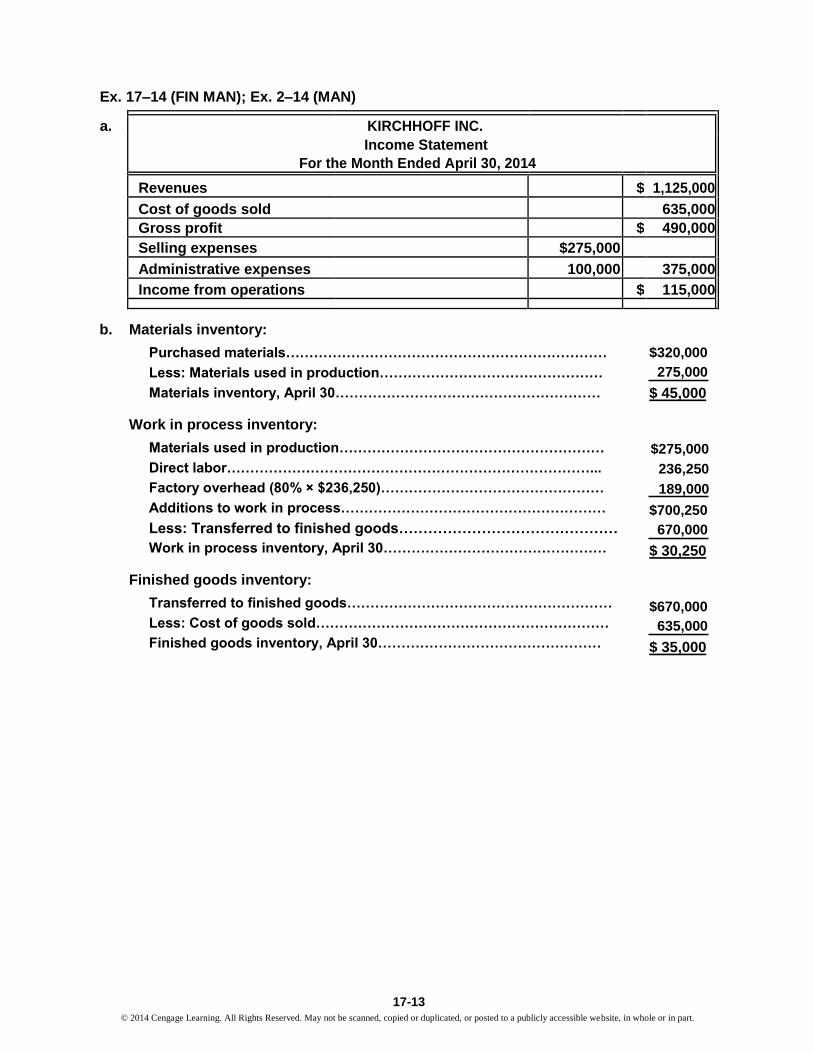
Ex. 17–14 (FIN MAN); Ex. 2–14 (MAN)
a. KIRCHHOFF INC.
Income Statement
For the Month Ended April 30, 2014
Revenues $ 1,125,000
Cost of goods sold 635,000
Gross profit $ 490,000
Selling expenses $275,000
Administrative expenses 100,000 375,000
Income from operations $ 115,000
b. Materials inventory:
Purchased materials……………………………………………………………
Less: Materials used in production…………………………………………
Materials inventory, April 30…………………………………………………
Work in process inventory:
Materials used in production…………………………………………………
Direct labor……………………………………………………………………...
Factory overhead (80% × $236,250)…………………………………………
Additions to work in process…………………………………………………
Less: Transferred to finished goods……………………………………… Work in process inventory, April 30…………………………………………
Finished goods inventory:
Transferred to finished goods…………………………………………………
Less: Cost of goods sold………………………………………………………
Finished goods inventory, April 30…………………………………………
$320,000
275,000 $ 45,000
$275,000
236,250
189,000 $700,250
670,000 $ 30,250
$670,000
635,000 $ 35,000
17-13 © 2014 Cengage Learning. All Rights Reserved. May not be scanned, copied or duplicated, or posted to a publicly accessible website, in whole or in part.

Ex. 17–15 (FIN MAN); Ex. 2–15 (MAN)
a. Unit
Date Job. No. Quantity Product Amount Cost
Jan. 2 1 520 TT $16,120 $31.00
Jan. 15 22 1,610 SS 20,125 $12.50
Feb. 3 30 1,420 SS 25,560 $18.00
Mar. 7 41 670 TT 15,075 $22.50
Mar. 24 49 2,210 SLK 22,100 $10.00
May 19 58 2,550 SLK 31,875 $12.50
June 12 65 620 TT 10,540 $17.00
Aug. 18 78 3,110 SLK 48,205 $15.50
Sept. 2 82 1,210 SS 16,940 $14.00
Nov. 14 92 750 TT 8,250 $11.00
Dec. 12 98 2,700 SLK 52,650 $19.50
Unit Costs for TT
40 30
20
10
—
1 41 65 92
Job Number
Unit Costs for SS
20 18 16 14 12 10 8 6 4
— 2 22 30 82
Job Number
Unit Costs for SLK
22 20 18 16 14 12 10
8 6 4 2
— 49 58 78 98
Job Number
17-14 © 2014 Cengage Learning. All Rights Reserved. May not be scanned, copied or duplicated, or posted to a publicly accessible website, in whole or in part.
Ex. 17–15 (FIN MAN); Ex. 2–15 (MAN) (Concluded)
As can be seen, the unit costs behave differently for each product. SLK
has increasing unit costs during the year, SS is steady, and TT has
decreasing unit costs during the year. b. Management should want to determine why SLK costs are increasing and
why TT costs are decreasing. This information can be determined from the
job cost sheets for each job. By comparing the cost sheets from job to job (for
a particular product), management can isolate the cause of the cost changes.
The cost sheets will show how materials, labor, and overhead are consumed
across the production process for each job. This information can isolate the
problem or opportunity areas.
17-15 © 2014 Cengage Learning. All Rights Reserved. May not be scanned, copied or duplicated, or posted to a publicly accessible website, in whole or in part.

Ex. 17–16 (FIN MAN); Ex. 2–16 (MAN) a. The first item to note is that the cost did not go up due to any increases in
the cost of labor or materials. Rather, the cost of the plaques increased
because Job 105 used more labor and materials per unit than did Job 101.
Specifically, Job 101 required exactly the same number of backboards and
brass plates as the number of actual plaques shipped. However, Job 105
required four more backboards and brass plates than the number actually
shipped (34 vs. 30). This is illustrated as follows:
Job 101:
Materials
Walnut plaques:
Actual units used 40 units
Expected units needed to produce 40 plaques 40 units
Difference
0 units
Brass plates:
Actual units used 40 units
Expected units needed to produce 40 plaques 40 units
Difference
0 units
Labor
Engraving:
Actual labor hours used 20 hours
Expected labor hours to produce 40 plaques 20 hours
(40 units × 30 min. per unit)/60 min. per hour
Difference
0 hours
Assembly:
Actual labor hours used 10 hours
Expected labor hours to produce 40 plaques 10 hours
(40 units × 15 min. per unit)/60 min. per hour
Difference
0 hours
17-16 © 2014 Cengage Learning. All Rights Reserved. May not be scanned, copied or duplicated, or posted to a publicly accessible website, in whole or in part.

Ex. 17–16 (FIN MAN); Ex. 2–16 (MAN) (Concluded)
Job 105:
Materials
Walnut plaques:
Actual units used 34 units
Expected units needed to produce 30 plaques 30 units
Difference
4 units
Brass plates:
Actual units used 34 units
Expected units needed to produce 30 plaques 30 units
Difference
4 units
Labor
Engraving:
Actual labor hours used 17 hours
Expected labor hours to produce 30 plaques 15 hours
(30 units × 30 min. per unit)/60 min. per hour
Difference 2 hours
Assembly:
Actual labor hours used 8.5 hours
Expected labor hours to produce 30 plaques 7.5 hours
(30 units × 15 min. per unit)/60 min. per hour
Difference 1.0 hour
Job 105’s 25.5 labor hours are 3.0 more (25.5 hrs. – 22.5 hrs.) than should have
been expected for a job of 30 plaques [(30 × 45 min.)/60 min. = 22.5 hrs.]. As a
result, the additional hours of labor cost, applied factory overhead, and direct
materials cost cause the unit cost of Job 105 to increase. b. Apparently, the engraving and assembly work is becoming sloppy. Job 105
required 34 engraved brass plates in order to get 30 with acceptable quality.
It is likely that the engraver is not being careful in correctly spelling the
names. The names should be supplied to the engraver, using large
typewritten fonts, so that it is easy to read the names. The engraver should
be instructed to be careful in engraving the names. The assembly operation
also needs some improvement. It took 34 assembly operations to properly
assemble 30 plaques. It may be that the plates are assembled off-register
(crooked) to the backboard. This could be improved by using a fixture to
properly align the plate to the backboard. Alternatively, it’s possible
misengraved plaques were assembled to backboards and needed to be
disassembled, reengraved, and reassembled to new backboards.
17-17
© 2014 Cengage Learning. All Rights Reserved. May not be scanned, copied or duplicated, or posted to a publicly accessible website, in whole or in part.

Ex. 17–17 (FIN MAN); Ex. 2–17 (MAN)
a. May 2 Work in Process (200 hrs. × $140) 28,000
Salaries Payable 28,000
7 Work in Process 14,600
Cash 14,600
11 Work in Process (300 hrs. × $175) 52,500
Salaries Payable 52,500
16 Work in Process 40,000
Consultant Fees Payable 40,000
21 Work in Process (500 hrs. × $50) 25,000
Office Overhead 25,000
31 Office Overhead 26,000
Cash 26,000
31 Office Overhead 6,000
Supplies 6,000
31 Salaries Payable 38,640
Cash 38,640
31 Accounts Receivable 185,000
Fees Earned 185,000
31 Cost of Services 160,100
Work in Process* 160,100
* $28,000 + $14,600 + $52,500 + $40,000 + $25,000
b. Office overhead incurred ($26,000 + $6,000)………………… $32,000
Office overhead applied………………………………………… 25,000
Underapplied overhead………………………………………… $ 7,000
c.
Fees earned………………………………………………………
$185,000
Cost of services*………………………………………………… 167,100
Gross profit………………………………………………………… $ 17,900
* $160,100 + $7,000. Assumes the over- or underapplied office overhead is
closed to cost of services monthly.
Note to Instructors: The consultant fees and travel costs can be directly
assigned to the case and thus are not treated as office overhead. Costs
such as secretarial and administrative salaries and supplies would be part
of office overhead incurred.
17-18 © 2014 Cengage Learning. All Rights Reserved. May not be scanned, copied or duplicated, or posted to a publicly accessible website, in whole or in part.

Ex. 17–18 (FIN MAN); Ex. 2–18 (MAN)
a.
Work in Process 711,000
Salaries Payable 711,000
b.
Work in Process 1,420,000
Accounts Payable 1,420,000
c. Work in Process (70% × $1,420,000) 994,000
Agency Overhead 994,000
d. Cost of Services 1,927,550
Work in Process 1,927,550
Cost of completed jobs, $1,927,550:
Starks Finley
Bank Airlines
June 1 balance………………………………………………… $ 180,000 $ 54,000
June costs:
126,000
56,250
Direct labor………………………………………………… Media………………………………………………………… 472,500 416,500
Overhead…………………………………………………… 330,750* 291,550 **
Total costs……………………………………………………… $ 1,109,250 $818,300
* 70% × $472,500 ** 70% × $416,500
17-19 © 2014 Cengage Learning. All Rights Reserved. May not be scanned, copied or duplicated, or posted to a publicly accessible website, in whole or in part.

PROBLEMS
Prob. 17–1A (FIN MAN); Prob. 2–1A (MAN)
a.
Materials 528,000
Accounts Payable 528,000
b.
Work in Process 403,200
Factory Overhead 58,800
Materials 462,000
c. Work in Process 468,800
Factory Overhead 76,400
Wages Payable 545,200
d. Factory Overhead 123,400
Selling Expenses 195,500
Administrative Expenses 121,800
Accounts Payable 440,700
e. Factory Overhead 24,360
Selling Expenses 20,600
Administrative Expenses 14,900
Prepaid Expenses 59,860
f. Depreciation Expense—Office Building 70,500
Depreciation Expense—Office Equipment 36,120
Factory Overhead 24,360
Accumulated Depreciation—Buildings and Equipment 130,980
g. Work in Process 300,400
Factory Overhead 300,400
h. Finished Goods 840,000
Work in Process 840,000
i. Cost of Goods Sold 740,000
Finished Goods 740,000
17-20 © 2014 Cengage Learning. All Rights Reserved. May not be scanned, copied or duplicated, or posted to a publicly accessible website, in whole or in part.

Prob. 17–2A (FIN MAN); Prob. 2–2A (MAN)
1. a.
Materials 39,300
Accounts Payable 39,300
b.
Work in Process 66,380
Factory Overhead 6,940
Materials 36,020
Wages Payable 37,300
c. Factory Overhead 7,500
Accounts Payable 7,500
d. Factory Overhead 2,640
Accumulated Depreciation—Machinery
and Equipment 2,640
e. Work in Process 17,280
Factory Overhead (288 hours × $60) 17,280
f. Finished Goods 46,640
Work in Process 46,640
Computation of cost of jobs finished:
Direct Direct Factory
Job Materials Labor Overhead Total
No. 201…… $3,950 $3,700 $1,860 $ 9,510
No. 202…… 4,830 5,000 2,760 12,590 No. 203…… 3,200 2,500 2,160 7,860
No. 205…… 6,800 7,000 2,880 16,680
Total…………………………………………………… $ 46,640
g. Accounts Receivable 45,740
Sales 45,740
Cost of Goods Sold 29,960
Finished Goods 29,960
Computation of cost of jobs sold:
Job
No. 201………………………………… $ 9,510 No. 202………………………………… 12,590
No. 203………………………………… 7,860
Total…………………………………… $29,960
17-21 © 2014 Cengage Learning. All Rights Reserved. May not be scanned, copied or duplicated, or posted to a publicly accessible website, in whole or in part.
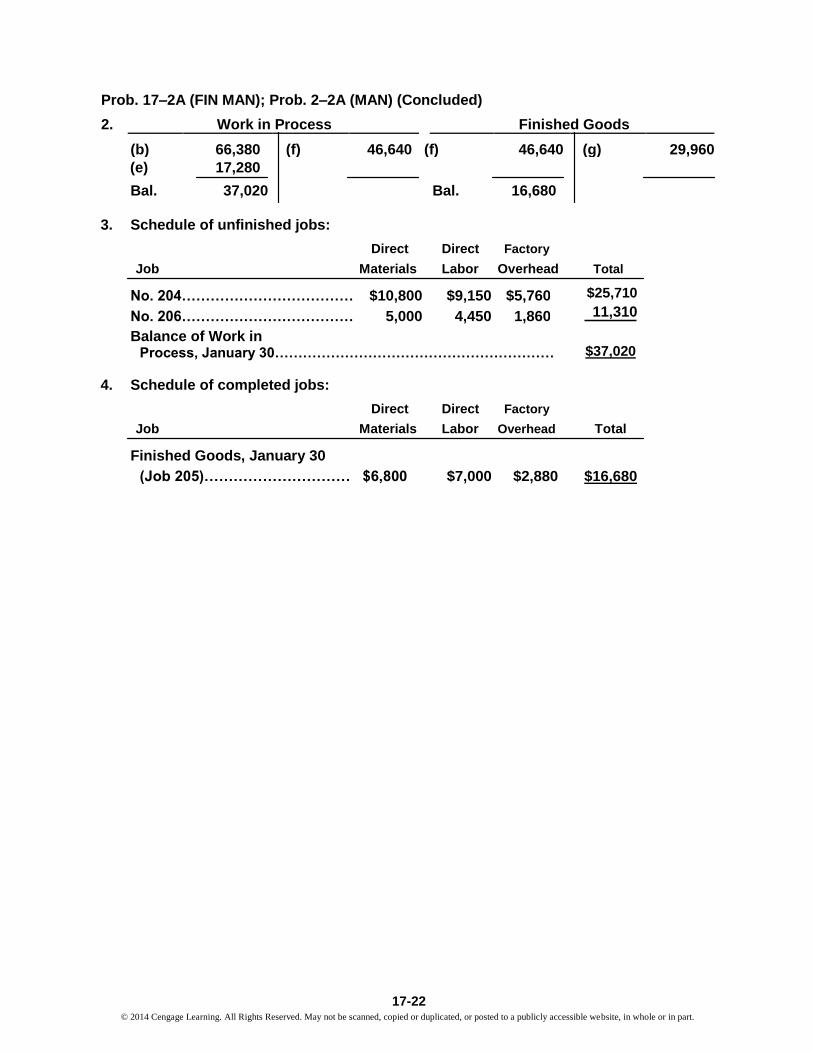
Prob. 17–2A (FIN MAN); Prob. 2–2A (MAN) (Concluded)
2. Work in Process Finished Goods
(b) 66,380 (f) 46,640 (f) 46,640 (g) 29,960 (e) 17,280
Bal. 37,020 Bal. 16,680
3. Schedule of unfinished jobs:
Direct Direct Factory
Job Materials Labor Overhead Total
No. 204……………………………… $10,800 $9,150 $5,760
No. 206……………………………… 5,000 4,450 1,860
Balance of Work in Process, January 30……………………………………………………
4. Schedule of completed jobs:
Direct Direct Factory
Job Materials Labor Overhead
$25,710 11,310
$37,020
Total
Finished Goods, January 30
$16,680 (Job 205)………………………… $6,800 $7,000 $2,880
17-22 © 2014 Cengage Learning. All Rights Reserved. May not be scanned, copied or duplicated, or posted to a publicly accessible website, in whole or in part.
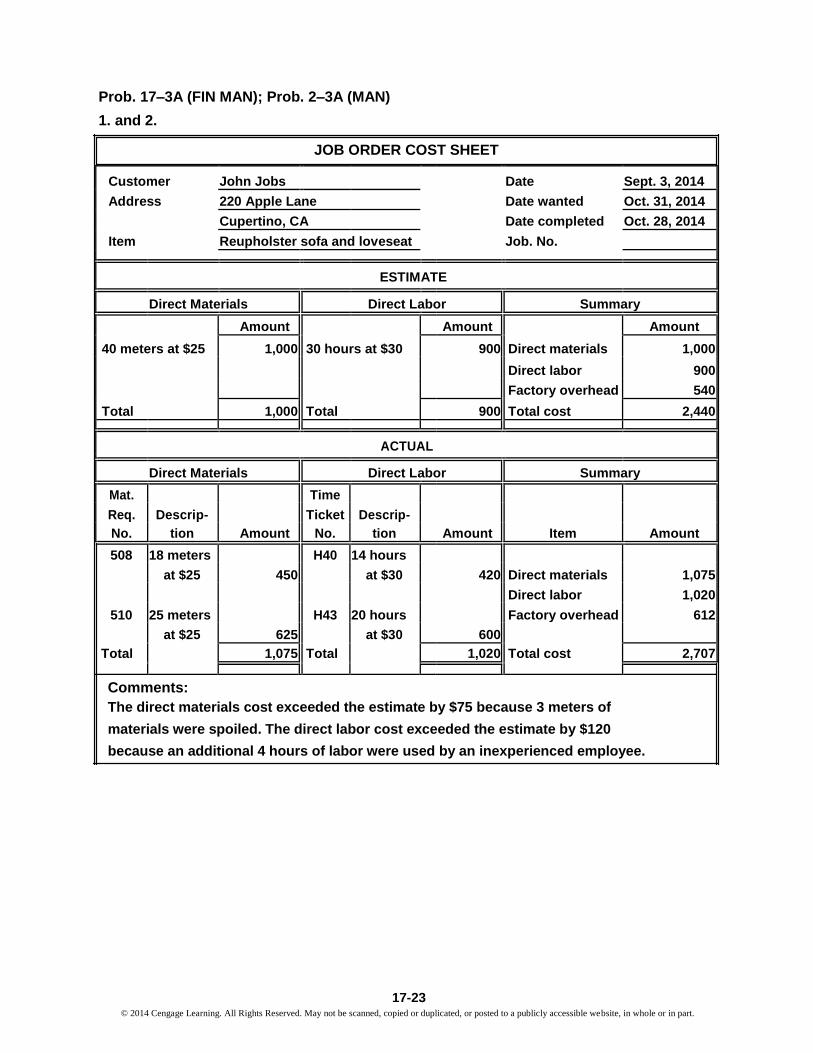
Prob. 17–3A (FIN MAN); Prob. 2–3A (MAN) 1. and 2.
JOB ORDER COST SHEET
Customer John Jobs Date Sept. 3, 2014
Address 220 Apple Lane Date wanted Oct. 31, 2014
Cupertino, CA Date completed Oct. 28, 2014
Item Reupholster sofa and loveseat Job. No.
ESTIMATE
Direct Materials Direct Labor Summary
Amount Amount Amount
40 meters at $25 1,000 30 hours at $30 900 Direct materials 1,000
Direct labor 900
Factory overhead 540
Total 1,000 Total 900 Total cost 2,440
ACTUAL
Direct Materials Direct Labor Summary
Mat. Time
Req. Descrip- Ticket Descrip-
No. tion Amount No. tion Amount Item Amount
508 18 meters H40 14 hours
at $25 450 at $30 420 Direct materials 1,075
Direct labor 1,020
510 25 meters H43 20 hours Factory overhead 612
at $25 625 at $30 600
Total 1,075 Total 1,020 Total cost 2,707
Comments: The direct materials cost exceeded the estimate by $75 because 3 meters of
materials were spoiled. The direct labor cost exceeded the estimate by $120
because an additional 4 hours of labor were used by an inexperienced employee.
17-23 © 2014 Cengage Learning. All Rights Reserved. May not be scanned, copied or duplicated, or posted to a publicly accessible website, in whole or in part.

Prob. 17–4A (FIN MAN); Prob. 2–4A (MAN)
1. Supporting calculations:
June 1 Cost of
Job. No.
Work in Direct Direct Factory Total Unit Units Goods
Quantity Process Materials Labor Overhead Cost Cost Sold Sold
No. 201 550 $16,500 $ 55,000 $ 41,250 $ 57,750 $ 170,500 $310.00 440 $136,400
No. 202 1,100 44,000 93,500 71,500 100,100 309,100 281.00 880 247,280
No. 203 550 38,500 22,000 30,800 91,300 0 0
No. 204 660 82,500 69,300 97,020 248,820 377.00 570 214,890
No. 205 480 60,000 48,000 67,200 175,200 365.00 420 153,300
No. 206 380 22,000 12,400 17,360 51,760 0 0
Total 3,720 $60,500 $ 351,500 $ 264,450 $ 370,230 $ 1,046,680 $751,870
A. $395,500. Materials applied to production in June + indirect materials.
($351,500 + $44,000)
B. $60,500. From table above and problem.
C. $351,500. From table above.
D. $264,450. From table above.
E. $370,230. ($264,450 × 1.4) and from table above.
F. $903,620. ($170,500 + $309,100 + $248,820 + $175,200)
G. $751,870. From table above.
H. $65,550. Wages incurred less direct labor applied to production in June.
($330,000 – $264,450)
17-24 © 2014 Cengage Learning. All Rights Reserved. May not be scanned, copied or duplicated, or posted to a publicly accessible website, in whole or in part.

Prob. 17–4A (FIN MAN); Prob. 2–4A (MAN) (Concluded)
2. June 30 balances:
Materials………………………… $ 17,000 ($82,500 + $330,000 – $395,500)
Work in Process*……………… $ 143,060 ($91,300 + $51,760, Job 203 & Job 206)
Finished Goods**……………… $ 151,750 ($903,620 – $751,870)
Factory Overhead……………… $ 9,820 Dr. underapplied ($33,000 + $65,550
+ $44,000 + $237,500 – $370,230)
* or ($60,500 + $351,500 + $264,450 + $370,230 – $903,620)
** Units in Unit Total Job. No. Inventory Cost Cost
No. 201 110 $310.00 $ 34,100 No. 202 220 281.00 61,820 No. 204 90 377.00 33,930 No. 205 60 365.00 21,900
Total $ 151,750
17-25 © 2014 Cengage Learning. All Rights Reserved. May not be scanned, copied or duplicated, or posted to a publicly accessible website, in whole or in part.

Prob. 17–5A (FIN MAN); Prob. 2–5A (MAN)
1. GINOCERA INC.
Income Statement
For the Year Ended December 31, 2014
Sales $ 17,920,000
Cost of goods sold 10,864,000
Gross profit $ 7,056,000
Selling expenses:
Infomercial campaign $2,000,000
Promotional materials 3,600,000
Shipping expenses 224,000
Total selling expenses $5,824,000
Administrative expenses:
Legal expenses 800,000
Total operating expenses 6,624,000
Income from operations $ 432,000
Supporting calculations:
Sales: 1,120,000 units × $16 = $17,920,000
Cost of goods sold: 1,120,000 units × $9.70 = $10,864,000
Manufacturing cost per unit (Knife):
Direct materials:
$4.00
Hardened Steel Blanks………………………………
Wood (for handle)……………………………………… 1.50
Packaging……………………………………………… 0.50
Total direct materials………………………………… $6.00
Direct labor………………………………………………… 0.50
Factory overhead*………………………………………… 3.20
Total manufacturing cost per knife………………… $9.70
* $800 ÷ 250 knives per hour
Promotional materials: 60,000 stores × $60 = $3,600,000
Shipping expenses: 1,120,000 units × $0.20 = $224,000
2. Finished Goods balance, December 31, 2014:
(1,200,000 units – 1,120,000 units) × $9.70 = $776,000
Work in Process, December 31, 2014: 25,000 units × ($6.00 + $3.20) = $230,000
The materials, stamping, and factory overhead have already been applied
to the 25,000 units. Only the direct assembly labor has yet to be applied
for these units.
17-26 © 2014 Cengage Learning. All Rights Reserved. May not be scanned, copied or duplicated, or posted to a publicly accessible website, in whole or in part.

Prob. 17–1B (FIN MAN); Prob. 2–1B (MAN)
a.
Materials 770,000
Accounts Payable 770,000
b.
Work in Process 604,200
Factory Overhead 75,800
Materials 680,000
c. Work in Process 574,000
Factory Overhead 182,000
Wages Payable 756,000
d. Factory Overhead 245,000
Selling Expenses 171,500
Administrative Expenses 110,600
Accounts Payable 527,100
e. Factory Overhead 24,500
Selling Expenses 28,420
Administrative Expenses 16,660
Prepaid Expenses 69,580
f. Factory Overhead 49,500
Depreciation Expense—Office Equipment 61,800
Depreciation Expense—Office Building 14,900
Accumulated Depreciation—Buildings and Equipment 126,200
g. Work in Process 568,500
Factory Overhead 568,500
h. Finished Goods 1,500,000
Work in Process 1,500,000
i. Cost of Goods Sold 1,375,000
Finished Goods 1,375,000
17-27 © 2014 Cengage Learning. All Rights Reserved. May not be scanned, copied or duplicated, or posted to a publicly accessible website, in whole or in part.

Prob. 17–2B (FIN MAN); Prob. 2–2B (MAN)
1. a.
Materials 147,000
Accounts Payable 147,000
b.
Work in Process 262,490
Factory Overhead 29,160
Materials 139,110
Wages Payable 152,540
c. Factory Overhead 6,000
Accounts Payable 6,000
d. Factory Overhead 4,100
Accumulated Depreciation—Machinery
and Equipment 4,100
e. Work in Process 40,480
Factory Overhead (1,012 hours × $40) 40,480
f. Finished Goods 175,090
Work in Process 175,090
Computation of cost of jobs finished:
Direct Direct Factory
Job Materials Labor Overhead Total
No. 101…… $19,320 $19,500 $6,160 $ 44,980
No. 102…… 23,100 28,140 6,400 57,640 No. 103…… 13,440 14,000 5,040 32,480
No. 105…… 18,050 15,540 6,400 39,990
Total…………………………………………………… $ 175,090
g. Accounts Receivable 189,100
Sales* 189,100
* $62,900 + $80,700 + $45,500
Cost of Goods Sold 142,610
Finished Goods 142,610
Computation of cost of jobs sold:
Job
No. 101………………………………… $ 44,980 No. 102………………………………… 57,640
No. 105………………………………… 39,990
Total…………………………………… $142,610
17-28 © 2014 Cengage Learning. All Rights Reserved. May not be scanned, copied or duplicated, or posted to a publicly accessible website, in whole or in part.

Prob. 17–2B (FIN MAN); Prob. 2–2B (MAN) (Concluded)
2. Work in Process Finished Goods
(b) 262,490 (f) 175,090 (f) 175,090 (g) 142,610 (e) 40,480
Bal. 127,880 Bal. 32,480
3. Schedule of unfinished jobs:
Direct Direct Factory
Job Materials Materials Labor Overhead Total
No. 104………………………… $38,200 $36,500 $9,520
No. 106………………………… 18,000 18,700 6,960
Balance of Work in Process, April 30…………………………………………………….
4. Schedule of completed jobs:
Direct Direct Factory
Job Materials Labor Overhead
$ 84,220
43,660
$127,880
Total
Finished Goods, April 30
$32,480 (Job 103)…………………… $13,440 $14,000 $5,040
17-29 © 2014 Cengage Learning. All Rights Reserved. May not be scanned, copied or duplicated, or posted to a publicly accessible website, in whole or in part.
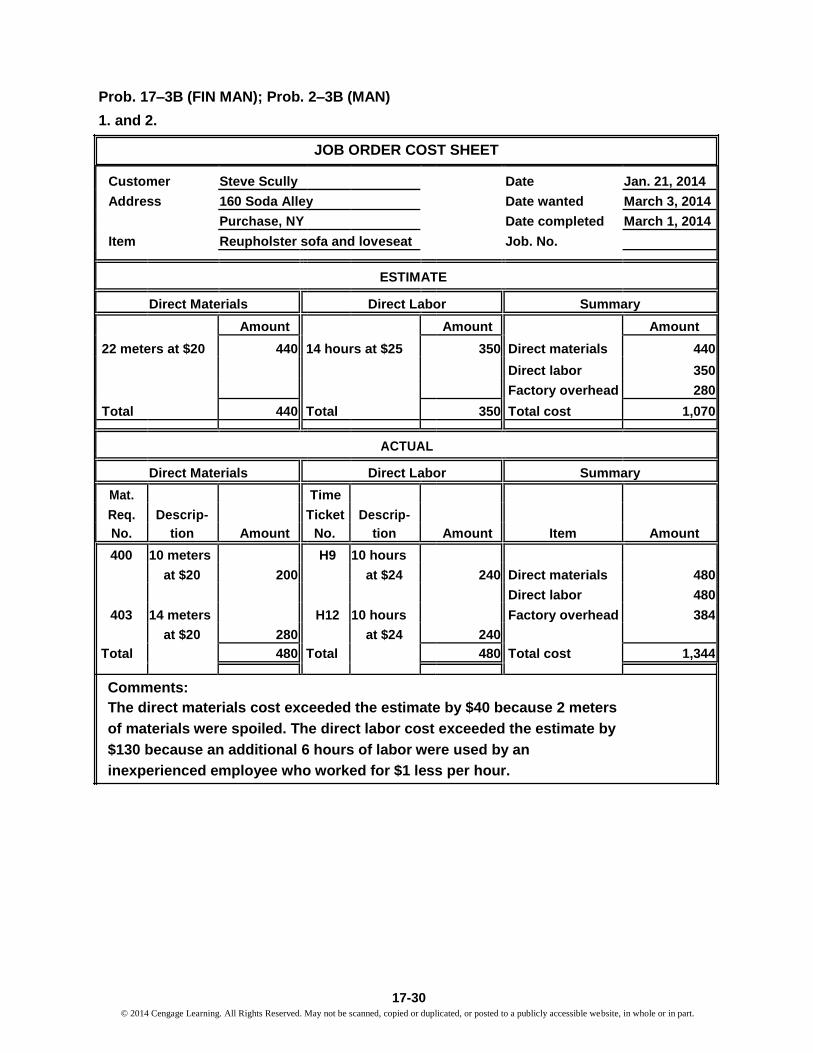
Prob. 17–3B (FIN MAN); Prob. 2–3B (MAN) 1. and 2.
JOB ORDER COST SHEET
Customer Steve Scully Date Jan. 21, 2014
Address 160 Soda Alley Date wanted March 3, 2014
Purchase, NY Date completed March 1, 2014
Item Reupholster sofa and loveseat Job. No.
ESTIMATE
Direct Materials Direct Labor Summary
Amount Amount Amount
22 meters at $20 440 14 hours at $25 350 Direct materials 440
Direct labor 350
Factory overhead 280
Total 440 Total 350 Total cost 1,070
ACTUAL
Direct Materials Direct Labor Summary
Mat. Time
Req. Descrip- Ticket Descrip-
No. tion Amount No. tion Amount Item Amount
400 10 meters H9 10 hours
at $20 200 at $24 240 Direct materials 480
Direct labor 480
403 14 meters H12 10 hours Factory overhead 384
at $20 280 at $24 240
Total 480 Total 480 Total cost 1,344
Comments: The direct materials cost exceeded the estimate by $40 because 2 meters
of materials were spoiled. The direct labor cost exceeded the estimate by
$130 because an additional 6 hours of labor were used by an
inexperienced employee who worked for $1 less per hour.
17-30 © 2014 Cengage Learning. All Rights Reserved. May not be scanned, copied or duplicated, or posted to a publicly accessible website, in whole or in part.

Prob. 17–4B (FIN MAN); Prob. 2–4B (MAN) 1. Supporting calculations:
May 1 Cost of
Job. No.
Work in Direct Direct Factory Total Unit Units Goods
Quantity Process Materials Labor Overhead Cost Cost Sold Sold
No. 101 330 $26,400 $ 82,500 $ 59,400 $ 29,700 $ 198,000 $600.00 264 $158,400
No. 102 380 46,000 105,400 72,600 36,300 260,300 $685.00 360 246,600
No. 103 500 132,000 110,000 55,000 297,000 0 0
No. 104 400 66,000 39,600 19,800 125,400 $313.50 384 120,384
No. 105 660 118,800 66,000 33,000 217,800 $330.00 530 174,900
No. 106 330 66,000 30,800 15,400 112,200 0 0
Total 2,600 $72,400 $ 570,700 $ 378,400 $ 189,200 $ 1,210,700 $700,284
A. $586,100. Materials applied to production in May + indirect materials.
($570,700 + $15,400)
B. $72,400. From table above and problem.
C. $570,700. From table above.
D. $378,400. From table above.
E. $189,200. ($378,400 × 0.50) and from table above.
F. $801,500. ($198,000 + $260,300 + $125,400 + $217,800)
G. $700,284. From table above.
H. $17,600. Wages incurred less direct labor applied to production in May.
($396,000 – $378,400)
17-31
© 2014 Cengage Learning. All Rights Reserved. May not be scanned, copied or duplicated, or posted to a publicly accessible website, in whole or in part.

Prob. 17–4B (FIN MAN); Prob. 2–4B (MAN) (Concluded)
2. May 31 balances:
Materials……………………… $ 19,500 ($105,600 + $500,000 – $586,100)
Work in Process*…………… $ 409,200 ($297,000 + $112,200, Job 103 & Job 106)
Finished Goods**…………… $ 101,216 ($801,500 – $700,284)
Factory Overhead…………… $ (7,300) Cr. overapplied ($26,400 + $17,600
+ $15,400 + $122,500 – $189,200)
* or ($72,400 + $570,700 + $378,400 + $189,200 – $801,500)
** Units in Unit Total Job. No. Inventory Cost Cost
Job 101 66 $600.00 $ 39,600 Job 102 20 685.00 13,700 Job 104 16 313.50 5,016 Job 105 130 330.00 42,900
Total $ 101,216
17-32 © 2014 Cengage Learning. All Rights Reserved. May not be scanned, copied or duplicated, or posted to a publicly accessible website, in whole or in part.
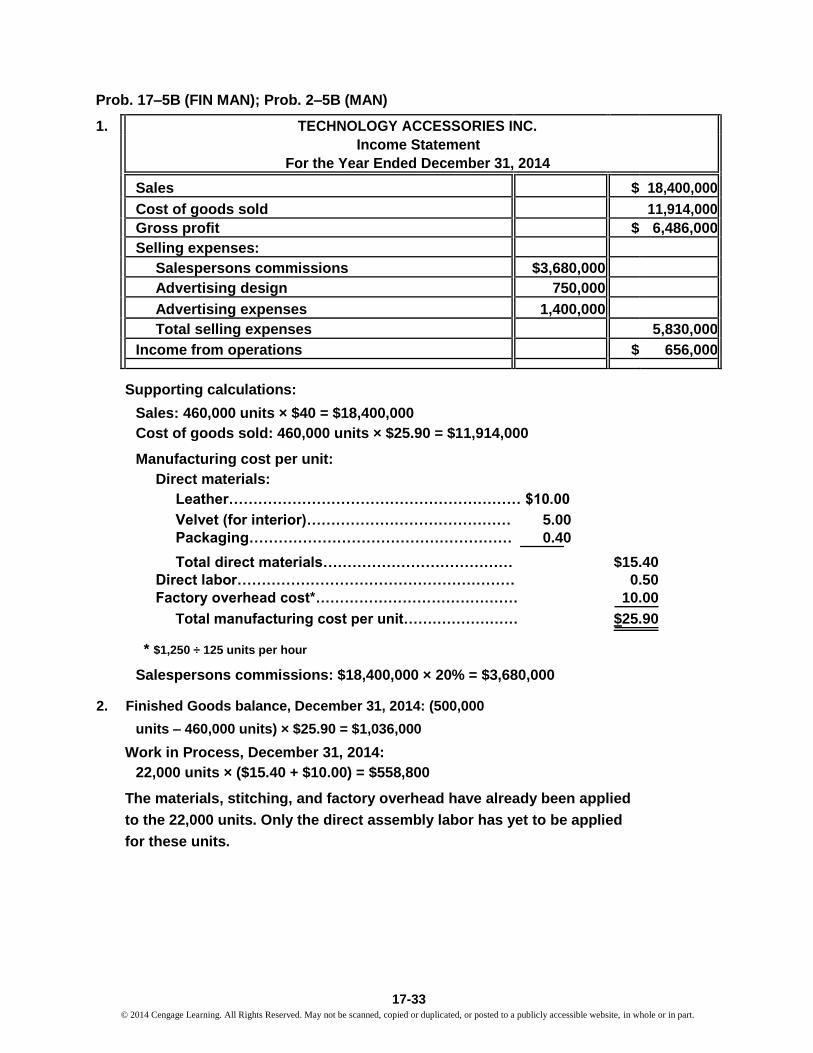
Prob. 17–5B (FIN MAN); Prob. 2–5B (MAN)
1.
TECHNOLOGY ACCESSORIES INC.
Income Statement
For the Year Ended December 31, 2014
Sales $ 18,400,000
Cost of goods sold 11,914,000
Gross profit $ 6,486,000
Selling expenses:
Salespersons commissions $3,680,000
Advertising design 750,000
Advertising expenses 1,400,000
Total selling expenses 5,830,000
Income from operations $ 656,000
Supporting calculations:
Sales: 460,000 units × $40 = $18,400,000 Cost of goods sold: 460,000 units × $25.90 = $11,914,000
Manufacturing cost per unit: Direct materials:
Leather…………………………………………………… $10.00 Velvet (for interior)…………………………………… 5.00
Packaging……………………………………………… 0.40
Total direct materials………………………………… $15.40
Direct labor………………………………………………… 0.50
Factory overhead cost*…………………………………… 10.00
Total manufacturing cost per unit…………………… $25.90
* $1,250 ÷ 125 units per hour
Salespersons commissions: $18,400,000 × 20% = $3,680,000
2. Finished Goods balance, December 31, 2014: (500,000
units – 460,000 units) × $25.90 = $1,036,000
Work in Process, December 31, 2014: 22,000 units × ($15.40 + $10.00) = $558,800
The materials, stitching, and factory overhead have already been applied
to the 22,000 units. Only the direct assembly labor has yet to be applied
for these units.
17-33 © 2014 Cengage Learning. All Rights Reserved. May not be scanned, copied or duplicated, or posted to a publicly accessible website, in whole or in part.

CASES & PROJECTS
CP 17–1 (FIN MAN); CP 2–1 (MAN) Two or three trends seem apparent. Starting with the most obvious:
a. There appears to be a strong ―Friday effect.‖ The unit cost on Friday
increases dramatically, then falls on Monday. Apparently, the
workforce is preparing early for the weekend. b. There also appears to be a general increasing trend in the unit cost.
Every Friday effect is larger than the previous Friday. Much the same can
be said about the other days of the week. c. It’s hard to tell, but there may also be a ―within week‖ trend. The unit
cost appears to increase gradually from Monday through Thursday,
before jumping on Friday. At the very least, Mondays are the best
operating days, while Fridays are the worst. A number of further pieces of information should be requested.
a. First, it would be good to verify these trends with some other products.
This trend is probably not product-related but related generally to the day
of the week. This would mean that the trend should be apparent in the
other products. b. The data should be sorted by shift and by employee. It’s possible that the
effect is stronger on one shift than on another or that just a few
employees are responsible for the effect. It may not be prevalent in the
general population of workers. c. The Friday–Monday phenomenon is likely related to the workforce, but the
same cannot be said about the larger increasing trend over the four
weeks. It could be caused by any number of factors. A good first look
would be to isolate materials costs to see if these are contributors. How
much of the effect is labor and how much is material should be verified.
It’s possible that the general increase in cost over time is the result of loss
of machine tolerances. Thus, more and more material is being required to
produce a unit of product. d. Has there been any significant change in supervisors or crucial
employees that may explain this effect? e. Have prices increased gradually for the raw materials?
17-34 © 2014 Cengage Learning. All Rights Reserved. May not be scanned, copied or duplicated, or posted to a publicly accessible website, in whole or in part.

CP 17–2 (FIN MAN); CP 2–2 (MAN) 1. The unit costs are influenced by both the price and quantity of inputs. On the
price side, the cost of steel has dropped from $1,200 to $1,100 per ton. This is
apparently the result of the purchasing manager’s decision to reduce the cost
of raw materials by going to a new vendor. No other input prices change.
Some of the input quantities changed for the worse. Specifically:
Input Quantity per Unit
Job 206 Job 228
Steel input……………………………………………… 2.10 tons1
2.60 tons2
Foundry labor…………………………………………… 8.00 hours3
10.00 hours4
Welding labor…………………………………………… 11.00 hours5
14.00 hours6
1
105 tons ÷ 50 units 2
195 tons ÷ 75 units 3
400 hours ÷ 50 units 4
750 hours ÷ 75 units 5
550 hours ÷ 50 units 6
1,050 hours ÷ 75 units
These numbers were determined by dividing the total input quantities by the
number of units produced to discover the inputs per unit. The inputs for the
components were unchanged between the two jobs. 2. A possible reason for this deterioration in performance is related to the
purchasing manager’s decision to change vendors in order to secure a
lower price per ton. The new vendor is apparently delivering a lower-quality
steel product to the company. As a result, the foundry operation is having to
spend more time forming the steel parts. Moreover, the increased steel tons
per unit is likely to be caused by scrapping some of the formed parts. The
scrapped parts would need to be replaced by additional steel inputs, which
would have the effect of increasing the number of tons required to make a
unit of product. The welding operators are also apparently having difficulty
welding the lower-quality steel parts. As a result, longer welding time is
required to assemble a completed unit.
Overall, management has learned that the drive for a lower raw materials
price was a poor decision. The overall net result was higher costs from
the additional waste caused by lower-quality steel.
17-35 © 2014 Cengage Learning. All Rights Reserved. May not be scanned, copied or duplicated, or posted to a publicly accessible website, in whole or in part.
CP 17–3 (FIN MAN); CP 2–3 (MAN) 1. The engineer is concerned that direct labor is not related to overhead
consumption because direct labor is a small part of the cost structure.
Apparently, the company has replaced labor with expensive machine
technology and support. This, of course, represents more factory overhead.
Just because the direct labor is ―designed out‖ of the product will not mean
that this overhead will magically disappear. More likely, the direct labor
hours should be replaced by machine-related factory overhead. Thus, the
factory overhead goes up while the activity base (direct labor) goes down.
Hence, the factory overhead rate will go up. 2. Since each direct labor hour now has $1,500 of factory overhead, small
mistakes in the direct labor time estimates can have a large impact on the
estimated cost of a product. This is very critical, since the company sets
selling price by adding a profit to unit cost. If the company underestimates
the direct labor content by a small amount, it will underestimate unit cost,
causing the company to underbid and win the job. Unfortunately, the job will
turn out to have less profitability than expected because the price is smaller
than it should be. If the company overestimates the labor time, it will overbid
the job. Thus, it will lose out to competitors who bid more accurately. This
puts the company into a lose-lose situation when such small labor time errors
have such large dollar impacts on the final cost estimate. 3. The engineer’s concern is valid. The company should consider replacing its
direct labor time activity base with one that more accurately reflects its
present resources. If the company is now highly automated, then machine
hours may be a much more reasonable activity base.
17-36 © 2014 Cengage Learning. All Rights Reserved. May not be scanned, copied or duplicated, or posted to a publicly accessible website, in whole or in part.

CP 17–4 (FIN MAN); CP 2–4 (MAN) 1. Todd should record the debits for factory wages as a debit to Work in Process. The
factory wages are product costs that must be accumulated in the cost of
producing the product. Eventually, these wage costs will become part of the
finished goods inventory and the cost of goods sold when the gift items are sold.
Likewise, the depreciation should be recorded as a debit to Factory Overhead. The
overhead is then applied to production work in process. Like the wages, the
depreciation will also eventually become part of the finished goods inventory and
the cost of goods sold when the gift items are sold. Thus, both the wages and
depreciation will end up on the income statement as part of the cost of goods sold,
not as individual expenses. The reason is because the accountant wants to match
revenues and costs. Costs that are accumulated in the manufacture of products do
not become expenses until the items are sold. Until that time, the costs are
capitalized as inventory. If these costs were expensed immediately, the period’s
income for the firm would be understated to the extent that there were any
increases in the work in process or finished goods inventories. 2. Jeff would not be concerned about immediately expensing administrative
wages and depreciation because the benefits received from these costs are
not product costs. Instead, these costs benefit a period of time. Thus, these
costs should be expensed during the period.
17-37 © 2014 Cengage Learning. All Rights Reserved. May not be scanned, copied or duplicated, or posted to a publicly accessible website, in whole or in part.

CP 17–5 (FIN MAN); CP 2–5 (MAN)
1. Direct labor cost:
Total actual (applied) overhead, 2010–2014……… $ 4,200,000
Total direct labor cost, 2010–2014………………… $21,000,000
Predetermined overhead rate
($4,200,000 ÷ $21,000,000)……………………… 20% of direct labor cost
Machine cost:
Total actual (applied) overhead, 2010–2014……… $ 4,200,000
Total machine hours, 2010–2014…………………… 500,000 hours
Predetermined overhead rate
($4,200,000 ÷ 500,000 hours)…………………… $8.40 per machine hour
17-38 © 2014 Cengage Learning. All Rights Reserved. May not be scanned, copied or duplicated, or posted to a publicly accessible website, in whole or in part.

CP 17–5 (FIN MAN); CP 2–5 (MAN) (Continued)
2.
2014 2013 2012
Direct Labor Machine Direct Labor Machine Direct Labor Machine
Cost Hours Cost Hours Cost Hours
Actual overhead $ 790,000 $790,000 $870,000 $870,000 $935,000 $ 935,000
Applied overhead 777,000 781,200 882,000 873,600 924,000 932,400
(Over-) underapplied
overhead $ 13,000 $ 8,800 $ (12,000) $ (3,600) $ 11,000 $ 2,600
2011 2010
Direct Labor Machine Direct Labor Machine
Cost Hours Cost Hours Actual overhead $845,000 $845,000 $760,000 $760,000
Applied overhead 840,000 843,360 777,000 769,440
(Over-) underapplied
overhead $ 5,000 $ 1,640 $ (17,000) $ (9,440)
17-39 © 2014 Cengage Learning. All Rights Reserved. May not be scanned, copied or duplicated, or posted to a publicly accessible website, in whole or in part.

CP 17–5 (FIN MAN); CP 2–5 (MAN) (Concluded) 3. The best predetermined overhead rate is machine hours. Although the total
overhead applied for each rate developed in part (1) is the same over the entire
five-year period (as a result of the method by which the predetermined
overhead rates were developed), the predetermined overhead rate based on
machine hours yields the least fluctuations in the amounts of over- or
underapplied overhead considered on a year-by-year basis. With the rate based
on machine hours, the over- or underapplied overhead ranges from $9,440
overapplied to $8,800 underapplied. This fluctuation in the over- or
underapplied overhead compares favorably with the fluctuation resulting from
using the current overhead base of direct labor cost ($17,000 overapplied to
$13,000 underapplied over the past five years).
17-40 © 2014 Cengage Learning. All Rights Reserved. May not be scanned, copied or duplicated, or posted to a publicly accessible website, in whole or in part.