chapter 2 literature review -...
TRANSCRIPT
8
CHAPTER 2
LITERATURE REVIEW
2.1 INTRODUCTION
Studies on the behaviour of anchors against uplift force were
started way back in the 1960s. Initially the pullout capacity of anchors was
predicted from the test results on anchor for transmission line towers
(Giffels et al 1960; Ireland 1963; Adams and Hayes 1967). Later on the
prediction were based on the results on 1g model and centrifuge model
studies. Over a period of the last four decades research work in this area was
carried out extensively, in order to understand the real mechanism of failure
of anchors against uplift force. Numerous theories were developed, mostly
based on limit equilibrium method by using assumed / observed failure
surfaces. With the vast knowledge on the uplift capacity of anchor,
researchers have concentrated mainly on improving the uplift capacity of the
anchors. Although several attempts have been made for evolving a method for
improving uplift capacity of the anchor, the use of geosynthetics material in
the field of geotechnical engineering showed a new approach in enhancing the
uplift capacity. However the works reported on improving the uplift capacity
of the anchors using reinforcement in soil bed are limited and little is known
about their failure mechanism.
In this chapter, the literature is reviewed in the following sequence.
Studies on plate anchors embedded in sand bed
Studies on plate anchors embedded in reinforced sand bed
9
Studies on plate anchors embedded in submerged sand bed
Studies on behaviour of anchor under cyclic load
2.2 STUDIES ON PLATE ANCHORS EMBEDDED IN SAND
BED
Varieties of anchors are developed and deployed in the field to
meet the needs of growing anchorage problems. Scanning through the various
types of anchors and the field applications, the present study focuses on plate
anchors, which are considered to be one of the most popular varieties of
anchors, which are extensively used in various types of onshore and offshore
construction and maintenance works. They represent an economically better
alternative to gravity and other embedded anchors for resisting uplift forces
(Bouazza and Finlay 1990). Many researchers have worked with the anchors
subjected to uplift of plate anchors buried both in cohesionless and cohesive
soils. The works carried out to predict the uplift behaviour of anchors in
cohesionless soils under monotonic and cyclic loading conditions are being
reviewed.
Uplift theories are generally based on assumed failure surfaces.
Marston (1930) developed the first rational approach of loads on buried
conduits by assuming a vertical slip surface having a width equal to that of the
diameter of the pipe embedded. The pullout capacity was computed by
considering the frictional resistance along this surface and the weight of soil
bounded within the failure surfaces. However, his analysis exhibited the
behaviour entirely different from the experimental results as well as from the
other investigators (ex: Trautmann et al 1985).

10
Majer (1955) used a simple failure mechanism to estimate the uplift
capacity of footing. In this method, a cylindrical failure surface (Figure 2.1)
having a diameter equal to that of the anchor width was assumed and the
pullout capacity was computed by considering the weight of soil within the
failure zone and the friction developed along the failure surface.
D
H
uP
W
P = 12(K H )2
Figure 2.1 Assumed failure mechanism by Majer (1955)
Mors (1959) assumed a truncated cone extending from the base of
the anchor upto ground level. The pullout capacity of anchor was assumed to
be equal to the weight of the soil mass within the truncated cone (Figure 2.2).
Both the above methods did not differentiate between shallow and deep
anchor failures. The cone method suggested by Mors was found to be
conservative for shallow anchors but quite opposite at larger depths
(Turner 1962).

11
D
H W
Pu
Figure 2.2 Soil cone geometry (Mors 1959)
Balla (1961) developed an analysis to estimate the breakout
resistance of foundation for pylons supporting electrical power lines. From
the laboratory model tests, the author found that the failure surface resembles
an arc of a circle having radius r = (H-h') / sin (45 - /2), with its tangent
making 90º with the horizontal at the base and (45- /2) at the ground level as
shown in Figure 2.3, where H is the depth of embedment and h' is the
thickness of anchor. Baker and Kondner (1966) based on their experiments on
circular plate anchors in dense ( = 42º) Ottawa sand concluded that for
H/D<6 (D = diameter of anchor), the appearance of circular failure surface is
distinct. For deep anchors (H/D>6), the failure surface is different and the
analysis of Balla (1961) could be used for anchors of H/D ratio less than 6.
Sutherland (1965) found that the mode of failure varied also with the density
of sand and showed that Balla’s analytical approach estimated pullout
capacity reasonably well in sands of loose to medium density.

12
B
H
W
P
rh'
pu
Figure 2.3 Circular arc failure surface assumed by Balla (1961)
Meyerhof and Adams (1968) conducted several laboratory tests to
study the uplift behavior of circular and strip plate anchors in loose and dense
sand beds. It has been emphaised that there exists a critical embedment depth
after which the breakout factor remains constant. The behaviour of both dense
and loose uniform sand was observed in semi-spatial using time exposure
photographs. In dense sand at shallow depth, a distinct slip surface occurs
which extends in a shallow arc from the anchor edge to the surface. At greater
depth the failure surface is lees distinct being initially curved and then
essentially vertical and extending to the surface. In the loose sand, at larger
depth, the failure surface was essentially vertical and limited to a short
distance above the anchor whereas at shallow depth the failure surface was
again essentially vertical but extending to the ground surface. Figure 2.4
illustrates the two distinct modes of failure depending on the depth of
embedment, namely shallow and deep embedment. For shallow embedment
the average angle of failure surface with the vertical, in sands, for strip anchor
varies between about /3 and 2/3. Equations were proposed to estimate the
total uplift capacity of anchors in c- soil for shallow and deep embedment.

13
D
F
H
Pp
F
C CH
HW
O
C
P
Pp F
P
CF
c
u
Shallow Deep
Figure 2.4 Shallow and Deep anchor under uplift load assumed by
Meyerhof and Adams (1968)
For shallow embedment (where the failure surface reaches ground
surface)
2pu pP 2cH H K tanδ W (2.1)
For deep embedment (where the failure surface does not reach
ground surface)
puP 2cH (2H H )H K tan W c c c u (2.2)
where Ppu - ultimate uplift capacity
Hc - critical embedded depth
H - total embedded depth
c - cohesion along the vertical plane through footing edge
- density of back fill
Kp - coefficient of passive earth pressure
- angle of total passive earth pressure component in
horizontal
14
D
H
r
WW/2 W/2
qo
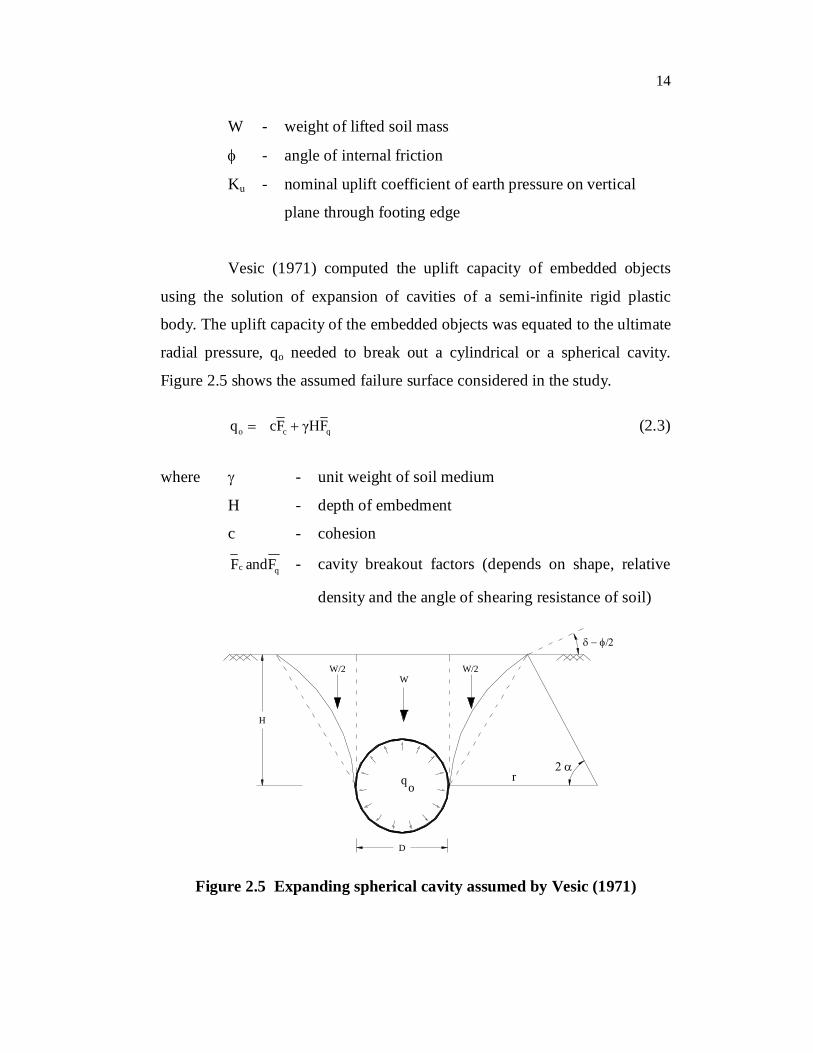
W - weight of lifted soil mass
- angle of internal friction
Ku - nominal uplift coefficient of earth pressure on vertical
plane through footing edge
Vesic (1971) computed the uplift capacity of embedded objects
using the solution of expansion of cavities of a semi-infinite rigid plastic
body. The uplift capacity of the embedded objects was equated to the ultimate
radial pressure, qo needed to break out a cylindrical or a spherical cavity.
Figure 2.5 shows the assumed failure surface considered in the study.
o c qq cF γHF (2.3)
where - unit weight of soil medium
H - depth of embedment
c - cohesion
c qF andF - cavity breakout factors (depends on shape, relative
density and the angle of shearing resistance of soil)
Figure 2.5 Expanding spherical cavity assumed by Vesic (1971)

15
For deep anchors Vesic (1971) equated limiting cavity pressure to
the uplift resistance and proposed the following equation.
cpu qp = cF + HF (2.4)
where ppu - ultimate pressure for expansion of a deep cylindrical
cavity
c qF and F - cylindrical cavity factors
Vesic also compared his theoretical solutions with the experimental
results of various researchers and found that the breakout factors increased
with depth only at shallow depths. For each soil there was a critical relative
depth beyond which the anchor plate behaved as a deep anchor.
Das and Seeley (1975a, b) conducted laboratory model tests on
loose sand bed (γ=15.1 kN/m3 and =31º) using aluminum plate anchors for
various length to width ratios. Variation of breakout factor and critical
embedment depth with length to width ratio of plates were studied. The
critical embedment ratio of rectangular plate was higher than that of square
plate and also it increased with the aspect ratio of the plate.
Rowe and Davis (1982) studied the behaviour of anchor plates
using an elasto-plastic finite element analysis, where the influence of soil
dilatancy (R), initial stress state (Rk) and anchor roughness (RR) were
studied. Effect of anchor embedment, angle of shearing resistance and the
roughness of anchor base were also investigated in this study. The anchor
plate was assumed to be perfectly rigid and weightless. The soil was assumed
to satisfy the Mohr-Coulomb failure criterion and either an associated flow
rule or a non-associated flow rule. Analysis involving straight rupture

16
surfaces at an inclination to the vertical equal to the dilatancy angle () was
proposed by Vermeer and Sutjiadi (1985).
Trautmann et al (1985) conducted tests on steel pipe having an
outside diameter of 102 mm and a length of 1.2 m embedded in sand bed,
with a view to study
(i) maximum uplift resistance as a function of pipe depth and soil
density
(ii) variation of load – displacement behaviour in terms of density
and embedment ratio.
(iii) the force-displacement behaviour as a mathematical function
(iv) the comparison of observed results with the previously
published research works.
Based on the experimental findings, they concluded that the force-
displacement relationship can be modeled by a rectangular hyperbola as
examined by Das and Seeley (1975b). The hyperbolic relationship is given by
F* = Z*/(0.07+0.93Z*) (2.5)
where F* - normalized force (Pu/ HDL)/Nq
Nq - breakout factor (Ppu / HDL)
Z* - normalised displacement = (/D)/ (*/D)
- displacement
* - displacement at peak load.
Pu - force measured at each increment of displacement
Ppu - peak load
- unit weight of soil
H - depth of embedment

17
bdH
B or D
a
F
Ww
W
puP
a
c
F
bc b
D - diameter of pipe
L - length of pipe
Using this relationship and appropriate values of Nq and (*/D), a
force displacement relationship can be constructed for any combination of
pipe diameter, depth and density.
Murray and Geddes (1987) examined the pullout resistance of
anchor plates in dense and medium dense, dry cohesionless sands through
laboratory tests on 50.8 mm wide rectangular anchor with L/B ratio between
1 and 10 and circular anchors of 50.8 and 76.2 mm diameter. The effect of
size, shape, depth of embedment and roughness of plate and the density of
sand were studied. The results of laboratory tests were compared with
theoretical solutions developed based on limit equilibrium for strip and
circular anchors. Figure 2.6a illustrates the failure mechanism considered for
the limit equilibrium analysis and Figure 2.6b describes the mechanism
considered in limit analysis. On the basis of limit equilibrium approach, they
developed the following equations for strip and circular anchors.
Wbd - weight of soil vertically above the anchor plate Ww - weight of soil contained in wedge abc
Figure 2.6a Definition of parameters in limit equilibrium analysis
(Murray and Geddes 1987)

18
kZ
Z
1
0
01 (
()
Z
B or D
H
1
01
B or D
H
0
Figure 2.6b Limit analysis solution (Murray and Geddes 1987)
For strip anchor,
puP H= 1+ (sin +sin( /2))BH B
(2.6)
For Circular anchor,
puP 2 21 sin sin 1 tan 2 sinAH 2 3 2
H HD D
(2.7)
where Ppu - ultimate uplift resistance of circular anchor or ultimate
uplift resistance per unit length of strip anchor
A - plan area of circular anchor
B - width of rectangular anchor
D - diameter of circular anchor
H - depth of embedment
- angle of shearing resistance
γ - unit weight of soil.
The ultimate uplift resistance of a strip anchor based on limit
analysis was represented by the following non-dimensional relation

19
puP H tan tan1BH B tan tan(
w
w
(2.8)
where w ( - ) 0
Ppu - the ultimate uplift resistance per unit length of plate
- unit weight of soil bed
B - breadth of anchor plate
H - depth of embedment
- angle made by the force F, to the normal of the failure
plane
- angle made by the tangent to the vertical
w - inclination of the resultant forces Ww and F to the
horizontal in Figure 2.6a
In practice, average value of and taken as /2 and w as 3/4
and can be rewritten as
puP H1 sin sinBH B 2
(2.9)
Lower bound solution fetched a poor lower bound value, since the
yield condition cannot be violated anywhere and equilibrium should be
maintained throughout the soil mass. Equating the work done by the external
forces to the dissipation of energy, for cohesionless media, the following
upper bound solution was obtained
puP H tan( )tan(β ) tan tan(β )1BH B tan( ) tan(β )
(2.10)

20
The theoretical solution for strip anchors yields greater value with
the experimental results, due to its inability to describe the stress history or
degree of over consolidation during sand packing.
Tagaya et al (1988) determined the uplift capacity of plate anchor
in medium to dense sand bed based on theory of plasticity and compared with
the existing theories. The ultimate pullout resistance on a two-dimensional
(strip) anchor buried at shallow depths in sand at any angle was expressed as
21 HP k A (W W )cosαpu b s A2 B
(2.11)
where Ppu - ultimate pullout resistance of shallow anchor
- effective unit weight of soil
H - maximum depth of anchor
B - width of anchor
kb - uplift coefficient of shallow anchor
A - area of anchor
Ws - effective weight of soil above anchor
WA - effective weight of anchor
- inclined angle of anchor
The failure mechanism of a deep horizontal anchor was very
similar to that of the point bearing capacity of a pile, as shown in Figure 2.7.
Concept of cavity expansion was used to analyse the point bearing of the
anchor. The ultimate pullout resistance was determined as:
2pu
π πP = σ tan + exp -θ tan4 2 2
(2.12)
where Ppu - peak pullout resistance of deep anchor
q= q F

21
H
Plastic zone
IIIIPlastic zone
B
III
I
A
III
CD
P
E I Highly compressed zoneII Radial shear zoneIII Plastic zone
pu
q - mean effective ground stress of the plastic zone III
qF - cavity expansion factor (Vesic 1971)
- angle of shearing resistance
It was found that the value of breakout factor was increasing
linearly in the case of shallow embedment and embedment depth more than
the critical embedment depth, the breakout factor was almost constant. The
shape effect of the rectangular anchor was established, to arrive at its capacity
from the capacity of strip anchor.
Figure 2.7 Physical plane of a rupture of deep anchor
(Tagaya et al 1988)
Dickin (1988) investigated the uplift capacity of a one metre wide
strip anchor in cohesionless soil using centrifuge at the Liverpool University
on 25mm model anchor plates with aspect ratios L/D = 1, 2, 5 and 8 at
embedment ratios upto 8 in both loose and dense sands by subjecting the
model to centrifugal acceleration of 40g, where g = acceleration due to
gravity, enabling the behaviour of one metre wide prototype anchor to be

22
investigated. On the basis of the experimental results, Dickin (1988)
concluded that,
i. the breakout factor increases significantly with anchor
embedment depth and soil density but decreases with
increased aspect ratios.
ii. displacement corresponding to failure also increases with
embedment but reduces with increased relative density.
iii. the shape factor is relatively insensitive to anchor size but
increases with both embedment ratio and soil density.
Frydman and Shaham (1989) conducted experiments to find out the
uplift capacity of horizontal rectangular slab anchor in sand and proposed the
following equations.
For dense sand,
puH ((B/L)-0.15) HP = 1+ tan 1+ 0.51+2.35logB (1-0.15) B
(2.13)
For loose sand
pu
H (B/L)-0.15P = 1+ tan 1 0.5B 1-0.15
(2.14)
where Ppu - uplift capacity
γ - unit weight of soil
H - depth of embedment
B - width of the slab
L - length of the slab
- angle of shearing resistance

23
Ilamparuthi (1991) carried out detailed experimental investigation
on plate anchor of three different shapes embedded in cohesionless soil.
Based on the failure mechanism observed from experiments conducted on
both shallow and deep anchors, the following equations to compute the
pullout capacities were proposed.
Shallow anchor
2 2pu
2
HP = D +D(D+2Htan ) + (D+2Htan ) +12
H 2H(D+ tan )(sin +Kcos )tan )2 3
(2.15)
where Ppu - uplift capacity
- /2
K - 1/tan(3/2)
- unit weight of soil
H - depth of embedment
D - diameter of circular anchor
- angle of shearing resistance.
Deep anchor
2 2pu
2
p
DP = D +D(D+2 Dtan ) + (D+2 Dtan )12
(D+2 Dtan ) (H- D)4
D 2H- D D+ Dtan sin + K cos tan2 3
x x x
x x
x x x
(2.16)
where - 0.8
Kp - passive earth pressure co-efficient
x - value depends on the density and depth of embedment of
anchor.

24
Semi active / Rest zoneH
O
B
O'G
L'
A
Rankine passive zone
E'
Ppu
q
Rankine passive zone
E 45 -/2
L
Subbarao and Jyanth Kumar (1994) developed a theory using the
method of characteristics coupled with a log-spiral failure surface for
determining the vertical uplift capacity of shallow strip anchors in c- soil.
Figure 2.8 demonstrates the failure mechanism during uplift as assumed by
Subbarao and Jyanth Kumar (1994). Uplift capacity factors Fc, Fq and F have
been established as a function of embedment ratio and angle of internal
friction. The theory proposed was found to predict pullout capacity accurately
in loose and medium dense sand, but it was found to be conservative in case
of dense and very dense sand.
Figure 2.8 Failure mechanism assumed by Subbarao and Jyanth
Kumar (1994)
The ultimate pullout load, Ppu per unit length of the strip anchor is
written as
2u R c qP -W = cF B+qF B+o.5 B F (2.17)
where Pu - ultimate pullout resistance of anchor
c - cohesion of soil mass
WR - weight of rectangular portion of the soil mass over the
anchor plate
- unit weight of soil mass

25
B - width of anchor
Fc, Fq, F - uplift capacity factors corresponding to cohesion,
surcharge and unit weight respectively
Jyanth Kumar (2004) proposed solution for finding the uplift
capacity of anchors embedded in associated and non-associated flow mass.
The analysis involved the calculation of uplift resistance from the static
equilibrium and theory of energy balance. It was found that both the static
equilibrium and energy balance were found to give same results. The
limitation of the theory is that it is valid only for shallow anchors, where the
rupture surface extends upto the ground surface.
Subbarao and Manjunatha (2004) proposed a theory based on
method of characteristics for estimating the uplift capacity of circular and
strip anchors. The theory was derived based on the assumption that the failure
surface from the edge of the anchor plate is an arc of log spiral and its tangent
at the ground surface is inclined at an angle of (45-/2) with the horizontal. It
was assumed that the soil at each and every point on the failure surface
follows Mohr-Coulomb failure criteria. The proposed theory was validated
with other available theories and it was found that the prediction from the
present theory matched well with earlier methods for higher embedment
ratios, while it underestimated the pullout capacity for lower embedment
ratios.
Dickin and Laman (2007) studied the physical and computational
investigation on uplift response of strip anchors in sand. In this study the
anchors used for centrifuge tests were 25mm wide, 3mm thick stainless steel
model anchor plates with aspect ratios, L/B = 1, 2, 5 and 8 at embedment
ratios (H/B) from 1 to 8 in both dense and loose sand beds. The model anchor
plates were subjected to acceleration of 40 g in flight, and therefore
26
experienced stress levels similar to those around 1m wide prototype anchors.
Separate tests were carried out at each embedment ratio to determine the
pullout load of the tie rod alone to made correction in the total uplift load.
However the correction due to tie rod was generally less than 5% of the total
uplift load. Numerical analysis was performed on centrifuge model tests
conducted using PLAXIS finite element code and the failure mechanism of
both shallow and deep anchors was compared with the failure pattern
observed by Ilamparuthi et al (2002).
From the study the authors concluded the following:
Both the physical and computational studies show that breakout
factors for 1 m wide strip anchors increase with anchor embedment ratio and
sand packing.
Agreement between breakout factors from the centrifuge tests and
PLAXIS results based on a computed displacement of 0.2 m is excellent for
anchors up to embedment ratio of 6. Some divergence occurs for deeper
cases.
To facilitate the determination of uplift capacity simple expressions
are presented by various investigators which are summarized in Table 2.1.
Scanning through the literature review it is observed that attempts
were made by several researchers to understand the behaviour of plate
anchors and failure surfaces in the determination of uplift capacities. In a
similar way the peak pullout load is expressed in terms of a dimensionless
parameter called the breakout factor. The methodology adopted to formulate
the equation for determination of the breakout factor by various researchers is
summarised in Table 2.1.

27
Table 2.1 Summary of Design Methods proposed by various Researchers
Researcher Method of
analysis Formulation
Majer (1955) Vertical slip surface
Nu = 1+2K (H/D) tan
Balla (1961) Tangential-curve slip surface
Nu = (F1 + F3) (4/ ) (H/D)2 where F1 and F3 are dependent on and and obtained from chart provided by the author
Meyerhof and Adams (1968)
Pyramidal – shaped
slip surface
Nu = 2 (H/D) Ku1 tan Sf + 1 where
Ku1 = 0.95 for 30o < <45o and Sf is the
shape factor dependent on .
Vesic (1971) Cavity-expansion model
Chart of Nu in terms of and H/D is provided in Das and Yang. (1987)
Clemence and Veesaert (1977)
Inverted cone slip surface;
cone angle with vertical = /2
Nu = [1 + (H/D)tan( /2)]2 + 4K tan
cos2 ( /2) [1/2(H/D)2 + 1/3 (H/D)2
tan (/2)]
Andreadis et al (1981)
Derived from model and field tests on anchor
Chart of Nu in terms of and H/D provided by the authors
Rowe and Davis (1982)
Finite element analysis giving uplift capacity of strip anchors
Nu = FR RkRR where F R is a function of and H/D. Rk and RR may be taken from charts provided by the authors; Nu for a circular anchor may be obtained by applying suitable shape factor Sf. (eg. Dickin 1983)
Murray and Geddes (1987)
Inverted cone slip surface; cone angle =
Strip anchor
Nu = 1 + (H/B) tan

28
Table 2.1 (Continued)
Researcher Method of
analysis Formulation
Ghaly et al (1991a)
Inverted cone slip surface
Nu = (4/3 D2 [(D+H tan )2] +(2HKp1/D2)
[(D+L tan /cos ] x tan1,
where Kp1 = (1+sin1) / (1-sin1)
1 = Average mobilized angle of shearing resistance kp
1= modified earth pressure coefficient
Ilamparuthi (1991)
Truncated frustum of cone
For shallow anchor
2u
1 2H 2H= 1+(1+ tan ) +(1+ tan )3 D D
2H 2H+ (1+ tan )(sinθ +Kcos ) tanD 3D
N
where = /2 K = 1/tan(3/2)
where Nu - breakout factor; H - embedment depth
D - diameter of anchor - peak friction angle
- dilatancy angle - unit weight of soil
K - coefficient of lateral earth pressure ID - relative density
2.3 STUDIES ON PLATE ANCHORS EMBEDDED IN
REINFORCED SAND BED
The capacity of anchors embedded in soil against uplift is equal to
the sum of the weight of soil within the failure zone and frictional resistance
along the failure surface. In some cases the capacity of anchor of given size is
inadequate to develop required capacity. Increase in size and depths of
embedment of anchor are possible alternative methods to improve the uplift
capacity but the capacity is not in proportion to the increased size of anchor.
The increasing use of anchors to resist uplift forces of higher magnitude
29
necessitated the development of suitable and economical alternative
techniques. However reported research work on the enhancement of pullout
capacity of buried anchors is very limited. In the last few years, some
researchers have attempted to enhance the pullout capacity of anchors by the
inclusion of geosynthetic reinforcement in sand (Subbarao et al 1988;
Selvadurai 1989, 1993; Krishnaswamy and Parashar 1991, 1994; Ilamparuthi
and Dickin 2001a,b and Swami Saran and Rao 2002). These works are
reviewed in this section.
Subbarao et al (1988) reported the improvement in pullout capacity
by using geotextiles as ties to anchor embedded in sand. Tests were conducted
on reinforced concrete model anchors of cylindrical and belled shapes.
Polypropylene ties of width 55 mm and of thickness 0.72 mm were used. Ties
for cylindrical and belled anchors were 650 mm and 350 mm in length
respectively, and were connected at several levels using steel clamps. At each
level six strips were connected to the model and spread radially with an angle
of 60 between them. Results indicated that the anchors with geotextile ties
offered greater uplift resistance than those without ties. Furthermore, the
provision of a single layer of ties close to the anchor was reported to be more
effective than the use of multiple layers.
Selvadurai (1989) studied the performance of uplift resistance of
buried pipelines by the use of geogrid in sand bed. Experiments were made on
150 mm diameter and 850 mm length pipe section. The rate of loading was
maintained approximately at 0.02 mm/sec. It was shown that the judicious
incorporation of geogrids can lead to a substantial increase in uplift capacity
of the buried pipeline section. The increase in uplift capacity of the reinforced
system can be of the order of 100% when considering the peak loads and
nearly 250% on ultimate load capacity at large displacement. Further, it is
emphasised that the ductility of the system can also be increased. It is

30
foreseen that as the diameter of the pipe increases, the contribution from the
geogrid will represent a smaller fraction of the uplift capacity of the
reinforced system, the maximum capacity of the geogrid will be the governing
factor. In order to determine the contribution towards the uplift resistance due
to the inclusion of geogrid, the author developed an equation using the theory
of Meyerhof and Adams (1968) as modified by Das and Seeley (1975a,b).
The author considered that pipeline uplift capacity comprised two additive
components, the ultimate capacity of the pipe section in unreinforced soil, and
the limiting resistance generated by the geogrid reinforcement against pullout
at the soil/geogrid interface. Assuming no construction effects, these
components were defined by the following equations :
pr p P P
P P u P P P P
P = γ D d L
D /d K tan 2m D /d +1 d /L +1 +1
(2.18)
2 2r P 0P = γ L H - D 2 - sin 1- cos2α tanδ (2.19)
where Ppr - ultimate capacity of pipe section in reinforced soil
Pr - limiting resistance generated by the reinforcement
Dp - depth of embedment to the top level of the pipe
. dp - pipe diameter
Lp - length of pipe section
Ku - uplift coefficient
m - Meyerhof and Adams’ coefficient
H - maximum depth of geogrid,
Do - the depth to the underside of the pipe
α - geogrid inclination to the vertical
' - effective unit weight of soil
δ' - effective angle of friction at the soil/geogrid interface.

31
Even though equation 2.19 is very approximate and thus has
limitations in predicting the uplift contribution of the geogrid inclusion, the
mathematical approach adopted provides a basis upon which the resistance
due to reinforcement might be determined. However, in subsequent
investigations, (Selvadurai 1993), involving the uplift behaviour of
CONWED STRATAGRID anchored pipelines in granular soil, Equation 2.19
was not validated against experimental findings.
Selvadurai (1993) extended the research on anchored pipeline by
using conwed strata grid as reinforcement in granular soil bed. The pipe used
in those series of tests was 215 mm in diameter and 1610 mm in length. The
controlled movement was achieved by a servo-controlled hydraulic actuator
which exerts a controlled rate of uplift movement. The increase in the peak
uplift loads was of the order of 80% in both fine grained and coarse grained
granular soils. One of the most important observations reported based on the
experiments was that the reinforcement maintained increased pullout load
with increase in displacement which was in contrast to the performance of
unreinforced system, wherein significant reduction was observed beyond the
peak load.
Krishnaswamy and Parashar (1994) studied the uplift behaviour of
plate anchors embedded in cohesive and cohesionless soil medium, with and
without geosynthetics. The type of geosynthetics, the ratio of the area of
geosynthetics inclusion to the area of the plate anchor, the depth of
embedment, the type of soil, the strain rate and the position of the water table
were found to have significant effects on the uplift behaviour of the plate
anchors. Four different configurations of the geosynthetics inclusion were
conducted as shown in Figure 2.9 and placing the geosynthetics directly on
the top (configuration C) of the metallic anchor was proved to be beneficial in
achieving maximum increase in the uplift capacity. It has been further

32
B
B
d
Pr
Configuration A Configuration B Configuration C Configuration D
rP Pr Pr
H
bd
r
documented that use of wider mesh opening did not result in substantial
increase in the uplift capacity of anchor since effective surface contact area
between geogrid and sand media was lesser. Incase of the deep plate anchors
the geosynthetics inclusion changes the failure pattern from local failure to
general failure and the failure surface reaches the ground surface. Also,
geosynthetics layer increases the effective area of anchorage.
Figure 2.9 Different configuration of the geosynthetics inclusion
(Krishnaswamy and Parashar 1994)
Ilamparuthi and Dickin (2001a) studied the behaviour of belled pile
to the pullout load in the reinforced sand bed. Tests were conducted in a
square tank with inner dimensions 760 mm 760 mm 900 mm. Model piles
with diameters 60, 80 and 100 mm were reinforced with the NETLON
geogrid (CE-121). The tests were displacement controlled at a constant rate of
1.25mm/min by placing the base of the pile in the geogrid reinforced gravel
layer. Five different arrangement of reinforcement as shown in the
Figure 2.10 were tested by the authors.

33
Sand (without reinforcement)
D = 3D
Geogrids
Gravel
75mm
75mm
75mm
50mm
50mm
R
Figure 2.10 Various arrangements of reinforcement (Ilamparuthi and
Dickin 2001a)
The variation of pullout load with displacement for the various
arrangements of reinforcement are compared with the test results for models
in unreinforced sand in Figure 2.11. The load displacement behaviour of the
model embedded in a gravel layer within the sand was similar to that for one
embedded in homogeneous sand. The inclusion of gravel layer increased the
uplift resistance due to the higher interlocking friction and less rolling and
sliding friction in gravel than in sand in the prepeak and residual phases. The
load-displacement relationship of belled piles in reinforced sand at shallow
depth was characterized by three-phase behaviour, namely
Prepeak behaviour, which shows rapid increase in resistance.
Post peak behaviour, which shows a slight gradual decrease in
resistance with further displacement similar to strain softening
behaviour.
Post peak behaviour beyond a lower peak where either the
resistance increases with displacement (Similar to strain
hardening behaviour in mild steel) or is maintained without
any appreciable reduction (as in ductile materials).

34
The higher uplift resistance obtained in the geogrid cell
reinforcement was attributed to a combination of the following :
i. the larger contact area between the geogrid cell and the soil.
ii. the soil mass mobilized to withstand pullout is much higher
than in the unreinforced condition.
iii. the frictional resistance along the periphery of geogrid cell.
iv. the dilation of the gravel particles within the geogrid cell
during uplift will tend to increase the lateral confinement and
hence the uplift capacity of the pile.
100
200
300
400
500
600
00 5 10 15 20 25 30 35 40
Pile in gravelPile in geogrid cell
Pile in sand
Medium - dense granular soilD = 100 mmL/D = 3
Pullo
ut lo
ad,
(N)
Displacement, (mm)
Figure 2.11 Comparison of uplift behaviour for various arrangements of
reinforcement (Ilamparuthi and Dickin 2001b)
Moreover the computation of lateral extent of surface heave by
considering the rupture surface is a plane surface and emerges from the pile
base at angle of /2 is in agreement with the surface heave observed by visual
judgment in the reinforced case. Further more, it was observed that the uplift
capacity of the pile increased more than 7 times the unreinforced condition in
shallow depth in loose sand and 25% in case of deeper belled piles in dense

35
sand. This can be made use of in foundations, which are designed to
withstand large displacements, and those designed for the repetitive loading
environment.
A more extensive study was conducted by Ilamparuthi and Dickin
(2001b) and the breakout factors from a series of tests on model belled piles
on various model geometries and sand densities were examined. Breakout
factor, Nr, for piles embedded in reinforced sand beds was initially computed
using the well established equation
prr
PN =
AH (2.20)
where Nr - breakout factor in reinforced sand bed
Ppr - peak pullout load in reinforced sand bed
- unit weight of sand bed
A - area of anchor
H - depth of embedment
However the breakout factors obtained from the above equation
(2.20) for pile/geogrid reinforcement system decreases with an increase in the
pile bell diameter irrespective of the sand packing. In view of complexity of
the soil-geogrid cell interaction, breakout factors were computed from
Majer’s simple theory. It was found that assuming a lateral earth pressure
coefficient, K = 0.8(Kp)1/2, where Kp is the Rankine earth pressure coefficient,
gave a good overall fit to the experimental data. Also the relationship between
the pullout load and the displacement was modeled using hyperbolic
transformation as,
r
pr Q Q r
P =P c + m )
(2.21)

36
where P - pull out load at displacement δ
Ppr - peak pullout load at displacement δ r
cQ - 0.09
mQ - 0.91
This relationship could be used to obtain soil stiffness for nonlinear
analyses of the uplift behaviour of geogrid-cell reinforced piles in sand using
a piecewise linear technique.
Swami Saran and Rao (2002) performed tests on 100mm x 100mm
square, and 100 mm dia circular anchor by introducing single and multiple
layers of reinforcement at spacings of 0.25 B and 0.5 B at a constant
reinforcement width of 3B and at embedment ratios of 2, 3 and 4. The
reinforcement used was Geogrid (CE-121 HDPE) with a tensile strength of
7.7 kN/m. All the tests conducted were stress controlled. Based on the results,
it was reported that the pullout capacity of anchor increased predominantly
with the reinforcement placed just above the anchor plate. In the multi-layer
reinforcement, the double layer system was efficient in increasing the pullout
capacity of anchor. However, there was not a predominant increase in case of
3 layers of reinforcement. It was observed that the pullout capacity of the
square anchor was higher than that of circular anchor, owing to the higher
area contribution to resist the uplift in square plate than circular plate.
The literature reviewed here has indicated that research on uplift
behaviour of anchors in reinforced sand bed has invited the attention of
geotechnical engineers in the late ’90’s. However, the technique of enhancing
pullout capacity by reinforcing the soil has not made expected breakthrough
as that of bearing capacity in reinforced sand. The basic reason for this may
be attributed to the complex interaction between the soil and reinforcement
under tensile (uplift) load. Therefore, the mechanism of strip anchor in sand

37
reinforced with geogrids is studied through model tests and a relevant theory
is derived in this work.
2.4 STUDIES ON ANCHORS IN SUBMERGED SAND
Limited work was reported on the effect of submergence under
uplift loading. Vesic (1971), Andreadis et al (1981), Ghaly et al (1991b),
Krishnaswamy and Parashar (1991), Ilamaparuthi (2004) are a few
researchers who have contributed to this field. Krishnaswamy and Parashar
(1994) performed the test in reinforced sand bed and others in unreinforced
conditions.
Andreadis et al (1981) carried out tests on cylindrical, conical and
plate anchors to determine the influence of anchor configuration and other
factors involved on the ultimate static uplift capacity and response to different
levels of static loading in Bushfarm sand and Borough green sand. A pullout
rate of 0.5 mm/min was adopted in this study, which permitted free drainage
around the anchor body during testing.
Selected testing rates were chosen to study the influence of pore
water pressures under uplift condition. If the displacement of anchor is rapid
in dense cohesionless beds, only a limited dissipation of induced negative
pore pressure will take place resulting in partial drained conditions and
therefore increased initial holding capacity. Maximum snap loads attained by
the tested anchors were more than double their static drained capacities. As
medium dense cohesionless soils dilate markedly less than the denser soils
when subjected to shear stresses, increase in undrained holding capacity
decreases with decreasing soil relative density. Loose and very loose sands
develop positive pore pressures and the undrained holding capacities are
reduced in comparison with the drained case as expected.

38
Haroon et al (1983) conducted uplift tests on model circular plate
anchors of 60 mm, 80 mm and 100 mm diameter in sand having angle of
shearing resistance equal to 30 degrees. The tests were conducted in both dry
and submerged conditions for embedment ratios upto 4. They observed that
the rupture surface starts from the top edge of the anchor and extends
vertically up for the major portion of the depth of embedment, however, it
gets curved near the surface of the sand mass. Based on these observations,
they approximated the failure surface to a cylinder and proposed the
following expression for pullout capacity in submerged sand.
2 2pu 0 s
π πP = DH K tan + HD2 4
(2.22)
where P'pu - peak pullout load in submerged condition
- submerged unit weight of soil
s - saturated unit weight of soil
K0 - co-efficient of earth pressure at rest ( = 1-sin )
D - diameter of anchor
H - depth of embedment
Comparing with experimental results, they concluded that their
theoretical estimates were lower than experimental pullout capacities and the
maximum variation is 50%
Ilamparuthi (1991) carried out model tests with circular plate
anchors in submerged sand beds to study the effect of submergence. The
equation proposed for estimating the pullout capacity is
pu pu wP = P R ( ) (2.23)

39
where puP - Pullout capacity corresponding to submerged sand
condition
Ppu - pullout capacity corresponding to dry sand condition
Rw - submergence factor
- submerged unit weight
For = 33.5º
Rw = 1.0 for H/D ≤ 4.8
w21 21R 0.473 1 for 4.8< D 9.6
u uN N
For = 43º
Rw = 1.127 for H/D ≤ 6.75
w60 53.25R 0.473 1 for 6.75< D 9.6
u uN N
where Nu is break out factor in dry sand condition.
Based on the observation made by the researcher, it was reported
that in the submerged condition, eventhough the angle of shearing resistance
is essentially the same as for dry sand, the normal stress will be less due to the
submerged unit weight of soil. Therefore, the shearing resistance, which is not
only a function of , but also a function of the normal stress, will be less in
the case of submerged sand bed. Thus, not only the effective weight of the
soil inside the failure zone, but also the shearing resistance along the surface
will be less in submerged condition. However, since the experimental results
show breakout factors in submerged condition to be close to those in dry
condition, the apparent gain of strength may be due to suction developed. As

40
the soil dilates with anchor movement, negative pore water pressure is
developed, which creates suction force at the base of the anchor.
Ghaly et al (1991b) presented the behaviour of model single-pitch
screw anchor installed in dense sand subjected to hydrostatic pressure or
upward seepage flow. The test program included 20 experiments conducted
on both shallow and deep anchors using screw anchors. For shallow anchors,
the mode of failure propagates to the sand surface, and the weight of sand
involved within the shape of failure represents a considerable portion of the
total resistance against uplift. This weight of sand was strongly altered by the
sand submersion, which results in a reduction of ultimate pullout load. In the
case of deep anchors, the failure mechanism was of a local nature and the
sand weight is a relatively small component in the total value of the uplift
resistance, while the shearing resistance of the sand represents the major
portion contributing to the total pullout load.
Taking into account that the shear resistance depends on the angle
of shearing resistance of the sand and that the latter was only slightly altered
by the submersion process, it was evident that the pullout load-upward
displacement relationship for both dry and submerged sands is almost the
same for deep anchors as reported by Vesic (1971). For a given installed
depth and sand properties, the ultimate pullout load of screw anchors installed
in dry sand was higher than that for anchors installed in submerged sand in
the case of anchors embedded at shallow depths. For deep anchors, they are
almost the same.
Krishnaswamy and Parashar (1991) studied the effect of rate of
pullout and submergence in reinforced soil bed. Increase in the rate of pullout
increases the uplift resistance of plate anchors. Reduction in the rate of
pullout from 1.27 mm/min to 0.127 mm/min results in a reduction of ultimate

41
uplift resistance of about 16 to 18 %. However, the percentage variations in
the uplift capacity of plate anchors without geosynthetics as well as with
geosynthetics are nearly the same over a given range of strain rate.
The submergence of soil anchor system results in a reduction of
uplift capacity by approximately 30–40%. But, the ratio of the ultimate uplift
capacity of anchors with geosynthetics inclusions to the ultimate uplift
capacity of anchors without geosynthetics inclusions remains nearly the same
for dry and submerged conditions. The effect of submergence on uplift
capacity of plate anchors was reported in detail by Krishnaswamy and
Parashar (1991).
Ilamparuthi and Muthukrishnaiah (2001) studied the behaviour of
anchor subjected to snap loading in submerged sand bed. It was well known
that under very fast loading, there may be apparent strength increase due to
negative pore water pressure, but very little is known in a quantitative sense
about the response of anchors embedded in submerged sand to the rate of
loading under pullout. Tests were performed on rigid steel circular anchors of
diameter 300 mm with a plate thickness of 8 mm under two rates of pull of
0.5 mm/sec and 1.5 mm/sec (snap loading). Variation in pore water pressure
was measured at the base of anchor and other locations. The pore water
pressures recorded at the base of anchor were negative for the rates of pull
applied. The magnitude of negative pore water pressure was higher for higher
rate of pull and maximum at the base of anchor for the depth of embedments
investigated. Moreover the peak pullout loads were also higher for higher rate
of pull. The magnitude of pore water pressure in high rate of pull
(1.5 mm/sec) is about five times the slow rate of pull (0.5 mm/sec) for an
embedment ratio of unity. The negative pore water pressure was quantified in
terms of peak pullout load and was termed as force ratio. For a given rate of

42
pull the force ratio decreases with increase in embedment ratio which was
found to be independent of density of sand bed.
2.5 STUDIES ON ANCHOR BEHAVIOUR UNDER CYCLIC
LOAD
Literature reviewed shows that there is a dearth of published
articles that describing the effect of cyclic loading in reinforced sand bed for
uplift capacity of anchor. However limited studies on anchors subjected to
cyclic loads reported in literature have been reviewed here.
Bemben et al (1973) and Bemben and Kupferman (1975) have
presented results on the long term behaviour of fluke anchors in sandy and
clayey soils subjected to cyclic loading. Fluke anchors of 76 mm and 152 mm
diameter with projected plan area of 3950 mm2 and 15730 mm2 respectively
were used in the investigation. Sinusoidal loading cycles of 8 second period
with varying load amplitudes were used. Based on the model tests they
suggested that fluke anchors to resist cyclic load should be designed at 40%
of their static holding capacity.
Ponnaiah and Finlay (1983) reported the long-term behaviour of
circular plate anchors subjected to sinusoidal loading cycles of 10 second
period. All the tests were conducted with circular plate anchors of 50 mm
diameter buried in normally consolidated clay at an embedment ratio of 4.5.
Based on the test results it was reported that the anchors did not fail when
load cycle upto 50 20% of the drained ultimate pullout capacity. With
recycling, it was found that the failure load increased to 70 20% of the
drained capacity of anchors. It was further observed that the anchor
displacements were directly associated with the build-up and dissipation of
pore water pressure during loading cycles.

43
Datta et al (1990) reported the short term cyclic behaviour of plate
anchors in soft cohesive soil. These investigations were conducted with
circular plate anchors of 50 mm diameter buried at a depth of 300 mm and
subjected to a rectangular cyclic loading of 15 seconds time period for a
maximum of 500 loading cycles. The principal parameters studied in this
testing programme were the mean load and the cyclic amplitude and their
influence on anchor movement and post-cyclic static pullout capacity. From
the test results, it was concluded that the plate anchors should be designed for
a load of one-third of its static pullout capacity to take into account the effects
of cyclic loadings. Further it was pointed out that the movement of anchor
under cyclic loading can be prevented if the maximum cyclic load level is
kept below 25% of the static pullout capacity.
Byrne (2000) investigated the behaviour of suction anchor
embedded in dense sand under monotonic and cyclic loads. It was reported
that at small displacements, monotonic and cyclic load results showed little
effect on loading rate. However at large displacement, particularly under
tension the rate of loading affected the stiffness of the response and was
dependent on pore fluid drainage. Further Byrne et al (2002) formulated a
theoretical model namely, continuous hyper-plasticity and demonstrated its
applicability to reproduce experimental data on suction anchor subjected to
both monotonic and cyclic loads.
Singh and Ramaswamy (2002) studied the behaviour of plate
anchors in soft saturated clay under monotonic and cyclic loads. Behaviour of
plate anchors of 80mm dia in clay bed was carried out at an average testing
water content of 57.3 % (Ic = 0.4) for various cyclic load ratios. Different
combinations of sustained and cyclic loads were studied to determine the
influence of anchor movement and post-cyclic monotonic pullout capacity.

44
The anchors were subjected to a maximum of 1000 cycles or till the
movement of anchor was 80 mm.
Effect of preloading and the period of loading cycles on movement
of anchor, and the period of loading cycles on post-cyclic pullout have been
investigated. From the cyclic loading tests conducted, it was recommended
that the design of plate anchors subjected to cyclic loading should be based on
the allowable movement of structures rather than the breakout capacity of
anchor. To prevent any substantial movement, the amplitude of cyclic loading
should be kept below 30 % of the static anchor capacity.
From the literature reviewed on anchors against uplift load, it was
found that the works reported on improving the uplift capacity of the anchors
using reinforcement in sand bed are limited and the interaction behaviour
between reinforcement and sand is not addressed adequately. In addition
reported work on the behaviour of anchors in reinforced submerged sand bed
under both monotonic and cyclic loading conditions is limited. Very few
researchers have attempted to understand the behaviour of plate anchors under
cyclic loading that too in cohesive soil. Hence a detailed study is essential in
order to understand the failure mechanism of anchors embedded in reinforced
sand bed, under monotonic and cyclic loads.