chapter 2: the future of asia to 2025
TRANSCRIPT

Chapter 2: The future of Asia to 2025
Chapter 1: The rise of Asia
Chapter 2:The future of Asia to 2025
Chapter 4:Outlook for Australia
to 2025
Chapter 3:Australia in Asia
The rise of Asia provides great
opportunities for Australia
• strong income growth ahead• shifting trade and consumption
patterns• competition for resources• prosperity through stability

49
Key points
Asia’s past cannot be explained by a single model; nor will its future be a single destiny, but there are good reasons to be optimistic.
While the shape of the Asian century is not set in stone, the scale and pace of Asia’s rise in the coming decades is expected to be staggering.
Many nations in the region have only just begun to catch up to the productivity levels enjoyed in advanced economies, promising strong income growth for decades to come.
Asia will not just be the most populous region in the world. Asia will be the biggest economic zone, the biggest consumption zone and the home to the majority of the world’s middle class.
Economic cycles affecting the region are expected to occur around a rising long-term income trend.
The economies and societies of Asia will transform as they become more prosperous.
Over the coming decades, the nations of Asia will face new pressures, including likely moderate economic growth among advanced-economy trading partners, greater competition for natural resources and further environmental constraints.
Despite substantial declines in poverty levels, rising income disparities will challenge social stability.
And Asia’s continued growth won’t occur in a strategic vacuum. Stable relations among the major powers in Asia and the Pacific—China, India, Indonesia, Japan and the United States—will remain fundamental to prosperity and security in the region and will require sustained effort.
Each nation’s choices about its own institutions and policies will guide its future growth and prosperity, as will global economic and other developments.

50
2.1 Introduction
Embracing more than half of the globe’s population, the transformation now underway in Asia is happening within compressed time frames (Chart 2.1).
Chart 2.1: Asia’s economic resurgence is set to continue
Note: Bubble area reflects the size of GDP. GDP adjusted for purchasing power parity (2011 prices). See glossary for definition of Asia and description of Treasury projections. See Appendix A for a description of Asia’s resurgence to date. Sources: Maddison (2010), Conference Board (2012), IMF (2012c) and Treasury projections.
Average living standards are set to improve dramatically and transform the way people live and work. Asia’s economies are projected to expand at a strong rate. The region’s expansion and development will change the contours of Asia and the globe—opening up exciting new opportunities, while also posing some challenges.
2.2 Asia’s rise has further to go Building on settings that support prosperity, the region is set to continue its rapid growth into the next decade. Asia will change the shape of the global economy. Fast-growing Asian economies will be the engines of world economic growth as their share of global output rises (Chart 2.2).
1820 1870 1913 19501970
1990
2010
2025
0
5,000
10,000
15,000
20,000
0
5,000
10,000
15,000
20,000 Income per person US$ Income per person US$
51
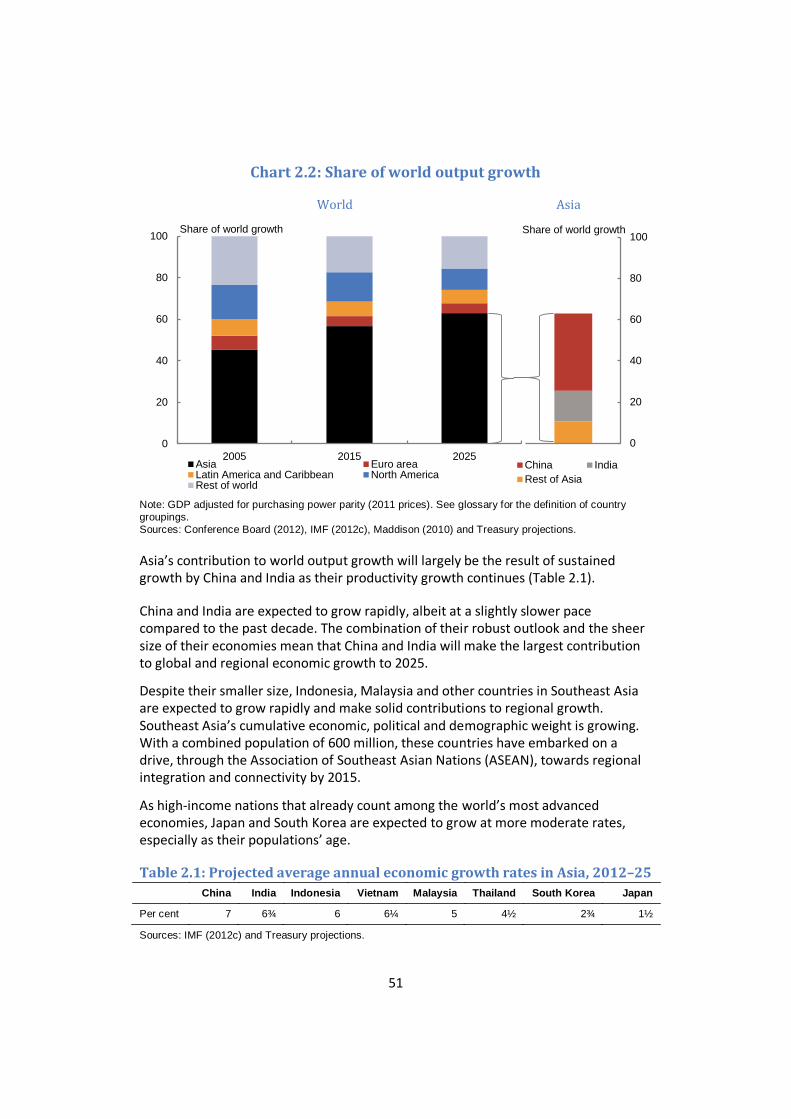
Chart 2.2: Share of world output growth
World Asia
Note: GDP adjusted for purchasing power parity (2011 prices). See glossary for the definition of country groupings. Sources: Conference Board (2012), IMF (2012c), Maddison (2010) and Treasury projections.
Asia’s contribution to world output growth will largely be the result of sustained growth by China and India as their productivity growth continues (Table 2.1).
China and India are expected to grow rapidly, albeit at a slightly slower pace compared to the past decade. The combination of their robust outlook and the sheer size of their economies mean that China and India will make the largest contribution to global and regional economic growth to 2025.
Despite their smaller size, Indonesia, Malaysia and other countries in Southeast Asia are expected to grow rapidly and make solid contributions to regional growth. Southeast Asia’s cumulative economic, political and demographic weight is growing. With a combined population of 600 million, these countries have embarked on a drive, through the Association of Southeast Asian Nations (ASEAN), towards regional integration and connectivity by 2015.
As high-income nations that already count among the world’s most advanced economies, Japan and South Korea are expected to grow at more moderate rates, especially as their populations’ age.
Table 2.1: Projected average annual economic growth rates in Asia, 2012–25 China India Indonesia Vietnam Malaysia Thailand South Korea Japan
Per cent 7 6¾ 6 6¼ 5 4½ 2¾ 1½
Sources: IMF (2012c) and Treasury projections.
0
20
40
60
80
100
2005 2015 2025Asia Euro areaLatin America and Caribbean North AmericaRest of world
Share of world growth
0
20
40
60
80
100
China IndiaRest of Asia
Share of world growth

52
By 2025, four of the 10 largest economies in the world will be in the region—China (first), India (third), Japan (fourth) and Indonesia (tenth). Asia is likely to account for almost half of the world’s economic output, with China accounting for about half of that (Chart 2.3 and Box 2.1).
Chart 2.3: World output shares
World Asia
Asia Euro area ASEAN China Latin America and Caribbean North America India Japan Rest of world Rest of Asia
Notes: GDP adjusted for purchasing power parity (2011 prices). See glossary for the definition of country groupings. Sources: Conference Board (2012), IMF (2012c), Maddison (2010) and Treasury projections.
In 1980, income per person in developing countries in Asia was about one-thirtieth of that in the United States. By 2025, the gap will have closed at a rapid pace—income per person in the United States will be only four times the income per person in Asia’s developing countries. Higher living standards, improved health care, greater life expectancy and access to goods and services will transform the lives of millions in the region. The transformation will be amplified by widening access to education and by the global reach of communications and digital technology.
0
20
40
60
80
100Share of output
0
20
40
60
80
100
2005 2015 2025
Share of output

53
Box 2.1: Asian economies will become bigger than advanced economies
The combined output of China and India will likely exceed that of the whole Group of Seven (G7) by early next decade (Chart 2.4). Asia is set to overtake the combined economic output of Europe and North America within the decade to 2020. India has become the world’s third-largest economy and China could overtake the United States as the world’s largest economy by 2014 in real purchasing power parity terms.
Chart 2.4: Takeover points of absolute output levels
Note: GDP adjusted for purchasing power parity (2011 prices). See glossary for definition of country groupings. Sources: Conference Board (2012), IMF (2012c), Maddison (2010) and Treasury projections.
Demographics will matter, but they are not destiny Asia’s growth story has been closely connected with its demographic dividend (Chapter 1). But the demographic tide is turning. In Japan, South Korea and Singapore, the proportion of the population that is of working age has peaked or is peaking, as the number of young people entering the workforce no longer keeps pace with the number of older people leaving it. In China, too, retirees account for a high and growing share of the total population.
Across the region as a whole, the working-age share of the population is plateauing and will begin to decline from around 2025. Asia’s working-age population is expected to grow at 0.8 per cent a year in the next two decades, around half the rate of the past two decades (Chart 2.5). Growth in the share of Asia’s working-age population will be a particularly important factor in future output growth—both as population growth slows and even reverses in some cases, and as the proportion of elderly people increases.
0
5
10
15
20
25
30
35
40
45
0
5
10
15
20
25
30
35
40
45
1995 2005 2015 2025China European Union-27 Group of Seven CountriesIndia Japan United States
Trillion US$ Trillion US$

54
Ultimately, the extent to which Asia’s workforce becomes a demographic ‘drag’ will depend on domestic policy initiatives. These initiatives need to encompass workplace flexibility, investment in human capital and the incentive effects of social safety nets. Many of those factors will also determine whether Asia’s more ‘youthful’ countries—India, Indonesia, Malaysia and the Philippines—are able to replicate the East Asian experience and capitalise on the opportunities of favourable demographics. Even if they do, for the region as whole, demographic factors will be a less significant source of economic growth than in the past.
Chart 2.5: Asia’s population and productivity
Note: See glossary for the definition of Asia. Sources: UN (2011b), Conference Board (2012), IMF (2012c), Maddison (2010) and Treasury projections.
Productivity remains the driver of economic growth Improvements in productivity will drive the bulk of economic growth in Asia to 2025 (Chart 2.5). The acquisition and proliferation of established technologies, a more highly skilled workforce, an increased stock of productive capital, and sound policy and institutional arrangements are all needed to lift labour productivity levels.
Given the starting output levels per person in many emerging Asian economies, the potential for continued labour productivity growth is large. Output per person in China is currently only 20 per cent of that in the United States, while India and Indonesia have barely reached 10 per cent (Chart 2.6).
1980 1985 1990 1995 2000 2005 2010 2015 2020 2025 2030
0.0
0.5
1.0
1.5
2.0
0
2
4
6
8
1985 1995 2005 2015 2025
Per cent
Productivity (Left axis) Working-age population (Left axis) Population growth (Right axis)
Percentage point contribution to economic growthPercentage point contribution to economic growth

55
Chart 2.6: Output per person Per cent of United States output per person
Note: GDP adjusted for purchasing power parity (2011 prices). Sources: UN (2011b), Conference Board (2012), IMF (2012c), Maddison (2010) and Treasury projections.
With few exceptions, economies in Asia have been rapidly catching up with the productivity levels of more advanced economies. They have introduced markets to allocate resources efficiently, harnessed domestic savings for capital investment, and adopted existing technologies and foreign investment to create productivity growth. A few, of course, have already reached, or are close to, the global technological frontier.
But the fruits of adopting new technology and adapting it will become harder to harvest. A point will come, though it’s still some way off, where the growth of labour productivity in developing Asian economies will slow—opportunities for gains from importing foreign technology and for shifting workers from agriculture to industry will diminish.
High levels of capital investment have been a considerable support for labour productivity growth in the region, but the next phase of such growth will likely draw from a wider set of sources—including investment in skills and education, further urbanisation, capitalising on further opportunities for deeper integration into the global economy and the rapid growth of other emerging economies.
The outlook for Asia is optimistic and it is shifting the global economy While the shape of the Asian century is not set in stone, there are good reasons to be optimistic. Many nations in the region have only just begun to catch up to the productivity levels enjoyed in advanced economies, promising strong income growth for decades to come. Even if there are economic cycles, as is likely, they will occur around a trend of rising income.
0
20
40
60
80
100
0
20
40
60
80
100
1950 1965 1980 1995 2010 2025
Per centPer cent
China India Indonesia Japan South Korea

56
Over the coming decades, Asian economies will face new pressures. These include expectations of more moderate economic growth among advanced economies, the need to build upon policy and institutional settings that support prosperity, greater competition for natural resources and further environmental constraints. Asia’s economies will have cycles and, with greater integration, they will not be immune to shocks from elsewhere.
Yet there are potential upside risks. It is possible that productivity gains might exceed expectations, as was the case after China’s entry into the World Trade Organization in the early 2000s (Armstrong & Tranh 2010). Also, consensus forecasts have consistently underestimated China’s economic performance over the past decade or so (Connolly & Orsmond 2011).
The economies of Asia will each need to define their own economic, institutional and political paths forward. But effective reforms, allowing for the development of more flexible, transparent institutions that can respond to unexpected ‘bumps in the road’, will be a necessary platform for Asia’s ongoing growth. Maintaining the direction of reform across Asia is important for achieving future economic outcomes at the upper bound of the region’s potential.
In particular, as Asian economies become wealthier and more technologically sophisticated, they gradually lose the advantages of ‘starting from behind’. They may not be so easily able to adopt and adapt technology from elsewhere as they operate closer to the technological frontier and compete further up the value chain. Without the necessary reforms and human capital development, Asia’s emerging economies risk falling into the ‘middle-income trap’, finding it difficult to progress to becoming a high-income economy (Kharas & Kohli 2011; Eichengreen, Park & Shin 2011).
Some parts of Asia, including some ASEAN economies, already have the middle-income trap as a serious challenge to manage. Globally, a recent report showed that only 13 of the 101 countries deemed to be middle-income countries in 1960 had broken through to high income levels (World Bank & DRC 2012).
Much of Asia’s future will be determined by how China and India manage their growth strategy so as to avoid this potential pitfall.
The shift of economic weight to Asia will continue, even if growth is slower than expected, given the low productivity base from which the large emerging economies are starting. If convergence is only 50 per cent of what is anticipated, three out of the world’s top five economies will still be in Asia by 2025 and the region will still be the world’s fastest growing. Even under a low growth scenario, China and India will continue to grow robustly (Box 2.2).

57
Box 2.2: Possible alternative courses for Asia
The central growth story outlined above assumes that economies in Asia are able to increase their output per person towards the level of advanced economies, through more rapid adoption and adaptation of technology and other policy changes.
If economies in Asia do not address their growth challenges, a slower growth path could emerge (Chart 2.7). But, even if developing Asian economies were to reach a long-run productivity level of only 50 per cent of what they would achieve under the ‘central’ scenario, Asia will still be the fastest-growing region in the world. Or, developing Asian economies could grow faster; the ‘high’ scenario assumes they reach a productivity level 50 per cent higher than the ‘central’ scenario.
Under all three scenarios, four out of the ten largest economies will still be in Asia by 2025. And the ranking of the ten largest economies in 2025 will be unchanged.
Chart 2.7: Asia growth scenarios Annual average growth, 2012–2025 Asia’s GDP levels Base Low High
Asia 5¾ 5¼ 6 Developing Asia
6½ 6 7
China 7 6½ 7¼ India 6¾ 6¼ 7
Note: Productivity has been restricted so that no developing Asian economies exceed the US productivity level. GDP adjusted for purchasing power parity (in 2011 US$). See glossary for the definition of Asia and developing Asia.
Sources: Conference Board (2012), IMF (2012c), Maddison (2010) and Treasury projections.
25
35
45
55
65
25
35
45
55
65
2010 2015 2020 2025
US$ trillion
US$ trillion
Central Low High

58
So while precise projections of Asia’s economic growth trajectory are uncertain, the overwhelming consensus among forecasters and commentators is that Asia’s economic rise will continue (Box 2.3). As one recent report shows, the centre of the world’s economic gravity will be moving closer towards Asia based on these projections of global economic growth (Figure 2.1 and McKinsey & Company 2012).
Box 2.3: Long-term economic growth projections
Many long-term growth projections exist for the global economy, including those from large global investment banks such as Goldman Sachs, Citigroup and HSBC, think tanks such as the Carnegie Endowment for International Peace, international financial institutions such as the Asian Development Bank and the World Bank, and from Australian Government agencies such as the Bureau of Resources and Energy Economics (BREE) within the Department of Resources, Energy and Tourism (Chart 2.8).
All these projections show a similar picture of strongly rising output in China and India over the period to 2025. There is more variance around India’s possible development path, in large part reflecting the earlier stage of its development.
Chart 2.8: Long-term GDP growth projections for China and India China India
Sources: BREE (2012a), Buiter & Rahbari (2011), HSBC (2012), OECD (2012b), Wilson et al. (2011), World Bank & DRC (2012) and Treasury projections.
100
150
200
250
300
350
400
100
150
200
250
300
350
400
2010 2015 2020 2025BREE CitigroupOECD Treasury
Index Index
100
150
200
250
300
350
400
100
150
200
250
300
350
400
2010 2015 2020 2025Goldman Sachs HSBCWorld Bank-DRC
Index Index

59
Figure 2.1: Asia to become the centre of global economic activity
Note: At each point in time, the centre of world economic gravity was calculated by weighting the GDP for each civilisation or country and measuring its relative importance against the known world economic capacity at that point. The centre of economic gravity slowly shifted from East Asia to Europe, then more quickly to the Atlantic and in more recent decades it has shifted quickly back towards Asia. Source: McKinsey & Company (2012).
But Asia’s development has not been evenly distributed Although the conditions of Asia’s poor have improved markedly, the incomes of the rich have been growing at a faster rate. Gaps have widened along rural-urban, gender and ethnic lines.
Cities and coastal areas were the first to benefit from Asia’s integration and development, while interior regions have lagged. Wide disparities now exist between the coastal and inland provinces in China, the eastern, southern and western states in India, and western and eastern Indonesia. These disparities are evident in rural-urban wage differentials. In Indonesia, incomes of urban workers are some 20 per cent higher than those of rural workers. In India, the wage premium is more than 30 per cent. Urban incomes in China are two and a half times those in rural areas.
Gender inequality has also become pronounced, particularly in South Asia: in Afghanistan, India, Pakistan and Sri Lanka, women are half as likely as men to have a job or be looking for work. While education levels have improved in aggregate, gaps remain in education opportunities between young people in high and low-income households and between men and women (Menon, Mitra & Arnold 2011). Three-quarters of women in the lowest income quintile in India have no education (World Bank 2012a).
Caste and ethnicity-based discrimination makes this regional and gender inequality worse. In many countries, the incomes of minority groups lag behind those of the ethnic majority. For example, despite impressive achievements in reducing poverty
1000
1500
1820
1913
19401950
1960 1970 19801990
2000
2010
2025

60
and inequality, Vietnam ethnic minorities now constitute 45 per cent of the poor though accounting for only 15 per cent of the population (World Bank 2012b).
There are deep inequalities of opportunity between countries in the region. Many have found it difficult to stimulate and sustain rapid growth. In Bangladesh, Laos and Timor-Leste, more than a third of people still live in absolute poverty.
Unless these growing disparities in incomes and living conditions, both within and between countries, are addressed, social stability could be threatened and could have an adverse impact on long-term economic growth (Kharas & Kohli 2011).
2.3 Asia will continue transforming the region and globe Asia’s economic rise will continue to transform the region and the globe in the period to 2025 and beyond. Economies in Asia will become even more important participants in world trade and Asian consumer markets will grow as the region’s living standards rise. Asia’s strong rates of urbanisation will continue, and the region will increasingly become an exporter of capital and a world financial centre.
Asia’s rise will shift trade and production patterns Asia has transformed the way the world produces goods and services and it will continue to be the production engine for the world (Chapter 1). Asia as a whole will become more important in the system of global trade to 2025 (Chart 2.9), retaining its many advantages as a mass producer of manufactured goods.
Chart 2.9: Asia’s share of world merchandise trade
Note: See glossary for definition of Asia. Source: Treasury projections based on IMF (2012b).
0
20
40
60
80
100
0
20
40
60
80
100
1975 1985 1995 2005 2015 2025
Asia with rest of world Intra-Asia
Per cent Per cent

61
As the more advanced economies in Asia turn to producing higher value-added products and face rising labour costs, the competitive dynamics of industries will change globally. The trend of firms moving to regions in Asia with lower labour costs is likely to continue, driving more integrated and interdependent cross-border production networks. However, as more labour gets drawn into the traded sectors in the developing economies, real wages are expected to rise. Higher living standards and wages will narrow the labour cost difference between developing and developed economies, including with Australia.
More sophisticated and affordable information and communications technology, enhanced cross-border transport and logistics solutions, and a further reduction of barriers to cross-border trade, investment and people movement will all support further cross-border production integration.
In addition to increasing exports, economies in Asia will turn more to domestic end-market opportunities. Internal demand within Asia is expected to become the major source of new opportunity for firms in and outside Asia.
And as incomes rise in Asia, the expanding middle class’s spending on services will become more significant, following the path of almost all advanced economies (Chart 2.10).
Chart 2.10: Services shares of output increases with income
Note: Data from 1980 to 2011. GDP per person adjusted for purchasing power parity (2011 prices) Sources: Conference Board (2012) and World Bank (2012b).
India, for example, has developed a larger services sector than other economies at the same stage of development. By the early 2020s, information technology and business process outsourcing are projected to employ around 7.5 million workers.
Whether that sector will provide sufficient productivity gains and opportunity for the large number of relatively unskilled workers in India remains to be seen. But with the
20
40
60
80
20
40
60
80
0 10,000 20,000 30,000 40,000 50,000
China India IndonesiaJapan South Korea United KingdomUnited States
Per cent of GDP Per cent of GDP
GDP per person US$

62
development of new information and communications technology, and the capacity for these services to be integrated into global value chains, it may be possible for parts of India to ‘leapfrog’ the more heavy industrialisation of East Asia. The Indian Government has recognised that, for India to achieve its potential, there are many challenges ahead such as the burden of ‘red tape’ and the need to improve its human capital and infrastructure (Government of India Planning Commission 2011).
As producers in Asia ‘move up the value chain’, they will focus their efforts on increasingly skills and innovation-intensive goods and services.
The more advanced economies in the region—particularly Japan and South Korea—will remain important drivers of economic activity, especially as suppliers of critical, high-value elements of the region’s production networks and as consumers of final goods.
Asia’s growing science and research capability is boosting global scientific output and accelerating the pace of technological progress worldwide. It is also intensifying innovation competition as traditional technology powerhouses—such as Germany, the United Kingdom and the United States—strive to maintain, or at least mitigate the pressure on, their innovation roles.
Although competition from countries in Asia will increase, so too will opportunities for collaboration. These opportunities are likely to arise in the provision of international education, basic research (for example, particle physics and bioscience), research on common problems (such as climate change and disease prevention), and applied or commercial research with effective intellectual property arrangements. The benefits of international research collaboration include improvements in the influence, cost effectiveness and applicability of research, access to new ideas and data, and sharing of facilities.
Consumer markets will grow As the living standards of people in Asia improve, they will contribute to a shift in their economies towards greater domestic consumption.
In China, for example, consumption as a share of the economy has been squeezed by the export-intensive nature of China’s rapid industrialisation. Although consumption per person has grown, the private consumption share of output is still below 40 per cent, much lower than in other major economies at comparable stages of development. China’s 12th five-year plan is focused on restructuring its economic model towards internal sources of growth.
The Asian region is expected to be home to the world’s fastest-growing middle class, whose pursuit of an improved quality of life will see Asian economies emerge as the world’s dominant consumer markets. This trend will change spending patterns, social and cultural preferences, use of technology and occupations throughout the region and the world.

63
While recent studies differ on how to define and measure the global middle class, all point to the sheer magnitude of the shifts in Asia. One prominent study estimates that middle-class consumers in the Asia–Pacific region will increase by more than 2.5 billion people and account for around 60 per cent of global middle-class consumption by 2030 (Kharas & Gertz 2010 and Figure 2.2).1
Figure 2.2: Growing consumer markets of Asia
Note: ‘Middle class’ is defined as those households with daily expenditures of between US$10 and US$100 per person. The black border circles and orange border circles depict the size of the middle-class population in 2009 and 2030 respectively. Source: Kharas & Gertz (2010).
The large and dynamic consumer markets emerging in Asia are already attracting the attention of businesses—and governments—globally. And although this growing group of consumers will still be considerably poorer than consumers in advanced economies, their sheer number will open up huge new markets as they spend a higher proportion of their income on discretionary items. In urban China in 2025, discretionary spending is expected to constitute 45 per cent of a household’s total expenditure, up from 34 per cent in 2000 (McKinsey & Company 2010).
Consumers across Asia are becoming more aspirational and more discerning. As incomes of the middle class increase, consumption choices will become more diversified—including a desire for higher quality, and potentially tailored, goods and services (Box 2.4).
1 Specifically, daily expenditures of between US$10 and US$100 per person in purchasing power parity terms. The lower limit was chosen by the authors with reference to the average poverty line in Portugal and Italy, the two advanced European countries with the strictest definition of poverty. The upper limit was chosen as twice the median income of Luxembourg, the richest advanced country. Defined in this way, the middle class excludes those who are considered poor in the poorest advanced countries and excludes those who are considered rich in the richest advanced country.
Central and South America2009: 181 m2030: 313 m
Asia Pacific2009: 525 m2030: 3228 m
Europe2009: 664 m2030: 680 m
Middle East and Africa2009: 137 m2030: 341 m
North America2009: 338 m2030: 322 m

64
Box 2.4: Middle-class consumers in Ahmedabad, India
Ten years ago, Hitesh moved from a village in the Indian state of Gujarat to Ahmedabad, a city of 4.5 million, where he now lives with his mother, wife and two daughters in a three-storey house in the old part of town.
Hitesh, 31, is a stockbroker in a firm that he opened with his friend several years ago. He brings in an annual income of US$5,280, placing his family squarely in the middle of Ahmedabad’s middle class. Almost half their income goes to food and housing, although they also spend a lot on transportation and entertainment. In the past few years, his wife, Komal, has begun buying groceries at a new supermarket instead of from local kiranas (traditional convenience stores), and the family buys electronics from a local showroom or from a friend’s shop. They now have US$700 in household assets, including a washing machine, a refrigerator, a television, a DVD player and two mobile phones—all of which, with the exception of the refrigerator, are international brands. Hitesh owns a motorcycle, which he bought for US$850.
The family has seen a dramatic upgrade in the quality of their lives in the last few years, and they have high hopes for continued improvement. Hitesh expects his income to double within the next five years, and he and Komal are already planning how their lives will change. Their first focus is housing. The family currently lives in an old neighbourhood with narrow streets and older, worn buildings, and they would prefer a more developed area. They have been looking at a house with greater investment value and more living and outdoor space, including a garden and a parking spot. They have decided that they will buy an air-conditioning unit for their new home, are aiming to set up an internet connection and are budgeting US$4,000 to US$5,000 for new furniture. They then plan to invest in a small car and, eventually, new office space for Hitesh’s firm, ideally in one of the commercial developments that have recently sprouted up in Ahmedabad. The family also expect to spend more on health care and, as their daughters grow up, education.
Stories like this will play out across the region in years to come. Note: Expenditure figures quoted are 2010 US dollars. Source: BCG (2010).
The Asian middle class will become more mobile. Outbound tourist numbers have already grown substantially; China’s increased from 4.5 million to 57 million between 1995 and 2010 and India’s from 3 million to 11 million over the same period (UNWTO 2012).
Asia’s expanding middle class will seek greater access to educational opportunities as a driver for more highly skilled and better paid jobs. Studying abroad is considered important to obtain these jobs and in 2012 one survey found that 85 per cent of Chinese high net worth individuals intended to send their children overseas to study (Hurun 2012). This preference has led the number of students from China studying

65
overseas to almost treble: in 2003, 117,300 Chinese students studied abroad, but by 2011, this had grown to 339,700 students (China MOE 2012; AEI 2012a).
Alongside growing middle-class consumption in Asia, large consumer groups in the region already have much higher income levels, as evidenced by the size of the luxury goods market in Asia: China, for example, is now the world’s largest market for Rolls Royce automobiles.
With billions of people set to enjoy considerably higher living standards, a surge in global creativity and productivity should be expected, accompanied by widening access to education—especially among women—and by the global reach of communications and digital technology.
Access to a greater range of financial services to meet the demands of the middle class will also change consumption patterns. New investment products will further increase household wealth and provide alternative sources of funds for business investment.
Urbanisation is set to continue Urbanisation in Asia has been an important driver, as well as a consequence, of the region’s economic development and industrialisation.
Although Asia’s rate of increase in urbanisation is soon to peak, the scale of urbanisation to come is unprecedented (Chart 2.11).
Chart 2.11: Asia’s continuing urbanisation Number of people living in urban areas
Note: See glossary for the definition of Asia. Source: UN (2012b).
0
1
2
3
0
1
2
3
1985 1995 2005 2015 2025
People (billion)People (billion)

66
By 2025, more than 2 billion people in Asia—half the world’s urban population—are expected to live in cities. By 2050, this number will rise to some 3 billion people, around double the current level (ADB 2011a).
By way of comparison, China’s pace of urbanisation is 100 times the scale, and 10 times the speed, of Britain’s urbanisation during the Industrial Revolution (Maddison 2010). Building on their relatively low urbanisation levels, India and China are expected to account for around 40 per cent of the world’s urban population growth to 2025 (UN 2012b).
Urban areas are productive, attracting skilled workers, generating economies of scale and efficiencies, and providing more cost-effective essential services. Globally, large cities have 38 per cent of the world’s population but generate 72 per cent of global output; China’s metropolitan areas accounted for 78 per cent of its output in 2010. While urban India’s share of the country’s output is currently low—less than 40 per cent—urban areas there should generate half of India’s growth in GDP to 2025 (McKinsey & Company 2012). In China, average consumption per person in urban areas was more than double that of their rural counterparts in 2008. In India, average consumption per person was one-third higher in urban areas in 2009 (World Bank 2012b). The presence of a significant gap in incomes between urban areas and the rest of an economy is practically universal.
Strong rates of urbanisation in Asia will continue to shift investment activity from the building of heavy industry to the building of infrastructure: residential construction, roads and other transport networks, container port capacity, and urban amenities (such as water and electricity distribution).
In response to concerns about the degradation of arable land, urban densities are likely to increase. China is forecast to have more than 200 cities with a population in excess of 1 million by 2025. Europe, in contrast, has 35.
Urban areas will be the primary location for Asia’s emerging middle class, whose demands will relate to the needs of an urban lifestyle—transportation, infrastructure, housing and utilities, food and other consumables, health care, recreation and education.
Countries such as Bangladesh, Cambodia, Laos, Pakistan and Vietnam, which are at an earlier stage in the urbanisation process, will see a doubling in their urban populations over the next 25 years. They, too, face significant decisions about urbanisation, which could put pressure on institutional and political systems if not carefully managed.
Asia as a capital exporter Asia is growing as a capital exporter and financial centre. The region holds more than half the world’s foreign exchange reserves and accounts for nearly a quarter of global financial assets. By 2050, this could rise to as much as 45 per cent (Kohli, Sharma & Sood 2011). Whatever the overall share turns out to be, Asia will host some of the

67
largest global equity, debt and banking markets, and be at the centre of global financial intermediation.
The share of total savings in China, India and other emerging economies is likely to increase over coming decades, while the United States’ share, and those of other advanced economies, will decline (Chart 2.12).
Savings from Asian countries have largely been invested in foreign markets, such as the United States and Europe, due to the historic stability that these markets have offered compared to the Asian financial market. Foreign exchange reserves have also been built up, partly in response to macro-prudential concerns raised in the aftermath of the Asian financial crisis (Chapter 1). The strengthening and rigorous application of regulatory and supervisory frameworks will enhance confidence in Asian capital markets and these markets are likely to deepen as a result. As the financial system in Asia grows and matures, more direct investment within the region is likely, as is a gradual decline in the investment of funds in advanced economies (Sheng 2011). Deeper and larger capital markets in the region will likely lead to greater market opportunities for services such as risk management tools and financial market products, including the provision of such services from Australia.
And with financial systems in advanced economies unwinding the high debt levels built up before the Global Financial Crisis, financial institutions in stronger economic positions, such as those in Australia and elsewhere in the Asian region, will have opportunities to expand into new markets.
Chart 2.12: Share of total saving in the Group of Twenty
Note: See glossary for definition of country groupings. Source: Speller, Thwaites & Wright (2011).
0
20
40
60
80
0
20
40
60
80
1985 1995 2005 2015 2025
China India Other advancedOther emerging United States
Per centPer cent

68
2.4 Success is giving rise to interconnected challenges As Asia’s economies, populations and middle class grow and its rates of urbanisation and consumption increase, so too do its challenges in the areas of food, water, infrastructure and energy and minerals security. Climate change is likely to amplify these challenges over time.
Energy and minerals security concerns As it has grown, Asia has made growing claims on global energy. Increasingly, the region has relied on imports to meet its energy needs, with Australia playing an important role.
These concerns are likely to heighten in coming decades. Asia is expected to become 90 per cent dependent on imported oil by 2050, with the source of that oil being concentrated in the Middle East (ADB 2011a). For those countries within the region with large endowments of carbon-intensive fuel, climate change is adding a new dimension to Asia’s energy challenges—creating pressures to restrict and alter patterns of energy use.
China is passing through the most energy-intensive part of its economic development (Song 2010). At the same time, its largest oilfields are maturing and production has peaked. So with backing from the government, Chinese national oil companies are investing overseas to expand production and diversify sources of supply.
To further address its energy security concerns, China’s 12th five-year plan contains ambitious targets to reduce energy intensity and increase the share of renewable energy in national energy consumption. Action against these targets has been successful: China has emerged as a significant actor in the global renewable energy market and is now the world leader in renewable energy investment (UNEP 2012).
India, too, is focused on assuring ongoing access to reliable, affordable and secure energy. It recently became the world’s third-largest energy consumer, and its energy demand is expected to more than double between 2009 and 2035 (IEA 2011). But India holds less than 1 per cent of the world’s proven oil reserves, and while the country has the world’s fifth-largest coal reserves, domestic production has been unable to keep pace with demand (BP 2012). Against this backdrop, India seeks to expand the population’s access to modern energy sources, such as natural gas, liquid petroleum gas, diesel and biofuels.
The energy security landscape of ASEAN countries is being transformed as well. Once major exporters of oil and gas, ASEAN countries are now collectively net oil importers, and within three decades they are expected to also become net importers of gas (ADB 2011a).
Concerns about energy security are not confined to the region’s fast-growing developing economies: Japan and South Korea have limited domestic energy supplies and so both have come to rely heavily on imports. Japan and South Korea are the

69
world’s third and fifth-largest net importers of crude oil respectively and the world’s first and second-largest importers of natural gas. Both confront a more crowded field of competitors for future energy requirements.
Asia’s rapid growth, infrastructure investment, and ongoing industrialisation and urbanisation will boost demand for a broad range of minerals—spanning aluminium to zircon. China’s iron ore imports, for example, are projected to grow strongly to reach over 1,000 million tonnes in 2025 (BREE 2012a). The demands of Asia’s growing middle class for jewellery, as a means to display and store wealth, will drive demand for commodities such as gold.
The mature industrial economies of Japan, South Korea and Taiwan will also continue to demand raw materials to maintain their manufacturing sectors. And as their manufacturing industries respond to demands for ‘greener’, innovative technologies, there is likely to be a corresponding increase in demand for materials such as rare earths and lithium. Increasing global demand for consumer electronics is heightening this demand, all of which would be supplied by imports.
Climate change As the region’s energy use has increased markedly, so too have its greenhouse gas emissions. The link between energy and emissions arises from the use of fossil fuels, which dominate Asia’s existing energy mix due to their low cost, availability and ease of use relative to low-carbon alternatives. In 2009, fossil fuels accounted for about 82 per cent of Asia’s energy mix, with coal alone accounting for around 47 per cent.
It is in the region’s interests to work to address climate change and many countries are taking steps to do so (Chapter 8). Projected sea-level rise, more intense tropical storms and higher wind speeds could inundate low-lying port cities, threaten coastal areas, exacerbate flooding and increase the salinity of rivers and bays across the region. With rapid and sometimes poorly planned urbanisation, these impacts could devastate Asia’s coastal cities and major ports. Even under a conservative scenario of sea-level rise, by the end of the century the number of people affected by flooding in low-lying parts of the region, such as parts of Bangladesh, China, India and Vietnam, could increase from 13 million to 94 million (Cruz et al. 2007). In South Asia alone, the average costs of adapting to a 2°C temperature rise could be up to $15 billion every year between 2010 and 2050 (CSIRO 2006).
Not only is action on climate change in the region’s interests—given its large population and huge latent demand for emissions-intensive goods and services—it is critical to a global climate change solution. Asia is already a major contributor to global emissions. The region currently accounts for around 40 per cent of global emissions—up from 31 per cent in 2001. China, which recently overtook the United States as the world’s largest emitter, is responsible for more than 60 per cent of the region’s total emissions. And without a shift to low-carbon development, growth in emissions is projected to rise significantly (Garnaut 2011; Australian Government 2011c).

70
If the region is to reach its potential, it must address its growing food, energy, water and climate constraints. Significant efforts to do so are already underway. But for them to succeed, the region must avoid past approaches, where attempts to fix one area without regard for effects elsewhere led to unintended consequences. The links between food, water, energy and climate change are multiple and fundamental, and so a whole-of-system approach to these challenges is critical.
Growing demand for food Asia’s demand for food commodities is set to grow. In order to feed a larger, more urban and richer population, food production in 2050 needs to be around 70 per cent higher than today. Most of the projected increase in food demand will come from Asia (Linehan et al. 2012). The shift towards more protein-rich food and a wider variety of vegetables and fruit, combined with growth in biofuels, will also be more resource intensive.
The world is expected to be able to achieve the required increase in food production (FAO 2009; World Bank 2009), mostly from higher yields and cropping intensity.
But meeting the required increase in food production will not come easily. While the increase needed in agricultural yields is comparable to those achieved in the past, crop productivity growth is slowing and producers face much greater environmental constraints and challenges than before. And in many areas, climate change is multiplying these challenges. By 2030, rising sea levels could expose large parts of the Mekong Delta to extreme salinisation and crop damage.
The focus on lifting agricultural productivity will need to extend beyond the farm gate. Investments in water and transport infrastructure, particularly roads, irrigation systems and dams, will also be required. Such investments would help farmers better integrate into value chains and markets as well as help reduce food loss and waste. A lack of hard infrastructure, such as storage and cooling facilities and transportation, means that food does not always make it to market.
The combination of resource and environmental constraints, along with higher input costs, will constrain the supply response in most regions, so coming decades will be characterised by high food prices. Stronger links between agricultural and energy markets, as well as more frequent extreme weather shocks, will also add to food price volatility.
Water scarcity is set to increase Meeting the region’s growing food demands will be complicated by water scarcity.
Asia is a relatively water-scarce region, and the complexity and scale of its water problems are set to grow. Growing populations and cities, changing diets and expanding energy and industrial production will demand greater shares of the region’s limited water resources. Industrial water use alone is projected to increase by 65 per cent by 2030, crowding out growth in agricultural water use (ADB 2011d).

71
If improvements in water efficiency remain at recent levels—a modest 1 per cent a year between 1990 and 2008—demand in India and China could exceed supply by 50 per cent and 25 per cent respectively by 2030 (Water Resources Group 2009). In developing Asia, aggregate water shortfalls could reach 40 per cent, with implications for the region’s food and energy production, its ecological needs and the health and livelihoods of its population.
Large expanses of land are already becoming vulnerable to desertification, with deserts expanding in India, China and Pakistan. In China alone, just over one-quarter of the country’s landmass is desertified and an average of almost 2,500 square kilometres of land being lost to advancing deserts each year.
Climate change, as it takes effect in the annual variability of rainfall, will make things worse. While there is uncertainty about the extent and rates of melting of the Hindu Kush glaciers, climate change could reduce downstream water availability, affecting 1.3 billion people who indirectly benefit from the water in eight countries (Papademetriou 2000; Singh et al. 2011).
Water quality is also likely to remain a problem. Within the region, surface-water sources are being rapidly polluted, often irreparably. More than half of the water in China’s Hai River basin is classified as ‘non-usable’. Of the Philippines’ 412 rivers, 50 are classified as ‘dead’. In Indonesia’s West Java, all seven main rivers—the source of water for the nation’s capital, Jakarta—are categorised as heavily polluted. And the waters of the Ganges and Yellow rivers are unusable for agriculture along more than half their lengths (ADB 2011d).
As water scarcity grows and as water quality deteriorates, competition among users and jurisdictions will increase. Already, in countries such as India, frequent water shortages have contributed to conflicts among households, communities and states (Mukhopadhyay & Shyamsundar 2012). Without effective management of water resources, tensions within and among countries will rise, with implications for regional growth and stability.
Infrastructure needs are set to increase As the nations in Asia continue their process of rapid urbanisation and economic development, substantial investments in quality infrastructure will be required. Asia could require up to US$8 trillion of new infrastructure investment out to 2020 to support the current levels of economic growth (ADB 2011c). And almost US$1 trillion trans-regional infrastructure projects have been identified (ERIA 2010). This investment will influence the amenity, sustainability and productivity of societies—providing for the timely movement of people, goods and services.
Infrastructure demands vary across the region. Some countries are already investing heavily in infrastructure. For example, China spends $116 per person, while India spends about $17 per person (Kohli and Sood 2010).

72
Infrastructure needs are not contained to dynamic urban areas. In a survey of over 5,000 rural households in India’s southern states of Andhra Pradesh, Karnataka and Tamil Nadu, about 90 per cent of respondents listed water and infrastructure as among their top three priorities (Besley et al 2004).
Given the size of the challenge, many in the region are looking to harness private sector involvement. Policy settings which address impediments to investment and encourage private sector participation in infrastructural development will be needed to meet the region’s infrastructure needs (Sheng 2011). At the same time, planning practices will need to develop further to make the most of increasing scarce urban space. Solutions for these policy challenges can be found by working together—through multilateral development and other institutions, international forums, such as APEC forum and the G20, and bilaterally (Chapter 7).
2.5 International systems are evolving The international system established after World War II brought about the longest and most prosperous period of peaceful expansion ever witnessed. This rules-based system, global and comprehensive in reach, and underpinned by institutions like the United Nations, the International Monetary Fund, the World Bank and the General Agreement on Tariffs and Trade (now the World Trade Organization), created the conditions in which many nations, including a large number in Asia, could confidently pursue their own development.
The question, looking forward to 2025, is how relationships between regional powers will change as the balance of influence among them shifts, and how regional and global institutions and rules will evolve.
Strategic power is difficult to define, but most attempts to measure it include a nation’s income, or output, defence spending, population and technical advancement. Other measures include military capability, the determination and ambition of the political leadership and a country’s ‘soft power’, which denotes a country’s attractiveness and its consequent ability to persuade, rather than coerce, others to help in achieving its goals.
Whatever the definition, most measures point to the rapid rise in strategic power of emerging Asian economies in recent decades (Figure 2.3).
Positive and stable relations among all nations, and particularly the larger nations—China, India, Indonesia, Japan and the United States—will be fundamental to the prosperity and security in the region over the period to 2025. Indonesia and the other members of ASEAN are of special relevance to Australian interests.

73
Figure 2.3: Major economic powers in the Asia–Pacific region Share of global economic power
Note: This index of global economic power is a weighted average of the share of a nation in world GDP, their share of global trade and their share of financial strength as measured by share of net exports of capital. Weights are from Subramanian (2012)—0.6 for GDP, 0.35 for trade and 0.05 for net exports of capital. Sources: Subramanian (2012) and World Bank (2012d).
Nothing is inevitable in the global strategic transition underway. At the same time, throughout the region, old frictions, including territorial disputes and debate over historical issues, persist and can easily escalate. The Democratic People’s Republic of Korea (North Korea), with its nuclear ambitions, repressive government and impoverished population, remains one of the region’s flashpoints. As can be seen in the South China Sea, territorial disputes, especially in the maritime domain, will continue to be points of regional friction and pose serious risks of conflict. Despite recent constructive developments in cross-straits relations, uncertainties remain about how Beijing and Taipei will resolve their differences. And relations between India and Pakistan, currently relatively stable, could yet deteriorate quickly and dangerously.
But there are reasons for optimism. The economic rise of Asia has been a win-win on an unprecedented scale. Risks of miscalculation and policy error will always be present, but the growing strength, breadth and sophistication of bilateral and regional engagement provide grounds for believing that shifting regional and global power can be managed constructively. These security dimensions of the region’s growth are further examined in Chapter 8.
The relationship between the United States and China, the two largest economies in the world, will be of central importance. Many alternative strategic futures, both positive and negative, are possible. But Washington and Beijing are conscious of their complex interdependency and have been building mechanisms across their bilateral relationship to help manage the tensions that will inevitably arise from time to time.
19%
2000%
2010 %
11%
7%5%
11%
2%
14%3%
United States
Japan
India
China

74
The United States will almost certainly remain the single most powerful global and regional power for some time to come, drawing upon its economic, military and soft power and, within Asia, its network of security alliances and mutually beneficial political and economic relationships.
The two most populous regional powers, China and India, can be expected to seek greater strategic influence as their economic weight grows. But their determination to lift their large populations out of poverty suggests that they will continue to focus primarily on domestic policy issues, including environmental sustainability, and have a primary interest in stability.
The significance of their emerging relationship and the growing importance of the lines of energy supply to East Asia from the Middle East reinforce the value of thinking about the Indian Ocean and the Pacific Ocean as a single strategic arc (Box 2.5).
Box 2.5: Indo-Pacific and trans-Asian concepts Driven by Asia’s economic rise, the Indian Ocean is surpassing the Atlantic and Pacific oceans as the world’s busiest and most strategically significant trade corridor. One-third of the world’s bulk cargo and around two-thirds of world oil shipments now pass through the Indian Ocean (IOR-ARC 2012). Regional cooperation to ensure the safety and security of these vital trade routes will become more important over coming decades.
Some observers have raised a new ‘Indo–Pacific’ conception of the Asian region. Under such a conception, the western Pacific Ocean and the Indian Ocean would come to be considered as one strategic arc. This conception is being driven by the increased economic interaction between South, Northeast and Southeast Asia and the importance of the lines of energy supply to Asia from the Middle East.
Another conception of increasing importance is the trans-Asian region. With its growing economic ties and historical, community and cultural links to East and Southeast Asia, India’s foreign policy has increasingly tended to ‘look east’. In return, Northeast and Southeast Asian countries are looking west, not least because of the importance of energy links. Trade between China and India is expanding. In 2011, China was India’s largest export market, although their two-way merchandise trade was one-tenth of India’s total trade.
China is giving priority to developing road and rail infrastructure southwards from its borders as part of its wider efforts to improve production and distribution networks through enhanced regional connectivity (Bubalo & Cook 2010). India is building transport infrastructure that connects to East Asia. ASEAN’s Economic Community is giving priority to developing trans-regional transport and other infrastructure. Japan is heavily involved in the development of these trans-Asian infrastructural projects. These developments represent significant trans-Asian infrastructure projects, lessen focus on ocean security and heighten focus on managing land border issues.
For Australia, either the Indo–Pacific or trans-Asian conceptions could shape, in different ways, our economic, political, security and environmental interests.

75
Northeast Asia’s evolution is likely to be marked by both growing economic integration and continuing competition. China and Japan enjoy the third-largest economic relationship in the world. China is Japan’s largest export market and its largest source of imports. Japan is China’s second-largest export market after the United States, and its largest source of imports.
While a commercial competitor in some fields, South Korea has a deep economic partnership with China in fields such as information and communications technology and green energy. It is China’s third-biggest trading partner in merchandisable goods and third-largest source of foreign investment, while China is South Korea’s biggest trading partner and investment destination.
The strong links between the economies of China, Japan and South Korea are likely to increase. Japan and China are now close partners in value chains that underpin regional growth and prosperity. Discussions on a new trilateral free trade agreement have begun, and intensive bilateral and trilateral exchanges are taking place.
In Southeast Asia, Indonesia has re-emerged as a regional leader, is emerging as a global influence and is expected to play a growing role in the G20 and other forums. It has a large population, a strongly growing economy and a pivotal geostrategic location. It is the world’s largest predominantly Muslim country and a lively democracy. It will increasingly influence outcomes within global and regional institutions. Indonesia will become even more important for Australia. Other ASEAN nations, such as Vietnam, Singapore, Thailand and Malaysia, will play a significant role in regional trade and investment. Vietnam has carved out a distinctive diplomatic and wider regional profile. Singapore’s geographic location, world-class infrastructure and the ease of doing business there have made it an important commercial hub. For example, around 70 per cent of all intra-ASEAN trade is now with, or through, Singapore.

© Commonwealth of Australia 2012
ISBN 978-1-921739-92-7 (print) 978-1-921739-93-4 (PDF)
978-1-921739-94-1 (HTML)
Ownership of intellectual property rights in this publication
Unless otherwise noted, copyright (and any other intellectual property rights, if any) in this publication is owned by the Commonwealth of Australia (referred to below as the Commonwealth).
Creative Commons licence
With the exception of the Coat of Arms; photographs; charts 1, 1.1, 1.3, 1.4, 1.6–2.8, 2.10, 2.12–3.2, 3.5, A.1–A.4; figures 2.1 and 2.2; and Box 4.3, this publication is licensed under a Creative Commons Attribution 3.0 Australia Licence.
Creative Commons Attribution 3.0 Australia Licence is a standard form license agreement that allows you to copy, distribute, transmit and adapt this publication provided that you attribute the work. A summary of the licence terms is available from http://creativecommons.org/licenses/by/3.0/au/deed.en. The full licence terms are available from http://creativecommons.org/licenses/by/3.0/au/legalcode.
The Commonwealth’s preference is that you attribute this publication (and any material sourced from it) using the following wording:
Source: Licensed from the Commonwealth of Australia under a Creative Commons Attribution 3.0 Australia Licence.
The Commonwealth of Australia does not necessarily endorse the content of this publication.
Use of the Coat of Arms
The terms under which the Coat of Arms can be used are set out on the Department of the Prime Minister and Cabinet website (see www.dpmc.gov.au/guidelines).
Contact us Inquiries regarding the licence and requests to use material in this document are welcome at:
Australia in the Asian Century Implementation Task Force Department of the Prime Minister and Cabinet PO Box 6500 Canberra ACT 2600 Email: [email protected]