chapter 200 hydrology section 201 basic ... of indianapolis page 2-1 stormwater specifications...
TRANSCRIPT
City of Indianapolis page 2-1 Stormwater Specifications Manual January 2011 - FINAL
CHAPTER 200 HYDROLOGY
SECTION 201 BASIC POLICIES AND REQUIREMENTS
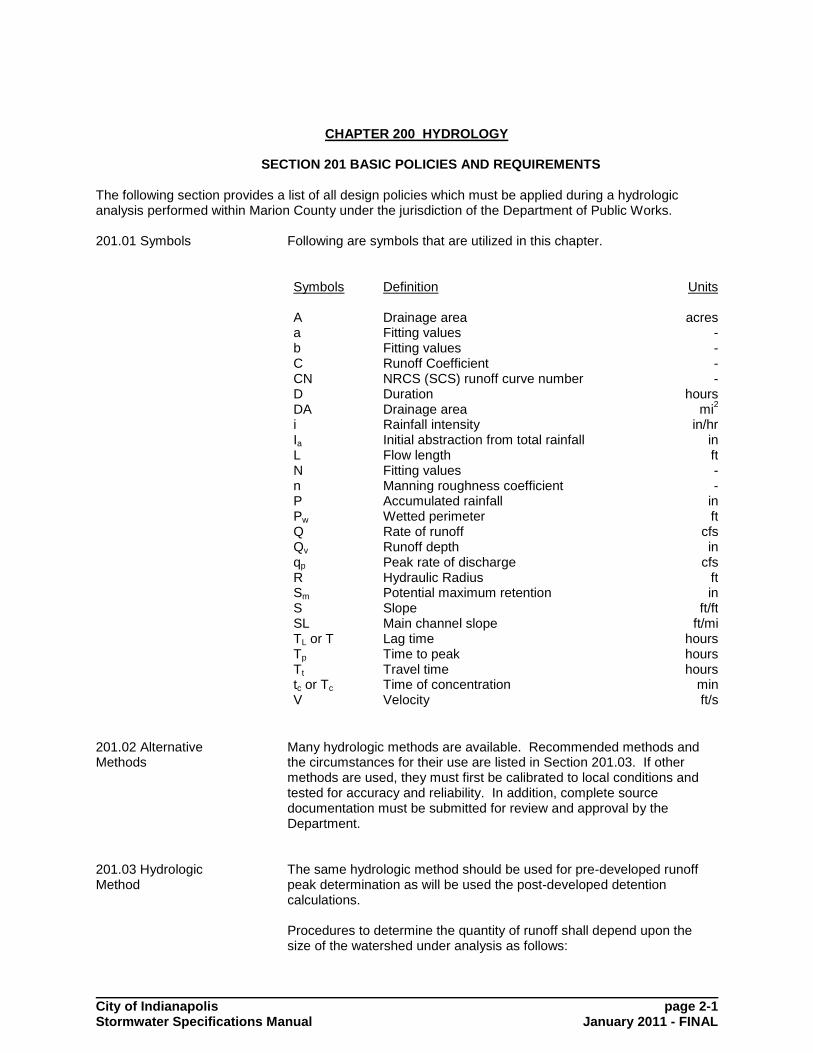
The following section provides a list of all design policies which must be applied during a hydrologic analysis performed within Marion County under the jurisdiction of the Department of Public Works. 201.01 Symbols
Following are symbols that are utilized in this chapter.
Symbols Definition Units A Drainage area acres a Fitting values - b Fitting values - C Runoff Coefficient - CN NRCS (SCS) runoff curve number - D Duration hours DA Drainage area mi
2
i Rainfall intensity in/hr Ia Initial abstraction from total rainfall in L Flow length ft N Fitting values - n Manning roughness coefficient - P Accumulated rainfall in Pw Wetted perimeter ft Q Rate of runoff cfs Qv Runoff depth in qp Peak rate of discharge cfs R Hydraulic Radius ft Sm Potential maximum retention in S Slope ft/ft SL Main channel slope ft/mi TL or T Lag time hours Tp Time to peak hours Tt Travel time hours tc or Tc Time of concentration min V Velocity ft/s
201.02 Alternative Methods
Many hydrologic methods are available. Recommended methods and the circumstances for their use are listed in Section 201.03. If other methods are used, they must first be calibrated to local conditions and tested for accuracy and reliability. In addition, complete source documentation must be submitted for review and approval by the Department.
201.03 Hydrologic Method
The same hydrologic method should be used for pre-developed runoff peak determination as will be used the post-developed detention calculations. Procedures to determine the quantity of runoff shall depend upon the size of the watershed under analysis as follows:

City of Indianapolis page 2-2 Stormwater Specifications Manual January 2011 - FINAL
Rational Method Rational Method may be used for peak runoff estimations when the total watershed area tributary to the design point is five (5) acres or less and with no existing depressional storage, provided analysis of "regional" detention/retention (D/R) facilities is not a required part of the computational procedure. USGS Regression equations are not applicable for projects within Marion County.
Runoff Hydrographs and Flood Routing Hydrograph generation and flood routing procedures shall be required when: 1. The total watershed area tributary to the design point is greater
than five (5) acres or less than 5 acres with existing depressional storage;
2. Multi-basin analysis must be performed (multi-basin analysis can
be required due to drainage patterns as well as land use (cover) changes and changes in soil types),
3. Detention/retention facilities requiring downstream analysis; or 4. As required by the Department.
201.04 Design Storm Frequencies
The design storm frequency is the basis for all runoff computations and stormwater facility designs. Selection of the design storm shall conform to criteria set-forth within Table 201-1 below.
TABLE 201-01: Minimum Design Storm Frequencies Drainage System Type Return Interval
(Post-development Discharge) Enclosed Storm Drain 10 year Cross-Pipe/Culverts 25 year (1) Privately Maintained 10 year (2) Culverts
Driveway Culverts 10 year (1, 5)
Bridge Structures 100 year (3) (watersheds larger than one (1) mi
2)
Open Channel 10 year Regulatory Floodways 100 year Detention/ (4) Retention Basins
City of Indianapolis page 2-3 Stormwater Specifications Manual January 2011 - FINAL
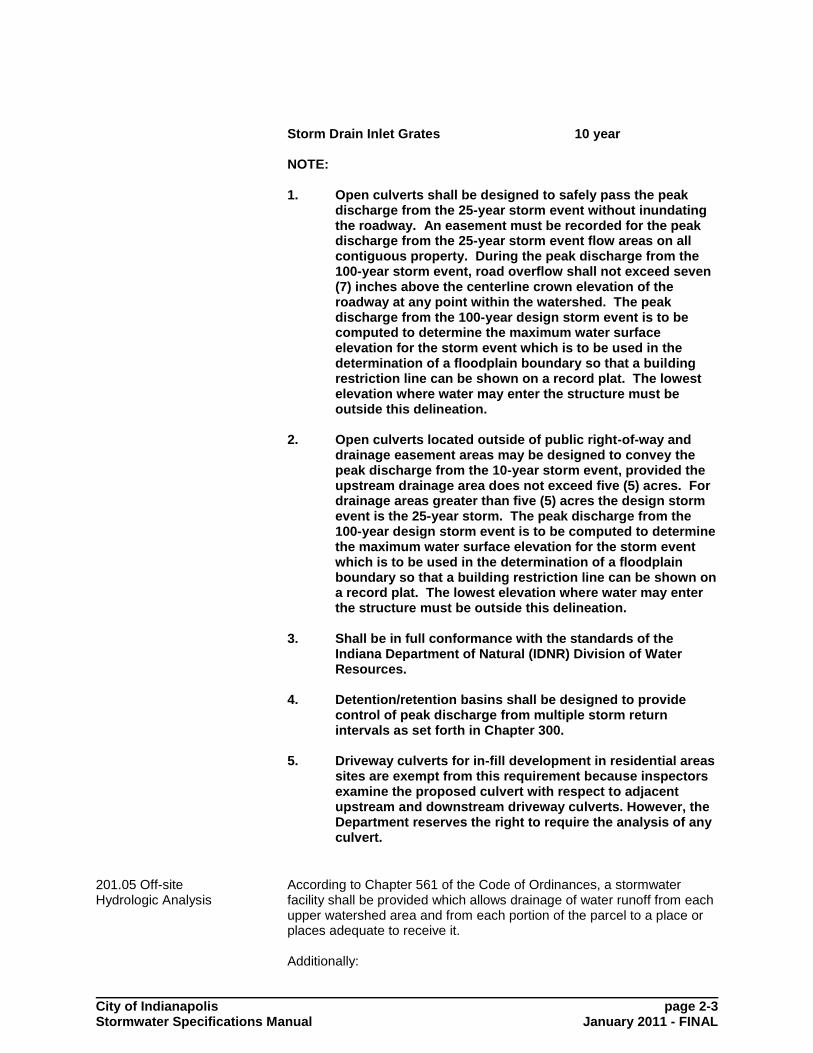
Storm Drain Inlet Grates 10 year NOTE: 1. Open culverts shall be designed to safely pass the peak
discharge from the 25-year storm event without inundating the roadway. An easement must be recorded for the peak discharge from the 25-year storm event flow areas on all contiguous property. During the peak discharge from the 100-year storm event, road overflow shall not exceed seven (7) inches above the centerline crown elevation of the roadway at any point within the watershed. The peak discharge from the 100-year design storm event is to be computed to determine the maximum water surface elevation for the storm event which is to be used in the determination of a floodplain boundary so that a building restriction line can be shown on a record plat. The lowest elevation where water may enter the structure must be outside this delineation.
2. Open culverts located outside of public right-of-way and
drainage easement areas may be designed to convey the peak discharge from the 10-year storm event, provided the upstream drainage area does not exceed five (5) acres. For drainage areas greater than five (5) acres the design storm event is the 25-year storm. The peak discharge from the 100-year design storm event is to be computed to determine the maximum water surface elevation for the storm event which is to be used in the determination of a floodplain boundary so that a building restriction line can be shown on a record plat. The lowest elevation where water may enter the structure must be outside this delineation.
3. Shall be in full conformance with the standards of the
Indiana Department of Natural (IDNR) Division of Water Resources.
4. Detention/retention basins shall be designed to provide
control of peak discharge from multiple storm return intervals as set forth in Chapter 300.
5. Driveway culverts for in-fill development in residential areas
sites are exempt from this requirement because inspectors examine the proposed culvert with respect to adjacent upstream and downstream driveway culverts. However, the Department reserves the right to require the analysis of any culvert.
201.05 Off-site Hydrologic Analysis
According to Chapter 561 of the Code of Ordinances, a stormwater facility shall be provided which allows drainage of water runoff from each upper watershed area and from each portion of the parcel to a place or places adequate to receive it. Additionally:
City of Indianapolis page 2-4 Stormwater Specifications Manual January 2011 - FINAL
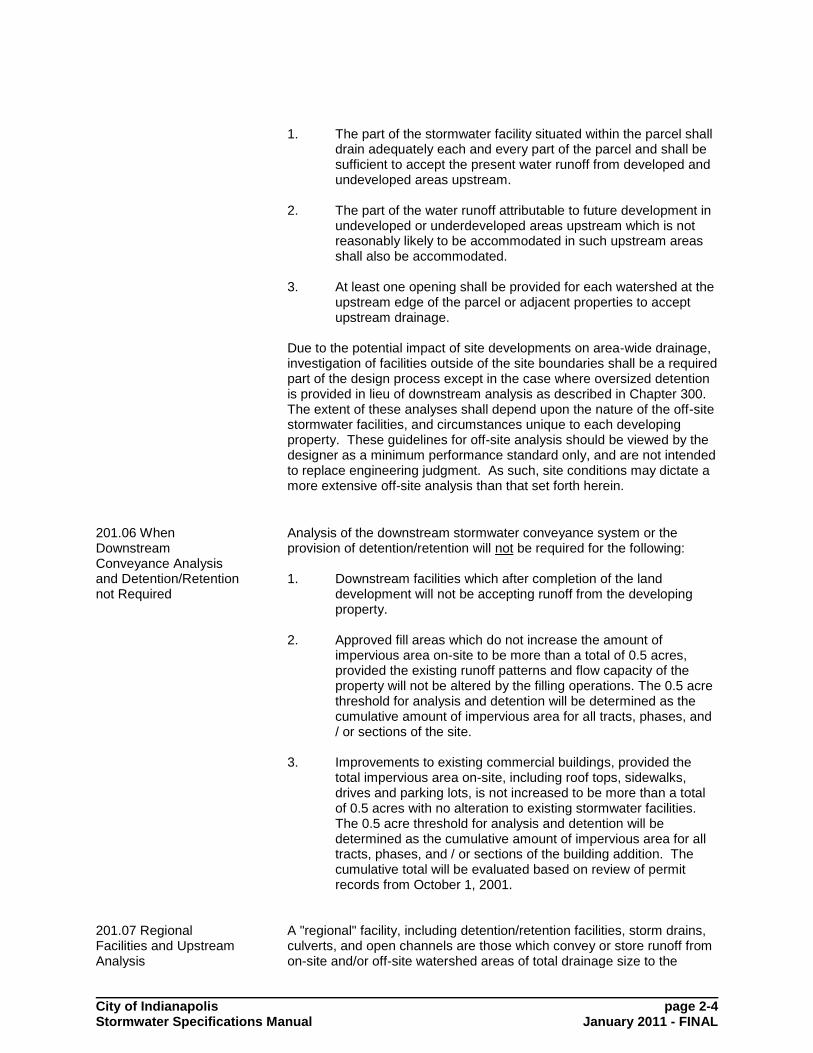
1. The part of the stormwater facility situated within the parcel shall
drain adequately each and every part of the parcel and shall be sufficient to accept the present water runoff from developed and undeveloped areas upstream.
2. The part of the water runoff attributable to future development in
undeveloped or underdeveloped areas upstream which is not reasonably likely to be accommodated in such upstream areas shall also be accommodated.
3. At least one opening shall be provided for each watershed at the upstream edge of the parcel or adjacent properties to accept upstream drainage.
Due to the potential impact of site developments on area-wide drainage, investigation of facilities outside of the site boundaries shall be a required part of the design process except in the case where oversized detention is provided in lieu of downstream analysis as described in Chapter 300. The extent of these analyses shall depend upon the nature of the off-site stormwater facilities, and circumstances unique to each developing property. These guidelines for off-site analysis should be viewed by the designer as a minimum performance standard only, and are not intended to replace engineering judgment. As such, site conditions may dictate a more extensive off-site analysis than that set forth herein.
201.06 When Downstream Conveyance Analysis and Detention/Retention not Required
Analysis of the downstream stormwater conveyance system or the provision of detention/retention will not be required for the following: 1. Downstream facilities which after completion of the land
development will not be accepting runoff from the developing property.
2. Approved fill areas which do not increase the amount of
impervious area on-site to be more than a total of 0.5 acres, provided the existing runoff patterns and flow capacity of the property will not be altered by the filling operations. The 0.5 acre threshold for analysis and detention will be determined as the cumulative amount of impervious area for all tracts, phases, and / or sections of the site.
3. Improvements to existing commercial buildings, provided the
total impervious area on-site, including roof tops, sidewalks, drives and parking lots, is not increased to be more than a total of 0.5 acres with no alteration to existing stormwater facilities. The 0.5 acre threshold for analysis and detention will be determined as the cumulative amount of impervious area for all tracts, phases, and / or sections of the building addition. The cumulative total will be evaluated based on review of permit records from October 1, 2001.
201.07 Regional Facilities and Upstream Analysis
A "regional" facility, including detention/retention facilities, storm drains, culverts, and open channels are those which convey or store runoff from on-site and/or off-site watershed areas of total drainage size to the

City of Indianapolis page 2-5 Stormwater Specifications Manual January 2011 - FINAL
facility of five (5) acres or larger. Off-site watershed areas are those which by virtue of existing topography must outlet through the developing property. A complete analysis of those upstream watershed areas contributing flow to a proposed stormwater facility shall be required. The peak flow and/or runoff hydrographs from these areas shall be verified through submission of the following information to the Department: 1. A contour map of sufficient scale and detail to accurately
depict the watershed boundaries. 2. The drainage area in either acres or square miles. 3. Runoff curve numbers and time of concentration
estimates, with supporting computations, as applicable for each watershed basin.
4. The estimated peak discharge and/or runoff hydrograph
for each sub-basin for each design storm frequency analyzed.
5. All pertinent information relating to procedures used to
compute runoff within those guidelines set forth herein.
SECTION 202 RAINFALL 202.01 Rainfall Data The rainfall intensity is the average rainfall rate, in inches per hour, for a
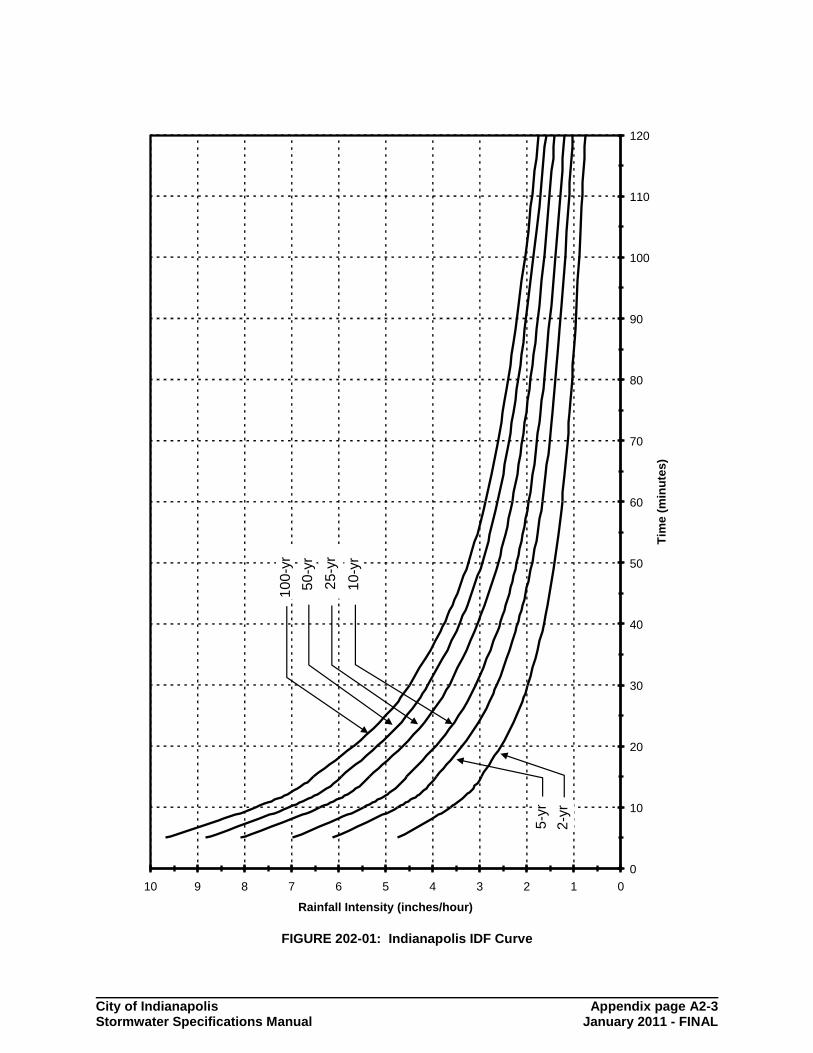
given frequency, having a duration equal to the time of concentration. The rainfall intensities listed in Table 202-1, and 202-2 shall be used for all hydrologic analysis in Marion County. After the design storm frequency has been selected in conformance with Chapter 201.04 of this Manual and the total time-of-concentration has been determined as described by Section 203 of this chapter, the rainfall intensity may be determined from Figure 202-1, the rainfall Intensity-Duration- Frequency (IDF) Curve for Indianapolis, Indiana. The intensities based on the appropriate durations and frequencies may also be determined by Equation 202.01 and the coefficients listed in Table 202-1. Equation 202.01 is a standard form for IDF curves. The coefficients were derived from a combination of locally derived data and NOAA isopluvial maps. Contact the Department for more details.
b)+(t
a=i
N (Equation 202.01)
where: i = rainfall intensity (in/hr) t = time (minutes) a, b, and N are fitting values listed in Table 202-1
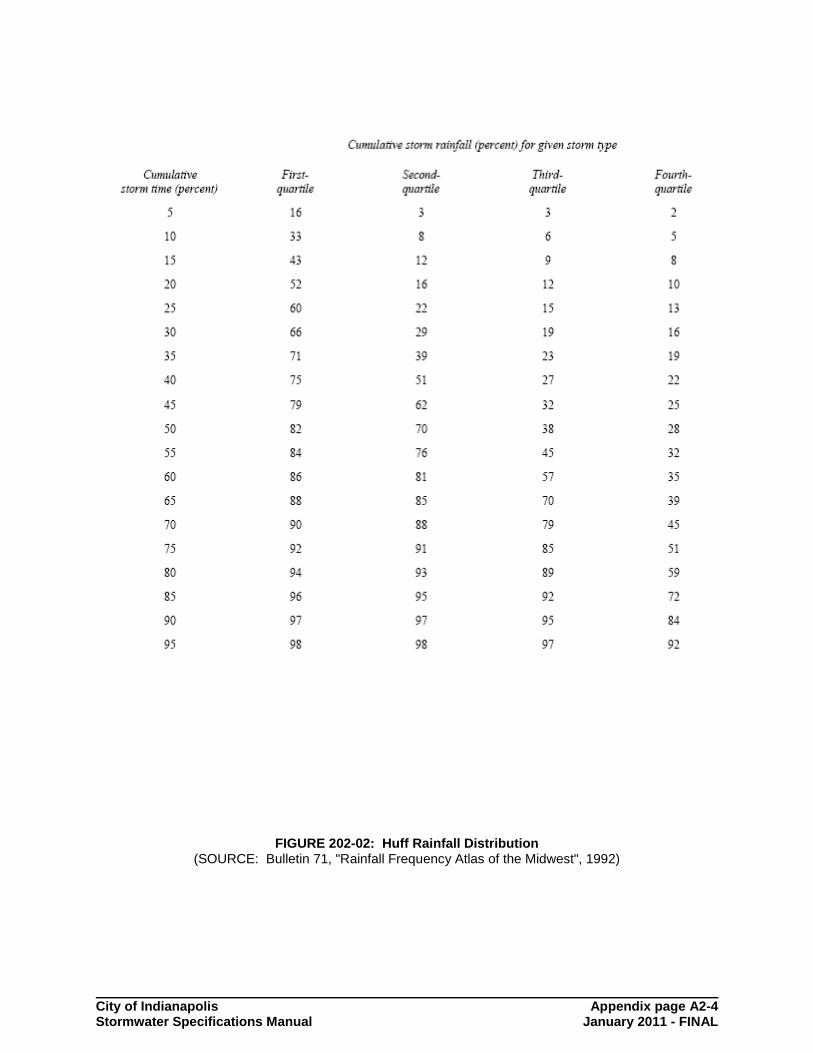
202.02 Rainfall Distribution
Staff has determined that Huff rainfall distributions most accurately reflect rainfall conditions in Indianapolis. The appropriate Huff storm distribution„s fifty percent (50%) probability curve or column shall be used
City of Indianapolis page 2-6 Stormwater Specifications Manual January 2011 - FINAL
for hydrograph computations, as is applicable for the design methodology. Figure 202-2 and Table 202-3 can be referenced for the appropriate distribution.
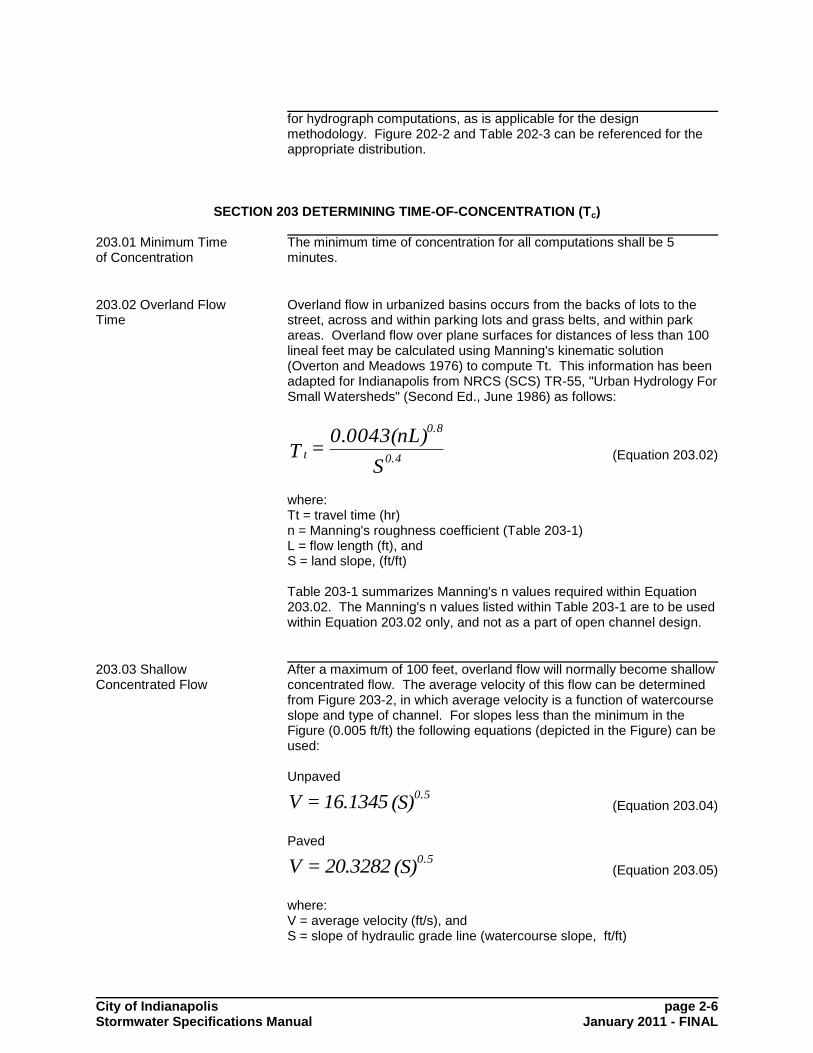
SECTION 203 DETERMINING TIME-OF-CONCENTRATION (Tc)
203.01 Minimum Time of Concentration
The minimum time of concentration for all computations shall be 5 minutes.
203.02 Overland Flow Time
Overland flow in urbanized basins occurs from the backs of lots to the street, across and within parking lots and grass belts, and within park areas. Overland flow over plane surfaces for distances of less than 100 lineal feet may be calculated using Manning's kinematic solution (Overton and Meadows 1976) to compute Tt. This information has been adapted for Indianapolis from NRCS (SCS) TR-55, "Urban Hydrology For Small Watersheds" (Second Ed., June 1986) as follows:
S
)0.0043(nL=T 0.4
0.8
t (Equation 203.02)
where: Tt = travel time (hr) n = Manning's roughness coefficient (Table 203-1) L = flow length (ft), and S = land slope, (ft/ft) Table 203-1 summarizes Manning's n values required within Equation 203.02. The Manning's n values listed within Table 203-1 are to be used within Equation 203.02 only, and not as a part of open channel design.
203.03 Shallow Concentrated Flow
After a maximum of 100 feet, overland flow will normally become shallow concentrated flow. The average velocity of this flow can be determined from Figure 203-2, in which average velocity is a function of watercourse slope and type of channel. For slopes less than the minimum in the Figure (0.005 ft/ft) the following equations (depicted in the Figure) can be used: Unpaved
(S)16.1345=V0.5
(Equation 203.04)
Paved
(S)20.3282=V0.5
(Equation 203.05)
where: V = average velocity (ft/s), and S = slope of hydraulic grade line (watercourse slope, ft/ft)

City of Indianapolis page 2-7 Stormwater Specifications Manual January 2011 - FINAL
203.04 Paved Gutter and Open Channel Flow
The travel time within the storm drain, gutter, swale, ditch, or other drainage way can be determined through an analysis of the hydraulic properties of these conveyance systems as bankfull or pipe full using Manning's equation, which follows:
SRn
1.486=V 1/22/3
(Equation 203.06)
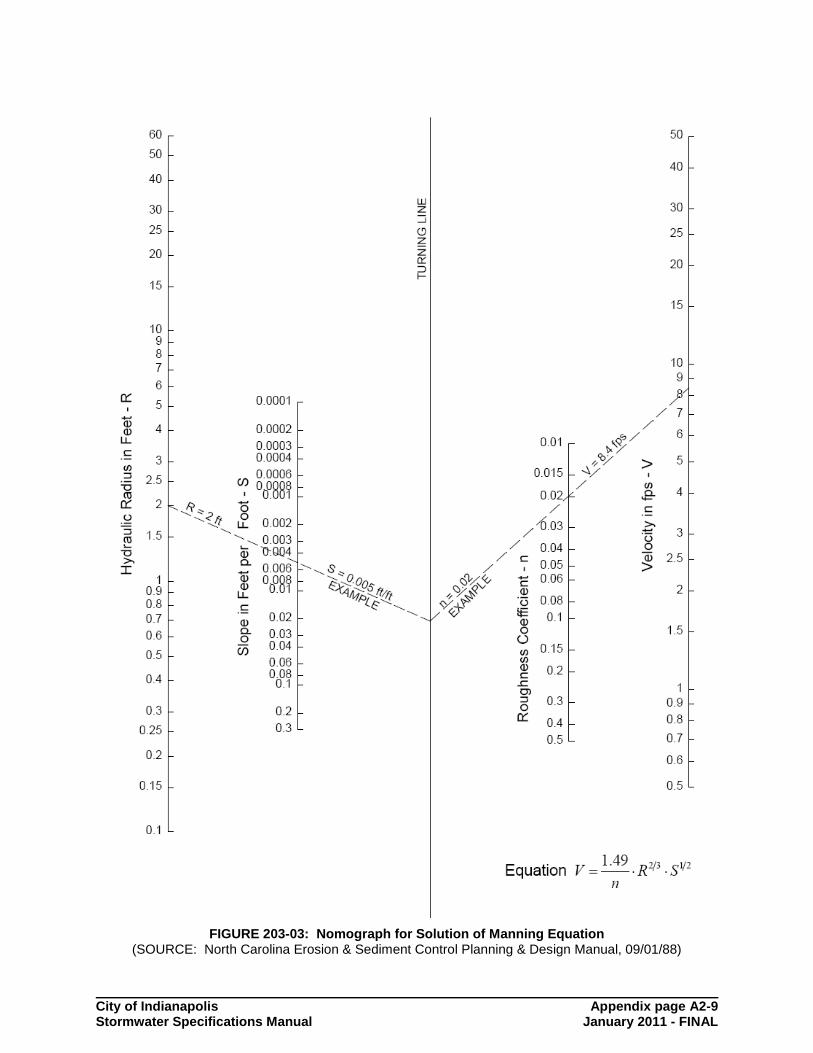
where: V = average velocity (ft/s) R = hydraulic radius (ft) and equals A/Pw A = cross sectional flow area (sq.ft.)Pw= wetted perimeter (feet) S = slope of energy grade line (channel slope, ft/ft), and n = Manning's roughness coefficient for open channel flow Values of Manning's "n" for use in Manning's equation may be obtained from standard design textbooks such as Chow (1959) and Linsley et al. (1962). These values are also included as a part of discussion of Manning's equation within Chapter 300 of this Manual, "Stormwater Hydraulics". Figure 203-3 presents a nomograph for computation of open channel flow velocities through use of Manning's equation (Equation 203.06). Storm drain flow time is typically calculated by choosing a pipe or channel configuration and calculating the flow velocity (V). This time is then found by the following:
60V
L=T t (Equation 203.07)
where: Tt = travel time in pipe (min) L = reach length (ft) V = velocity in reach (ft/sec) = Q/A
SECTION 204 PEAK FLOW COMPUTATIONS
204.01 Introduction
Peak flow value estimates can be made using either peak-flow-only methods (discussed in this section) or methods which generate the total outflow hydrograph (peak, volume and timing of the flow) discussed in the next section.
204.02 Rational Formula
Peak discharges for watershed areas less than five (5) acres may be computed using the Rational Method. The Rational Method is based upon the following equation:
CiA=Q (Equation 204.01)
City of Indianapolis page 2-8 Stormwater Specifications Manual January 2011 - FINAL
where: Q = peak discharge (cubic feet per second or cfs) C = the runoff coefficient, or the ratio of peak runoff rate to average
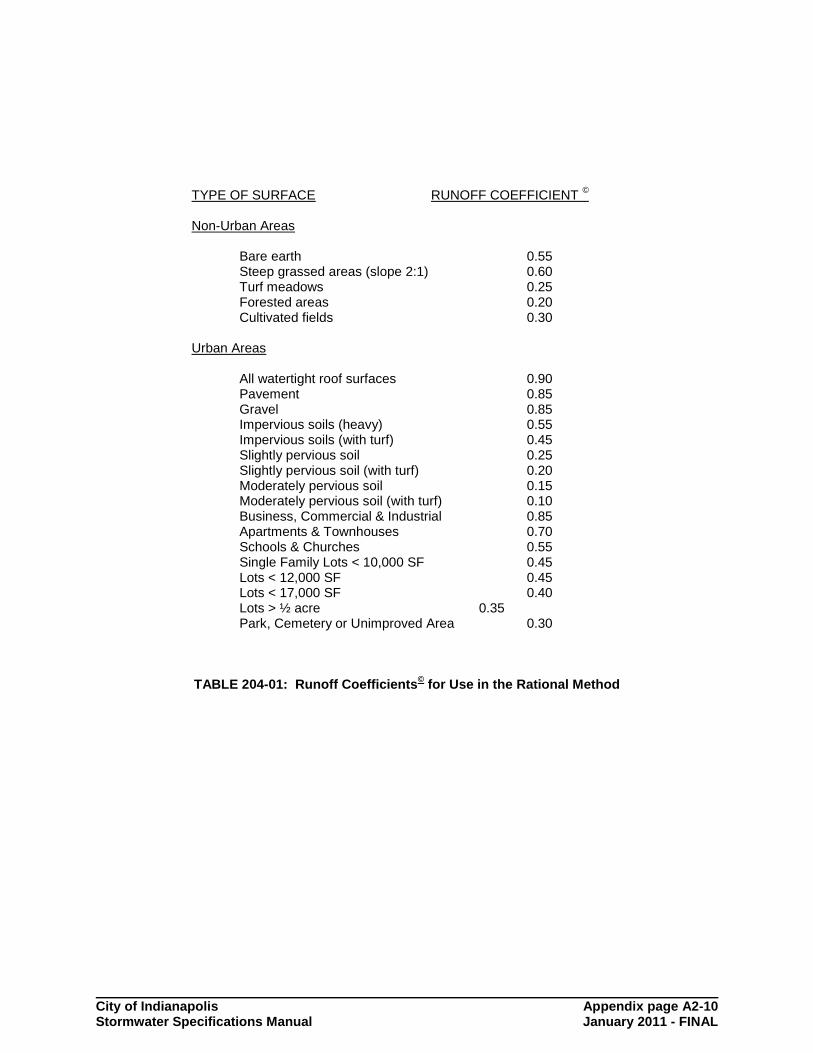
rainfall rate over the watershed during the time of concentration (tc) i = the rainfall intensity (inches/hour) A = the contributing area of watershed under consideration (acres) Where distinctive land use features are known, use of a composite or "weighted" C factor shall be required. Runoff coefficients for use within the Rational Method are summarized within Table 204-1.
SECTION 205 HYDROGRAPH GENERATION METHODS
205.01 NRCS (SCS) Method Reference
The following information has been developed from information contained within Chapter 4 of the USDA NRCS (SCS) National Engineering Handbook (NEH-4) or FHWA publication Hydraulic Engineering Circular # 19, "Hydrology". This document should be referenced for further information.
205.02 NRCS (SCS) Method Formulas
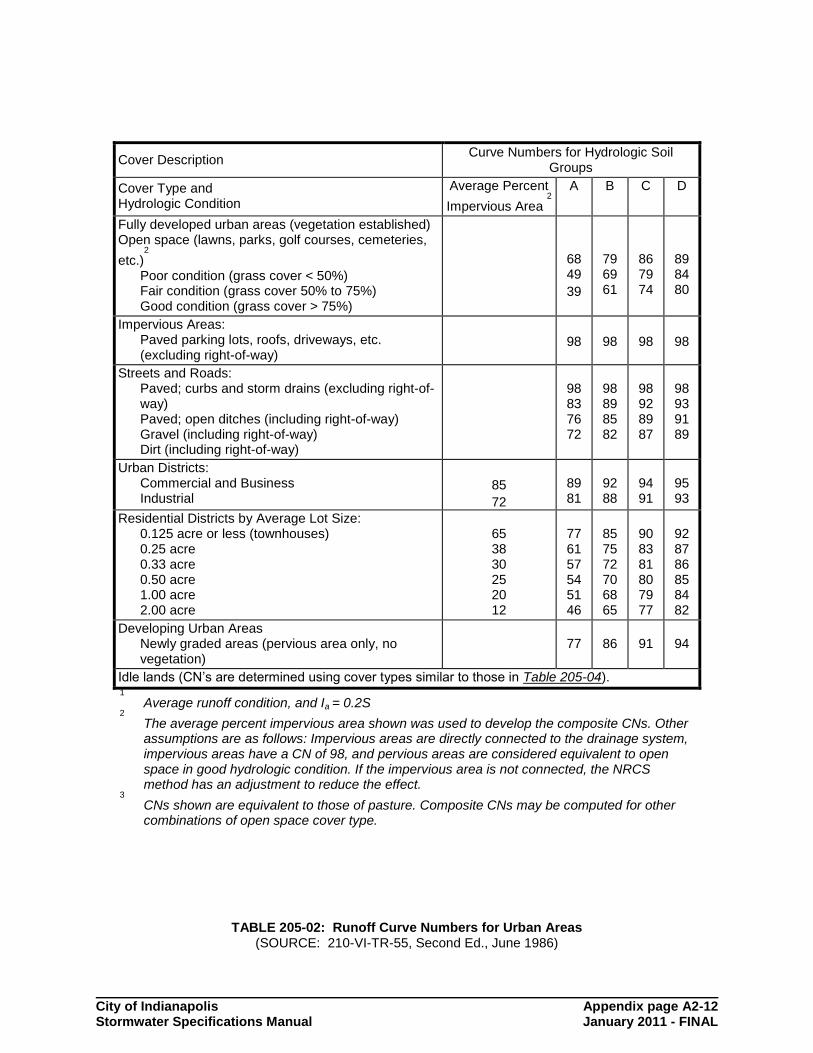
The major factors that determine the runoff curve number are the hydrologic soil group (HSG), cover type, land treatment, hydrologic condition, and antecedent runoff condition. The NRCS (SCS) runoff equation is as follows:
S+)I(P
)I(P=Q
ma
2
a
v (Equation 205.01)
where: Qv = runoff (inches) P = rainfall (inches) Sm = potential maximum retention after runoff begins Ia = initial abstraction The SCS has found the Ia to be approximated by the following empirical equation:
S0.2=I ma (Equation 205.02)
By substituting Equation 205.02 into Equation 205.01, the following runoff equation is derived:
S0.8+P
)S0.2(P=Q
m
2
m
v (Equation 205.03)
The value of Sm is related to the soil and cover conditions of the watershed through the CN. The value of CN has a range of 0 to 100, and Sm is related to CN by the following equation:
10-(1000/CN)=Sm (Equation 205.04)
City of Indianapolis page 2-9 Stormwater Specifications Manual January 2011 - FINAL
205.03 NRCS (SCS) Curve Numbers
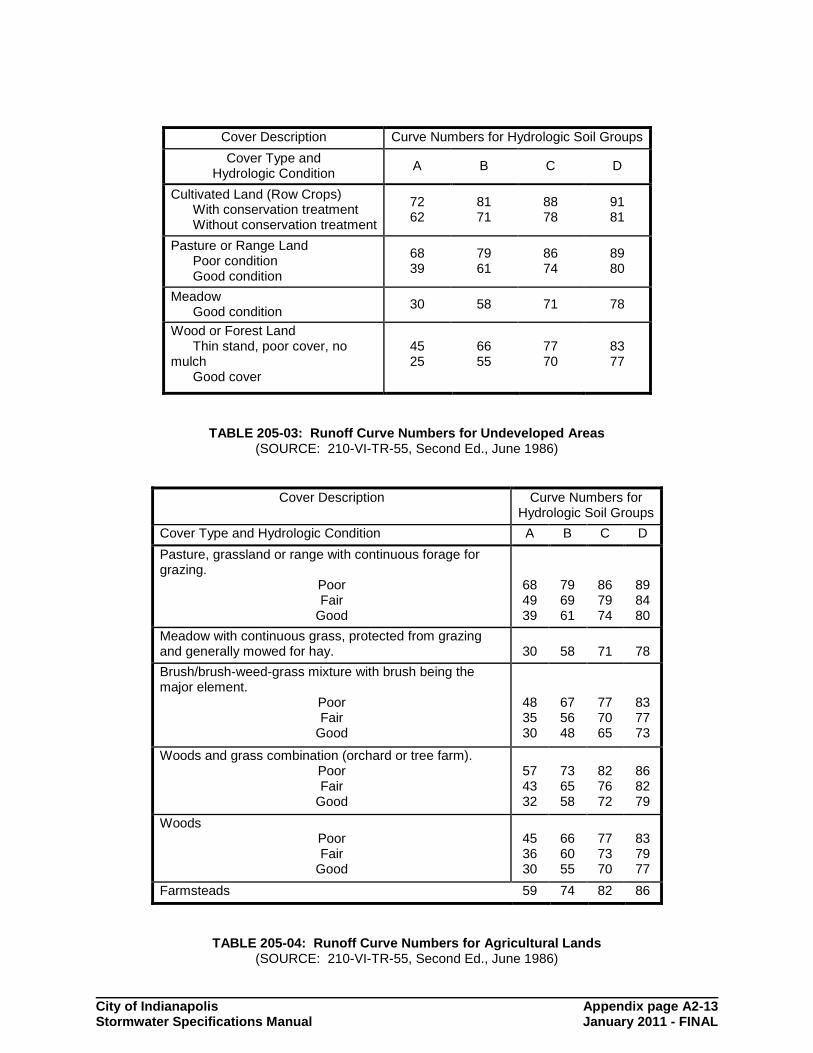
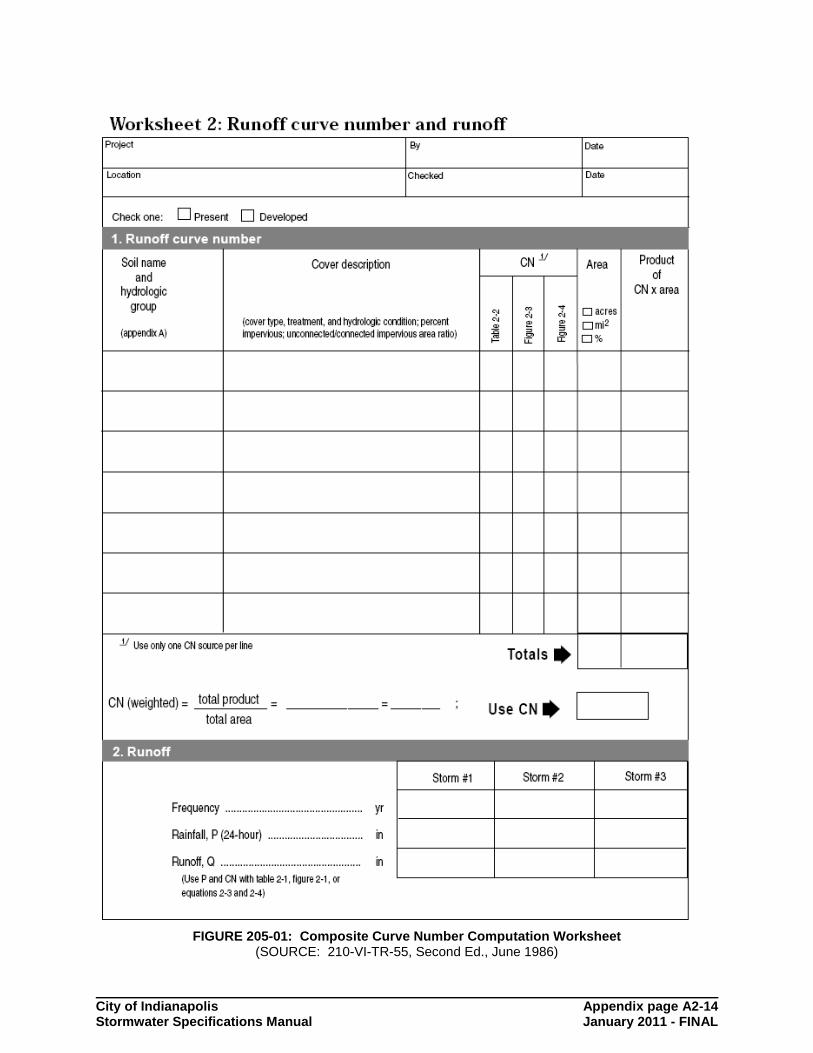
Runoff curve numbers are derived from comparisons of different combinations of the ultimate abstraction (S) and the rainfall depth (P). Soils are classified into four Hydrologic Soils Groups (HSG's) according to their minimum infiltration rate. The hydrologic grouping of Marion County soils, as well as other soil and water features are summarized within Table 205-1. The USDA NRCS (SCS) "Soil Survey for Marion County, Indiana" should be referenced for additional soils information. Tables 205-2, 205-3 and 205-4 may be referenced for information regarding determination of runoff curve numbers for various land uses and hydrologic soil groups. Where distinctive land features are known, use of a composite or "weighted" curve number shall be required. A form for weighted curve number computations (Figure 205-1) is presented in the Appendix. When two soils types are listed (e.g. drained / undrained) drained soil conditions should be used for the pre-developed / allowable release rate calculations and undrained conditions shall be assumed in the post-developed model for soils unaffected by the proposed construction.
Agricultural soils shall assume crops in good condition for the pre-developed / allowable release rate and bare with no cover for the post-developed model for soils unaffected by the proposed construction.
205.04 NRCS (SCS) Unit Hydrographs
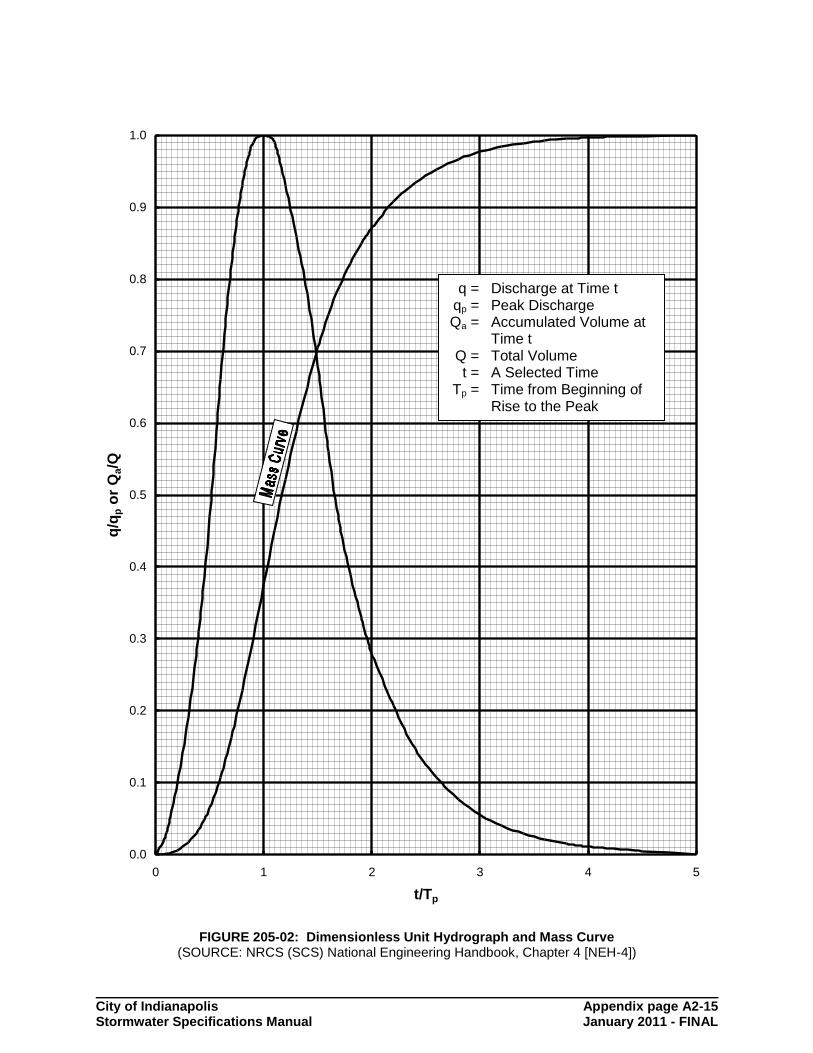
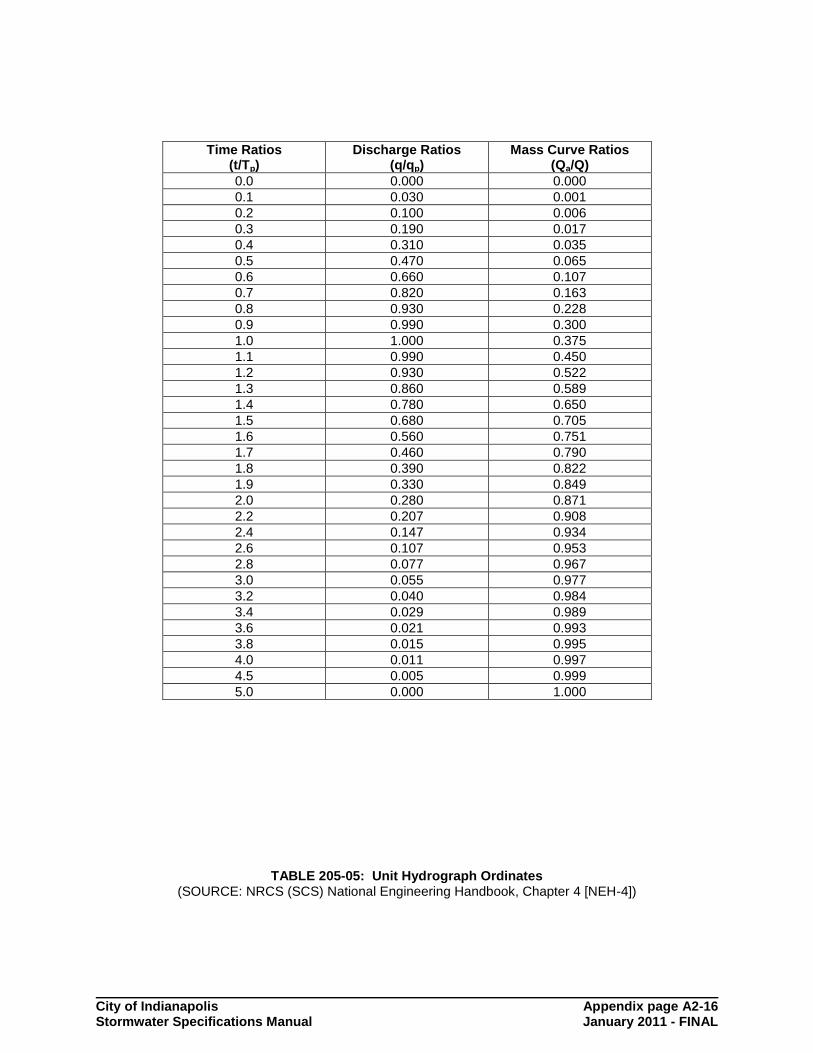
The USDA Soil Conservation Service (SCS) has developed methods of calculating runoff for any storm, by subtracting infiltration and other losses from rainfall depth to obtain precipitation excess (Reference NRCS (SCS) National Engineering Handbook, Chapter 4 [NEH-4]). Two types of hydrographs are used in the NRCS (SCS) procedure, dimensionless hydrographs and composite hydrographs. A unit hydrograph, Figure 205-2 represents the time distribution of flow resulting from one inch of direct runoff occurring over the watershed in a specified time. Unit hydrograph time and discharge ratios are shown in Table 205-5. The NRCS (SCS) method uses the dimensionless unit hydrograph, as defined in NEH-4, to develop incremental hydrographs for small durations of the total design storm. These incremental hydrographs are then combined into a composite hydrograph for the drainage area. Characteristics of the dimensionless hydrograph vary with the size, shape, and slope of the tributary drainage area. The most significant characteristics affecting the dimensionless hydrograph shape are the basin lag and the peak discharge for a given rainfall. Basin lag in this method is defined as the time from the center of mass of rainfall excess to the hydrograph peak. The following equation is used to determine basin lag time:
T0.6=T cL (Equation 205.05)
where: TL = basin lag time (hours) Tc = time of concentration (hours)

City of Indianapolis page 2-10 Stormwater Specifications Manual January 2011 - FINAL
The following equations should be used in conjunction with Table 205-5 to determine the shape of the unit hydrograph.
T+(D/2)=T Lp (Equation 205.06)
where: Tp = time to peak (hours) D = duration of excess unit rainfall (hours) TL = lag time of the watershed from Equation 205.05 (hours)
T
Q484A=q
p
vp (Equation 205.07)
where: A = watershed area (square miles) Qv = direct runoff from Equation 205.03 (inches) Tp = time to peak from Equation 205.6 (hours) qp = peak discharge (cfs) The unit hydrographs are applied to the incremental runoff values for the storm event through a process described as convolution to result in a design hydrograph. The process of convolution is described in the publication NEH-4.

City of Indianapolis Appendix page A2-1 Stormwater Specifications Manual January 2011 - FINAL
Return Period a b N R2
2 32.852 7 0.7780 0.99966
5 46.060 8 0.7859 0.99958
10 56.974 9 0.7953 0.99952
25 72.739 10 0.8115 0.99942
50 84.475 11 0.8147 0.99940
100 92.718 11 0.8145 0.99942
TABLE 202-01: IDF Equation Values for Indianapolis, IN
City of Indianapolis Appendix page A2-2 Stormwater Specifications Manual January 2011 - FINAL
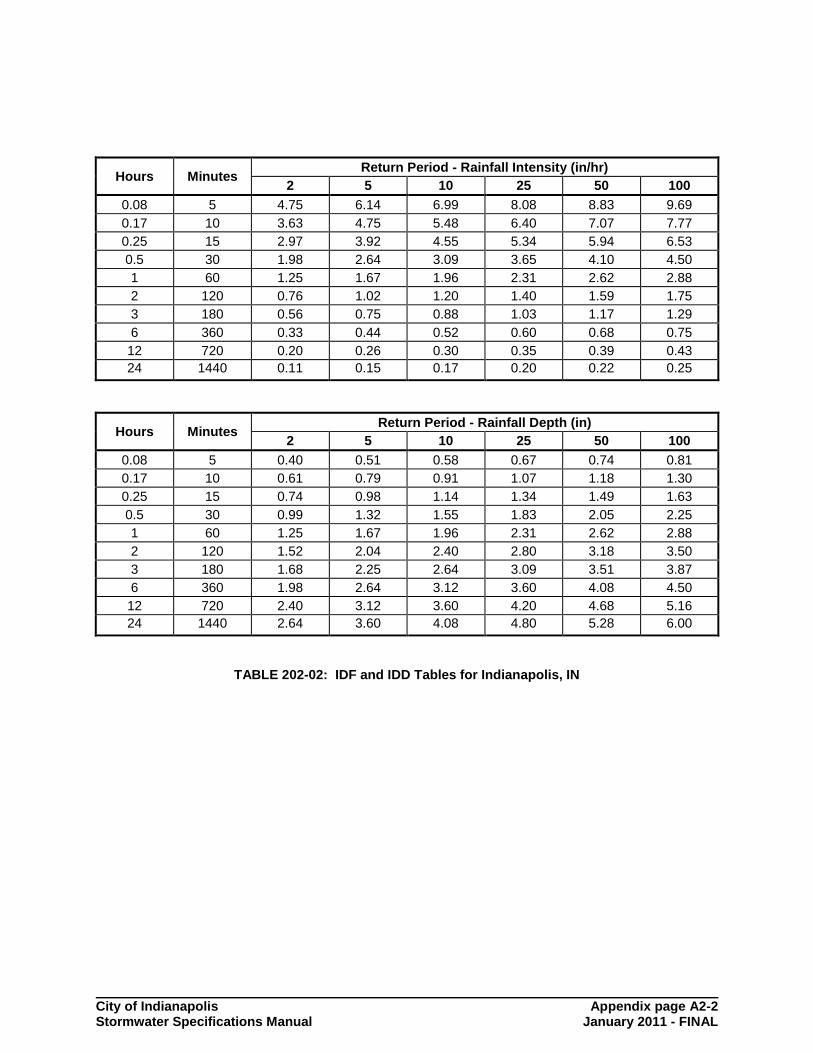
Hours Minutes Return Period - Rainfall Intensity (in/hr)
2 5 10 25 50 100
0.08 5 4.75 6.14 6.99 8.08 8.83 9.69
0.17 10 3.63 4.75 5.48 6.40 7.07 7.77
0.25 15 2.97 3.92 4.55 5.34 5.94 6.53
0.5 30 1.98 2.64 3.09 3.65 4.10 4.50
1 60 1.25 1.67 1.96 2.31 2.62 2.88
2 120 0.76 1.02 1.20 1.40 1.59 1.75
3 180 0.56 0.75 0.88 1.03 1.17 1.29
6 360 0.33 0.44 0.52 0.60 0.68 0.75
12 720 0.20 0.26 0.30 0.35 0.39 0.43
24 1440 0.11 0.15 0.17 0.20 0.22 0.25
Hours Minutes Return Period - Rainfall Depth (in)
2 5 10 25 50 100
0.08 5 0.40 0.51 0.58 0.67 0.74 0.81
0.17 10 0.61 0.79 0.91 1.07 1.18 1.30
0.25 15 0.74 0.98 1.14 1.34 1.49 1.63
0.5 30 0.99 1.32 1.55 1.83 2.05 2.25
1 60 1.25 1.67 1.96 2.31 2.62 2.88
2 120 1.52 2.04 2.40 2.80 3.18 3.50
3 180 1.68 2.25 2.64 3.09 3.51 3.87
6 360 1.98 2.64 3.12 3.60 4.08 4.50
12 720 2.40 3.12 3.60 4.20 4.68 5.16
24 1440 2.64 3.60 4.08 4.80 5.28 6.00
TABLE 202-02: IDF and IDD Tables for Indianapolis, IN
City of Indianapolis Appendix page A2-3 Stormwater Specifications Manual January 2011 - FINAL
FIGURE 202-01: Indianapolis IDF Curve
012345678910
0
10
20
30
40
50
60
70
80
90
100
110
120
Tim
e (
min
ute
s)
Rainfall Intensity (inches/hour)
50
-yr
25
-yr
10
0-y
r
10
-yr
5-y
r
2-y
r
City of Indianapolis Appendix page A2-4 Stormwater Specifications Manual January 2011 - FINAL
FIGURE 202-02: Huff Rainfall Distribution (SOURCE: Bulletin 71, "Rainfall Frequency Atlas of the Midwest", 1992)

City of Indianapolis Appendix page A2-5 Stormwater Specifications Manual January 2011 - FINAL
% Storm Time
%
Precipitation
0
0.0
5
2.7
10
6.5
15
11.0
20
18.1
25
26.0
30
35.9
35
44.7
40
52.9
45
61.0
50
67.9
55
72.5
60
76.5
65
80.2
70
83.8
75
87.2
80
90.7
85
93.3
90
95.9
95
97.9
100
100.0
Estimated Values in Italics
TABLE 202-03: Huff Curve Ordinates
(SOURCE: Purdue, et al, "Statistical Characteristics of Short Time Increment Rainfall")

City of Indianapolis Appendix page A2-6 Stormwater Specifications Manual January 2011 - FINAL
FIGURE 203-01: Time of Concentration or Travel Time Worksheet
(SOURCE: 210-VI-TR-55, Second Ed., June 1986)

City of Indianapolis Appendix page A2-7 Stormwater Specifications Manual January 2011 - FINAL
Surface Description n
Smooth surfaces (concrete, asphalt, gravel, or bare soil) 0.011 Fallow (no residue) 0.05 Cultivated Soils: Residue cover </= 20% 0.06 Residue cover > 20% 0.17 Grass: Short grass prairie 0.15 Dense grasses 0.24 Bermuda grass 0.41 Range (natural) 0.13 Woods: Light underbrush 0.40 Dense underbrush 0.80
TABLE 203-01: Roughness coefficients (Manning's n) for sheet flow

City of Indianapolis Appendix page A2-8 Stormwater Specifications Manual January 2011 - FINAL
FIGURE 203-02: Average Velocities for Estimating Travel Time for Shallow Concentrated Flow
(SOURCE: 210-VI-TR-55, Second Ed., June 1986)
City of Indianapolis Appendix page A2-9 Stormwater Specifications Manual January 2011 - FINAL
FIGURE 203-03: Nomograph for Solution of Manning Equation
(SOURCE: North Carolina Erosion & Sediment Control Planning & Design Manual, 09/01/88)
City of Indianapolis Appendix page A2-10 Stormwater Specifications Manual January 2011 - FINAL
TYPE OF SURFACE RUNOFF COEFFICIENT ©
Non-Urban Areas
Bare earth 0.55 Steep grassed areas (slope 2:1) 0.60 Turf meadows 0.25 Forested areas 0.20 Cultivated fields 0.30
Urban Areas
All watertight roof surfaces 0.90 Pavement 0.85 Gravel 0.85 Impervious soils (heavy) 0.55 Impervious soils (with turf) 0.45 Slightly pervious soil 0.25 Slightly pervious soil (with turf) 0.20 Moderately pervious soil 0.15 Moderately pervious soil (with turf) 0.10 Business, Commercial & Industrial 0.85 Apartments & Townhouses 0.70 Schools & Churches 0.55 Single Family Lots < 10,000 SF 0.45 Lots < 12,000 SF 0.45 Lots < 17,000 SF 0.40 Lots > ½ acre 0.35 Park, Cemetery or Unimproved Area 0.30
TABLE 204-01: Runoff Coefficients© for Use in the Rational Method

City of Indianapolis Appendix page A2-11 Stormwater Specifications Manual January 2011 - FINAL
TABLE 205-01: Soil and Water Features for Marion County, Indiana (SOURCE: NRCS, Soil Survey of Marion county, Indiana, 1991)
City of Indianapolis Appendix page A2-12 Stormwater Specifications Manual January 2011 - FINAL
Cover Description Curve Numbers for Hydrologic Soil
Groups
Cover Type and Hydrologic Condition
Average Percent
Impervious Area 2
A B C D
Fully developed urban areas (vegetation established) Open space (lawns, parks, golf courses, cemeteries,
etc.)2
Poor condition (grass cover < 50%) Fair condition (grass cover 50% to 75%) Good condition (grass cover > 75%)
68 49
39
79 69 61
86 79 74
89 84 80
Impervious Areas: Paved parking lots, roofs, driveways, etc. (excluding right-of-way)
98
98
98
98
Streets and Roads: Paved; curbs and storm drains (excluding right-of-way) Paved; open ditches (including right-of-way) Gravel (including right-of-way) Dirt (including right-of-way)
98 83 76 72
98 89 85 82
98 92 89 87
98 93 91 89
Urban Districts: Commercial and Business Industrial
85
72
89 81
92 88
94 91
95 93
Residential Districts by Average Lot Size: 0.125 acre or less (townhouses) 0.25 acre 0.33 acre 0.50 acre 1.00 acre 2.00 acre
65 38 30 25 20 12
77 61 57 54 51 46
85 75 72 70 68 65
90 83 81 80 79 77
92 87 86 85 84 82
Developing Urban Areas Newly graded areas (pervious area only, no vegetation)
77
86
91
94
Idle lands (CN‟s are determined using cover types similar to those in Table 205-04). 1
Average runoff condition, and Ia = 0.2S
2
The average percent impervious area shown was used to develop the composite CNs. Other assumptions are as follows: Impervious areas are directly connected to the drainage system, impervious areas have a CN of 98, and pervious areas are considered equivalent to open space in good hydrologic condition. If the impervious area is not connected, the NRCS method has an adjustment to reduce the effect.
3
CNs shown are equivalent to those of pasture. Composite CNs may be computed for other combinations of open space cover type.
TABLE 205-02: Runoff Curve Numbers for Urban Areas (SOURCE: 210-VI-TR-55, Second Ed., June 1986)
City of Indianapolis Appendix page A2-13 Stormwater Specifications Manual January 2011 - FINAL
Cover Description Curve Numbers for Hydrologic Soil Groups
Cover Type and Hydrologic Condition
A B C D
Cultivated Land (Row Crops) With conservation treatment Without conservation treatment
72 62
81 71
88 78
91 81
Pasture or Range Land Poor condition Good condition
68 39
79 61
86 74
89 80
Meadow Good condition
30 58 71 78
Wood or Forest Land Thin stand, poor cover, no
mulch Good cover
45 25
66 55
77 70
83 77
TABLE 205-03: Runoff Curve Numbers for Undeveloped Areas (SOURCE: 210-VI-TR-55, Second Ed., June 1986)
Cover Description Curve Numbers for Hydrologic Soil Groups
Cover Type and Hydrologic Condition A B C D
Pasture, grassland or range with continuous forage for grazing.
Poor Fair
Good
68 49 39
79 69 61
86 79 74
89 84 80
Meadow with continuous grass, protected from grazing and generally mowed for hay. 30 58 71 78
Brush/brush-weed-grass mixture with brush being the major element.
Poor Fair
Good
48 35 30
67 56 48
77 70 65
83 77 73
Woods and grass combination (orchard or tree farm). Poor Fair
Good
57 43 32
73 65 58
82 76 72
86 82 79
Woods Poor Fair
Good
45 36 30
66 60 55
77 73 70
83 79 77
Farmsteads 59 74 82 86
TABLE 205-04: Runoff Curve Numbers for Agricultural Lands (SOURCE: 210-VI-TR-55, Second Ed., June 1986)
City of Indianapolis Appendix page A2-14 Stormwater Specifications Manual January 2011 - FINAL
FIGURE 205-01: Composite Curve Number Computation Worksheet
(SOURCE: 210-VI-TR-55, Second Ed., June 1986)
City of Indianapolis Appendix page A2-15 Stormwater Specifications Manual January 2011 - FINAL
0.0
0.1
0.2
0.3
0.4
0.5
0.6
0.7
0.8
0.9
1.0
0 1 2 3 4 5
t/Tp
q/q
p o
r Q
a/Q
FIGURE 205-02: Dimensionless Unit Hydrograph and Mass Curve (SOURCE: NRCS (SCS) National Engineering Handbook, Chapter 4 [NEH-4])
q = Discharge at Time t qp = Peak Discharge Qa = Accumulated Volume at Time t Q = Total Volume t = A Selected Time Tp = Time from Beginning of Rise to the Peak
City of Indianapolis Appendix page A2-16 Stormwater Specifications Manual January 2011 - FINAL
Time Ratios (t/Tp)
Discharge Ratios (q/qp)
Mass Curve Ratios (Qa/Q)
0.0 0.000 0.000
0.1 0.030 0.001
0.2 0.100 0.006
0.3 0.190 0.017
0.4 0.310 0.035
0.5 0.470 0.065
0.6 0.660 0.107
0.7 0.820 0.163
0.8 0.930 0.228
0.9 0.990 0.300
1.0 1.000 0.375
1.1 0.990 0.450
1.2 0.930 0.522
1.3 0.860 0.589
1.4 0.780 0.650
1.5 0.680 0.705
1.6 0.560 0.751
1.7 0.460 0.790
1.8 0.390 0.822
1.9 0.330 0.849
2.0 0.280 0.871
2.2 0.207 0.908
2.4 0.147 0.934
2.6 0.107 0.953
2.8 0.077 0.967
3.0 0.055 0.977
3.2 0.040 0.984
3.4 0.029 0.989
3.6 0.021 0.993
3.8 0.015 0.995
4.0 0.011 0.997
4.5 0.005 0.999
5.0 0.000 1.000
TABLE 205-05: Unit Hydrograph Ordinates (SOURCE: NRCS (SCS) National Engineering Handbook, Chapter 4 [NEH-4])