chapter 21 the use of derivative financial instruments to...
TRANSCRIPT
1
An introduction to interest-rate risk 2
Futures 4
Options 11
Swaps 20
Managing use ofderivatives 25
Summary 27
C H A P T E R 2 1
The Use of DerivativeFinancial Instruments to
Reduce Risk L E A R N I N G O B J E C T I V E S
This chapter builds on the preceding chapters by explaining that a firm’s
borrowings give rise to a form of risk called interest-rate risk. This provides a
platform for discussion of financial instruments that can be used to manage
interest-rate risk. These instruments are called derivatives, notable examples
being futures, options and interest-rate swaps. The workings and uses of these
instruments are explained, along with a discussion of the need for firms to
have a policy for managing risk and using derivatives.
When you have completed this chapter you will:
■ have an appreciation of the general nature of interest-rate risk;
■ recognise the nature and uses of derivative financial instruments;
■ understand the workings of futures contracts and markets;
■ be able to construct elementary risk hedges using interest-rate futures;
■ understand some of the limitations of hedging with futures;
■ know the main differences between futures and forward rate agreements;
■ understand the nature and terminology of options contracts and markets;
■ be able to price options at expiration;
■ appreciate some of the uses of options by the financial manager;
■ understand the general nature of products such as caps, floors and collars;
■ know the general workings of interest-rate swaps;

In previous chapters, we have looked at the characteristics of typical interest-
bearing financial instruments used to fund the firm’s activities, such as bills
(Chapter 7), debentures and other bond-type instruments and term loans and
leases (Chapter 18). A feature of using these instruments is that the borrower
is exposed to interest-rate risk. Unexpected increases in interest rates may
cause a borrower’s expense budget to blow-out. Or they may lead to a
reduction in the value of a portfolio of interest-bearing securities. On the
other hand, a decrease in interest rates may lead to a reduction in an
investor’s interest income.
In this chapter, after a brief examination of the characteristics of interest-
rate risk, we take a look at three types of derivative financial instruments that
are used to manage interest-rate risk. These instruments are called derivatives
because they are based on (derived from) particular physical or actual financial
instruments. We start with a look at futures contracts, which have uses such as
enabling a future interest rate to be set in advance. Subsequently, we take a
look at options, which give the option-holder the right to do things such as
buy or sell a financial instrument in the future at a specific price (thus setting
the interest rate), but not the obligation to do so. We then introduce swaps,
instruments that enable a borrower or lender to do such things as exchange a
variable interest stream for a fixed stream. The chapter concludes with an
overview of the way in which the financial manager should establish a
program to manage interest-rate risk.
AN INTRODUCTION TO INTEREST-RATE RISK
Interest-rate risk is basically the threat posed by unexpected changes in interest
rates. More formally, interest-rate risk can be defined as the uncertainty
surrounding expected returns on a security, brought about by changes in
interest rates. Let us look at some examples.
Suppose a firm has used a bill facility to borrow $500,000 for a year,
planning to rollover the debt every 90 days (that is, to refinance a 90-day bill
with another such bill). Let’s assume that the firm’s first such bill bears an
interest rate of 8% per year and the firm expects this rate to be stable in
successive quarters, although it could vary each quarter as rollover occurs.
Thus, it will budget for annual interest costs of about $40,000 (8% of
2
■ be able to analyse interest flows for basic and intermediated swaps;
■ appreciate some of the uses of swaps by financial managers;
■ recognise the significance of derivatives in contemporary financial markets
and the general circumstances appropriate for their use, as well as their
risks.
interest-rate risk Theuncertainty surrounding expected
returns on a security, brought aboutby changes in interest rates

3
$500,000). However, what if interest rates were to rise in the subsequent
quarters? This would pose a threat to the firm’s budget.The preceding example is indicative of the risk of using floating-rate or
variable rate borrowing. Interest-rate risk affects fixed-rate debt, too. Forexample, if a firm contracts for a four-year, fixed-rate lease, and then interestrates drop unexpectedly, the firm will lose the opportunity to borrow at thelower rate (because it has entered into a fixed-rate borrowing arrangement).Not only does interest-rate risk affect borrowers but also it affects investors.For instance, a holder of treasury savings bonds will receive a fixed rate ofcoupon interest till maturity, so if rates rise on new issues, the investor will losethe opportunity to earn the higher rate. The market recognises this via a fall inthe price of the bonds.1
Historically, finance managers have had few avenues to deal with risk ofthe above kinds. But in the past few decades there has been an explosion ininstruments called derivatives. Among other things, these derivatives are usedfor helping to manage interest-rate risk. Examples are financial futures, optionsand interest-rate swaps. They are called derivatives because they are based on(or derived from) actual (“physical”) financial instruments. For example, onetype of financial future is based on 90-day bank-accepted bills; this futurescontract enables the finance manager to agree, in advance, the future price (andthus interest rate) of a 90-day bill, therefore locking-in the rate and protectingagainst interest-rate changes.
Derivative instruments such as futures contracts are useful to investors aswell as borrowers. They can also be used by speculators aiming to make profitsby speculating on interest-rate movements. In this chapter we emphasise theuse of derivatives as aids to managing interest-rate risk associated with the useof debt-financing instruments of the kinds discussed in previous chapters.However, we shall mention, in passing, other uses of derivatives. As well, itshould be pointed out that instruments such as futures and options can bebased on things other than financial instruments. For example, it is possible toenter futures contracts for some commodities,2 thus enabling, say, a pros-pective buyer of wheat to lock-in a future price and so protect against pricerises in the meantime.
The finance manager needs to be aware of opportunities to manage many
kinds of risks, not only the firm’s interest-bearing borrowings or investments,
but also any risks associated with foreign transactions3 as well as risks
associated with price fluctuations in the key commodities in which the firm
deals. The large firm may have a treasury division whose activities are likely to
embrace the use of derivative instruments. The smaller firm, on the other hand,
is likely to use a financial institution, such as its bank, to sell it products that
help the firm to manage interest-rate risk (for example, the bank may enter a
derivative A financialinstrument that is derived from orbased on another instrument (forexample, a bank-accepted billfutures contract is based on actualbank bills).

4
forward rate agreement, or FRA, with the firm, enabling the firm to lock-in a
future interest rate). In this chapter we will look at futures, options and swaps,
with our main emphasis on the use of these derivative instruments to manage
interest-rate risk. But we will also draw attention to some other derivatives
(such as share options) and their uses.
FUTURES
Using futures contracts to hedge against interest-rate changesIn the previous section we introduced the risk confronted by a borrower using
90-day bank bills to raise about $500,000. How can this borrower hedge the
risk of rising rates by means of futures contracts? Such a contract simply
enables the setting, today, of a future price. Formally, a futures contract may be
defined as a contract to buy or sell a stated commodity or financial claim at a
specified price and specified future date. We now construct a simplified
example showing how to use futures contracts to hedge this risk. Subsequently,
we shall explain more about the mechanics of dealing with futures and some
other features of their use.
E X A M P L E 2 1 . 1
1. A firm is currently paying 8% per year on a 90-day bank bill with a face
value of $500,000. The debt was raised about a month ago, and the firm
wishes to hedge against rising rates when the bill is rolled over in two
months time. The finance manager knows that 90-day bank-accepted bills
(BAB) are traded on the futures exchange in multiples of $500,000, so the
manager can construct a hedge against rising rates.
2. The futures market is currently quoting an 8.2% rate on contracts to be
settled two months hence. (We will explain later the pricing convention used
to specify this rate.) The finance manager’s fear is that rates might rise even
higher, so the manager takes a selling position (called a short position)4 in
the futures market. This means that the manager commits the firm to an
agreement to sell a $500,000, 90-day BAB in two months time, at a rate of
8.2% per year.
3. By agreeing to sell a $500,000 face value BAB at 8.2%, the finance manager
is contracting to sell it for $490,091. Remember from equation (7-8) that
the price of a bill is the present value (P) of its face value (V), given by:
(21-1)PV
RATE n=
+ ( )365
365
futures contract A futurescontract is a contract to buy or sell
a stated commodity (such aswheat) or a financial claim (such
as bank-accepted bills) at aspecified price at some future,
specified time.
short position Agreeing to sellsomething not owned; a “selling
position”. Contrast with longposition.
5
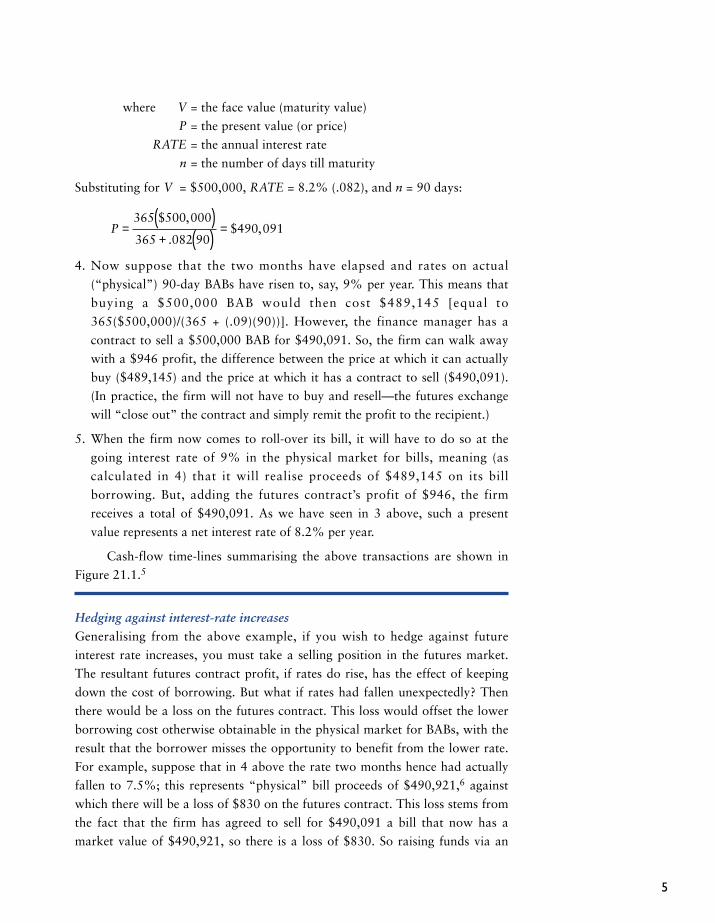
where V = the face value (maturity value)
P = the present value (or price)
RATE = the annual interest rate
n = the number of days till maturity
Substituting for V = $500,000, RATE = 8.2% (.082), and n = 90 days:
4. Now suppose that the two months have elapsed and rates on actual
(“physical”) 90-day BABs have risen to, say, 9% per year. This means that
buying a $500,000 BAB would then cost $489,145 [equal to
365($500,000)/(365 + (.09)(90))]. However, the finance manager has a
contract to sell a $500,000 BAB for $490,091. So, the firm can walk away
with a $946 profit, the difference between the price at which it can actually
buy ($489,145) and the price at which it has a contract to sell ($490,091).
(In practice, the firm will not have to buy and resell—the futures exchange
will “close out” the contract and simply remit the profit to the recipient.)
5. When the firm now comes to roll-over its bill, it will have to do so at the
going interest rate of 9% in the physical market for bills, meaning (as
calculated in 4) that it will realise proceeds of $489,145 on its bill
borrowing. But, adding the futures contract’s profit of $946, the firm
receives a total of $490,091. As we have seen in 3 above, such a present
value represents a net interest rate of 8.2% per year.
Cash-flow time-lines summarising the above transactions are shown in
Figure 21.1.5
Hedging against interest-rate increasesGeneralising from the above example, if you wish to hedge against future
interest rate increases, you must take a selling position in the futures market.
The resultant futures contract profit, if rates do rise, has the effect of keeping
down the cost of borrowing. But what if rates had fallen unexpectedly? Then
there would be a loss on the futures contract. This loss would offset the lower
borrowing cost otherwise obtainable in the physical market for BABs, with the
result that the borrower misses the opportunity to benefit from the lower rate.
For example, suppose that in 4 above the rate two months hence had actually
fallen to 7.5%; this represents “physical” bill proceeds of $490,921,6 against
which there will be a loss of $830 on the futures contract. This loss stems from
the fact that the firm has agreed to sell for $490,091 a bill that now has a
market value of $490,921, so there is a loss of $830. So raising funds via an
P =( )+ ( ) =
365 500 000
365 082 90490 091
$ ,
.$ ,

6
actual bill at the ruling physical market rate of 7.5% would realise proceeds of
$490,921, from which the loss of $830 on the futures contract must be
deducted. Therefore, net proceeds of the bill rollover would be $490,091
which, as we have seen, represents a net interest rate of 8.2%. The cash-flow
diagrams for this situation are depicted in Figure 21.2.
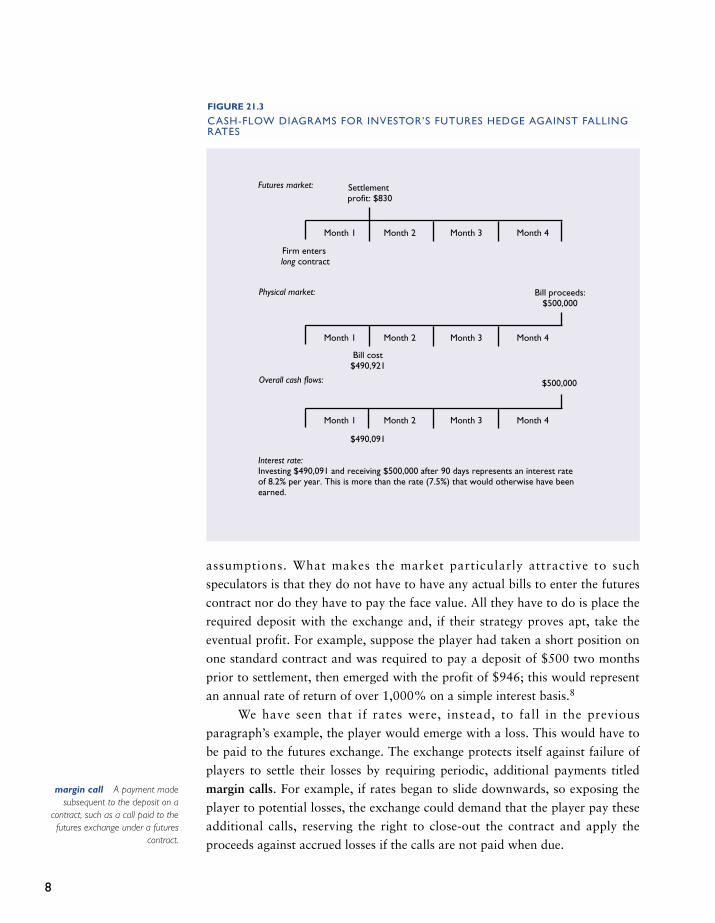
Hedging against falling interest ratesAn investor or potential investor faces the converse problem to that of the
borrower illustrated above; the investor will want to hedge against falling
rates. This can be accomplished by taking a buying position in the futures
market (called a long position). That is, the investor enters a contract agreeing
to buy a BAB in the future, at a price specified today. For example, suppose
that a firm expects to have about $500,000 to invest in bank bills in a month’s
time. The firm fears that rates may fall below the level of 8.2% currently
quoted in the futures market for settlement a month hence, so it enters a
futures contract, to be settled then, agreeing to buy a $500,000 BAB. Now,
suppose that a month has elapsed and rates have fallen to 7.5% on bank bills.
As computed above, the firm would have to outlay $490,921 to invest in (buy)
a $500,000 90-day bill yielding 7.5%. But the firm has a contract enabling it
long position An agreement tobuy, or a “buying position”;
contrasted with a short position.
FIGURE 21.1
CASH-FLOW DIAGRAMS FOR BORROWER’S FUTURES HEDGE AGAINST RISINGRATES
Month 1 Month 2 Month 3 Month 4 Month 5
Settlement profit:$946
Firm enters short contract
Month 1 Month 2 Month 3 Month 4 Month 5
Bill proceeds:$489,145
Month 1 Month 2 Month 3 Month 4 Month 5
Bill matures$500,000
$490,091
Futures market:
Physical market:
Overall cash flows:
Interest rate: Borrowing $490,091 and repaying $500,000 after 90 days represents an interest rate of 8.2% per year, less than the rate (9%) that would have to be paid if the hedge had not been taken.
$500,000

7
to buy for only $490,091, the price for the contracted futures rate of 8.2%.
Accordingly, there is a futures contract profit of $830 which enables the firm to
reduce its net outlay on an actual $500,000 bill from $490,921 to $490,091,
so netting a yield of 8.2%,7 as planned via the hedging strategy. The cash-flow
diagrams for this hedge are shown in Figure 21.3.
Using futures contracts for speculative purposesThe efficient functioning of the futures market depends on having a reasonable
“depth” to the market. The volume of contracts is swelled by the presence of
speculators, who buy and sell futures with a view to profit rather than hedging.
For example, suppose a speculator believes that interest rates will rise above
the level at which futures contracts are currently being traded. Drawing on the
previous example of $500,000 BAB futures, we saw that, if rates rise, a profit
is produced by means of taking a selling position. Specifically, a standard
futures contract for $500,000 face value BABs at 8.2% would produce a profit
of $946 if rates rose to 9%. Since it is customary for the futures exchange
to settle the profit (or loss) with the market player, the speculator can walk
away with nearly a $1,000 profit per standard contract, under the above
FIGURE 21.2
CASH-FLOW DIAGRAMS FOR BORROWER ’S FUTURES HEDGE AGAINST RISINGRATES WHEN RATES ACTUALLY FALL
Month 1 Month 2 Month 3 Month 4 Month 5
Settlement loss: $830
Firm enters short contract
Month 1 Month 2 Month 3 Month 4 Month 5
Bill proceeds:$490,921
Month 1 Month 2 Month 3 Month 4 Month 5
Bill matures$500,000
$490,091
Futures market:
Physical market:
Overall cash flows:
Interest rate: Borrowing $490,091 and repaying $500,000 after 90 days represents an interest rate of 8.2% per year, more than the rate (7.5%) that would be paid if the futures contract had not been taken. In retrospect, this hedge proved unnecessary and prevented the firm from benefitting from a lower rate in the physical market.
$500,000
8
assumptions. What makes the market particularly attractive to such
speculators is that they do not have to have any actual bills to enter the futures
contract nor do they have to pay the face value. All they have to do is place the
required deposit with the exchange and, if their strategy proves apt, take the
eventual profit. For example, suppose the player had taken a short position on
one standard contract and was required to pay a deposit of $500 two months
prior to settlement, then emerged with the profit of $946; this would represent
an annual rate of return of over 1,000% on a simple interest basis.8
We have seen that if rates were, instead, to fall in the previous
paragraph’s example, the player would emerge with a loss. This would have to
be paid to the futures exchange. The exchange protects itself against failure of
players to settle their losses by requiring periodic, additional payments titled
margin calls. For example, if rates began to slide downwards, so exposing the
player to potential losses, the exchange could demand that the player pay these
additional calls, reserving the right to close-out the contract and apply the
proceeds against accrued losses if the calls are not paid when due.
margin call A payment madesubsequent to the deposit on a
contract, such as a call paid to thefutures exchange under a futures
contract.
FIGURE 21.3
CASH-FLOW DIAGRAMS FOR INVESTOR ’S FUTURES HEDGE AGAINST FALLINGRATES
Month 1 Month 2 Month 3 Month 4
Settlement profit: $830
Firm enters long contract
Month 1 Month 2 Month 3 Month 4
Bill proceeds:$500,000
Month 1 Month 2 Month 3 Month 4
Bill cost$490,921
$500,000
Futures market:
Physical market:
Overall cash flows:
Interest rate: Investing $490,091 and receiving $500,000 after 90 days represents an interest rate of 8.2% per year. This is more than the rate (7.5%) that would otherwise have been earned.
$490,091
9
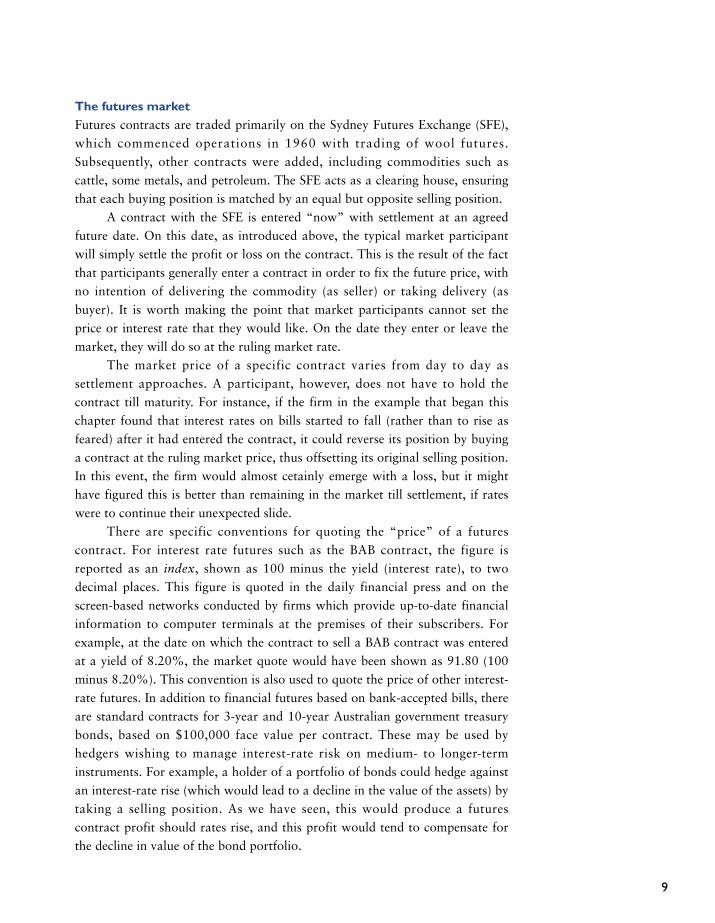
The futures marketFutures contracts are traded primarily on the Sydney Futures Exchange (SFE),which commenced operations in 1960 with trading of wool futures.Subsequently, other contracts were added, including commodities such ascattle, some metals, and petroleum. The SFE acts as a clearing house, ensuringthat each buying position is matched by an equal but opposite selling position.
A contract with the SFE is entered “now” with settlement at an agreedfuture date. On this date, as introduced above, the typical market participantwill simply settle the profit or loss on the contract. This is the result of the factthat participants generally enter a contract in order to fix the future price, withno intention of delivering the commodity (as seller) or taking delivery (asbuyer). It is worth making the point that market participants cannot set theprice or interest rate that they would like. On the date they enter or leave themarket, they will do so at the ruling market rate.
The market price of a specific contract varies from day to day assettlement approaches. A participant, however, does not have to hold thecontract till maturity. For instance, if the firm in the example that began thischapter found that interest rates on bills started to fall (rather than to rise asfeared) after it had entered the contract, it could reverse its position by buyinga contract at the ruling market price, thus offsetting its original selling position.In this event, the firm would almost cetainly emerge with a loss, but it mighthave figured this is better than remaining in the market till settlement, if rateswere to continue their unexpected slide.
There are specific conventions for quoting the “price” of a futurescontract. For interest rate futures such as the BAB contract, the figure isreported as an index, shown as 100 minus the yield (interest rate), to twodecimal places. This figure is quoted in the daily financial press and on thescreen-based networks conducted by firms which provide up-to-date financialinformation to computer terminals at the premises of their subscribers. Forexample, at the date on which the contract to sell a BAB contract was enteredat a yield of 8.20%, the market quote would have been shown as 91.80 (100minus 8.20%). This convention is also used to quote the price of other interest-rate futures. In addition to financial futures based on bank-accepted bills, thereare standard contracts for 3-year and 10-year Australian government treasurybonds, based on $100,000 face value per contract. These may be used byhedgers wishing to manage interest-rate risk on medium- to longer-terminstruments. For example, a holder of a portfolio of bonds could hedge againstan interest-rate rise (which would lead to a decline in the value of the assets) bytaking a selling position. As we have seen, this would produce a futurescontract profit should rates rise, and this profit would tend to compensate forthe decline in value of the bond portfolio.

10
Apart from BAB and bond futures, another popular financial futures
contract is based on movements in the share-price index (SPI). This involves a
standard contract equal to twenty-five dollars times the value of the ASX 200
Share Price Index.9 For example, if the index value on a particular day is 2120,
each contract will be settled at $53,000 ($25 × 2120). To give an illustration of
the use of this contract, suppose an investor with a diversified portfolio
currently worth about $1 million wants to protect against a fall in its value in a
year’s time. If the current futures market quote is 2120 for settlement a year
hence, the investor can take a selling position (agreeing to sell about 19
standard contracts, therefore, at a settlement price of $1,007,000, or 19 ×$53,000). Suppose that a year later, at settlement date, the actual market index
has fallen by 30 points to 2090; the investor will then emerge with a profit of
$750 (30 points × $25) per contract, an overall profit of $14,250. This profit
will help to compenstate for the fall in the worth of the portfolio that is
implicit in the decreased index value.
Limitations of hedging with futures contractsThere are a number of difficulties associated with hedging by use of futures
contracts. Some of these difficulties can be illustrated by reference to BAB
futures.
• Futures are traded in standard amounts or quantities. For example, each
BAB futures contract is for a bill with a face value of $500,000. Thus,
market participants wishing to hedge amounts other than multiples of
$500,000 may be unable to develop an exact hedge.
• The price (or rate) on the futures contract is for a specific commodity.
Trying to hedge a different commodity may not produce an exact hedge. For
instance, BAB futures are naturally suited to hedging actual borrowings of,
or investments in, bank bills. If a borrower has raised some other form of
short-term debt, its interest rate may not move in line with rates on BAB’s,
so it will be difficult to construct a perfect hedge.
• Futures contracts are settled on specified dates. Unless these dates coincide
with the dates of physical market transactions that the hedger wishes to
employ, there will be a “gap” in the hedging process.
Forward rate agreementsLimitations of futures contracts such as those outlined above have left the way
open to financial institutions such as commercial banks and merchant banks to
market instruments called forward rate agreements (FRAs). In fact, FRAs
predate the development of futures markets. A forward rate agreement is a
contract between two parties whereby there is an agreement on a future
interest rate, starting at a specific future date. Because they are arranged
forward rate agreement Acontract in which two parties agree
to an interest rate for a futureperiod, starting at a specified
future date.
11
directly between two parties, rather than through an exchange, they are called
over-the-counter (OTC) transactions.Why would a firm want to enter into a FRA? It might, for example, be
receiving a $2 million cash payment four months from now that it would be
able to invest for 9 months in a security whose rates are not perfectly aligned
with bank bills, and so by entering into a FRA with an appropriate interest-
rate basis, it can lock-in its earning rate. Note that there is no exchange of
principal; instead, the two parties exchange a profit or loss based on a notional
amount of principal and on movements in market interest rates between the
date the contract is written and the settlement date.10 This is analogous to
profits or losses on futures contracts, the effect of which is to add to (or
reduce) proceeds of a transaction in the physical market, thus hedging that
transaction. Although FRAs are able to be developed to satisfy the specific
needs of a firm, they have the disadvantage that they cannot be traded like
futures contracts and, also like futures, they possess the property of hedging
unfavourable outcomes but preventing the benefit of favourable outcomes.
OPTIONS
Options on futures contracts
As we have seen, financial futures contracts and FRAs are ways of hedging
against unfavourable movements in interest rates. However, we have also seen
that, if interest rates move favourably (in the direction that the hedger would
prefer), the futures or FRA contract prevents the hedger from obtaining this
benefit. To put it another way, they protect hedgers from downside risk
(unfavourable outcomes), but they prevent enjoyment of upside risk
(favourable outcomes). Futures contracts are a two-(h)edged sword!
This inherent limitation of futures contracts has been reduced by the
development of markets for options. For example, options can be purchased on
some financial instrument futures. An option on a bond futures contract allows
the option holder to proceed with the transaction if it suits, or not to proceed. Why, then, would anyone prefer futures contracts to options on futures
contracts? The answer is that options are not free. The purchaser of the optionpays a price (called the premium) to another party, called the seller or writer ofthe option. This premium therefore reduces the gain that would otherwiseemerge if there had been only a futures contract. If the option is not exercised,the premium represents a loss.
The terminology of optionsAs introduced above, an option, or option contract, gives its owner the right(but not the obligation) to buy or sell a commodity at a specified price over
over-the-counter transactionsTransactions in all security marketsexcept the organised exchanges.The money market is an over-the-counter market. Involves directdealing between buyers and sellers.
12
some time period. There are two basic types of options. A call option gives theowner the right to buy an asset at a specified price over a given period of time,and a put option gives its owner the right to sell.
An option is merely a contract between two investors. The buyer of theoption is, in a sense, betting against the writer (seller) of the option. If someonepurchases a call option, that person will be hoping that the price will rise so thatthe market price will be higher than the price at which he or she has the option tobuy. The profit is the excess of the market price over the price at which the assetcan be bought under the option contract. If this happens, the writer of the optionwill lose a corresponding amount, because the writer has agreed to provide theother party with an asset whose market price is greater than the price at whichthe other party has the option to buy. So, in the absence of transaction costs,options markets would represent a zero sum game—if all profits and losses wereadded up, the net total would equal zero. As we shall see, options markets arequite complicated and risky. Some experts refer to them as legalised institutionsfor transferring wealth from the unsophisticated to the sophisticated.
In order to continue with our discussion, we need to define several termsthat are unique to options.
• The contract. It should be stressed that, when an option is purchased, it isnothing more than a contract that allows the purchaser to buy (in the caseof a call) or sell (in the case of a put) some underlying asset such as acompany’s ordinary shares or a futures contract. That is, no asset haschanged hands at the time the contract is entered into, but the price hasbeen set for some future transaction that will occur only if the purchaser ofthe option wants it to. In this section we will refer to the process of selling aput or a call as writing. Consistent with our terminology for futurescontract, selling options is referred to as taking a short position, whilebuying is referred to as a long position.
• The exercise price or strike price. This is the price at which the asset may bepurchased from the writer in the case of a call, or sold to the writer in thecase of a put.
• Option premium. This is merely the price of the option, the amount paid bythe purchaser to the writer.
• Expiration date. This is the date on which the option contract expires. AnAmerican-type option is one that can be exercised any time until expiry,whereas a European-type option can be exercised only on expiration date.
• Covered and naked options. If the call writer owns the underlying asset, thewriter is said to have written a covered call. Conversely, if he or she doesnot own the asset, it is a naked call. Thus, if a naked call is exercised, the
call option A call option givesits owner the right to purchase a
given number of ordinary shares orsome other asset at a specifiedprice over a given time period.
put option A put option givesits owner the right to sell a given
number of ordinary shares or someother asset at a specified price
over a given time period.

13
writer will have to acquire the asset in order to deliver it as required underthe contract.
• In-the-money, out-of-the-money, and at-the-money. A call (put) is said tobe out-of-the-money if the underlying asset is selling below (above) theexcercise price. Alternatively, a call (put) is said to be in-the-money if theunderlying asset is selling above (below) the exercise price. If the asset isselling at the exercise price, the option is said to be at-the-money. Forexample, if ABC Ltd ordinary shares are selling for $52, a call option withan exercise price of $50 would be in-the-money, while one with an exerciseprice of $60 would be out-of-the-money.
• Intrinsic value and time (or speculative) value. The term intrinsic value
refers to the minimum value of the option—that is, the amount by which itis in-the-money. Thus, for a call the intrinsic value is the amount by whichthe asset price exceeds the exercise price. If the call is out-of-the-money, thenthe intrinsic value is zero. Why zero rather than negative? This is because acall option will not be exercised if its exercise price exceeds the asset price.For a put, the intrinsic value is again the minimum value that the put cansell for, namely the exercise price less the asset price. For example, if ABCshares were selling for $42 when the exercise price was $50, the intrinsicvalue of a put would be $8. If it was selling for anything less, investorswould buy puts and sell the shares until all profits from this strategy wereexhausted. This is an example of the process of arbitrage—buying andselling like assets for different prices for a riskless profit. If an option isselling for its intrinsic value, it is said to be at parity.
The time value, or speculative value, of an option is the amount by whichthe option premium exceeds the intrinsic value of the option. The time valuerepresents the amount above the intrinsic value that an investor is willing topay to participate in capital gains from investing in the option. (Thesecapital gains will arise if the asset price rises in the future above its currentlevel.) At expiration, the time value falls to zero and the option sells for itsintrinsic value, because the chance for future capital gain is exhausted. Theforegoing realtionships are summarised as follows:
call intrinsic value = asset price – exercise price
put intrinsic value = exercise price – asset price
call time value = call premium – (asset price – exercise price)
put time value = put premium – (exercise price – asset price)
Introduction to the pricing of optionsPerhaps the easiest way to follow the above terminology and gain an
understanding of the pricing of options is to use an example. The following
example uses share options for illustrative purposes.
arbitrage Buying and selling inmore than one market to make ariskless profit.

14
E X A M P L E 2 1 . 2
Figure 21.4 represents a profit and loss graph for the purchase of a call, at apremium of $4, on an ABC Ltd share with an exercise price of $50. In this andall other profit and loss graphs, the vertical axis represents the profit or lossrealised on the option’s expiration date, and the horizontal axis represents theshare price on that date. Because we are viewing the option at expiration, weare ignoring the time value and, to keep things simple, we will also ignore anytransaction costs such as brokerage.
For the option shown in Figure 21.4, the call will be worthless if the valueof the share is less than the exercise or strike price. This is because it wouldmake no sense for an individual to exercise the call option for $50 per share ifthe same shares could be bought on the stock exchange for less than $50.Although the option will be worthless at expiry date if the exercise price isgreater than the share price, the most an investor can lose is the premium, in thiscase $4. Although this may be the entire investment in the option, it is likely tobe only a fraction of the share’s value. Once the share price climbs above theexercise price, the call option takes on a positive value and increases on a linear,one-for-one basis. Moreover, there is no limit on how high the profits can climb.
FIGURE 21.4
PURCHASE A CALL ON ABC LTD SHARES WITH AN EXERCISE PRICE OF $50FOR A PREMIUM OF $4
–25
–20
–15
–10
–5
0
5
–4
10
15
20
25
30
35
40
10 20 30 40 50 60 70 80
Share price at option expiration
Prof
it or
loss
Maximum profits = unlimited
Maximum loss = $4
Exercise or striking price = $50
Break-even point(exercise price + premium)
= $54

15
Once the share price rises above $50 the call begins taking on value and, once ithits $54, the investor breaks even. The investor has then earned enough in theway of profits to cover the $4 premium paid initially for the option.
As noted earlier, the options market is a zero sum game in which oneindividual gains at the expense of another. Thus, to the call writer, the profitand loss graph is the mirror image of the call purchaser’s graph. Figure 21.5shows the profits and losses at expiration associated with writing the calloption. Once again we will look at the profits and losses at expiration, becauseat that date options have no time value. The maximum profit to the call writeris the premium, or how much the writer received when the option contract wasoriginally undertaken, whereas the maximum loss is unlimited.
In Figure 21.6 we look at the profit and loss graph for the purchase of aput option on ABC shares, again with an exercise price of $50 but with apremium of $3. We see from the graph that the lower the price of the sharesthe more the put is worth. Here, the put takes on value only once the shareprice drops below the exercise price, which in this case is $50. Then, for everydollar fall in the price of ABC shares, the put increases in value by one dollar.Once the ABC price drops to $47 per share, the put purchaser breaks even bymaking $3 on the put, which exactly offsets what was paid initially for the put.
FIGURE 21.5
WRITE (SELL) A CALL OPTION ON ABC LTD SHARES WITH AN EXERCISE PRICEOF $50 FOR A PREMIUM OF $4
–25
–20
–15
–10
–5
0
54
10
15
20
–30
–35
–40
–45
10 20 30 40 50 60 70 80
Share price at option expiration
Prof
it or
loss
Maximum loss = unlimited
Maximum profits = $4
Exercise or striking price = $50
Break-even point(exercise price + premium)
= $54

16
FIGURE 21.6
PURCHASE A PUT ON ABC LTD SHARES WITH AN EXERCISE PRICE OF $50 FORA PREMIUM OF $3
–15
–10
–5–30
5
10
15
20
25
30
35
40
45
50
10 20 30 40 50 60 70 80
Share price at option expiration
Prof
it or
loss
Maximum loss = $3
Maximum profits = $47
Exercise or striking price = $50
Break-even point(exercise price – premium)
= $47
FIGURE 21.7
WRITE (SELL) A PUT OPTION ON ABC LTD SHARES WITH AN EXERCISE PRICEOF $50 FOR A PREMIUM OF $3
–25
–20
–15
–10
–5
0
53
10
15
20
–30
–35
–40
–45
–50
10 20 30 40 50 60 70 80
Share price at option expiration
Prof
it or
loss
Maximum loss = $47
Maximum profits = $3
Exercise or striking price = $50
Break-even point(exercise price – premium)
= $47
17
Here, as with the purchase of a call option, the most an investor can lose is thepremium which, although small in dollar terms, still represents 100% of theinvestment. The maximum gain associated with the purchase of a put is limitedonly by the fact that the lowest a share’s price can fall is to zero.
To a put writer, the profit and loss graph is the mirror image of the putpurchaser’s graph. The writer’s graph on the above ABC put is shown in Figure21.7. Here, the most a put writer can earn is the premium or amount for whichthe put was sold. The potential losses for the put writer are limited only by thefact that the share price cannot fall below zero.
The time value of an optionAll four of our graphs have shown the price of the option at expiration. Atexpiration, the option’s value depends on the current price of the underlyingasset and on the exercise price. When we re-examine these relationships at atime before expiration, we find that the options now take on some time value.In other words, investors are willing to pay more than the intrinsic value of anoption because of the uncertainty of the future share price. That is, althoughthe share price may fluctuate, the possible losses are limited, whereas thepossible gains are almost unlimited. The more the volatility (as measured bythe standard deviation of the share price), the greater the potential for upsidegains in the future (that is, the excess of the price of the share over the exerciseprice), and so the greater the present value of the option, other things beingequal.
Thus far, we have seen that the price of an option prior to maturity
depends on three things: the current price of the underlying asset such as a
company share, the exercise price of the option, and the variability in the
underlying asset’s price. As with any other financial instrument, the price today
is the present value of the expected, future payoff. This present value depends
in turn on the discount rate and the time remaining till expiry. In sum,
therefore, the present value of an option depends on a total of five factors:
• the current price of the underlying asset;
• the exercise price of the option;
• the variability of the underlying asset’s price
• the time to maturity;
• the discount rate.11
These factors have been brought together in a famous option-pricing
model developed by Black and Scholes.12 Although detailed discussion is
outside the scope of this book, it is intuitively easy to grasp that an option’s
current value depends on these five factors.

18
Uses of options by the financial manager
As we examine options from the viewpoint of the financial manager, we will
see that they have some attractive features that help explain their popularity.
There are three main reasons for their popularity: leverage, financial insurance
and expansion of investment possibilities.
LeverageCall options allow the financial manager the chance for unlimited capital gains
with a very small investment. Because a call is only an option to buy, the most a
financial manager can lose is the premium, which is usually a very small
percentage of the value of the underlying asset. However, the potential for
capital gains is potentially unlimited. When a financial manager owns a call, he
or she controls or benefits directly from any price increases in the underlying
asset. The idea of magnifying the potential return is an example of leverage. The
idea is similar to the concept of leverage in physics, where a small force can lift a
heavy load. Here, a small investment is doing the work of a much larger
investment. Unfortunately, leverage is a double-edged sword: small price
increases can produce a large percentage profit, but small price decreases can
produce a large percentage loss. With an option, the maximium loss is limited to
the amount invested. To illustrate this idea of leverage, if ABC shares are
currently trading at $50, a $4 price change represents only about an 8% change
in the share price, but 100% of the amount invested (the premium of $4).
Financial insuranceFor the financial manager this is the most attractive feature of options. A put
can be regarded as an insurance policy, with the premium paid for the put
being the cost of the policy. When a put is purchased with an exercise price
equal to the current asset price, it insures the holder against any decline in the
asset price over the life of the put. This idea underlies the discussion of options
on futures contracts with which we began this part of the chapter. It will be
recalled that, in the example given of a firm wishing to protect against rising
interest rates, the finance manager could buy a put option (option to sell) on a
BAB futures contract, as an alternative to the futures contract itself. Doing so
would allow the manager to benefit from upside risk (if rates moved
downwards, the manager would not exercise the option), but protect against
downside risk (if rates moved upwards, the manager would exercise the
option). Under this arrangement, the maximum potential loss is the premium.
Expansion of investment possibilities
The use of puts, calls and combinations of them can enable an investor to
expand the range of effective investment media held without changes in the
physical assets in a portfolio. For instance, a portfolio manager with a

19
preponderance of property investments can benefit from movements in the
share market by use of share options.
To sum up, understanding the popularity of puts and calls involves
understanding (1) the concept of leverage (in the case of calls unlimited
potential gains, and in the case of puts very large potential gains with limited
and relatively small maximium potential losses) and (2) the concept of financial
insurance. The worst that can happen to a holder of an option is to lose the
amount invested.
Options markets
In Australia, options on shares are traded on the Australian Options Market,
while options on futures contracts are traded on the Sydney Futures Exchange. In
addition, an option on any asset can conceivably be arranged between two
parties, on an over-the-counter basis. For example, some real estate contracts are
protected by a “cooling-off” period. During the time prior to expiry of the
cooling-off period, the purchaser has the right to withdraw from the contract.
This right is obtained by paying the deposit under the contract. But, unlike many
other options, this deposit will be refunded if the contract is not proceeded with.
Over-the-counter products with options characteristics
Financial institutions such as commercial banks and merchant banks have
developed a range of options-like products that they market to customers. The
product range includes:
• Caps. Interest-rate caps are marketed on the basis that the borrower will not
have to pay more than some specified interest rate, even if rates move above
that level. However, if the rate falls, the borrower benefits. In other words,
the rate floats but does not exceed the cap. As an illustration, the finance
manager in the example that began this chapter might arrange a loan of
$500,000 whose rate is aligned with the 90-day bank-bill rate, at 8.2% for
the first 90 days and with a cap of 9%. Thus, if bank-bill rates rise, the loan
will not go over 9%, but if rates fall, the firm can benefit.
• Floors. An interest-rate floor is designed so that an investor will receive no
less than the floor rate. If rates are higher, the investor will benefit from the
higher rate, but is guaranteed not to earn less than the floor rate.
• Collars. An interest-rate collar is, essentially, a combination of a floor and a
cap. The rate may float between some upper limit (the cap) and some lower
limit (the floor). For example, this might suit a borrower who wants to be
protected against very high rates but does not mind if the rate cannot fall
below the specified floor.

20
You might ask, “Why does not everyone hedge their borowing or
investing with such products?” One reason is that the customer pays some kind
of fee for the arrangement of this type of financial insurance.13 Also, firms with
appropriate expertise and with in-house treasury divisions will design their own,
less costly, risk-management strategies. Firms without such expertise may feel it
is better to pay a price for the insurance than to run the risk of being unhedged.Interest rate caps and similar products are likely to be arranged
independently of the underlying principal—they feature exchange of only theinterest amount. So, if a firm has a loan of, say, $10 million, this would be thenotional principal amount on which a cap would be based. For example,suppose the cap was 15.8% p.a. and it was on the basis of quarterly intervals.If the current quarter’s interest rate rose to 16.2% p.a., the cap seller (forexample the firm’s bank) would pay the excess to the cap buyer (the firm). Inthis case, the excess would be about 0.1%, a quarter of 0.4% (the excess of theannual rate over the cap). On a notional principal of $10 million, this wouldthus represent $10,000 paid to the firm for that quarter, the effect of which isclearly to limit the borrowing cost to its 15.8% annual ceiling. However, ifprevailing rates were to be below the cap of 15.8%, there would be nopayment from the cap writer to the firm. Forward rate agreements (FRAs), too,are written on the basis of a notional amount of principal, as are interest-rateswaps, to which we now turn.
SWAPS
The basic mechanism of interest-rate swapsWhat was the flash of genius that sparked the development of interest-rateswaps? Basically, the executive realised that the bank had a comparative
advantage over its client in raising funds. The bank could raise fixed-rate fundsat 15%, whereas the client would have to pay 17%. In the floating-ratemarket, the bank could borrow at, say, the current bank bill rate (BBR),whereas the client would have to pay this plus 1%. So, the bank raised fixedfunds at 15% and the client raised comparable floating funds at BBR plus 1%.Where is the genius in this? Let us examine the following summary of thetransactions:
Bank: Pays 15% on fixed funds (in the market). Charges client 16.5% (via the
swap agreement).
Client: Pays BBR + 1% on floating-rate funds (in the market). Charges bank
BBR + 1% (via the swap agreement).
Outcome for bank: Receives 1.5% profit on fixed funds, loses 1% on what it
would otherwise pay on floating-rate funds, thus yielding a net profit of 0.5%.
Swaps are of relatively recentorigin. It is said that they owe theirbeginnings to a Citibank executive
taking a shower in 1981,pondering the predicament of a
client, power utility Detroit Edison.“In a flash of genius … the banker
… decided that each party [thebank and the customer] should
raise funds it didn’t want, and thensimply cover the other’s interest-
payment obligations.”14

21
Outcome for client: Breaks even on floating funds, pays 16.5% to bank on
fixed funds, a saving of 0.5% on what it would otherwise pay direct to the
market (17%).
The net comparative advantage in this transaction is clearly 1%, split
equally between the two parties so that each finishes 0.5% better off. This
example is indicative of what has been termed the arbitrage origins of swaps—
constructing a swap so that each party is better off, but without any increased
risk. From the bank’s perspective, the assumption would be that entering a
swap contract with the client would involve no more credit risk (risk of
default) than lending money to the client. However, this does not mean that
swaps are necessarily free of risk, as we shall see later.
It is customary to portray swaps by means of a diagram depicting each
party, with directional arrows representing interest streams into or out of each
firm. The swap diagram for the above transaction is shown in Figure 21.8, in
which arrows represent interest streams.
Settlement of swap interest streamsSwaps of the above kind feature the exchange of interest-rate streams only—
thus the name interest-rate swap. If the above swap was based on a notional
principal of $10 million, the saving of 0.5% means each party would save
$50,000 interest per year. However, there is no exchange of principal—all the
parties exchange is the interest payments. In fact, only one net interest
payment is made, depending on the current relationship between fixed and
floating rates. To show a simplified account15 of how this exchange of interest
occurs, let’s suppose the above swap is based on quarterly settlements for a
time of five years (the term of the fixed-rate loan), tied to the rollover periods
for 90-day bank bills, and with a notional principal of $10 million. If the BBR
in the first quarter was, say, 14%, the bank would be obliged to pay 15%
(BBR + 1%) to the firm. In turn, the firm would be obliged to pay the fixed
rate of 16.5% to the bank, so the net payment by the firm is at a rate of 1.5%
interest rate swap Derivativeinstrument in which one partyagrees to pay or receive avariable-rate interest stream andthe other party agrees to a fixed-rate stream.
FIGURE 21.8
INTEREST FLOWS FOR BASIC INTEREST-RATE SWAP
floatingBBR + 1%
floatingBBR + 1%
fixed16.5%
fixed15%
ClientBank
22
per year, or 0.375% for the quarter. On a notional principal of $10 million,
this would be $37,500 paid to the bank. Next quarter, suppose the BBR is up
half a percent; now, the net payment by the firm will decrease to 1% per year,
or 0.25% for the quarter ($25,000). If the BBR increased yet another half a
percent per year in the following quarter, the net payment by the firm would
be 0.125% for the quarter, or $12,500. Going on from this time, assume that
floating rates kept rising and that at some time in the future BBR plus 1%
totalled 17%. In that quarter, the bank would have to pay net 0.5% per year
to the firm.
Intermediated swap
The swap portrayed in Figure 21.8 is commonly known as a plain vanilla
swap. This involves the exchange of a fixed-interest stream for a floating
stream. However, it is not always possible for a firm desiring a swap to find
another party with offsetting requirements (that is, one wants to pay a fixed
rate on some notional amount of principal, the other wants to pay a floating
rate on the same notional amount). Also, there is credit risk when two firms
contract directly with each other. Swaps are generally for relatively long terms,
so there is some uncertainty that the other party (the counterparty) will meet
the future interest settlement amounts when due. For both of these reasons,
financial institutions such as commercial banks and merchant banks act as
swap intermediaries. Figure 21.9 shows the interest flows for an intermediated
swap between firms A and B, with a bank acting as swap intermediary. In this
example, we have supposed that company B can raise 4-year fixed debt at
16.1% or floating rate at 0.4% above the bank-bill rate (BBR), while company
A can raise fixed debt at 15% or floating rate at 0.1% above the BBR. If A
wants floating-rate borrowing and B wants fixed-rate financing, the
comparative advantage can be split between them as well as the financial
intermediary that arranges the swap and also absorbs the credit risk. If the
financial intermediary charges 0.2% as an arrangement fee, both A and B are
0.2% better off via the swap. As summarised at the foot of Figure 21.9, A
achieves floating-rate borrowing at BBR minus 0.1%, compared to BBR plus
0.1% without the swap, while B achieves fixed-rate borrowing at 15.9%,
compared to 16.1% without the swap.
The advantages to firms A and B are: (1) they have not had to find the
counterparty (in fact, the bank becomes the firms’ counterparty by interposing
itself between A and B); (2) with the bank as counterparty, the two firms will
not be worried about credit risk to the same extent as if they had dealt directly
with each other.

23
The swaps marketThe swaps market is primarily an over-the-counter market. The players in this
market are mainly large firms and financial institutions. The financial
institutions act not only as swap intermediaries, but they also arrange swaps on
their own account for purposes such as hedging their balance sheets. In
addition, swap brokers search for information on prospective clients’ needs so
that they can bring them together in return for a fee.
The interest rates on which swaps are based are reported in the financial
press and by screen-based services. These rates are closely aligned to rates in
the physical market. The floating rate is linked to the rate on bank bills; it is
known as the bank bill swap rate (BBSW). The fixed rate is linked to rates on
semi-government securities.
In order to “unwind” an existing swap, there are several possibilities.
One way is to seek another party to take over the remaining obligations under
the swap. Another way is to use the swaps secondary market to trade the swap
position.
Uses of swapsAs we have noted, the origin of swaps lies in the splitting of comparativeadvantage. This provides a proft-motive for encouraging the swap parties toenter the swap contract. However, there must be a fundamental need for fixed-or floating-rate debt on the part of the firms entering the swap. For example,company A in Figure 21.9 may believe that interest rates have peaked and areabout to fall. Accordingly, it may think it is best to have floating-rate debt to take
FIGURE 21.9
INTERMEDIATED INTEREST-RATE SWAP
BBR + 0.4%
15.5% fixed
Pays fixed 15% to marketPays floating BBR + 0.4%
to market
BBR + 0.2%
15.7% fixed
AAAA
Financial intermediary
Company A Company B
Result for company A:Pays floating at BBR + 0.4%Existing fixed 15.0%Receives fixed at 15.5%Gain on fixed (0.5%)Net cost of funds BBR – 0.1%
Result for company B:Pays fixed at 15.7%Existing floating BBR + 0.4%Receives floating BBR + 0.2%Loss on floating +0.2%Net cost of funds 15.9%
0.2% fee
0.2% fee

24
advantage of falling rates. With a swap, it can do this “artificially”, continuing toservice its fixed-rate obligations in the physical market, but using a swap toprovide the mechanism for floating-rate borrowings. What about company B?Clearly, its needs must be different. It may desire fixed-rate debt in order to lock-in its interest costs—that is, to reduce funding-cost uncertainty. Or, it might behedging an asset or portfolio that has a fixed-rate earning stream, and thus itmay want fixed-rate debt to avoid mismatches that could occur should the costof floating funds rise relative to the fixed rate earned on assets.
In the case of company B, it is clear that the swap user has a hedgingmotive. However, company A is taking a speculative position, using the swapin the expectation that it will reduce future funding costs should interest ratesfall. However, if rates rise, hindsight will prove the swap was inappropriate,leaving the firm to carry the burden of paying floating rates via the swap or toseek to unwind the swap in ways mentioned above. The problem is that, incircumstances of rising rates, the firm would most likely find itself exposed to aloss on the swap.16
Traders and speculators can use swaps to seek profit opportunities,substituting swaps for actions that would otherwise be carried out in thephysical markets. For example, if a bond trader expects long-term rates to fall,it might build up a portfolio of long-term bonds whose price will rise in theevent of a rate decrease (remember from Chapter 4 that security prices rise inresponse to rate falls). Alternatively, the trader could use a swap to pay floatingand receive fixed, thus creating a fixed-interest stream allied to that of bondcoupons (in other words, creating effectively a long-term financial security). Ifrates were to fall subsequently, there would be a profit on selling the swap inthe secondary market.
We can now start to see that there are many ways of using swaps.Moreover, the use of swaps is not confined to exchanges of interest-ratestreams. Many swaps involve currency exchanges. For example, an importermight have debts in an overseas country and so want to hedge against a rise inthe value of the overseas currency (which would make the cost greater inAustralian dollars, since more dollars would be needed to buy each unit offoreign currency in order to discharge the debt). Accordingly, the importercould enter a swap to exchange the overseas liability into Australian dollars,thus protecting against the risk of the above exchange-rate movement. To giveanother illustration of the use of swaps, M. K. Lewis17 notes that Australianborrowers face a thin local market for corporate bonds and, since all but a fewlarge firms lack sufficient credit standing to borrow in international markets,they can create the effect of Australian-dollar, fixed-rate debt by means of acurrency swap. To do this, a foreign bank raises fixed-rate Australian-dollardebt in the overseas market, swapping this for floating-rate US-dollar debt
25
raised through the intervention of the Australian firm’s bank. This is classed asa cross-currency interest-rate swap, combining as it does the exchange ofcurrencies and fixed for floating rates.
The latter example is illustrative of the development of synthetic
securities. These combine two or more derivatives (in this case, an interest rate
swap with a cross-currency swap), or combine derivatives with physical
instruments. Owing to the large numbers of combinations of financial
instruments that can synthesise others, the boundaries of financial instruments
are being continually stretched.
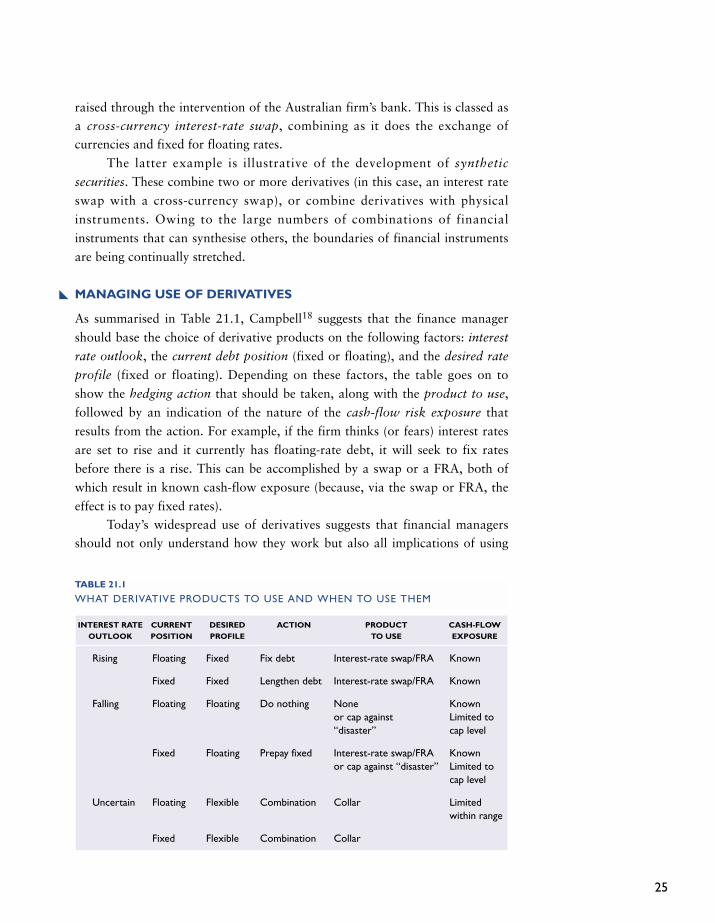
MANAGING USE OF DERIVATIVES
As summarised in Table 21.1, Campbell18 suggests that the finance manager
should base the choice of derivative products on the following factors: interest
rate outlook, the current debt position (fixed or floating), and the desired rate
profile (fixed or floating). Depending on these factors, the table goes on to
show the hedging action that should be taken, along with the product to use,
followed by an indication of the nature of the cash-flow risk exposure that
results from the action. For example, if the firm thinks (or fears) interest rates
are set to rise and it currently has floating-rate debt, it will seek to fix rates
before there is a rise. This can be accomplished by a swap or a FRA, both of
which result in known cash-flow exposure (because, via the swap or FRA, the
effect is to pay fixed rates).Today’s widespread use of derivatives suggests that financial managers
should not only understand how they work but also all implications of using
INTEREST RATE CURRENT DESIRED ACTION PRODUCT CASH-FLOWOUTLOOK POSITION PROFILE TO USE EXPOSURE
Rising Floating Fixed Fix debt Interest-rate swap/FRA Known
Fixed Fixed Lengthen debt Interest-rate swap/FRA Known
Falling Floating Floating Do nothing None Knownor cap against Limited to“disaster” cap level
Fixed Floating Prepay fixed Interest-rate swap/FRA Knownor cap against “disaster” Limited to
cap level
Uncertain Floating Flexible Combination Collar Limited within range
Fixed Flexible Combination Collar
TABLE 21.1
WHAT DERIVATIVE PRODUCTS TO USE AND WHEN TO USE THEM

26
them. As we have shown, although use of derivatives is in many cases designedto reduce risk, it is ironic that their use may bring about additional risks. Risksassociated with derivatives include the the following:
• Credit risk. This is the risk that the counterparty will default on itsobligations under the contract. It is more prominent when future rateschange against one party during the course of the contract. From aparticular firm’s view, it can be minimised by arranging a contract with afinancial institution of good standing or via an exchange such as the SFE,where this is appropriate.
• Market risk. This is the risk that value of a derivative will fall in response tochanges in market rates. We previously gave an example for company A inFigure 21.9 of swapping into a floating rate in expectation of falling interestrates, but then having to confront a rate rise. In principle, risks arising fromsome derivatives can be further hedged, but the matter of timing is critical.Company A would have missed the boat if it had not taken action in time.Furthermore, as we have also seen in our discussion of futures, hedging mayreduce downside risk but it can lead to elimination of the potential tobenefit from upside risk.
• Documentation risk. This stems from the fact that derivatives trading isoften arranged over the telephone, leaving the risk that follow-updocumentation may be incorrect.
• System and model risk. Many processes for valuing and trading derivativesare based on mathematical models. These may incorporate errors or bebased on historical data (for example, to estimate the variability of a firm’sshares when pricing its options), and these data may no longer be relevant.
• Legal risk. This kind of risk is prominent in international transactions, suchas different countries’ bankruptcy rules if a counterparty defaults.
• Accounting/tax risks. Tax and accounting treatment of derivatives variesgreatly. Growth in the derivatives markets has outstripped the developmentof accounting and tax principles. This has created uncertainty aboutrecognising profits and losses, as well as valuing derivatives.
All in all, the use of derivative instruments to manage interest-rate riskdepends on the attitude of the firm’s financial manager. If the firm is riskaverse, it is more likely that hedging will be employed. The attitude of the firmis also dependent on the extent of its exposure. If it is a heavy user of debt, it ispotentially more exposed to interest rate fluctuations than if it is a modest userof debt. Furthermore, the economic outlook is important, for a firm

27
experiencing or fearing recession will possibly suffer a reduction in cash flowsand profits from falling sales, so it may want to avoid the compounding effectof adverse interest-rate movements.
SUMMARY
A futures contract is a contract to buy or sell a stated commodity (such aswool) or a financial claim (such as bank-accepted bills) at a specified price andfuture time. This contract requires the user to buy or sell the asset at futuresettlement, unless the contract is closed-out in the meantime. Most futurescontracts are entered so as to fix a future price or interest rate, and so deliveryat settlement does not occur—the contract holder emerges with a profit or aloss that is settled with the futures exchange. Futures contracts can be used tohedge against downside risk (such as interest-rate increases confronted by aborrower), but they also lock-in the asset price or rate so there is loss ofpotential, beneficial price or rate movements (upside risk). Futures contractsare standardised with respect to the quantity of the underlying, “physical”asset, as well as settlement dates. Contracts in Australia are mainly settled viathe Sydney Futures Exchange, which protects itself from potential losses bymeans of daily margin calls on open contracts. A forward rate agreement
(FRA) is like a futures contract that is tailored to the specific needs of the partydesiring the contract. That is, it need not be based on standardised quantities,prices or dates, although its specificity means that it cannot be traded on anexchange.
A call option gives its holder the right to buy an item (such as shares orinterest-rate futures) at a specified price over a given period. In contrast, a put
option gives the holder the right to sell. However, the option holder does nothave the obligation to complete the transaction. The holder will exercise theoption if it is of benefit to do so (for example, a call holder will exercise theoption when the price of the asset is greater than the exercise price). In thisway, the holder can avoid most downside risk but still benefit from upside risk.The price paid by the holder to the writer of the option is called the premium.Options can provide the firm with leverage, financial insurance and expansionof opportunities. Option-like products marketed by financial institutionsinclude caps, floors and collars.
Interest-rate swaps enable one party to exchange a fixed-interest stream
for a floating stream. They may be arranged directly between two parties (a
“plain vanilla swap”), or via an intermediary such as a financial institution
(intermediated swap). The fundamental motive for an interest rate swap is to
share the comparative advantage that one firm has over another in different
segments of the debt market. This can lead to rate differentials that can be split
between the parties involved so that they all benefit in the form of lower

28
funding costs. Swaps can be used to manage interest-rate risk, for example by
hedging a fixed-rate asset with a fixed-rate debt position created via the swap.
They can also be used to create profit opportunities by simulating a position in
the physical market. However, using swaps creates a potential loss exposure
(market risk) should interest rates move against the position held by a swap
party. They may also carry other risks, notably credit risk.
The financial manager should base the use of derivatives for hedging
purposes on the firm’s attitude to risk as well as the extent of its exposure. Use
of derivatives contracts is increasing markedly, and the products are becoming
more and more complex, outstripping the ability of accounting and taxation
authorities to keep up with them. This makes it all the more important for the
financial manager to understand how derivatives work and the costs and
benefits of their use.
S T U D Y Q U E S T I O N S
21-1 Outline the nature of interest-rate risk and give some examples. In your answer,distinguish between downside risk and upside risk. Which of these twodimensions of risk does the hedger try to remove?
21-2 What is the difference between a commodity future and a financial future. Givean example of each.
21-3 Describe the essential aim of a hedge using interest-rate futures contracts. In youranswer, distinguish between the aims of a long position and a short position.
21-4 Why is it said that futures are a “two-edged sword?”
21-5 Compare the advantages and disadvantages of futures and forward rateagreements.
21-6 Outline a situation in which a financial manager might use interest-rate(financial) futures. Describe what would happen if interest rates went up duringthe period following the transaction. What would happen if interest rates wentdown following the transaction?
21-7 What are the main differences between using futures and options on futures forhedging?
21-8 Assume yesterday’s quote for BAB futures to be settled two months hence was91.50. What does this mean? If today’s quote is 91.60, what does this implyabout interest-rate trends? How do you think the price of a long futures contractwould be affected by this rate movement?
21-9 Distinguish between a call option and a put option. Comment on the differencesbetween the strategies of buying a call and writing a put.
21-10 What are the two factors that determine the price of an option at expiration?Explain why three other factors come into play when determining the price of theoption prior to expiration.

29
21-11 What is the basic nature of an interest-rate swap? What is meant by “notionalprincipal”?
21-12 Compare a “plain vanilla swap” with an intermediated swap. What are theadvantages to the swap parties in each case?
21-13 Outline some of the ways in which swaps can be used for hedging.
S E L F - T E S T P R O B L E M S
ST-1 In a few weeks your firm is going to borrow around $500,000 for three monthsin the bank-bill market. Current rates on bills are 8% and the futures market isquoting a rate of 8.2% for settlement a few weeks away. However, you fear ratesmay actually rise further, so you decide to recommend a futures hedge to thecompany treasurer. Outline the cash flows for this hedge, assuming rates haverisen to 8.7% per year when the contract is settled. How much did you save yourfirm?
ST-2 In relation to Figure 21.4, state the break-even point, maximum loss andmaximum profits if the strike price was $60 and the premium was $6. Whatwould be the outcome at expiry date if the share is then priced at $69. What ifthe price then was $48?
ST-3 For the option in ST-2, state the maximum profits, break-even point andmaximum loss from the perspective of the option writer.
ST-4 Draw an interest-rate-swap diagram for companies X and Y. Company X canborrow fixed-rate funds at 16% and floating-rate funds at BBR. Company Y canborrow fixed funds at 17.2% and floating funds at BBR plus 0.4%. At the footof your diagram, identify the advantage to each party from the swap. CompanyX wants floating debt, Y wants fixed borrowings.
S T U D Y P R O B L E M S
21-1 Your parents have invested in a bill-type deposit with a three-month term andwith maturity value of half a million dollars. The current rate paid by the depositis 9.5% per year. When the deposit matures in two months, your folks fear ratesmay have fallen by 1% per annum. They plan to reinvest during the threemonths following the current investment, after which they will cash in theproceeds and build a dream house in Queensland. On hearing of their plight, youdecide to construct a hedge in the futures market. Prepare cash-flow diagrams forthe hedge, assuming rates do fall as feared by your parents.
21-2 In problem 21-1, if rates were to rise to 11% in two months’ time, how muchmoney would you lose for your parents.
21-3 You are a financial manager with approximately two million dollars of floatingrate debt, rolled over every three months. The interest rate on this borrowing isclosely aligned with rates on bank bills. If rates rise, you know your budget forinterest expense will be affected adversely when the debt matures in a month’s time.

30
The current “price” quote in the futures market for settlement a month hence is90.00.
(a) Outline, step by step, the effect of a futures hedging strategy, assuming the rateon “physical” bank bills at settlement was 10.8%. (Hint: If you are hedging adebt of $2 million, you will need four standard BAB futures contracts).
(b) Draw cash-flow diagrams summarising the transactions in the physical andfutures markets, as well as a consolidated diagram showing the overall cashflows.
(c) Explain, with appropriate diagrams, what would have happened if the rate atsettlement was 9% per year.
21-4 Assume a federal government bond with a face value of $5 million, payingcoupons annually at a rate of 10 percent, has three-and-a-half years till maturity,and has a current price of par ($5 million). You think you might have to sell thebond in a half-year’s time.
(a) What would be the price of the bond in six months’ time if rates were to riseto 11%?
(b) Explain in general terms how you might construct a hedge to protect yourbonds should rates move as outlined in (a).
21-5 In problem 21-1, assume you had constructed a hedge assuming a suitable optionon futures is available. What sort of option would you have bought?
(a) Explain the effect in the cash-flow diagrams if the option had cost a premiumof $500.
(b) Explain the effect in problem 21-2.
21-6 Draw a profit or loss graph, similar to Figure 21.4, for the purchase of a callwith an exercise price of $65 for which a $9 premium is paid. Identify the break-even point, maximum profit and maximum loss. Now draw the profit or lossgraph assuming an exercise price of $70 and a $6 premium.
21-7 Repeat problem 21-6, but this time draw the profit or loss graph (similar toFigure 21.5) for the call writer.
21-8 Draw a profit or loss graph (similar to Figure 21.6) for the purchase of a putcontract with an exercise price of $45 for which a premium of $5 is paid.Identify the break-even point, maximum profits and maximum losses.
21-9 Repeat problem 21.8, but this time draw the profit or loss graph (similar toFigure 21.7) for the seller of the put contract.
21-10 Assume your firm has entered into an interest-rate cap agreement with yourbank, as you fear rates are about to rise and to continue to do so as the economyrecovers. The cap is set for three years at 12% and rates are currently 10.5% peryear on floating-rate debt. The agreement is based on notional principal of $15million and on quarterly settlements of interest. The cap premium was 1% ofnotional principal. At the end of the first quarter, floating-rate debt had gone upto 11%. Two years later, it was 12%. Two-and-a-half years later, it was 12.5%.Do you think the cap had been worthwhile? Use appropriate data to supportyour answer.
31
21-11 Company AAA has a top credit rating and can borrow fixed-rate funds at 12%or floating at the current rate on bank bills. Company BBB has a lesser creditrating and can borrow fixed-rate funds at 13% or floating at BBR plus 0.4%.
(a) Draw an interest-rate-swap diagram, indicating the gain to each party if thecomparative advantage is evenly split. AAA wants fixed funds, while BBBwants floating.
(b) Why might AAA want fixed funds?
21-12 Repeat problem 21-11, this time assuming that a bank has brought together theparties for a charge of 0.2% on each “leg” of the swap.
21-13 For problem 21-11, show the net cash payment (assuming quarterly settlements)for the first two quarters after the swap was entered, assuming the bank bill ratedropped 0.2% per year each quarter, if the swap is based on notional principal of$50 million. To whose advantage is the rate change? What do you think wouldhappen if AAA wanted to sell its swap position on the secondary market, sixmonths after it had entered the swap.
S E L F - T E S T S O L U T I O N S
SS-1 The firm will want to take a selling position (short hedge) in the futures market.It will contract to sell a standard BAB contract at 8.2% ($490,091 as shown inExample 21.1). If rates move to 8.7% at settlement, the firm would be able tobuy a standard contract for $489,499 (equal to 365($500,000)/[(365 +(.087)(90)]). This implies a profit of $592, the excess of the amount for which ithas a contract to sell over the price at which it could buy and thus the amountsaved compared with not hedging. The cash-flow diagrams are shown in Figure21.10.
SS-2 Break-even point: $66Maximum loss: $6Maximum profit: unlimited
If the price at expiry was $69, you would exercise the option and the profitwould be $3. If the price was $48, you would not exercise the option and the losswould be $6 (the premium amount).
SS-3 Break-even point: $66Maximum loss: unlimitedMaximum profit: $6
SS-4 See Figure 21.11.
Company X: Gains 0.8% on fixed; loses 0.4% on what it would otherwise payon floating; net gain 0.4%Company Y: Breaks even on floating; gains 0.4% on what it would otherwise payon fixed; net gain 0.4%.
Second quarter: Floating market rate 15.8%. Nil payment (market rate equalscap ceiling).

32
Third quarter: Floating market rate 16.2%, so bank pays client 0.4% per annum(0.1% per quarter). For a notional principal of $10 million, this 0.1% represents$10,000.If rates had fallen successively from a start of 15%, no payments would bemade.
N O T E S
1. In Chapter 4, we saw that the price of a fixed-rate instrument such as a bondmoves inversely to the interest rate.
FIGURE 21.10
Month 1 Month 2 Month 3 Month 4 Month 5
Settlementprofit: $592
Firm enters short contract
Month 1 Month 2 Month 3 Month 4 Month 5
Bill proceeds:$489,499
Month 1 Month 2 Month 3 Month 4 Month 5
Bill matures$500,000
$490,091
Futures market:
Physical market:
Overall cash flows:
Interest rate: Borrowing $490,091 and repaying $500,000 after 90 days represents an interest rate of 8.2% per year, less than the rate (8.7%) that would have to be paid if the hedge had not been taken.
$500,000
FIGURE 21.11
floatingBBR + 0.4%
floatingBBR + 0.4%
fixed16.8%
fixed16%
YX

33
2. Commodities for which futures contracts are traded in Australia include wool, cattle,some metals, and petroleum. In addition, futures are traded on 90-day bank-acceptedbills, Australian treasury bonds of several maturities, and the Share Price Index.
3. For instance, firms engaged in foreign activities may be exposed to exchange-raterisk, which we discuss in Chapter 20.
4. The term short arises from the fact that the seller is agreeing to sell something thathe or she does not possess and is thus “short” of it. It is contrasted with a longposition, whereby there is an agreement to buy something.
5. The example summarised in Figure 21.1 is a simplified depiction. In reality, thefirm will have to pay a deposit to enter the futures contract. If it makes a profit, itwill recoup this profit at settlement. For example, assume the deposit is $800. Inthis case we will have to modify Figure 21.1 by inserting a cash outflow of $800 atthe beginning of the futures market time-line, and a $800 cash inflow two monthslater on the same time-line.
6. The price is given by: P = (365)($500,000)/(365 + (.075)(90)) = $490,921.
7. The observant reader might say, in relation to this and the previous example of aborrower’s hedge: “Why go ahead with a transaction in the physical market andcouple this with the bill for $490,091?” There are several answers to this. First, theborrower firm might want to stay with its banker who has arranged the bill facilityin the physical market. Second, in some futures markets, physical “delivery” of theunderlying commodity is not permitted. All participants can do is take their profitor loss.
8. The player outlays $500 “now”, then gets this back, plus a profit of $946, twomonths later. The equation relating the future value to the present value is thus$1446 = $500(1+i). Solving for i gives i = $1446/$500 – 1 = 1.892 = 189.2%. Thisis a rate for two months, representing simple interest of 1,135% per year (6 ×189.2). Can you work out the compound annual rate?
9. This index represents the average price movements in the leading 200 shares on theAustralian market.
10. For a fuller discussion of the workings of FRAs in Australia, see: B. Hunt and C.Terry, Financial Institutions and Markets, 2nd edn (South Melbourne: Nelson,1997), pp. 519–24.
11. The appropriate discount rate is the risk-free rate of interest.
12. For a brief discussion of the use of the Black-Scholes model, see B. Hunt andC. Terry, op. cit., pp. 593–4. The model is applicable to European options. Thevaluation of American options can be adapted to the use of the model.
13. The financial institution providing the product might “re-insure” the arrangementin the options market, so it will want to more than cover its costs of doing so.
14. Cited by: B. McDougall, “For the Younger Banker: Derivatives De-mystified”, TheAustralian Banker, Vol. 108 No.2, April 1994, p. 86.
15. This is a simplified account in several ways, including the fact that the swapsmarket sets its own rates, and interest settlements are based on exact days betweendates rather than the assumption of equal-length quarters.

34
16. To consider why this is so, assume the yield curve has shifted upwards by 1%. InFigure 21.9, this would mean company A would have to pay 1% more on thefloating-rate component of the swap, while the receipts from the swap are fixed.
17. M.K. Lewis, “Derivative Markets”, in M.K. Lewis and R.H. Wallace, TheAustralian Financial System (South Melbourne: Longman Cheshire, 1993), p. 425.
18. C. Campbell, “Sprucing Up the Corporate Credit Image”, Decisions (NationalAustralia Bank), August 1991, p. 26.