chapter 2—renal replacement therapy for end-stage … · renal replacement therapy (rrt)...
TRANSCRIPT
Chapter 2—Renal Replacement Therapy for End-Stage Kidney Disease

23
Chapter 2—Renal Replacement Therapy for End-Stage Kidney Disease
2 Renal Replacement Therapy for End-Stage Kidney Disease
This section presents trends about end-stage kidney disease (ESKD) patients who are newly diagnosed each year (incidence), as well as the total number of patients being treated for ESKD in Canada at a given point in time (prevalence). Renal replacement therapy (RRT) encompasses those being treated for kidney failure with dialysis or with functioning transplants. The section includes ESKD patient characteristics, such as age at initiation of treatment, most responsible diagnoses for renal failure and modality of initial treatment. The intent of the information is to support the various programs providing care to ESKD patients in Canada and to help inform decision-making at clinical, facility and health system policy levels.
2.1 Incident ESKD RRT Patients An incident patient refers to a new case within the population with a defined disease that requires treatment. In the case of CORR, these are patients with ESKD who began RRT (either dialysis or kidney transplantation) for the first time during the calendar year. Incidence is usually presented as a rate per million population (RPMP), or the relative proportion of people in the population who are newly diagnosed. The trends in incident ESKD patients in Canada are presented by age groups over time in the figures and tables below.
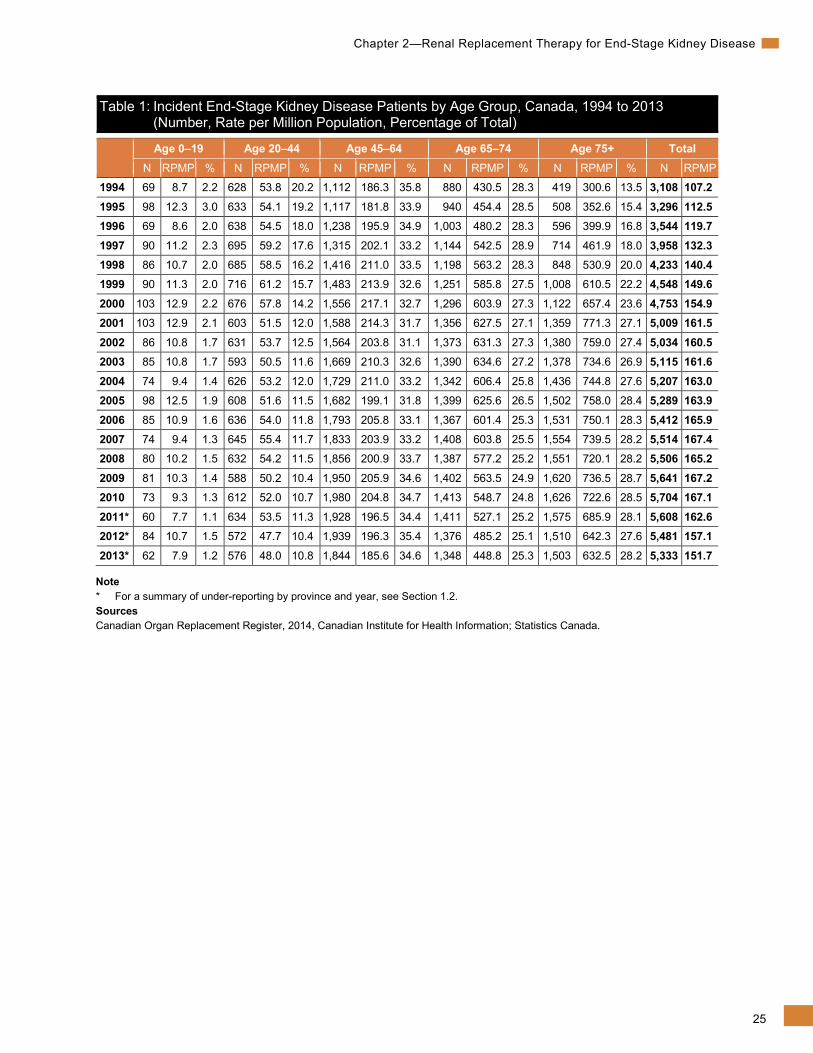
There were 5,333 newly diagnosed patients with ESKD reported to CORR in 2013, an increase of nearly three-quarters over the number reported in 1994 (Table 1).
In 2013, more than half (53%) of incident patients were age 65 and older, and an additional 35% were age 45 to 64.
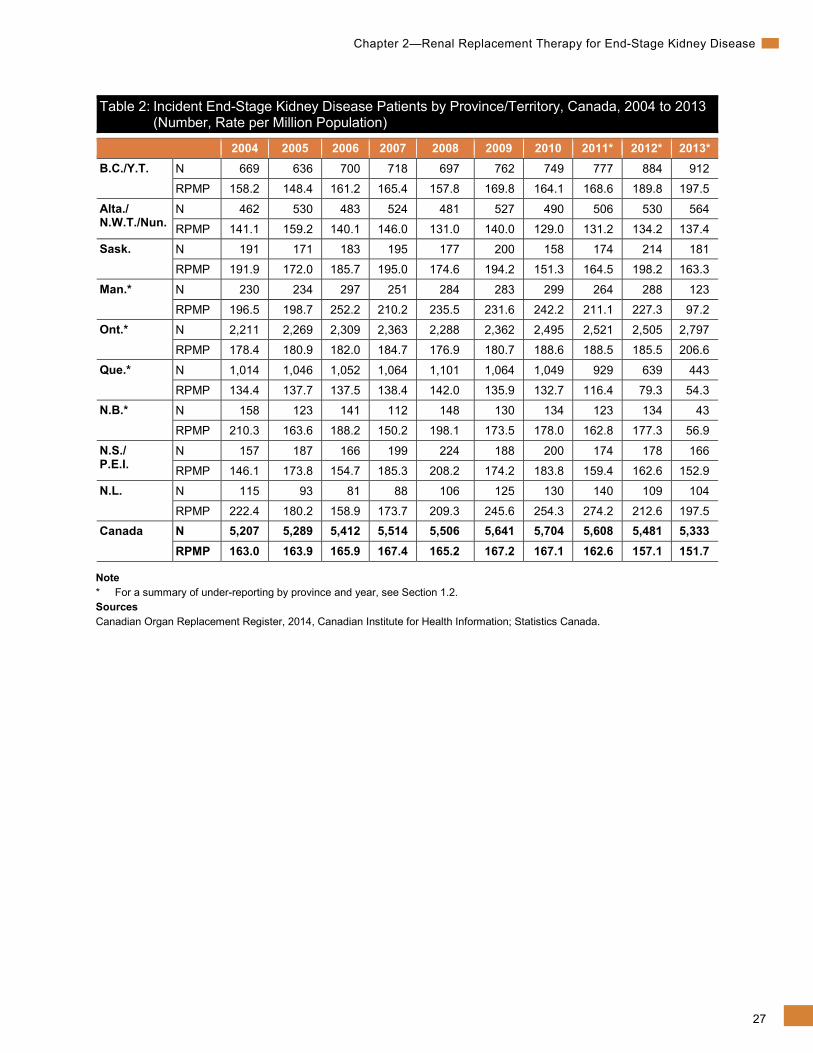
Provincially, in 2013, the highest incidence RPMP occurred in Ontario (206.6) (Table 2).
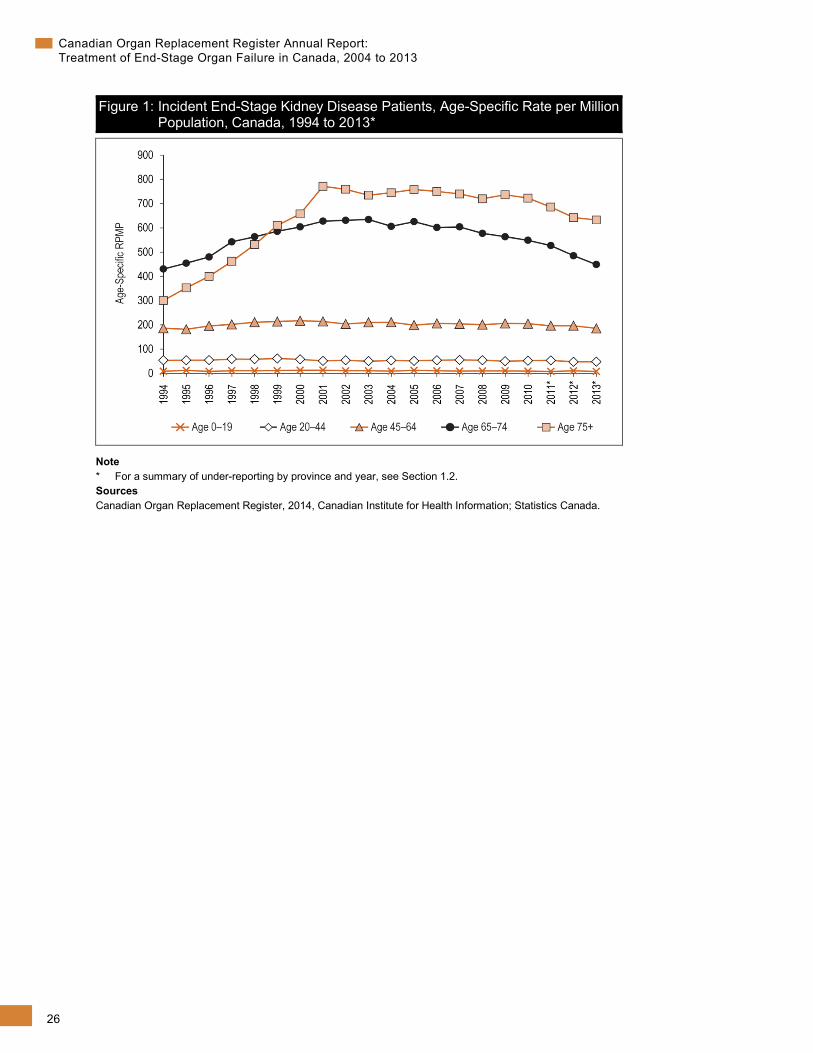
The highest RPMP of newly diagnosed ESKD continued to be among those age 75 and older (Figure 1). This age group also had the largest rate increase over the reporting period, a trend that began in the 1980s and continued until 2001, when the incident RPMP reached 771.8. From 1994 until 2001, the rate of incidence among patients age 75 and older increased 1.6 times. Starting in 2005, incidence rates among older age groups slowly declined. Incidence rates among those patients age 45 to 64 increased from 186.3 in 1994 to a peak of 217.3 in 2000. Since 1997, the incidence rates in this age group have remained relatively stable and declined in recent years. Over the 20-year period considered, incidence rates among those younger than age 45 remained relatively unchanged.
24
Canadian Organ Replacement Register Annual Report: Treatment of End-Stage Organ Failure in Canada, 2004 to 2013
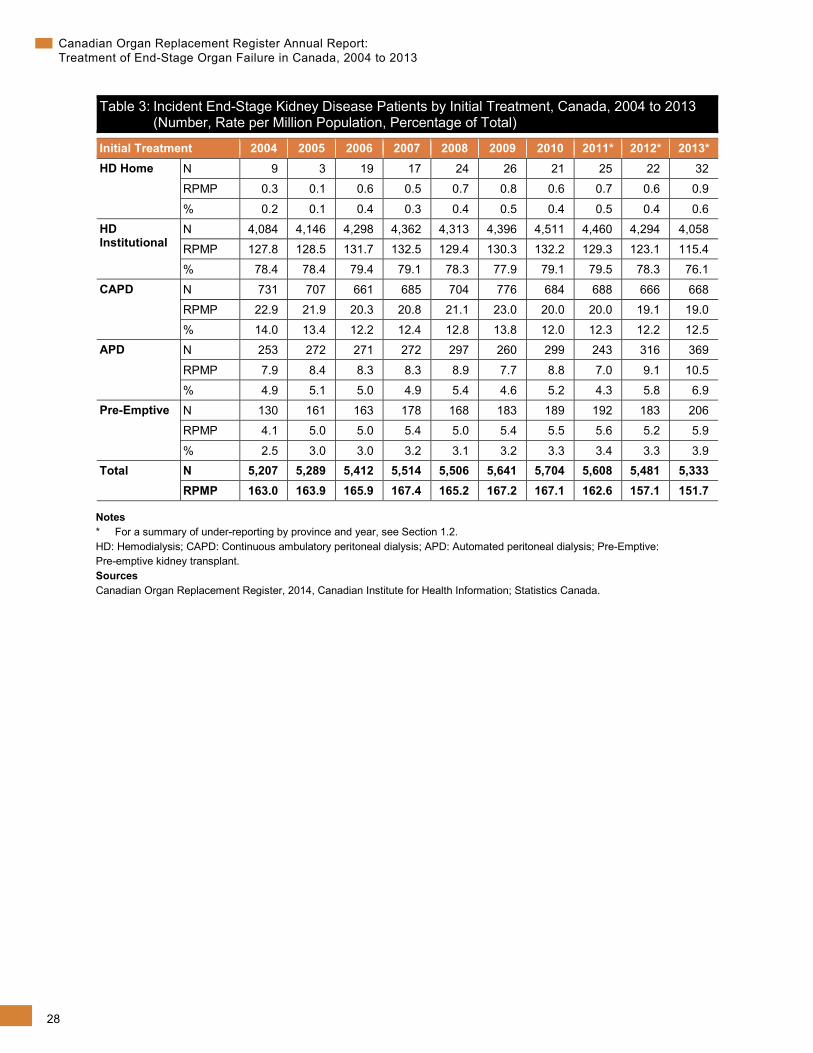
At the end of 2013, 77% of all new patients initiated treatment on hemodialysis (HD),vi a level that has remained virtually unchanged since 2004 (Table 3). While HD was consistently utilized as the primary modality of treatment, the number of new patients receiving peritoneal dialysis (PD)vii as an initial treatment also remained consistent through the time period. The use of pre-emptive transplants increased over time, from 130 in 2004 to 206 in 2013.
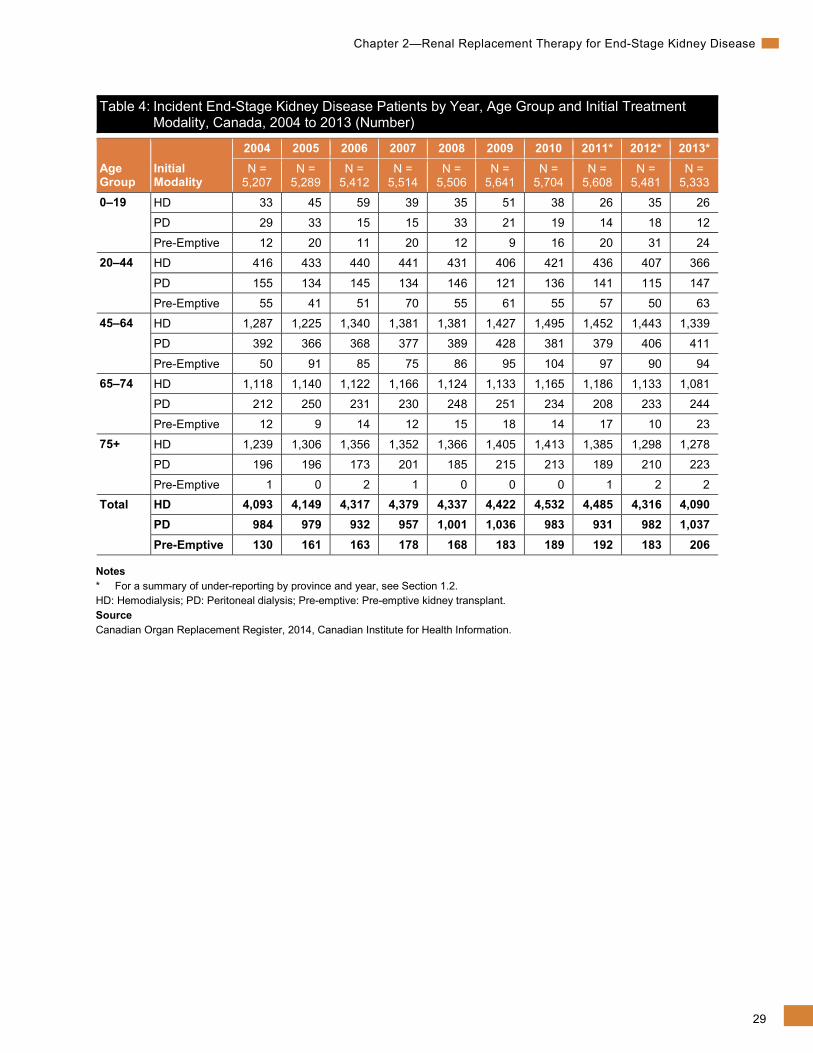
Age of incidence also influences the initial treatment (Table 4). In 2013, 64% of incidence patients age 20 to 44 started with hemodialysis, while among those age 65 and older, the proportion was 83%. Pre-emptive transplant as an initial treatment was highest among younger age groups and declined with patient age.
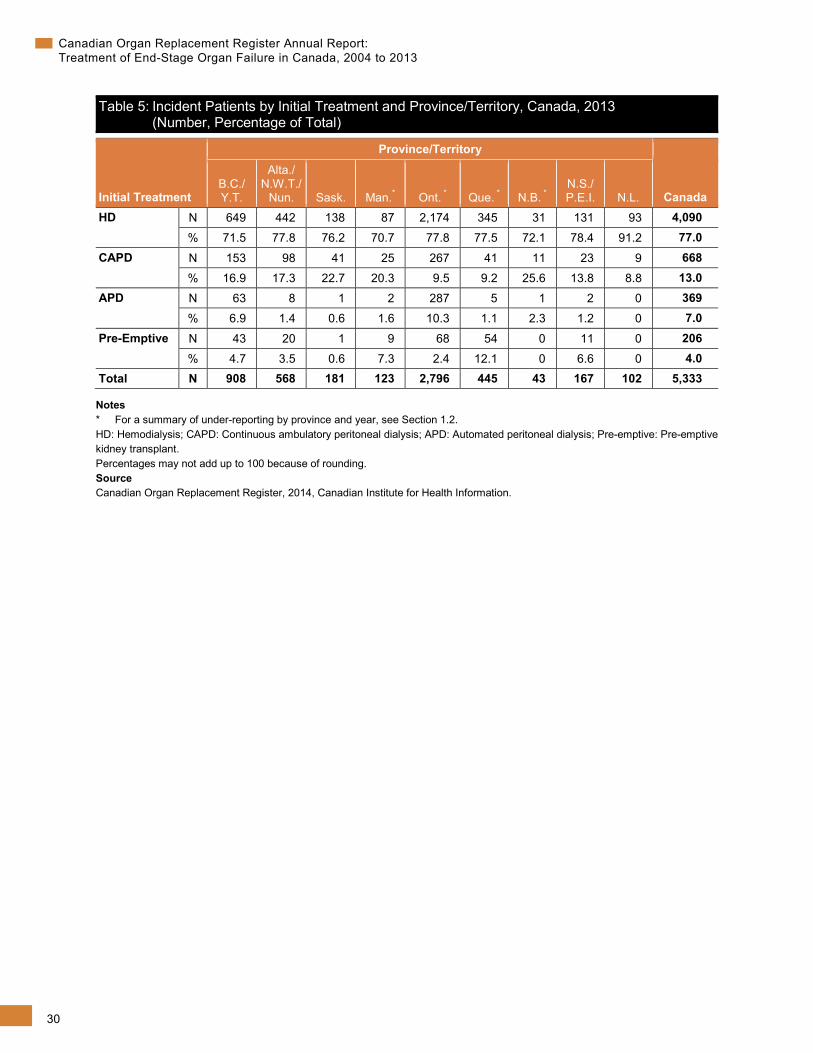
When dialysis was used to treat incident patients in 2013, all provinces used HD the majority of the time, with Newfoundland and Labrador having the highest proportion of HD (91%). The highest proportion of patients treated by continuous ambulatory peritoneal dialysis (CAPD) was observed in New Brunswick (26%) (Table 5).
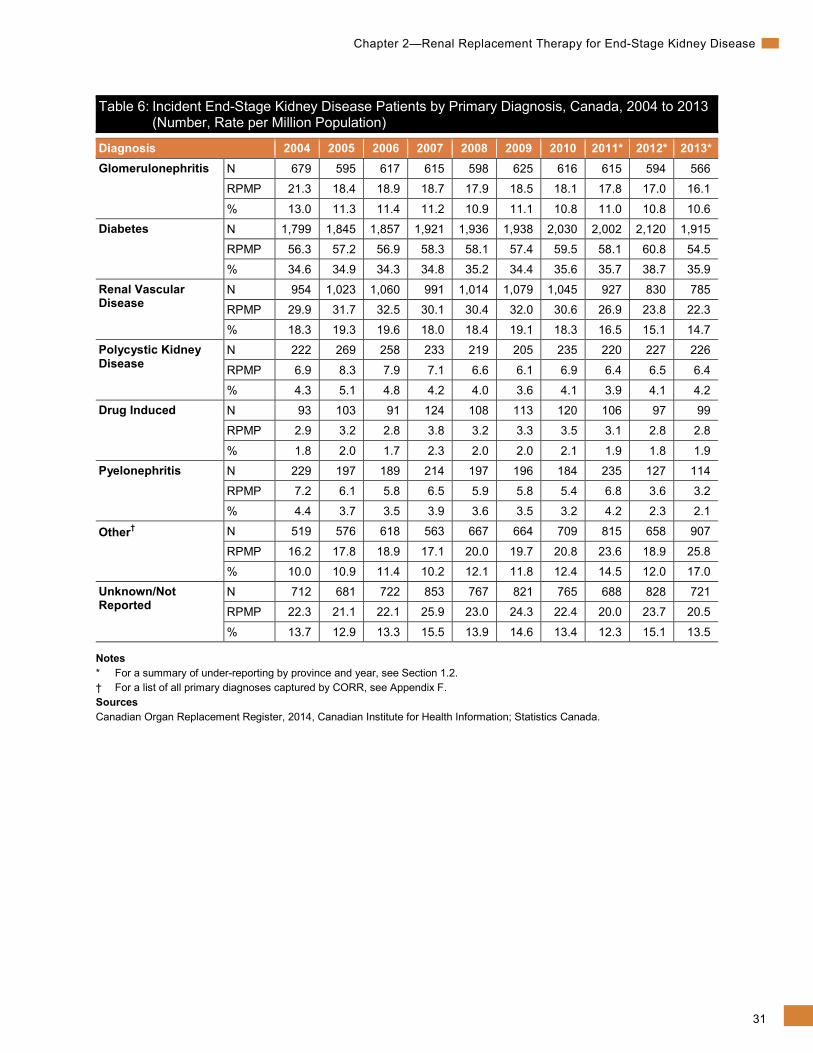
Incidence rates by primary diagnosis are presented in Table 6. Diabetes continued to be the most frequently reported primary cause of ESKD, accounting for 36% of incident patients in Canada.
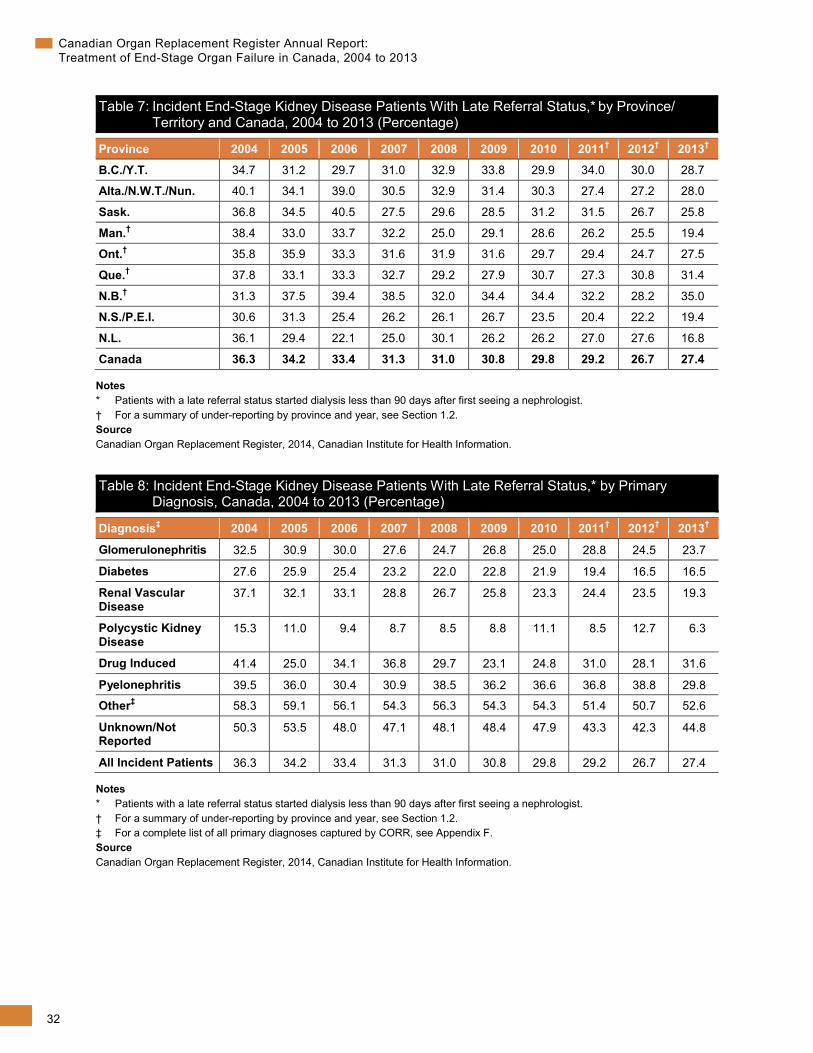
A patient who starts dialysis less than 90 days after first seeing a nephrologist is considered a late referral patient. This characteristic is considered a measure of how well the early stages of kidney disease are managed. An earlier referral allows for better management of the disease and may influence patient survival. In 2013, 27% of incident patients were late referrals, down from 36% in 2004 (Table 7). This improvement can be seen in nearly all provinces. Table 8 presents late referral status by primary diagnosis. In 2004, 37% of patients with a primary diagnosis of diabetes were late referrals, while in 2013 only 16% were considered late referrals.
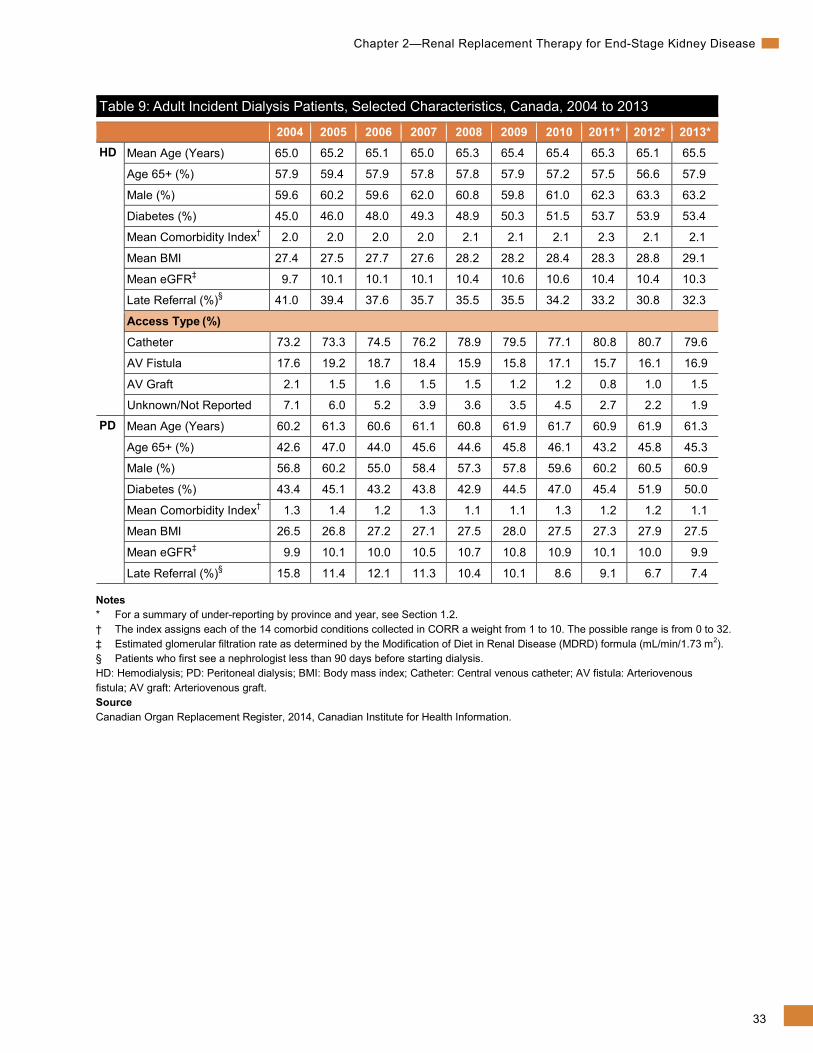
Table 9 presents selected characteristics of HD and PD patients. In 2013, the average age of incident HD patients was 65, and the average age of PD patients was 61. Patients 65 and older accounted for 58% of incident HD patients, while males accounted for 63%.
vi. Hemodialysis works by circulating the blood through special filters outside the body. The blood flows across a filter, along with
solutions that help remove toxins. In general, this form of dialysis is performed in a health care facility. vii. Peritoneal dialysis filters waste using a peritoneal membrane inside the abdomen. The abdomen is filled with special solutions
that help remove toxins. The solutions remain in the abdomen for a time and are then drained out. There are two types of peritoneal dialysis—continuous ambulatory peritoneal dialysis and automated peritoneal dialysis. This form of dialysis can be performed at home.
25
Chapter 2—Renal Replacement Therapy for End-Stage Kidney Disease
Table 1: Incident End-Stage Kidney Disease Patients by Age Group, Canada, 1994 to 2013 (Number, Rate per Million Population, Percentage of Total)
Age 0–19 Age 20–44 Age 45–64 Age 65–74 Age 75+ Total N RPMP % N RPMP % N RPMP % N RPMP % N RPMP % N RPMP
1994 69 8.7 2.2 628 53.8 20.2 1,112 186.3 35.8 880 430.5 28.3 419 300.6 13.5 3,108 107.2 1995 98 12.3 3.0 633 54.1 19.2 1,117 181.8 33.9 940 454.4 28.5 508 352.6 15.4 3,296 112.5 1996 69 8.6 2.0 638 54.5 18.0 1,238 195.9 34.9 1,003 480.2 28.3 596 399.9 16.8 3,544 119.7 1997 90 11.2 2.3 695 59.2 17.6 1,315 202.1 33.2 1,144 542.5 28.9 714 461.9 18.0 3,958 132.3 1998 86 10.7 2.0 685 58.5 16.2 1,416 211.0 33.5 1,198 563.2 28.3 848 530.9 20.0 4,233 140.4 1999 90 11.3 2.0 716 61.2 15.7 1,483 213.9 32.6 1,251 585.8 27.5 1,008 610.5 22.2 4,548 149.6 2000 103 12.9 2.2 676 57.8 14.2 1,556 217.1 32.7 1,296 603.9 27.3 1,122 657.4 23.6 4,753 154.9 2001 103 12.9 2.1 603 51.5 12.0 1,588 214.3 31.7 1,356 627.5 27.1 1,359 771.3 27.1 5,009 161.5 2002 86 10.8 1.7 631 53.7 12.5 1,564 203.8 31.1 1,373 631.3 27.3 1,380 759.0 27.4 5,034 160.5 2003 85 10.8 1.7 593 50.5 11.6 1,669 210.3 32.6 1,390 634.6 27.2 1,378 734.6 26.9 5,115 161.6 2004 74 9.4 1.4 626 53.2 12.0 1,729 211.0 33.2 1,342 606.4 25.8 1,436 744.8 27.6 5,207 163.0 2005 98 12.5 1.9 608 51.6 11.5 1,682 199.1 31.8 1,399 625.6 26.5 1,502 758.0 28.4 5,289 163.9 2006 85 10.9 1.6 636 54.0 11.8 1,793 205.8 33.1 1,367 601.4 25.3 1,531 750.1 28.3 5,412 165.9 2007 74 9.4 1.3 645 55.4 11.7 1,833 203.9 33.2 1,408 603.8 25.5 1,554 739.5 28.2 5,514 167.4 2008 80 10.2 1.5 632 54.2 11.5 1,856 200.9 33.7 1,387 577.2 25.2 1,551 720.1 28.2 5,506 165.2 2009 81 10.3 1.4 588 50.2 10.4 1,950 205.9 34.6 1,402 563.5 24.9 1,620 736.5 28.7 5,641 167.2 2010 73 9.3 1.3 612 52.0 10.7 1,980 204.8 34.7 1,413 548.7 24.8 1,626 722.6 28.5 5,704 167.1 2011* 60 7.7 1.1 634 53.5 11.3 1,928 196.5 34.4 1,411 527.1 25.2 1,575 685.9 28.1 5,608 162.6 2012* 84 10.7 1.5 572 47.7 10.4 1,939 196.3 35.4 1,376 485.2 25.1 1,510 642.3 27.6 5,481 157.1 2013* 62 7.9 1.2 576 48.0 10.8 1,844 185.6 34.6 1,348 448.8 25.3 1,503 632.5 28.2 5,333 151.7
Note * For a summary of under-reporting by province and year, see Section 1.2. Sources Canadian Organ Replacement Register, 2014, Canadian Institute for Health Information; Statistics Canada.
26
Canadian Organ Replacement Register Annual Report: Treatment of End-Stage Organ Failure in Canada, 2004 to 2013
Figure 1: Incident End-Stage Kidney Disease Patients, Age-Specific Rate per Million Population, Canada, 1994 to 2013*
Note * For a summary of under-reporting by province and year, see Section 1.2. Sources Canadian Organ Replacement Register, 2014, Canadian Institute for Health Information; Statistics Canada.
27
Chapter 2—Renal Replacement Therapy for End-Stage Kidney Disease
Table 2: Incident End-Stage Kidney Disease Patients by Province/Territory, Canada, 2004 to 2013 (Number, Rate per Million Population)
2004 2005 2006 2007 2008 2009 2010 2011* 2012* 2013*
B.C./Y.T. N 669 636 700 718 697 762 749 777 884 912
RPMP 158.2 148.4 161.2 165.4 157.8 169.8 164.1 168.6 189.8 197.5
Alta./ N.W.T./Nun.
N 462 530 483 524 481 527 490 506 530 564
RPMP 141.1 159.2 140.1 146.0 131.0 140.0 129.0 131.2 134.2 137.4 Sask. N 191 171 183 195 177 200 158 174 214 181
RPMP 191.9 172.0 185.7 195.0 174.6 194.2 151.3 164.5 198.2 163.3
Man.* N 230 234 297 251 284 283 299 264 288 123
RPMP 196.5 198.7 252.2 210.2 235.5 231.6 242.2 211.1 227.3 97.2 Ont.* N 2,211 2,269 2,309 2,363 2,288 2,362 2,495 2,521 2,505 2,797
RPMP 178.4 180.9 182.0 184.7 176.9 180.7 188.6 188.5 185.5 206.6
Que.* N 1,014 1,046 1,052 1,064 1,101 1,064 1,049 929 639 443
RPMP 134.4 137.7 137.5 138.4 142.0 135.9 132.7 116.4 79.3 54.3 N.B.* N 158 123 141 112 148 130 134 123 134 43
RPMP 210.3 163.6 188.2 150.2 198.1 173.5 178.0 162.8 177.3 56.9
N.S./ P.E.I.
N 157 187 166 199 224 188 200 174 178 166
RPMP 146.1 173.8 154.7 185.3 208.2 174.2 183.8 159.4 162.6 152.9 N.L. N 115 93 81 88 106 125 130 140 109 104
RPMP 222.4 180.2 158.9 173.7 209.3 245.6 254.3 274.2 212.6 197.5 Canada N 5,207 5,289 5,412 5,514 5,506 5,641 5,704 5,608 5,481 5,333
RPMP 163.0 163.9 165.9 167.4 165.2 167.2 167.1 162.6 157.1 151.7
Note * For a summary of under-reporting by province and year, see Section 1.2. Sources Canadian Organ Replacement Register, 2014, Canadian Institute for Health Information; Statistics Canada.
28
Canadian Organ Replacement Register Annual Report: Treatment of End-Stage Organ Failure in Canada, 2004 to 2013
Table 3: Incident End-Stage Kidney Disease Patients by Initial Treatment, Canada, 2004 to 2013 (Number, Rate per Million Population, Percentage of Total)
Initial Treatment 2004 2005 2006 2007 2008 2009 2010 2011* 2012* 2013* HD Home N 9 3 19 17 24 26 21 25 22 32
RPMP 0.3 0.1 0.6 0.5 0.7 0.8 0.6 0.7 0.6 0.9
% 0.2 0.1 0.4 0.3 0.4 0.5 0.4 0.5 0.4 0.6 HD Institutional
N 4,084 4,146 4,298 4,362 4,313 4,396 4,511 4,460 4,294 4,058
RPMP 127.8 128.5 131.7 132.5 129.4 130.3 132.2 129.3 123.1 115.4
% 78.4 78.4 79.4 79.1 78.3 77.9 79.1 79.5 78.3 76.1
CAPD N 731 707 661 685 704 776 684 688 666 668
RPMP 22.9 21.9 20.3 20.8 21.1 23.0 20.0 20.0 19.1 19.0
% 14.0 13.4 12.2 12.4 12.8 13.8 12.0 12.3 12.2 12.5 APD N 253 272 271 272 297 260 299 243 316 369
RPMP 7.9 8.4 8.3 8.3 8.9 7.7 8.8 7.0 9.1 10.5
% 4.9 5.1 5.0 4.9 5.4 4.6 5.2 4.3 5.8 6.9 Pre-Emptive N 130 161 163 178 168 183 189 192 183 206
RPMP 4.1 5.0 5.0 5.4 5.0 5.4 5.5 5.6 5.2 5.9
% 2.5 3.0 3.0 3.2 3.1 3.2 3.3 3.4 3.3 3.9 Total N 5,207 5,289 5,412 5,514 5,506 5,641 5,704 5,608 5,481 5,333
RPMP 163.0 163.9 165.9 167.4 165.2 167.2 167.1 162.6 157.1 151.7
Notes * For a summary of under-reporting by province and year, see Section 1.2. HD: Hemodialysis; CAPD: Continuous ambulatory peritoneal dialysis; APD: Automated peritoneal dialysis; Pre-Emptive: Pre-emptive kidney transplant. Sources Canadian Organ Replacement Register, 2014, Canadian Institute for Health Information; Statistics Canada.
29
Chapter 2—Renal Replacement Therapy for End-Stage Kidney Disease
Table 4: Incident End-Stage Kidney Disease Patients by Year, Age Group and Initial Treatment Modality, Canada, 2004 to 2013 (Number)
Age Group
Initial Modality
2004 2005 2006 2007 2008 2009 2010 2011* 2012* 2013* N =
5,207 N =
5,289 N =
5,412 N =
5,514 N =
5,506 N =
5,641 N =
5,704 N =
5,608 N =
5,481 N =
5,333
0–19 HD 33 45 59 39 35 51 38 26 35 26
PD 29 33 15 15 33 21 19 14 18 12
Pre-Emptive 12 20 11 20 12 9 16 20 31 24 20–44 HD 416 433 440 441 431 406 421 436 407 366
PD 155 134 145 134 146 121 136 141 115 147
Pre-Emptive 55 41 51 70 55 61 55 57 50 63 45–64 HD 1,287 1,225 1,340 1,381 1,381 1,427 1,495 1,452 1,443 1,339
PD 392 366 368 377 389 428 381 379 406 411
Pre-Emptive 50 91 85 75 86 95 104 97 90 94 65–74 HD 1,118 1,140 1,122 1,166 1,124 1,133 1,165 1,186 1,133 1,081
PD 212 250 231 230 248 251 234 208 233 244
Pre-Emptive 12 9 14 12 15 18 14 17 10 23
75+ HD 1,239 1,306 1,356 1,352 1,366 1,405 1,413 1,385 1,298 1,278
PD 196 196 173 201 185 215 213 189 210 223
Pre-Emptive 1 0 2 1 0 0 0 1 2 2 Total HD 4,093 4,149 4,317 4,379 4,337 4,422 4,532 4,485 4,316 4,090
PD 984 979 932 957 1,001 1,036 983 931 982 1,037 Pre-Emptive 130 161 163 178 168 183 189 192 183 206
Notes * For a summary of under-reporting by province and year, see Section 1.2. HD: Hemodialysis; PD: Peritoneal dialysis; Pre-emptive: Pre-emptive kidney transplant. Source Canadian Organ Replacement Register, 2014, Canadian Institute for Health Information.
30
Canadian Organ Replacement Register Annual Report: Treatment of End-Stage Organ Failure in Canada, 2004 to 2013
Table 5: Incident Patients by Initial Treatment and Province/Territory, Canada, 2013 (Number, Percentage of Total)
Initial Treatment
Province/Territory
B.C./ Y.T.
Alta./ N.W.T./
Nun. Sask. Man.* Ont. * Que. * N.B. * N.S./ P.E.I. N.L. Canada
HD N 649 442 138 87 2,174 345 31 131 93 4,090 % 71.5 77.8 76.2 70.7 77.8 77.5 72.1 78.4 91.2 77.0
CAPD N 153 98 41 25 267 41 11 23 9 668 % 16.9 17.3 22.7 20.3 9.5 9.2 25.6 13.8 8.8 13.0
APD N 63 8 1 2 287 5 1 2 0 369 % 6.9 1.4 0.6 1.6 10.3 1.1 2.3 1.2 0 7.0
Pre-Emptive N 43 20 1 9 68 54 0 11 0 206 % 4.7 3.5 0.6 7.3 2.4 12.1 0 6.6 0 4.0
Total N 908 568 181 123 2,796 445 43 167 102 5,333
Notes * For a summary of under-reporting by province and year, see Section 1.2. HD: Hemodialysis; CAPD: Continuous ambulatory peritoneal dialysis; APD: Automated peritoneal dialysis; Pre-emptive: Pre-emptive kidney transplant. Percentages may not add up to 100 because of rounding. Source Canadian Organ Replacement Register, 2014, Canadian Institute for Health Information.
31
Chapter 2—Renal Replacement Therapy for End-Stage Kidney Disease
Table 6: Incident End-Stage Kidney Disease Patients by Primary Diagnosis, Canada, 2004 to 2013 (Number, Rate per Million Population)
Diagnosis 2004 2005 2006 2007 2008 2009 2010 2011* 2012* 2013* Glomerulonephritis N 679 595 617 615 598 625 616 615 594 566
RPMP 21.3 18.4 18.9 18.7 17.9 18.5 18.1 17.8 17.0 16.1
% 13.0 11.3 11.4 11.2 10.9 11.1 10.8 11.0 10.8 10.6 Diabetes N 1,799 1,845 1,857 1,921 1,936 1,938 2,030 2,002 2,120 1,915
RPMP 56.3 57.2 56.9 58.3 58.1 57.4 59.5 58.1 60.8 54.5
% 34.6 34.9 34.3 34.8 35.2 34.4 35.6 35.7 38.7 35.9
Renal Vascular Disease
N 954 1,023 1,060 991 1,014 1,079 1,045 927 830 785
RPMP 29.9 31.7 32.5 30.1 30.4 32.0 30.6 26.9 23.8 22.3
% 18.3 19.3 19.6 18.0 18.4 19.1 18.3 16.5 15.1 14.7 Polycystic Kidney Disease
N 222 269 258 233 219 205 235 220 227 226
RPMP 6.9 8.3 7.9 7.1 6.6 6.1 6.9 6.4 6.5 6.4
% 4.3 5.1 4.8 4.2 4.0 3.6 4.1 3.9 4.1 4.2 Drug Induced N 93 103 91 124 108 113 120 106 97 99
RPMP 2.9 3.2 2.8 3.8 3.2 3.3 3.5 3.1 2.8 2.8
% 1.8 2.0 1.7 2.3 2.0 2.0 2.1 1.9 1.8 1.9 Pyelonephritis N 229 197 189 214 197 196 184 235 127 114
RPMP 7.2 6.1 5.8 6.5 5.9 5.8 5.4 6.8 3.6 3.2
% 4.4 3.7 3.5 3.9 3.6 3.5 3.2 4.2 2.3 2.1
Other† N 519 576 618 563 667 664 709 815 658 907
RPMP 16.2 17.8 18.9 17.1 20.0 19.7 20.8 23.6 18.9 25.8
% 10.0 10.9 11.4 10.2 12.1 11.8 12.4 14.5 12.0 17.0 Unknown/Not Reported
N 712 681 722 853 767 821 765 688 828 721
RPMP 22.3 21.1 22.1 25.9 23.0 24.3 22.4 20.0 23.7 20.5
% 13.7 12.9 13.3 15.5 13.9 14.6 13.4 12.3 15.1 13.5
Notes * For a summary of under-reporting by province and year, see Section 1.2. † For a list of all primary diagnoses captured by CORR, see Appendix F. Sources Canadian Organ Replacement Register, 2014, Canadian Institute for Health Information; Statistics Canada.
32
Canadian Organ Replacement Register Annual Report: Treatment of End-Stage Organ Failure in Canada, 2004 to 2013
Table 7: Incident End-Stage Kidney Disease Patients With Late Referral Status,* by Province/ Territory and Canada, 2004 to 2013 (Percentage)
Province 2004 2005 2006 2007 2008 2009 2010 2011† 2012† 2013†
B.C./Y.T. 34.7 31.2 29.7 31.0 32.9 33.8 29.9 34.0 30.0 28.7
Alta./N.W.T./Nun. 40.1 34.1 39.0 30.5 32.9 31.4 30.3 27.4 27.2 28.0
Sask. 36.8 34.5 40.5 27.5 29.6 28.5 31.2 31.5 26.7 25.8
Man.† 38.4 33.0 33.7 32.2 25.0 29.1 28.6 26.2 25.5 19.4
Ont.† 35.8 35.9 33.3 31.6 31.9 31.6 29.7 29.4 24.7 27.5
Que.† 37.8 33.1 33.3 32.7 29.2 27.9 30.7 27.3 30.8 31.4
N.B.† 31.3 37.5 39.4 38.5 32.0 34.4 34.4 32.2 28.2 35.0
N.S./P.E.I. 30.6 31.3 25.4 26.2 26.1 26.7 23.5 20.4 22.2 19.4
N.L. 36.1 29.4 22.1 25.0 30.1 26.2 26.2 27.0 27.6 16.8
Canada 36.3 34.2 33.4 31.3 31.0 30.8 29.8 29.2 26.7 27.4
Notes * Patients with a late referral status started dialysis less than 90 days after first seeing a nephrologist. † For a summary of under-reporting by province and year, see Section 1.2. Source Canadian Organ Replacement Register, 2014, Canadian Institute for Health Information.
Table 8: Incident End-Stage Kidney Disease Patients With Late Referral Status,* by Primary Diagnosis, Canada, 2004 to 2013 (Percentage)
Diagnosis‡ 2004 2005 2006 2007 2008 2009 2010 2011† 2012† 2013†
Glomerulonephritis 32.5 30.9 30.0 27.6 24.7 26.8 25.0 28.8 24.5 23.7
Diabetes 27.6 25.9 25.4 23.2 22.0 22.8 21.9 19.4 16.5 16.5
Renal Vascular Disease
37.1 32.1 33.1 28.8 26.7 25.8 23.3 24.4 23.5 19.3
Polycystic Kidney Disease
15.3 11.0 9.4 8.7 8.5 8.8 11.1 8.5 12.7 6.3
Drug Induced 41.4 25.0 34.1 36.8 29.7 23.1 24.8 31.0 28.1 31.6
Pyelonephritis 39.5 36.0 30.4 30.9 38.5 36.2 36.6 36.8 38.8 29.8
Other‡ 58.3 59.1 56.1 54.3 56.3 54.3 54.3 51.4 50.7 52.6
Unknown/Not Reported
50.3 53.5 48.0 47.1 48.1 48.4 47.9 43.3 42.3 44.8
All Incident Patients 36.3 34.2 33.4 31.3 31.0 30.8 29.8 29.2 26.7 27.4
Notes * Patients with a late referral status started dialysis less than 90 days after first seeing a nephrologist. † For a summary of under-reporting by province and year, see Section 1.2. ‡ For a complete list of all primary diagnoses captured by CORR, see Appendix F. Source Canadian Organ Replacement Register, 2014, Canadian Institute for Health Information.
33
Chapter 2—Renal Replacement Therapy for End-Stage Kidney Disease
Table 9: Adult Incident Dialysis Patients, Selected Characteristics, Canada, 2004 to 2013
2004 2005 2006 2007 2008 2009 2010 2011* 2012* 2013* HD Mean Age (Years) 65.0 65.2 65.1 65.0 65.3 65.4 65.4 65.3 65.1 65.5
Age 65+ (%) 57.9 59.4 57.9 57.8 57.8 57.9 57.2 57.5 56.6 57.9
Male (%) 59.6 60.2 59.6 62.0 60.8 59.8 61.0 62.3 63.3 63.2
Diabetes (%) 45.0 46.0 48.0 49.3 48.9 50.3 51.5 53.7 53.9 53.4
Mean Comorbidity Index† 2.0 2.0 2.0 2.0 2.1 2.1 2.1 2.3 2.1 2.1
Mean BMI 27.4 27.5 27.7 27.6 28.2 28.2 28.4 28.3 28.8 29.1
Mean eGFR‡ 9.7 10.1 10.1 10.1 10.4 10.6 10.6 10.4 10.4 10.3
Late Referral (%)§ 41.0 39.4 37.6 35.7 35.5 35.5 34.2 33.2 30.8 32.3
Access Type (%)
Catheter 73.2 73.3 74.5 76.2 78.9 79.5 77.1 80.8 80.7 79.6
AV Fistula 17.6 19.2 18.7 18.4 15.9 15.8 17.1 15.7 16.1 16.9
AV Graft 2.1 1.5 1.6 1.5 1.5 1.2 1.2 0.8 1.0 1.5
Unknown/Not Reported 7.1 6.0 5.2 3.9 3.6 3.5 4.5 2.7 2.2 1.9
PD Mean Age (Years) 60.2 61.3 60.6 61.1 60.8 61.9 61.7 60.9 61.9 61.3
Age 65+ (%) 42.6 47.0 44.0 45.6 44.6 45.8 46.1 43.2 45.8 45.3
Male (%) 56.8 60.2 55.0 58.4 57.3 57.8 59.6 60.2 60.5 60.9
Diabetes (%) 43.4 45.1 43.2 43.8 42.9 44.5 47.0 45.4 51.9 50.0
Mean Comorbidity Index† 1.3 1.4 1.2 1.3 1.1 1.1 1.3 1.2 1.2 1.1
Mean BMI 26.5 26.8 27.2 27.1 27.5 28.0 27.5 27.3 27.9 27.5
Mean eGFR‡ 9.9 10.1 10.0 10.5 10.7 10.8 10.9 10.1 10.0 9.9
Late Referral (%)§ 15.8 11.4 12.1 11.3 10.4 10.1 8.6 9.1 6.7 7.4
Notes * For a summary of under-reporting by province and year, see Section 1.2. † The index assigns each of the 14 comorbid conditions collected in CORR a weight from 1 to 10. The possible range is from 0 to 32. ‡ Estimated glomerular filtration rate as determined by the Modification of Diet in Renal Disease (MDRD) formula (mL/min/1.73 m2). § Patients who first see a nephrologist less than 90 days before starting dialysis. HD: Hemodialysis; PD: Peritoneal dialysis; BMI: Body mass index; Catheter: Central venous catheter; AV fistula: Arteriovenous fistula; AV graft: Arteriovenous graft. Source Canadian Organ Replacement Register, 2014, Canadian Institute for Health Information.
34
Canadian Organ Replacement Register Annual Report: Treatment of End-Stage Organ Failure in Canada, 2004 to 2013
2.2 Prevalent ESKD RRT Patients Prevalence, by definition, is the number of people or proportion of people in the entire population who are found with a defined disease at a specified point in time. For CORR, this is the number of patients who are alive and receiving RRT (dialysis or transplant) for ESKD on December 31 of a given year. Prevalence is usually presented as RPMP, or the relative proportion of people in the population living with the cited disease.
In this section, the trends in ESKD prevalent patients in Canada are presented over time in the following figures and tables.
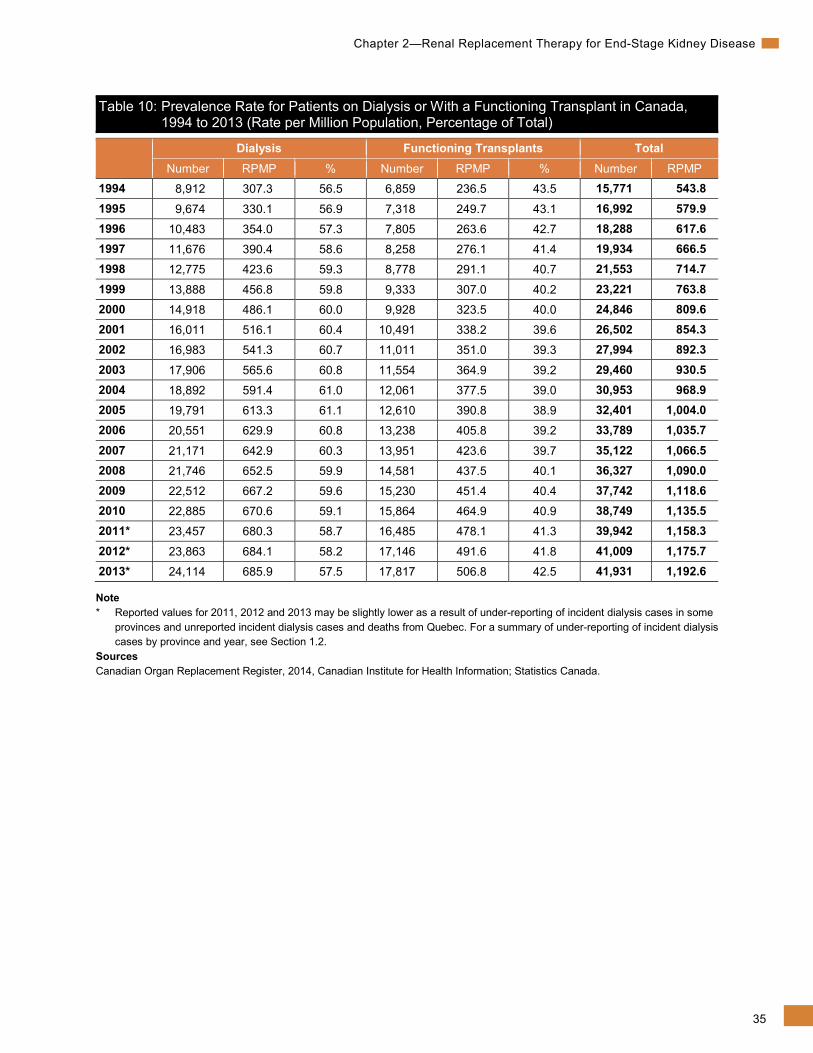
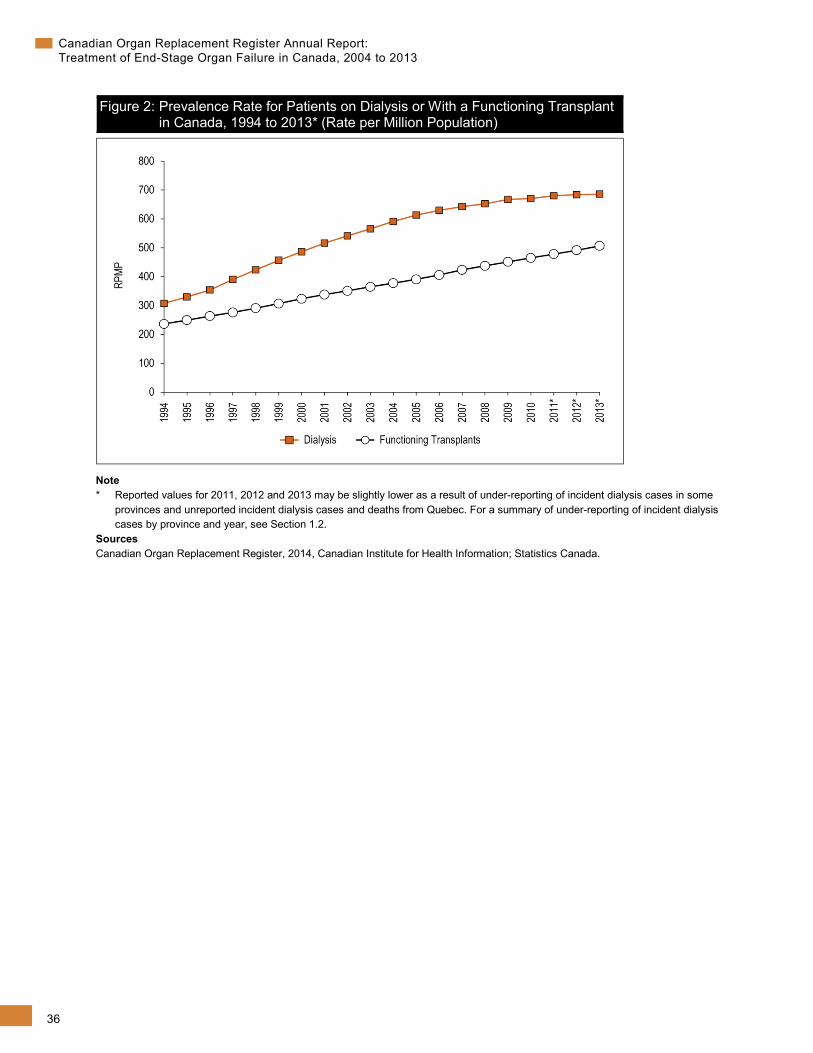
As of December 31, 2013, there were 41,931 people in Canada being treated for ESKD, with 57.5% (24,114) on dialysis and 42.5% (17,817) living with a functioning kidney transplant (Table 10). Since 1994, the prevalence rate for patients being treated by dialysis has increased 123%, from 307.3 RPMP to 685.9 RPMP (Figure 2). During the same period, the prevalence rate of patients with functioning kidney transplants more than doubled, from 236.5 RPMP to 506.8 RPMP.
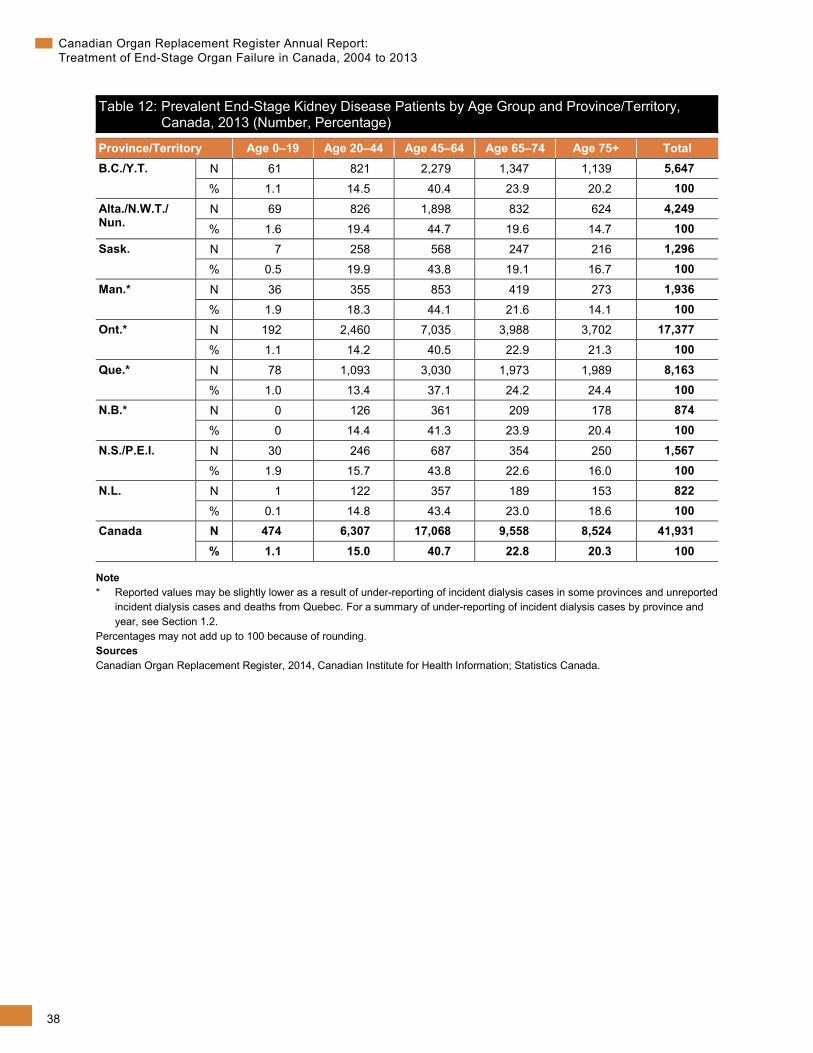
Table 11 provides prevalence rates by age. Over the 20-year period, prevalence rates increased in all age groups except among those age 0 to 19.
Prevalence rates in 2013 were highest in Newfoundland and Labrador and Manitoba (1,560.7 and 1,530.4 RPMP, respectively, Table 13).
In 2013, HD provided in an institutional setting was the most common form of RRT across the country (45%), followed by transplant (42%) (Table 14).
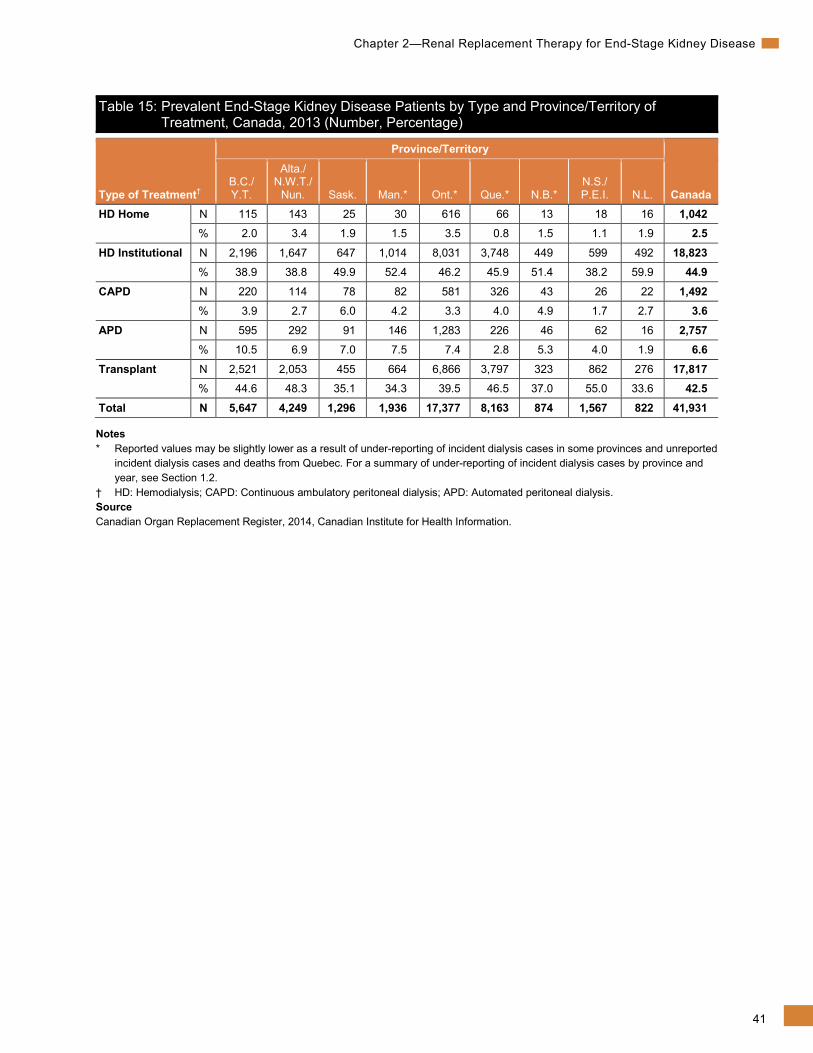
In 2013, in Nova Scotia/Prince Edward Island, Alberta/Northwest Territories/Nunavut, Quebec and British Columbia/Yukon, transplant was the leading treatment seen in prevalent patients with ESKD (55%, 48%, 46 and 45%, respectively) (Table 15). The percentage of patients with transplant as a treatment was lowest in Newfoundland and Labrador and Manitoba (34%).
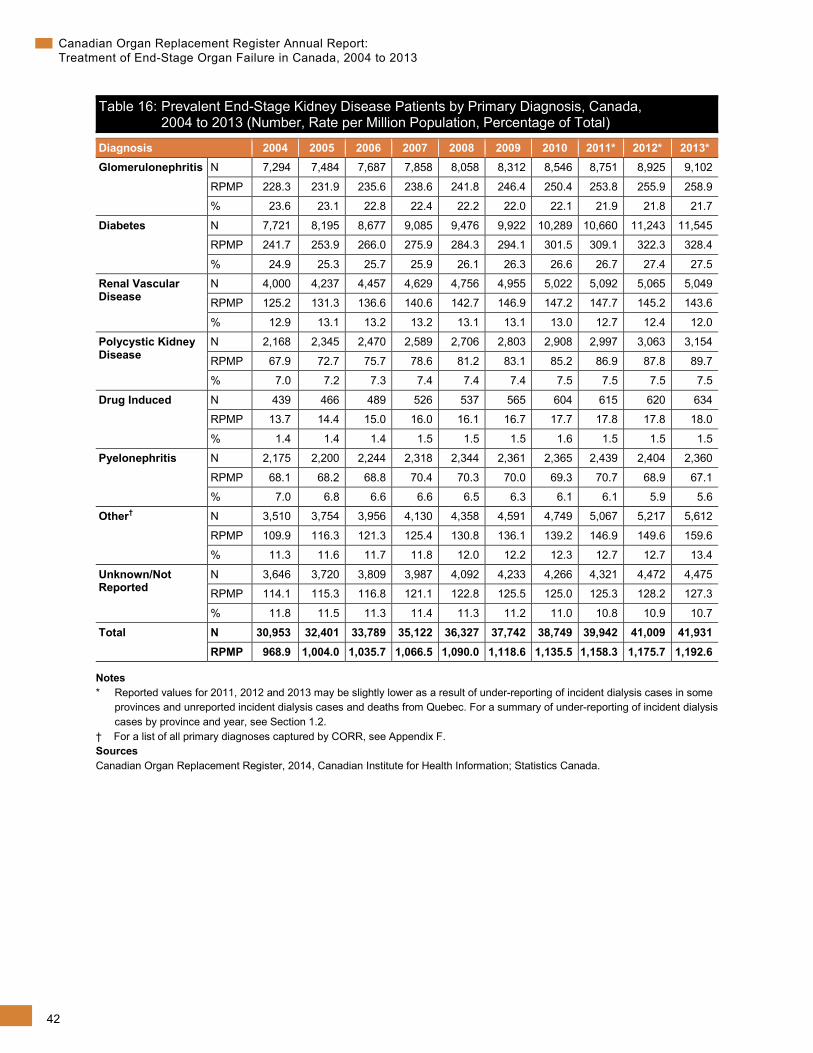
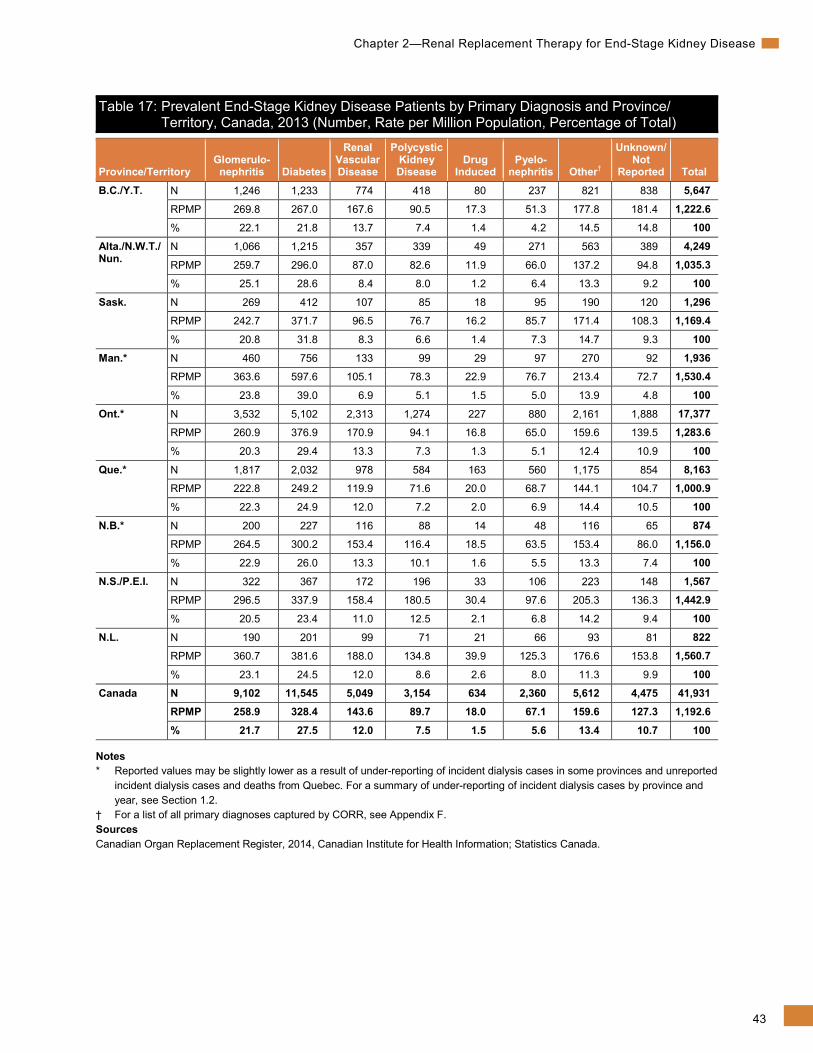
Tables 16 and 17 examine prevalence rates by primary diagnosis. Between 2004 and 2013, the prevalence rate of patients with diabetes as a primary diagnosis increased by 36%. In 2013, diabetic nephropathy accounted for the largest proportion of all prevalent patients (27%), followed by patients with glomerulonephritis (22%).
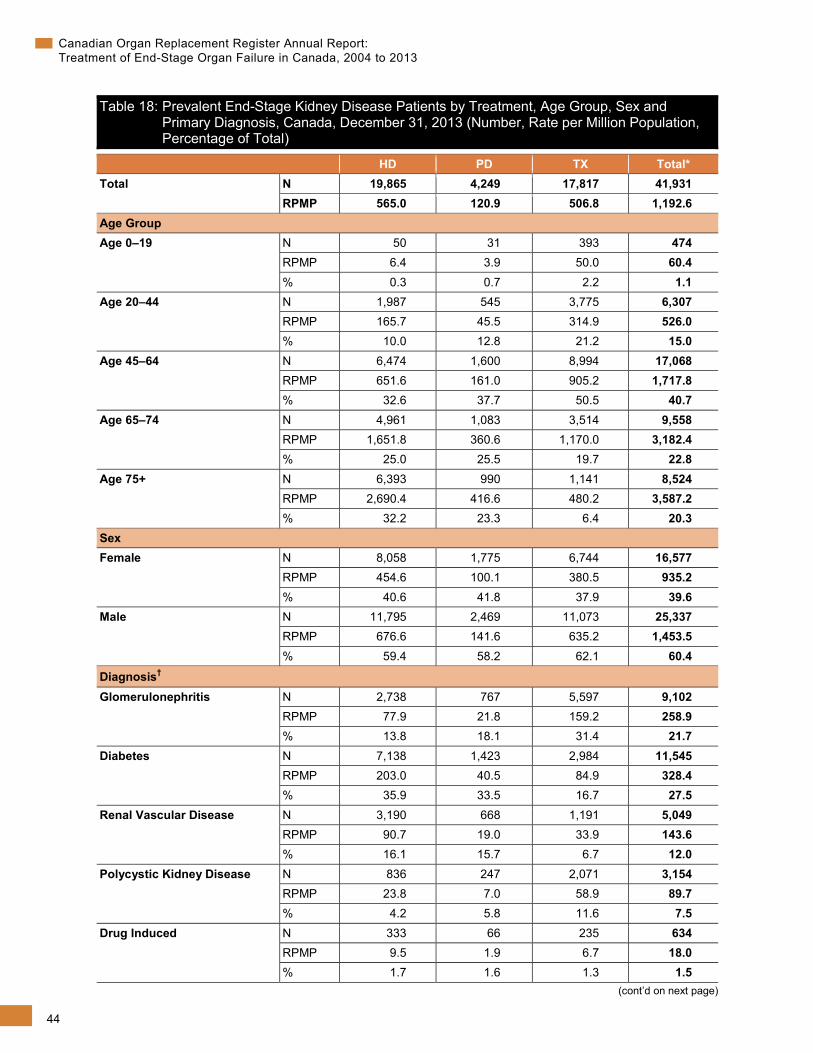
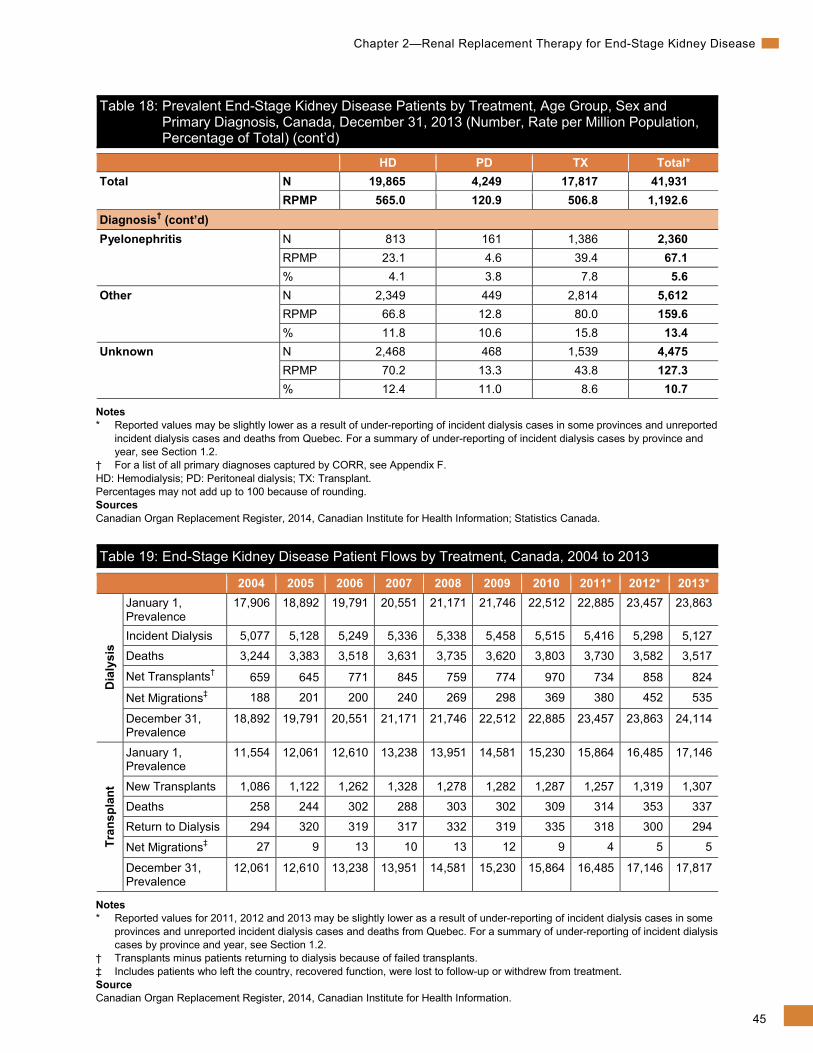
Among prevalent patients in 2013 with a primary diagnosis of diabetes, 62% were being treated with HD and 26% had transplants (Table 18). Overall, patients with diabetic nephropathy accounted for 36% of HD patients. For patients with a primary diagnosis of glomerulonephritis, 61% had a functioning kidney transplant, representing 31% of all transplant patients.
Table 19 summarizes changes in prevalence by examining flows into and out of treatment.
35
Chapter 2—Renal Replacement Therapy for End-Stage Kidney Disease
Table 10: Prevalence Rate for Patients on Dialysis or With a Functioning Transplant in Canada, 1994 to 2013 (Rate per Million Population, Percentage of Total)
Dialysis Functioning Transplants Total
Number RPMP % Number RPMP % Number RPMP 1994 8,912 307.3 56.5 6,859 236.5 43.5 15,771 543.8 1995 9,674 330.1 56.9 7,318 249.7 43.1 16,992 579.9 1996 10,483 354.0 57.3 7,805 263.6 42.7 18,288 617.6 1997 11,676 390.4 58.6 8,258 276.1 41.4 19,934 666.5 1998 12,775 423.6 59.3 8,778 291.1 40.7 21,553 714.7 1999 13,888 456.8 59.8 9,333 307.0 40.2 23,221 763.8 2000 14,918 486.1 60.0 9,928 323.5 40.0 24,846 809.6 2001 16,011 516.1 60.4 10,491 338.2 39.6 26,502 854.3 2002 16,983 541.3 60.7 11,011 351.0 39.3 27,994 892.3 2003 17,906 565.6 60.8 11,554 364.9 39.2 29,460 930.5 2004 18,892 591.4 61.0 12,061 377.5 39.0 30,953 968.9 2005 19,791 613.3 61.1 12,610 390.8 38.9 32,401 1,004.0 2006 20,551 629.9 60.8 13,238 405.8 39.2 33,789 1,035.7 2007 21,171 642.9 60.3 13,951 423.6 39.7 35,122 1,066.5 2008 21,746 652.5 59.9 14,581 437.5 40.1 36,327 1,090.0 2009 22,512 667.2 59.6 15,230 451.4 40.4 37,742 1,118.6 2010 22,885 670.6 59.1 15,864 464.9 40.9 38,749 1,135.5 2011* 23,457 680.3 58.7 16,485 478.1 41.3 39,942 1,158.3 2012* 23,863 684.1 58.2 17,146 491.6 41.8 41,009 1,175.7 2013* 24,114 685.9 57.5 17,817 506.8 42.5 41,931 1,192.6
Note * Reported values for 2011, 2012 and 2013 may be slightly lower as a result of under-reporting of incident dialysis cases in some
provinces and unreported incident dialysis cases and deaths from Quebec. For a summary of under-reporting of incident dialysis cases by province and year, see Section 1.2.
Sources Canadian Organ Replacement Register, 2014, Canadian Institute for Health Information; Statistics Canada.
36
Canadian Organ Replacement Register Annual Report: Treatment of End-Stage Organ Failure in Canada, 2004 to 2013
Figure 2: Prevalence Rate for Patients on Dialysis or With a Functioning Transplant in Canada, 1994 to 2013* (Rate per Million Population)
Note * Reported values for 2011, 2012 and 2013 may be slightly lower as a result of under-reporting of incident dialysis cases in some
provinces and unreported incident dialysis cases and deaths from Quebec. For a summary of under-reporting of incident dialysis cases by province and year, see Section 1.2.
Sources Canadian Organ Replacement Register, 2014, Canadian Institute for Health Information; Statistics Canada.

37
Chapter 2—Renal Replacement Therapy for End-Stage Kidney Disease
Table 11: Prevalent End-Stage Kidney Disease Patients by Age Group, Canada, 1994 to 2013 (Number, Rate per Million Population)
Age 0–19 Age 20–44 Age 45–64 Age 65–74 Age 75+ Total N RPMP N RPMP N RPMP N RPMP N RPMP N RPMP
1994 475 60.0 5,086 435.5 6,047 1,012.9 2,896 1,416.7 1,267 908.8 15,771 543.8 1995 491 61.7 5,263 450.0 6,497 1,057.5 3,237 1,564.9 1,504 1,043.8 16,992 579.9 1996 486 60.8 5,414 462.1 7,114 1,125.8 3,506 1,678.7 1,768 1,186.2 18,288 617.6 1997 499 62.3 5,636 480.1 7,783 1,195.9 3,882 1,840.8 2,134 1,380.5 19,934 666.5 1998 524 65.4 5,844 499.0 8,422 1,255.1 4,232 1,989.7 2,531 1,584.4 21,553 714.7 1999 537 67.2 6,008 513.9 9,124 1,316.1 4,572 2,141.0 2,980 1,804.9 23,221 763.8 2000 561 70.3 6,122 523.8 9,846 1,373.5 4,916 2,290.5 3,401 1,992.7 24,846 809.6 2001 565 70.9 6,192 528.5 10,502 1,417.0 5,287 2,446.5 3,956 2,245.1 26,502 854.3 2002 564 70.9 6,272 533.7 11,079 1,443.5 5,577 2,564.2 4,502 2,476.0 27,994 892.3 2003 563 71.2 6,308 536.7 11,725 1,477.5 5,944 2,713.7 4,920 2,622.9 29,460 930.5 2004 553 70.4 6,306 536.3 12,446 1,519.2 6,241 2,820.3 5,407 2,804.3 30,953 968.9 2005 560 71.5 6,341 538.6 13,040 1,543.7 6,562 2,934.5 5,898 2,976.4 32,401 1,004.0 2006 556 71.1 6,377 541.3 13,707 1,573.2 6,823 3,001.7 6,326 3,099.2 33,789 1,035.7 2007 552 70.2 6,337 543.9 14,324 1,593.5 7,236 3,102.8 6,673 3,175.6 35,122 1,066.5 2008 544 69.2 6,365 545.5 14,938 1,617.3 7,479 3,112.3 7,001 3,250.5 36,327 1,090.0 2009 548 69.7 6,316 539.0 15,559 1,643.0 7,927 3,186.2 7,392 3,360.7 37,742 1,118.6 2010 538 68.5 6,294 534.4 16,095 1,664.5 8,250 3,203.8 7,572 3,364.9 38,749 1,135.5 2011* 504 64.3 6,323 533.3 16,505 1,682.2 8,707 3,252.5 7,903 3,441.5 39,942 1,158.3 2012* 493 63.0 6,324 527.4 16,835 1,704.6 9,140 3,223.1 8,217 3,495.1 41,009 1,175.7 2013* 474 60.4 6,307 526.0 17,068 1,717.8 9,558 3,182.4 8,524 3,587.2 41,931 1,192.6
Note * Reported values for 2011, 2012 and 2013 may be slightly lower as a result of under-reporting of incident dialysis cases in some
provinces and unreported incident dialysis cases and deaths from Quebec. For a summary of under-reporting of incident dialysis cases by province and year, see Section 1.2.
Sources Canadian Organ Replacement Register, 2014, Canadian Institute for Health Information; Statistics Canada.
38
Canadian Organ Replacement Register Annual Report: Treatment of End-Stage Organ Failure in Canada, 2004 to 2013
Table 12: Prevalent End-Stage Kidney Disease Patients by Age Group and Province/Territory, Canada, 2013 (Number, Percentage)
Province/Territory Age 0–19 Age 20–44 Age 45–64 Age 65–74 Age 75+ Total B.C./Y.T. N 61 821 2,279 1,347 1,139 5,647
% 1.1 14.5 40.4 23.9 20.2 100 Alta./N.W.T./ Nun.
N 69 826 1,898 832 624 4,249 % 1.6 19.4 44.7 19.6 14.7 100
Sask. N 7 258 568 247 216 1,296 % 0.5 19.9 43.8 19.1 16.7 100
Man.* N 36 355 853 419 273 1,936 % 1.9 18.3 44.1 21.6 14.1 100
Ont.* N 192 2,460 7,035 3,988 3,702 17,377 % 1.1 14.2 40.5 22.9 21.3 100
Que.* N 78 1,093 3,030 1,973 1,989 8,163 % 1.0 13.4 37.1 24.2 24.4 100
N.B.* N 0 126 361 209 178 874 % 0 14.4 41.3 23.9 20.4 100
N.S./P.E.I. N 30 246 687 354 250 1,567 % 1.9 15.7 43.8 22.6 16.0 100
N.L. N 1 122 357 189 153 822 % 0.1 14.8 43.4 23.0 18.6 100
Canada N 474 6,307 17,068 9,558 8,524 41,931 % 1.1 15.0 40.7 22.8 20.3 100
Note * Reported values may be slightly lower as a result of under-reporting of incident dialysis cases in some provinces and unreported
incident dialysis cases and deaths from Quebec. For a summary of under-reporting of incident dialysis cases by province and year, see Section 1.2.
Percentages may not add up to 100 because of rounding. Sources Canadian Organ Replacement Register, 2014, Canadian Institute for Health Information; Statistics Canada.

39
Chapter 2—Renal Replacement Therapy for End-Stage Kidney Disease
Table 13: Prevalent End-Stage Kidney Disease Patients by Province/Territory, Canada, 2004 to 2013 (Number, Rate per Million Population)
Province/Territory 2004 2005 2006 2007 2008 2009 2010 2011 2012 2013 B.C./Y.T. N 3,978 4,144 4,340 4,510 4,643 4,885 5,039 5,209 5,466 5,647
RPMP 941.0 967.0 999.6 1,038.7 1,051.2 1,088.2 1,104.0 1,130.4 1,173.3 1,222.6
Alta./N.W.T./Nun.
N 3,081 3,243 3,356 3,482 3,562 3,686 3,816 3,914 4,067 4,249
RPMP 941.0 973.9 973.2 970.5 970.3 979.5 1,004.8 1,014.9 1,029.4 1,035.3
Sask. N 980 1,014 1,056 1,116 1,138 1,205 1,197 1,247 1,304 1,296
RPMP 984.5 1,020.0 1,071.7 1,115.8 1,122.7 1,169.8 1,146.5 1,178.8 1,207.5 1,169.4
Man.* N 1,388 1,446 1,523 1,574 1,645 1,742 1,838 1,896 1,971 1,936
RPMP 1,186.1 1,228.0 1,293.1 1,318.3 1,363.9 1,425.6 1,488.8 1,516.1 1,555.6 1,530.4
Ont.* N 12,417 13,110 13,703 14,242 14,759 15,309 15,797 16,345 16,787 17,377
RPMP 1,002.0 1,045.3 1,080.1 1,113.1 1,140.9 1,171.4 1,194.2 1,222.2 1,242.9 1,283.6
Que.* N 6,487 6,750 7,060 7,373 7,649 7,898 7,970 8,135 8,129 8,163
RPMP 860.0 888.4 922.7 959.1 986.5 1,008.8 1,008.1 1,019.5 1,009.2 1,000.9
N.B.* N 792 802 847 855 870 891 899 902 930 874
RPMP 1,054.1 1,066.5 1,130.6 1,146.8 1,164.4 1,188.8 1,194.1 1,194.0 1,230.2 1,156.0
N.S./P.E.I. N 1,165 1,224 1,241 1,307 1,380 1,408 1,437 1,480 1,531 1,567
RPMP 1,083.9 1,137.5 1,156.7 1,216.9 1,282.5 1,304.7 1,320.5 1,356.2 1,398.4 1,442.9
N.L. N 665 668 663 663 681 718 756 814 824 822
RPMP 1,286.2 1,294.7 1,300.8 1,308.9 1,344.7 1,410.8 1,478.6 1,594.3 1,607.3 1,560.7
Canada N 30,953 32,401 33,789 35,122 36,327 37,742 38,749 39,942 41,009 41,931 RPMP 968.9 1,004.0 1,035.7 1,066.5 1,090.0 1,118.6 1,135.5 1,158.3 1,175.7 1,192.6
Note * Reported values for 2011, 2012 and 2013 may be slightly lower as a result of under-reporting of incident dialysis cases in some
provinces and unreported incident dialysis cases and deaths from Quebec. For a summary of under-reporting of incident dialysis cases by province and year, see Section 1.2.
Sources Canadian Organ Replacement Register, 2014, Canadian Institute for Health Information; Statistics Canada.

40
Canadian Organ Replacement Register Annual Report: Treatment of End-Stage Organ Failure in Canada, 2004 to 2013
Table 14: Prevalent End-Stage Kidney Disease Patients by Type of Treatment, Canada, 2004 to 2013 (Number, Rate per Million Population, Percentage of Total)
Type of Treatment† 2004 2005 2006 2007 2008 2009 2010 2011* 2012* 2013* HD Home N 369 485 572 638 717 785 842 925 968 1,042
RPMP 11.6 15.0 17.5 19.4 21.5 23.3 24.7 26.8 27.8 29.6
% 1.2 1.5 1.7 1.8 2.0 2.1 2.2 2.3 2.4 2.5
HD Institutional
N 14,949 15,614 16,205 16,642 17,038 17,646 17,957 18,504 18,712 18,823
RPMP 467.9 483.8 496.7 505.3 511.2 523.0 526.2 536.6 536.5 535.4
% 48.3 48.2 48.0 47.4 46.9 46.8 46.3 46.3 45.6 44.9
CAPD N 1,659 1,611 1,553 1,576 1,602 1,573 1,523 1,472 1,469 1,492
RPMP 51.9 49.9 47.6 47.9 48.1 46.6 44.6 42.7 42.1 42.4
% 5.4 5.0 4.6 4.5 4.4 4.2 3.9 3.7 3.6 3.6
APD N 1,915 2,081 2,221 2,315 2,389 2,508 2,563 2,556 2,714 2,757
RPMP 59.9 64.5 68.1 70.3 71.7 74.3 75.1 74.1 77.8 78.4
% 6.2 6.4 6.6 6.6 6.6 6.6 6.6 6.4 6.6 6.6
Transplant N 12,061 12,610 13,238 13,951 14,581 15,230 15,864 16,485 17,146 17,817
RPMP 377.5 390.8 405.8 423.6 437.5 451.4 464.9 478.1 491.6 506.8
% 39.0 38.9 39.2 39.7 40.1 40.4 40.9 41.3 41.8 42.5
Total N 30,953 32,401 33,789 35,122 36,327 37,742 38,749 39,942 41,009 41,931 RPMP 968.9 1,004.0 1,035.7 1,066.5 1,090.0 1,118.6 1,135.5 1,158.3 1,175.7 1,192.6
Notes * Reported values for 2011, 2012 and 2013 may be slightly lower as a result of under-reporting of incident dialysis cases in some
provinces and unreported incident dialysis cases and deaths from Quebec. For a summary of under-reporting by province and year, see Section 1.2.
† HD: Hemodialysis; CAPD: Continuous ambulatory peritoneal dialysis; APD: Automated peritoneal dialysis. Sources Canadian Organ Replacement Register, 2014, Canadian Institute for Health Information; Statistics Canada.
41
Chapter 2—Renal Replacement Therapy for End-Stage Kidney Disease
Table 15: Prevalent End-Stage Kidney Disease Patients by Type and Province/Territory of Treatment, Canada, 2013 (Number, Percentage)
Type of Treatment†
Province/Territory
B.C./ Y.T.
Alta./ N.W.T./
Nun. Sask. Man.* Ont.* Que.* N.B.* N.S./ P.E.I. N.L. Canada
HD Home N 115 143 25 30 616 66 13 18 16 1,042 % 2.0 3.4 1.9 1.5 3.5 0.8 1.5 1.1 1.9 2.5
HD Institutional N 2,196 1,647 647 1,014 8,031 3,748 449 599 492 18,823 % 38.9 38.8 49.9 52.4 46.2 45.9 51.4 38.2 59.9 44.9
CAPD N 220 114 78 82 581 326 43 26 22 1,492 % 3.9 2.7 6.0 4.2 3.3 4.0 4.9 1.7 2.7 3.6
APD N 595 292 91 146 1,283 226 46 62 16 2,757 % 10.5 6.9 7.0 7.5 7.4 2.8 5.3 4.0 1.9 6.6
Transplant N 2,521 2,053 455 664 6,866 3,797 323 862 276 17,817 % 44.6 48.3 35.1 34.3 39.5 46.5 37.0 55.0 33.6 42.5
Total N 5,647 4,249 1,296 1,936 17,377 8,163 874 1,567 822 41,931
Notes * Reported values may be slightly lower as a result of under-reporting of incident dialysis cases in some provinces and unreported
incident dialysis cases and deaths from Quebec. For a summary of under-reporting of incident dialysis cases by province and year, see Section 1.2.
† HD: Hemodialysis; CAPD: Continuous ambulatory peritoneal dialysis; APD: Automated peritoneal dialysis. Source Canadian Organ Replacement Register, 2014, Canadian Institute for Health Information.
42
Canadian Organ Replacement Register Annual Report: Treatment of End-Stage Organ Failure in Canada, 2004 to 2013
Table 16: Prevalent End-Stage Kidney Disease Patients by Primary Diagnosis, Canada, 2004 to 2013 (Number, Rate per Million Population, Percentage of Total)
Diagnosis 2004 2005 2006 2007 2008 2009 2010 2011* 2012* 2013* Glomerulonephritis N 7,294 7,484 7,687 7,858 8,058 8,312 8,546 8,751 8,925 9,102
RPMP 228.3 231.9 235.6 238.6 241.8 246.4 250.4 253.8 255.9 258.9
% 23.6 23.1 22.8 22.4 22.2 22.0 22.1 21.9 21.8 21.7
Diabetes N 7,721 8,195 8,677 9,085 9,476 9,922 10,289 10,660 11,243 11,545
RPMP 241.7 253.9 266.0 275.9 284.3 294.1 301.5 309.1 322.3 328.4
% 24.9 25.3 25.7 25.9 26.1 26.3 26.6 26.7 27.4 27.5
Renal Vascular Disease
N 4,000 4,237 4,457 4,629 4,756 4,955 5,022 5,092 5,065 5,049
RPMP 125.2 131.3 136.6 140.6 142.7 146.9 147.2 147.7 145.2 143.6
% 12.9 13.1 13.2 13.2 13.1 13.1 13.0 12.7 12.4 12.0
Polycystic Kidney Disease
N 2,168 2,345 2,470 2,589 2,706 2,803 2,908 2,997 3,063 3,154
RPMP 67.9 72.7 75.7 78.6 81.2 83.1 85.2 86.9 87.8 89.7
% 7.0 7.2 7.3 7.4 7.4 7.4 7.5 7.5 7.5 7.5
Drug Induced N 439 466 489 526 537 565 604 615 620 634
RPMP 13.7 14.4 15.0 16.0 16.1 16.7 17.7 17.8 17.8 18.0
% 1.4 1.4 1.4 1.5 1.5 1.5 1.6 1.5 1.5 1.5
Pyelonephritis N 2,175 2,200 2,244 2,318 2,344 2,361 2,365 2,439 2,404 2,360
RPMP 68.1 68.2 68.8 70.4 70.3 70.0 69.3 70.7 68.9 67.1
% 7.0 6.8 6.6 6.6 6.5 6.3 6.1 6.1 5.9 5.6
Other† N 3,510 3,754 3,956 4,130 4,358 4,591 4,749 5,067 5,217 5,612
RPMP 109.9 116.3 121.3 125.4 130.8 136.1 139.2 146.9 149.6 159.6
% 11.3 11.6 11.7 11.8 12.0 12.2 12.3 12.7 12.7 13.4
Unknown/Not Reported
N 3,646 3,720 3,809 3,987 4,092 4,233 4,266 4,321 4,472 4,475
RPMP 114.1 115.3 116.8 121.1 122.8 125.5 125.0 125.3 128.2 127.3
% 11.8 11.5 11.3 11.4 11.3 11.2 11.0 10.8 10.9 10.7
Total N 30,953 32,401 33,789 35,122 36,327 37,742 38,749 39,942 41,009 41,931 RPMP 968.9 1,004.0 1,035.7 1,066.5 1,090.0 1,118.6 1,135.5 1,158.3 1,175.7 1,192.6
Notes * Reported values for 2011, 2012 and 2013 may be slightly lower as a result of under-reporting of incident dialysis cases in some
provinces and unreported incident dialysis cases and deaths from Quebec. For a summary of under-reporting of incident dialysis cases by province and year, see Section 1.2.
† For a list of all primary diagnoses captured by CORR, see Appendix F. Sources Canadian Organ Replacement Register, 2014, Canadian Institute for Health Information; Statistics Canada.
43
Chapter 2—Renal Replacement Therapy for End-Stage Kidney Disease
Table 17: Prevalent End-Stage Kidney Disease Patients by Primary Diagnosis and Province/ Territory, Canada, 2013 (Number, Rate per Million Population, Percentage of Total)
Province/Territory Glomerulo-nephritis Diabetes
Renal Vascular Disease
Polycystic Kidney Disease
Drug Induced
Pyelo- nephritis Other†
Unknown/Not
Reported Total
B.C./Y.T. N 1,246 1,233 774 418 80 237 821 838 5,647
RPMP 269.8 267.0 167.6 90.5 17.3 51.3 177.8 181.4 1,222.6
% 22.1 21.8 13.7 7.4 1.4 4.2 14.5 14.8 100
Alta./N.W.T./ Nun.
N 1,066 1,215 357 339 49 271 563 389 4,249
RPMP 259.7 296.0 87.0 82.6 11.9 66.0 137.2 94.8 1,035.3
% 25.1 28.6 8.4 8.0 1.2 6.4 13.3 9.2 100
Sask. N 269 412 107 85 18 95 190 120 1,296
RPMP 242.7 371.7 96.5 76.7 16.2 85.7 171.4 108.3 1,169.4
% 20.8 31.8 8.3 6.6 1.4 7.3 14.7 9.3 100
Man.* N 460 756 133 99 29 97 270 92 1,936
RPMP 363.6 597.6 105.1 78.3 22.9 76.7 213.4 72.7 1,530.4
% 23.8 39.0 6.9 5.1 1.5 5.0 13.9 4.8 100
Ont.* N 3,532 5,102 2,313 1,274 227 880 2,161 1,888 17,377
RPMP 260.9 376.9 170.9 94.1 16.8 65.0 159.6 139.5 1,283.6
% 20.3 29.4 13.3 7.3 1.3 5.1 12.4 10.9 100
Que.* N 1,817 2,032 978 584 163 560 1,175 854 8,163
RPMP 222.8 249.2 119.9 71.6 20.0 68.7 144.1 104.7 1,000.9
% 22.3 24.9 12.0 7.2 2.0 6.9 14.4 10.5 100
N.B.* N 200 227 116 88 14 48 116 65 874
RPMP 264.5 300.2 153.4 116.4 18.5 63.5 153.4 86.0 1,156.0
% 22.9 26.0 13.3 10.1 1.6 5.5 13.3 7.4 100
N.S./P.E.I. N 322 367 172 196 33 106 223 148 1,567
RPMP 296.5 337.9 158.4 180.5 30.4 97.6 205.3 136.3 1,442.9
% 20.5 23.4 11.0 12.5 2.1 6.8 14.2 9.4 100
N.L. N 190 201 99 71 21 66 93 81 822
RPMP 360.7 381.6 188.0 134.8 39.9 125.3 176.6 153.8 1,560.7
% 23.1 24.5 12.0 8.6 2.6 8.0 11.3 9.9 100
Canada N 9,102 11,545 5,049 3,154 634 2,360 5,612 4,475 41,931 RPMP 258.9 328.4 143.6 89.7 18.0 67.1 159.6 127.3 1,192.6
% 21.7 27.5 12.0 7.5 1.5 5.6 13.4 10.7 100
Notes * Reported values may be slightly lower as a result of under-reporting of incident dialysis cases in some provinces and unreported
incident dialysis cases and deaths from Quebec. For a summary of under-reporting of incident dialysis cases by province and year, see Section 1.2.
† For a list of all primary diagnoses captured by CORR, see Appendix F. Sources Canadian Organ Replacement Register, 2014, Canadian Institute for Health Information; Statistics Canada.
44
Canadian Organ Replacement Register Annual Report: Treatment of End-Stage Organ Failure in Canada, 2004 to 2013
Table 18: Prevalent End-Stage Kidney Disease Patients by Treatment, Age Group, Sex and Primary Diagnosis, Canada, December 31, 2013 (Number, Rate per Million Population, Percentage of Total)
HD PD TX Total*
Total N 19,865 4,249 17,817 41,931 RPMP 565.0 120.9 506.8 1,192.6
Age Group Age 0–19 N 50 31 393 474
RPMP 6.4 3.9 50.0 60.4 % 0.3 0.7 2.2 1.1
Age 20–44 N 1,987 545 3,775 6,307 RPMP 165.7 45.5 314.9 526.0 % 10.0 12.8 21.2 15.0
Age 45–64 N 6,474 1,600 8,994 17,068 RPMP 651.6 161.0 905.2 1,717.8 % 32.6 37.7 50.5 40.7
Age 65–74 N 4,961 1,083 3,514 9,558 RPMP 1,651.8 360.6 1,170.0 3,182.4 % 25.0 25.5 19.7 22.8
Age 75+ N 6,393 990 1,141 8,524 RPMP 2,690.4 416.6 480.2 3,587.2 % 32.2 23.3 6.4 20.3
Sex Female N 8,058 1,775 6,744 16,577
RPMP 454.6 100.1 380.5 935.2 % 40.6 41.8 37.9 39.6
Male N 11,795 2,469 11,073 25,337 RPMP 676.6 141.6 635.2 1,453.5 % 59.4 58.2 62.1 60.4
Diagnosis† Glomerulonephritis N 2,738 767 5,597 9,102
RPMP 77.9 21.8 159.2 258.9 % 13.8 18.1 31.4 21.7
Diabetes N 7,138 1,423 2,984 11,545 RPMP 203.0 40.5 84.9 328.4 % 35.9 33.5 16.7 27.5
Renal Vascular Disease N 3,190 668 1,191 5,049 RPMP 90.7 19.0 33.9 143.6 % 16.1 15.7 6.7 12.0
Polycystic Kidney Disease N 836 247 2,071 3,154 RPMP 23.8 7.0 58.9 89.7 % 4.2 5.8 11.6 7.5
Drug Induced N 333 66 235 634 RPMP 9.5 1.9 6.7 18.0 % 1.7 1.6 1.3 1.5
(cont’d on next page)
45
Chapter 2—Renal Replacement Therapy for End-Stage Kidney Disease
Table 18: Prevalent End-Stage Kidney Disease Patients by Treatment, Age Group, Sex and Primary Diagnosis, Canada, December 31, 2013 (Number, Rate per Million Population, Percentage of Total) (cont’d)
HD PD TX Total*
Total N 19,865 4,249 17,817 41,931 RPMP 565.0 120.9 506.8 1,192.6
Diagnosis† (cont’d) Pyelonephritis N 813 161 1,386 2,360
RPMP 23.1 4.6 39.4 67.1 % 4.1 3.8 7.8 5.6
Other N 2,349 449 2,814 5,612 RPMP 66.8 12.8 80.0 159.6 % 11.8 10.6 15.8 13.4
Unknown N 2,468 468 1,539 4,475 RPMP 70.2 13.3 43.8 127.3 % 12.4 11.0 8.6 10.7
Notes * Reported values may be slightly lower as a result of under-reporting of incident dialysis cases in some provinces and unreported
incident dialysis cases and deaths from Quebec. For a summary of under-reporting of incident dialysis cases by province and year, see Section 1.2.
† For a list of all primary diagnoses captured by CORR, see Appendix F. HD: Hemodialysis; PD: Peritoneal dialysis; TX: Transplant. Percentages may not add up to 100 because of rounding. Sources Canadian Organ Replacement Register, 2014, Canadian Institute for Health Information; Statistics Canada.
Table 19: End-Stage Kidney Disease Patient Flows by Treatment, Canada, 2004 to 2013
2004 2005 2006 2007 2008 2009 2010 2011* 2012* 2013*
Dia
lysi
s
January 1, Prevalence
17,906 18,892 19,791 20,551 21,171 21,746 22,512 22,885 23,457 23,863
Incident Dialysis 5,077 5,128 5,249 5,336 5,338 5,458 5,515 5,416 5,298 5,127
Deaths 3,244 3,383 3,518 3,631 3,735 3,620 3,803 3,730 3,582 3,517
Net Transplants† 659 645 771 845 759 774 970 734 858 824
Net Migrations‡ 188 201 200 240 269 298 369 380 452 535
December 31, Prevalence
18,892 19,791 20,551 21,171 21,746 22,512 22,885 23,457 23,863 24,114
Tran
spla
nt
January 1, Prevalence
11,554 12,061 12,610 13,238 13,951 14,581 15,230 15,864 16,485 17,146
New Transplants 1,086 1,122 1,262 1,328 1,278 1,282 1,287 1,257 1,319 1,307
Deaths 258 244 302 288 303 302 309 314 353 337
Return to Dialysis 294 320 319 317 332 319 335 318 300 294
Net Migrations‡ 27 9 13 10 13 12 9 4 5 5
December 31, Prevalence
12,061 12,610 13,238 13,951 14,581 15,230 15,864 16,485 17,146 17,817
Notes * Reported values for 2011, 2012 and 2013 may be slightly lower as a result of under-reporting of incident dialysis cases in some
provinces and unreported incident dialysis cases and deaths from Quebec. For a summary of under-reporting of incident dialysis cases by province and year, see Section 1.2.
† Transplants minus patients returning to dialysis because of failed transplants. ‡ Includes patients who left the country, recovered function, were lost to follow-up or withdrew from treatment. Source Canadian Organ Replacement Register, 2014, Canadian Institute for Health Information.
46
Canadian Organ Replacement Register Annual Report: Treatment of End-Stage Organ Failure in Canada, 2004 to 2013
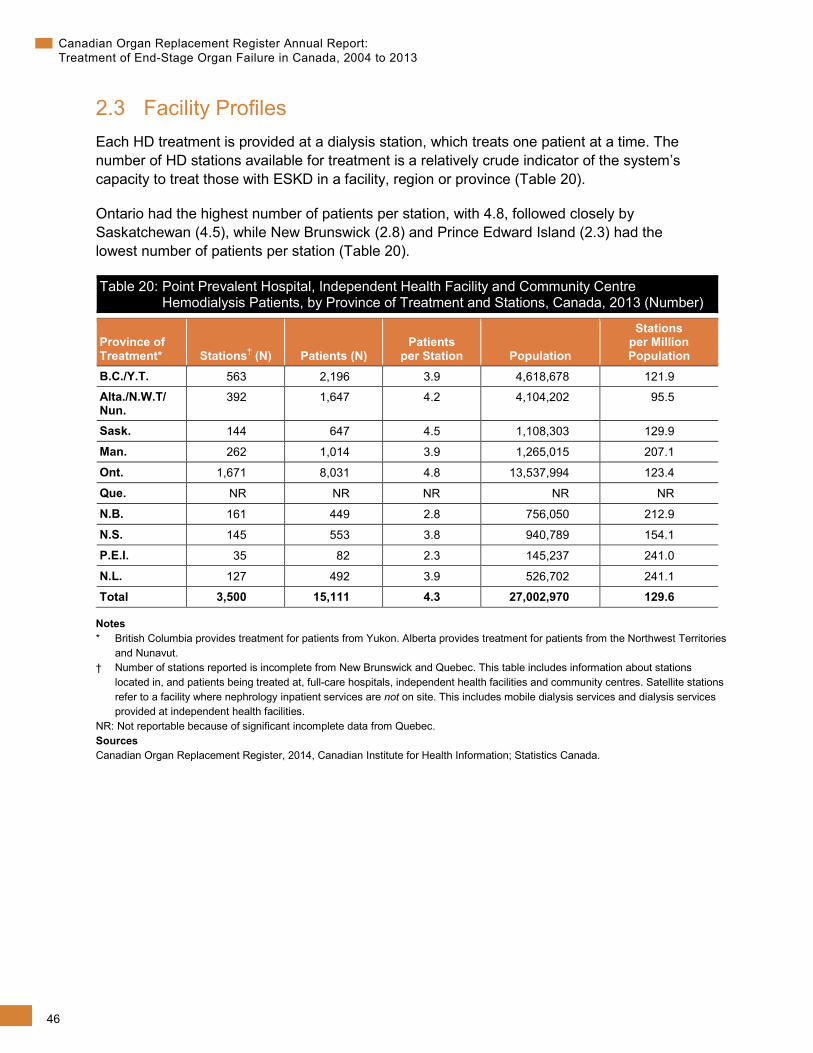
2.3 Facility Profiles Each HD treatment is provided at a dialysis station, which treats one patient at a time. The number of HD stations available for treatment is a relatively crude indicator of the system’s capacity to treat those with ESKD in a facility, region or province (Table 20).
Ontario had the highest number of patients per station, with 4.8, followed closely by Saskatchewan (4.5), while New Brunswick (2.8) and Prince Edward Island (2.3) had the lowest number of patients per station (Table 20).
Table 20: Point Prevalent Hospital, Independent Health Facility and Community Centre Hemodialysis Patients, by Province of Treatment and Stations, Canada, 2013 (Number)
Province of Treatment* Stations† (N) Patients (N)
Patients per Station Population
Stations per Million Population
B.C./Y.T. 563 2,196 3.9 4,618,678 121.9
Alta./N.W.T/ Nun.
392 1,647 4.2 4,104,202 95.5
Sask. 144 647 4.5 1,108,303 129.9
Man. 262 1,014 3.9 1,265,015 207.1
Ont. 1,671 8,031 4.8 13,537,994 123.4
Que. NR NR NR NR NR
N.B. 161 449 2.8 756,050 212.9
N.S. 145 553 3.8 940,789 154.1
P.E.I. 35 82 2.3 145,237 241.0
N.L. 127 492 3.9 526,702 241.1
Total 3,500 15,111 4.3 27,002,970 129.6
Notes * British Columbia provides treatment for patients from Yukon. Alberta provides treatment for patients from the Northwest Territories
and Nunavut. † Number of stations reported is incomplete from New Brunswick and Quebec. This table includes information about stations
located in, and patients being treated at, full-care hospitals, independent health facilities and community centres. Satellite stations refer to a facility where nephrology inpatient services are not on site. This includes mobile dialysis services and dialysis services provided at independent health facilities.
NR: Not reportable because of significant incomplete data from Quebec. Sources Canadian Organ Replacement Register, 2014, Canadian Institute for Health Information; Statistics Canada.
47
Chapter 2—Renal Replacement Therapy for End-Stage Kidney Disease
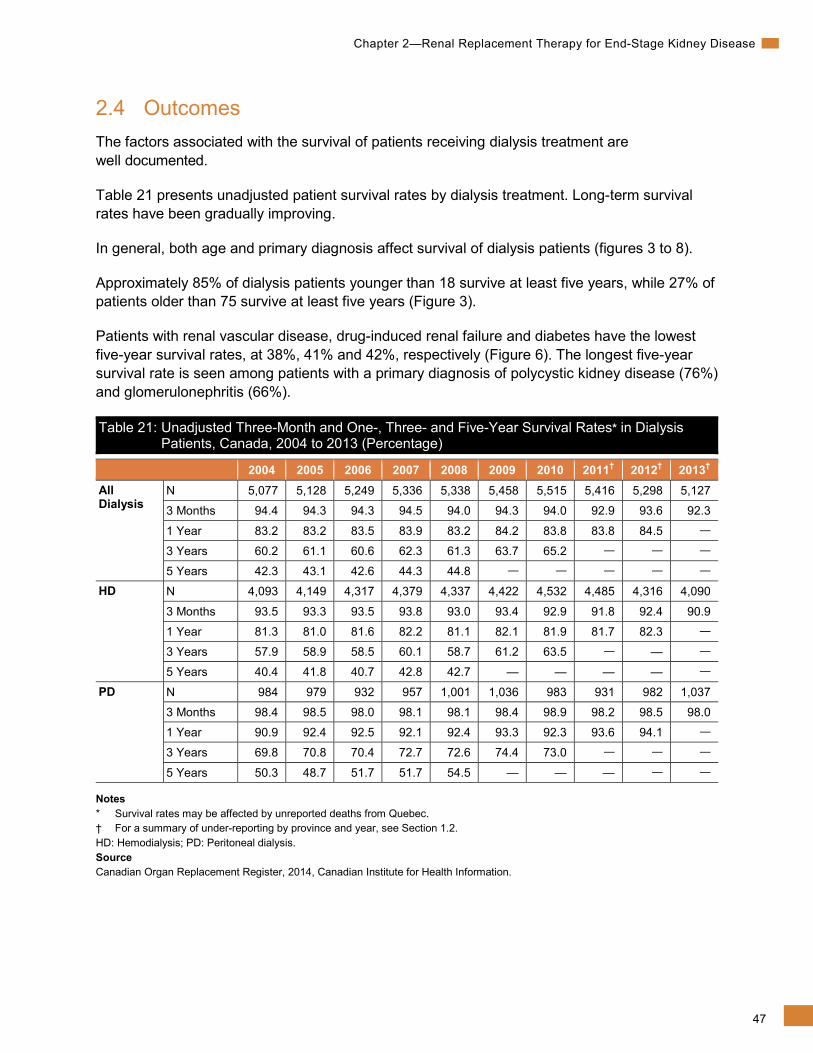
2.4 Outcomes The factors associated with the survival of patients receiving dialysis treatment are well documented.
Table 21 presents unadjusted patient survival rates by dialysis treatment. Long-term survival rates have been gradually improving.
In general, both age and primary diagnosis affect survival of dialysis patients (figures 3 to 8).
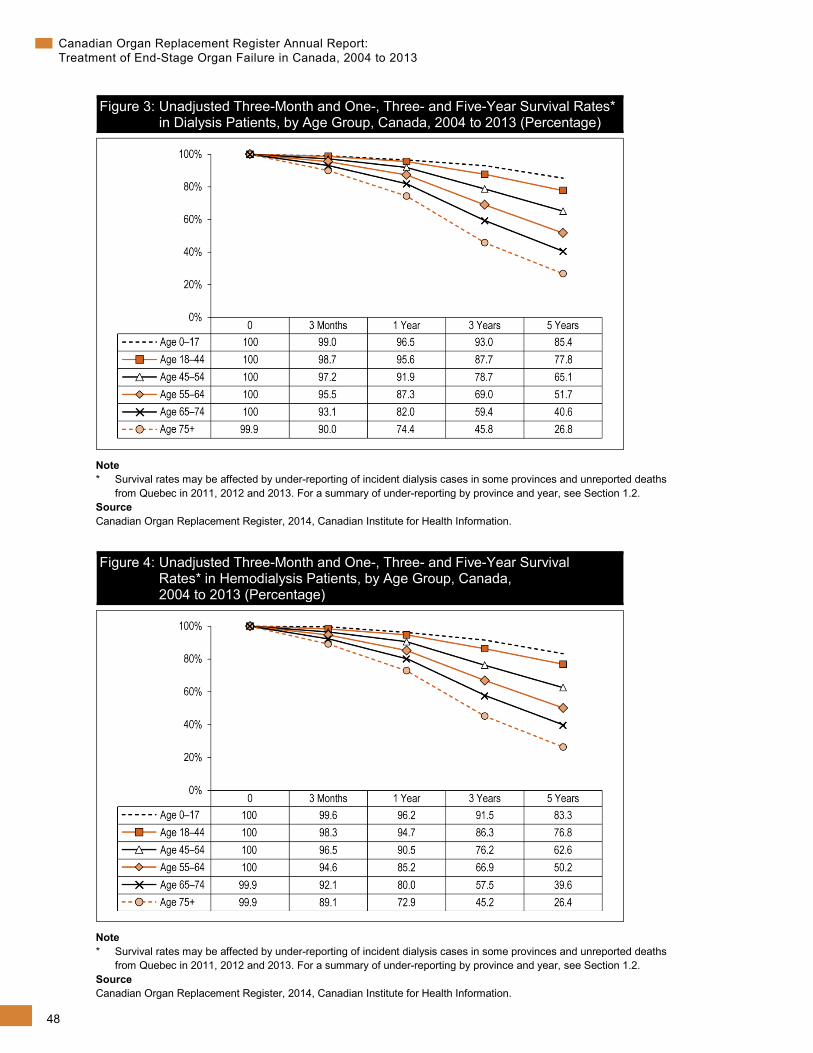
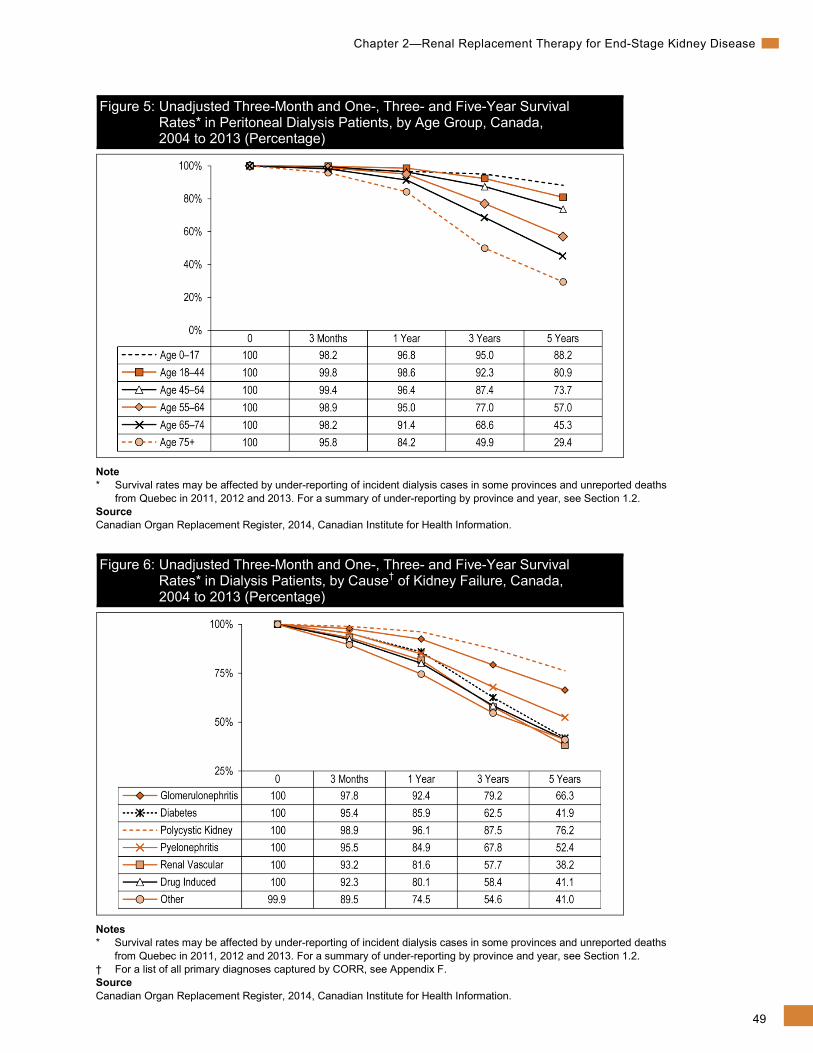
Approximately 85% of dialysis patients younger than 18 survive at least five years, while 27% of patients older than 75 survive at least five years (Figure 3).
Patients with renal vascular disease, drug-induced renal failure and diabetes have the lowest five-year survival rates, at 38%, 41% and 42%, respectively (Figure 6). The longest five-year survival rate is seen among patients with a primary diagnosis of polycystic kidney disease (76%) and glomerulonephritis (66%).
Table 21: Unadjusted Three-Month and One-, Three- and Five-Year Survival Rates* in Dialysis Patients, Canada, 2004 to 2013 (Percentage)
2004 2005 2006 2007 2008 2009 2010 2011† 2012† 2013† All Dialysis
N 5,077 5,128 5,249 5,336 5,338 5,458 5,515 5,416 5,298 5,127
3 Months 94.4 94.3 94.3 94.5 94.0 94.3 94.0 92.9 93.6 92.3
1 Year 83.2 83.2 83.5 83.9 83.2 84.2 83.8 83.8 84.5 —
3 Years 60.2 61.1 60.6 62.3 61.3 63.7 65.2 — — —
5 Years 42.3 43.1 42.6 44.3 44.8 — — — — —
HD N 4,093 4,149 4,317 4,379 4,337 4,422 4,532 4,485 4,316 4,090
3 Months 93.5 93.3 93.5 93.8 93.0 93.4 92.9 91.8 92.4 90.9
1 Year 81.3 81.0 81.6 82.2 81.1 82.1 81.9 81.7 82.3 —
3 Years 57.9 58.9 58.5 60.1 58.7 61.2 63.5 — — —
5 Years 40.4 41.8 40.7 42.8 42.7 — — — — —
PD N 984 979 932 957 1,001 1,036 983 931 982 1,037
3 Months 98.4 98.5 98.0 98.1 98.1 98.4 98.9 98.2 98.5 98.0
1 Year 90.9 92.4 92.5 92.1 92.4 93.3 92.3 93.6 94.1 —
3 Years 69.8 70.8 70.4 72.7 72.6 74.4 73.0 — — —
5 Years 50.3 48.7 51.7 51.7 54.5 — — — — —
Notes * Survival rates may be affected by unreported deaths from Quebec. † For a summary of under-reporting by province and year, see Section 1.2. HD: Hemodialysis; PD: Peritoneal dialysis. Source Canadian Organ Replacement Register, 2014, Canadian Institute for Health Information.
48
Canadian Organ Replacement Register Annual Report: Treatment of End-Stage Organ Failure in Canada, 2004 to 2013
Figure 3: Unadjusted Three-Month and One-, Three- and Five-Year Survival Rates* in Dialysis Patients, by Age Group, Canada, 2004 to 2013 (Percentage)
Note * Survival rates may be affected by under-reporting of incident dialysis cases in some provinces and unreported deaths
from Quebec in 2011, 2012 and 2013. For a summary of under-reporting by province and year, see Section 1.2. Source Canadian Organ Replacement Register, 2014, Canadian Institute for Health Information.
Figure 4: Unadjusted Three-Month and One-, Three- and Five-Year Survival Rates* in Hemodialysis Patients, by Age Group, Canada, 2004 to 2013 (Percentage)
Note * Survival rates may be affected by under-reporting of incident dialysis cases in some provinces and unreported deaths
from Quebec in 2011, 2012 and 2013. For a summary of under-reporting by province and year, see Section 1.2. Source Canadian Organ Replacement Register, 2014, Canadian Institute for Health Information.
49
Chapter 2—Renal Replacement Therapy for End-Stage Kidney Disease
Figure 5: Unadjusted Three-Month and One-, Three- and Five-Year Survival Rates* in Peritoneal Dialysis Patients, by Age Group, Canada, 2004 to 2013 (Percentage)
Note * Survival rates may be affected by under-reporting of incident dialysis cases in some provinces and unreported deaths
from Quebec in 2011, 2012 and 2013. For a summary of under-reporting by province and year, see Section 1.2. Source Canadian Organ Replacement Register, 2014, Canadian Institute for Health Information.
Figure 6: Unadjusted Three-Month and One-, Three- and Five-Year Survival Rates* in Dialysis Patients, by Cause† of Kidney Failure, Canada, 2004 to 2013 (Percentage)
Notes * Survival rates may be affected by under-reporting of incident dialysis cases in some provinces and unreported deaths
from Quebec in 2011, 2012 and 2013. For a summary of under-reporting by province and year, see Section 1.2. † For a list of all primary diagnoses captured by CORR, see Appendix F. Source Canadian Organ Replacement Register, 2014, Canadian Institute for Health Information.
50
Canadian Organ Replacement Register Annual Report: Treatment of End-Stage Organ Failure in Canada, 2004 to 2013
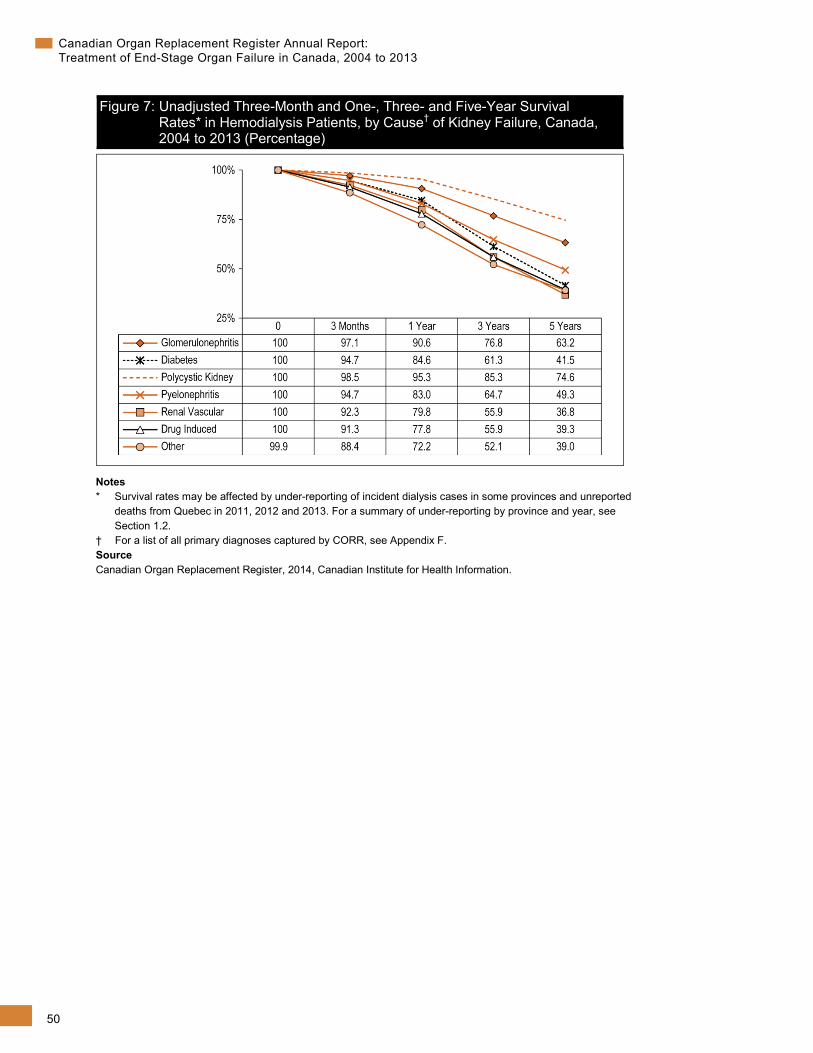
Figure 7: Unadjusted Three-Month and One-, Three- and Five-Year Survival Rates* in Hemodialysis Patients, by Cause† of Kidney Failure, Canada, 2004 to 2013 (Percentage)
Notes * Survival rates may be affected by under-reporting of incident dialysis cases in some provinces and unreported
deaths from Quebec in 2011, 2012 and 2013. For a summary of under-reporting by province and year, see Section 1.2.
† For a list of all primary diagnoses captured by CORR, see Appendix F. Source Canadian Organ Replacement Register, 2014, Canadian Institute for Health Information.
51
Chapter 2—Renal Replacement Therapy for End-Stage Kidney Disease
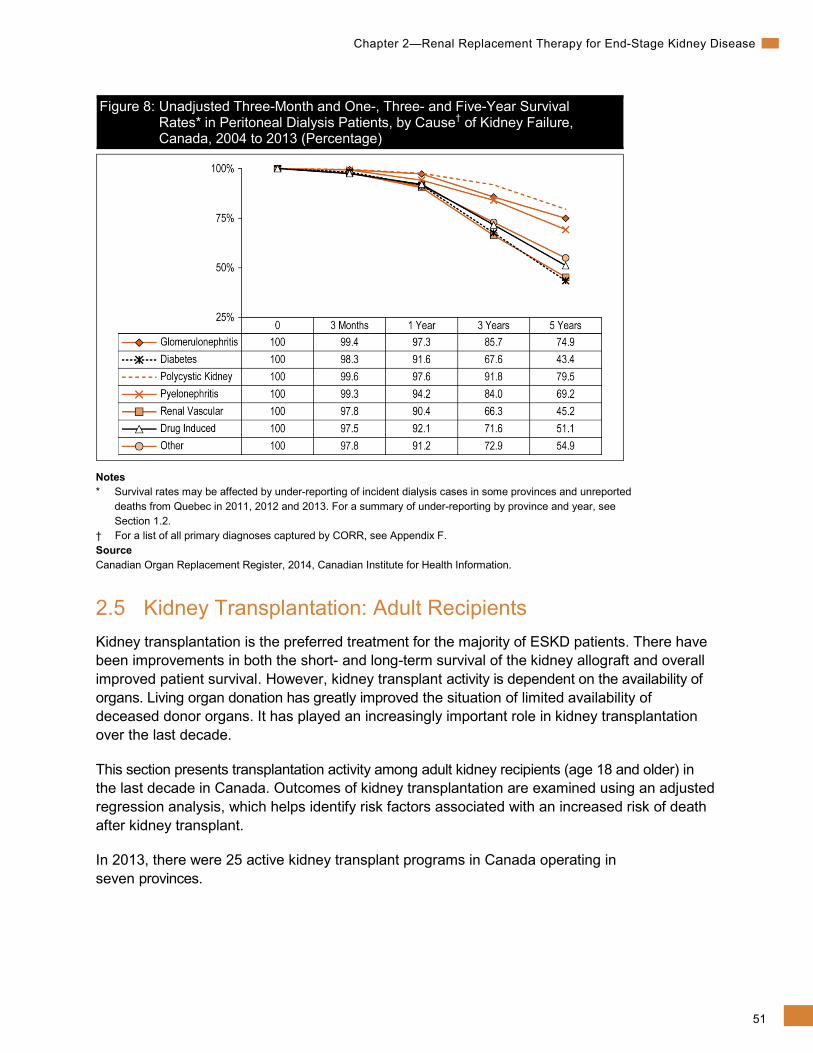
Figure 8: Unadjusted Three-Month and One-, Three- and Five-Year Survival Rates* in Peritoneal Dialysis Patients, by Cause† of Kidney Failure, Canada, 2004 to 2013 (Percentage)
Notes * Survival rates may be affected by under-reporting of incident dialysis cases in some provinces and unreported
deaths from Quebec in 2011, 2012 and 2013. For a summary of under-reporting by province and year, see Section 1.2.
† For a list of all primary diagnoses captured by CORR, see Appendix F. Source Canadian Organ Replacement Register, 2014, Canadian Institute for Health Information.
2.5 Kidney Transplantation: Adult Recipients Kidney transplantation is the preferred treatment for the majority of ESKD patients. There have been improvements in both the short- and long-term survival of the kidney allograft and overall improved patient survival. However, kidney transplant activity is dependent on the availability of organs. Living organ donation has greatly improved the situation of limited availability of deceased donor organs. It has played an increasingly important role in kidney transplantation over the last decade.
This section presents transplantation activity among adult kidney recipients (age 18 and older) in the last decade in Canada. Outcomes of kidney transplantation are examined using an adjusted regression analysis, which helps identify risk factors associated with an increased risk of death after kidney transplant.
In 2013, there were 25 active kidney transplant programs in Canada operating in seven provinces.
52
Canadian Organ Replacement Register Annual Report: Treatment of End-Stage Organ Failure in Canada, 2004 to 2013
At the end of 2013, there were 3,277 people (adult and pediatric) waiting for a deceased donor kidney transplant (Table 22).
Table 22: Kidney Transplant* Waiting List at December 31 and Waiting List Deaths, Canada, 2004 to 2013 (Number)
2004 2005 2006 2007 2008 2009 2010 2011 2012† 2013† Waiting List 2,872 2,759 2,962 2,963 2,892 2,902 3,362 3,406 3,428 3,277
Deaths on Waiting List 55 66 70 46 58 76 82 80 84 88
Notes * Includes both adult and pediatric patients. † Results are supplemented with data from Transplant Québec. For more details, see Section 1.2. Sources Canadian Organ Replacement Register, 2014, Canadian Institute for Health Information. Transplant Québec. Statistiques officielles 2013. http://www.transplantquebec.ca/sites/default/files/statistiques_2013_3.pdf. February 2014. Accessed January 8, 2015.
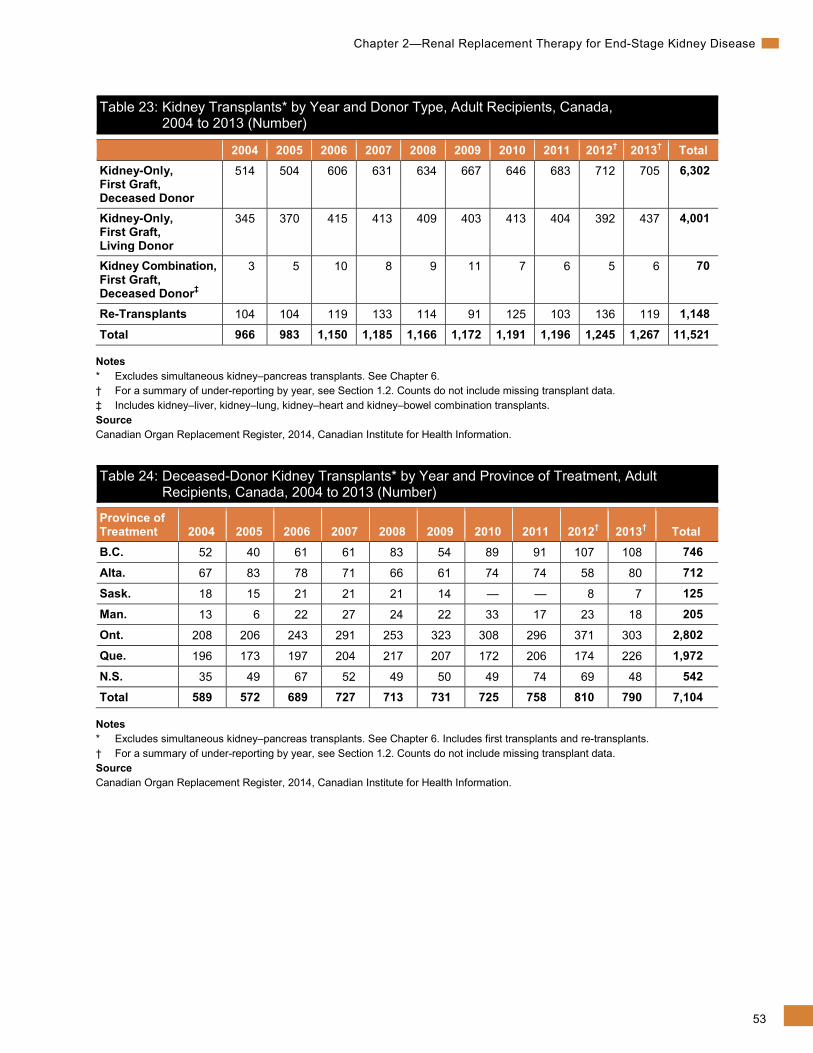
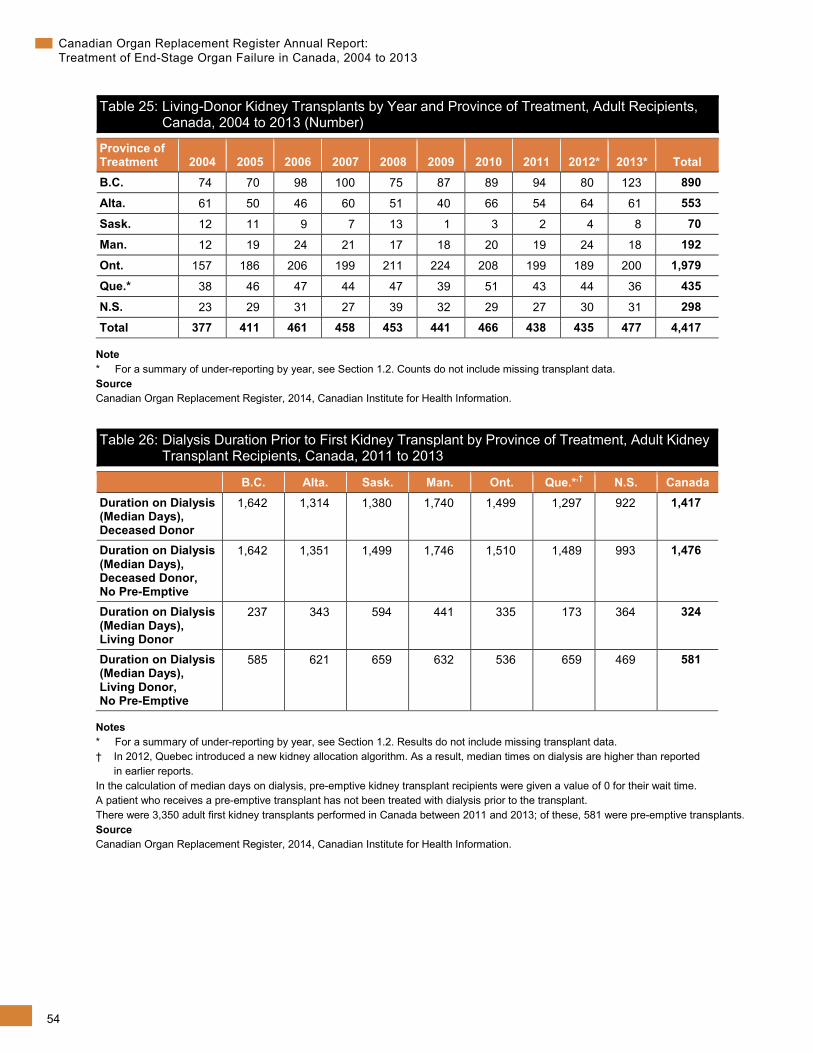
During the 10-year period, there were 11,521 kidney transplant procedures registered in CORR (Table 23). Of these, 1,148 (10%) were re-transplants. Of the 10,303 kidney-only first transplants, 61% utilized deceased-donor kidneys. Ontario and Quebec surgeons performed the most deceased-donor kidney transplants over the decade (2,802 and 1,972, respectively) (Table 24). Ontario saw the highest number of living-donor kidney transplants (1,979) over the decade (Table 25), followed by British Columbia (890). Since 2006, the number of living-donor kidney transplants has been stable, fluctuating between 435 and 477 transplants each year.
For the most recent three-year period, 2011 to 2013, the median wait time for a deceased-donor kidney transplant (excluding pre-emptive transplants) was 4.0 years (Table 26). The longest median wait times were in Manitoba (4.8 years) and British Columbia (4.5 years). The shortest median wait time of 2.7 years was observed in Nova Scotia.
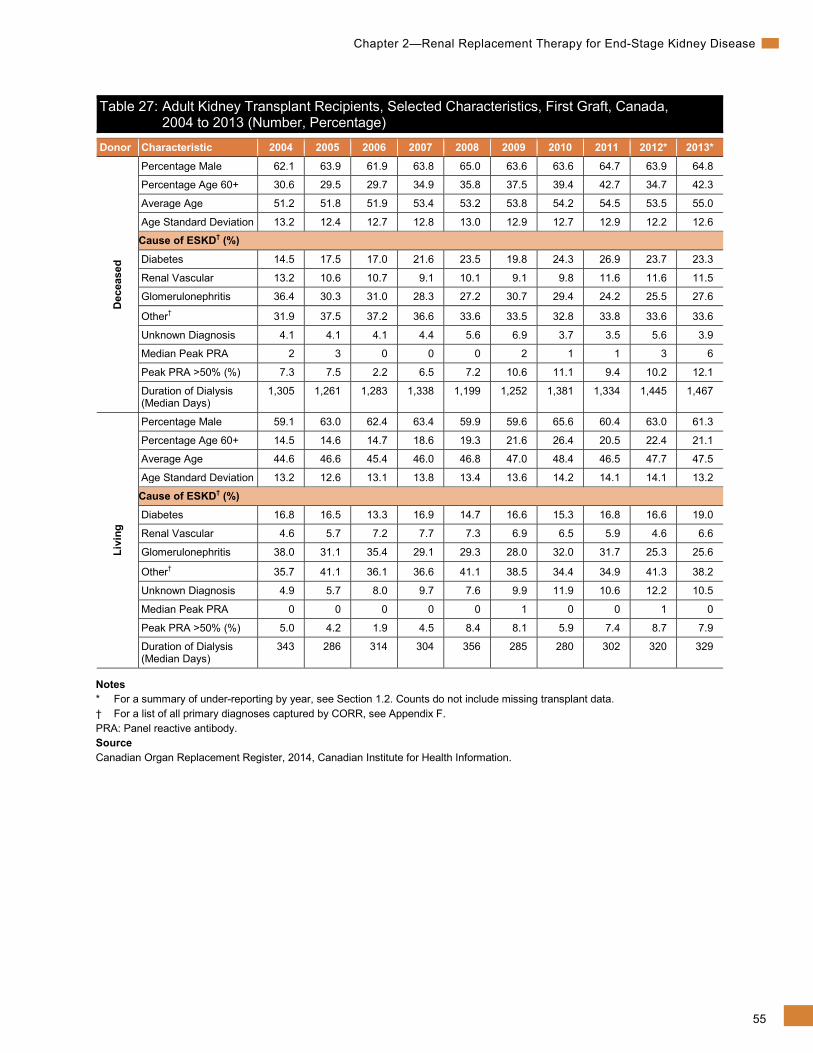
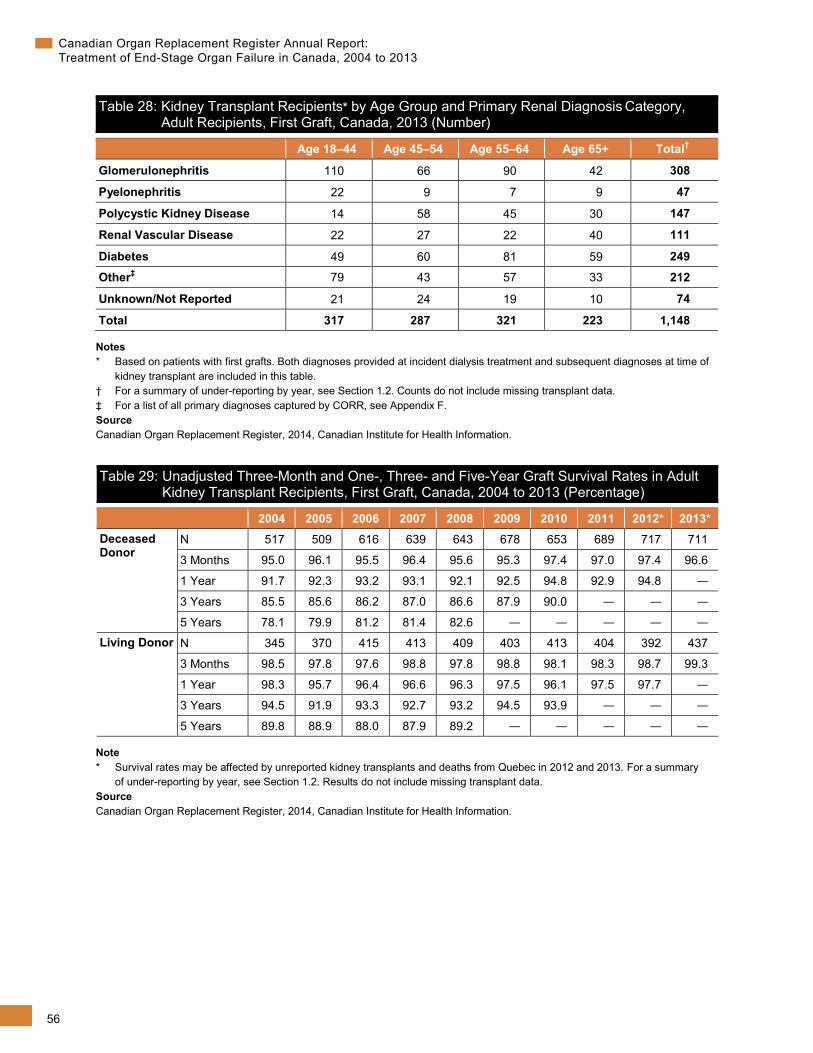
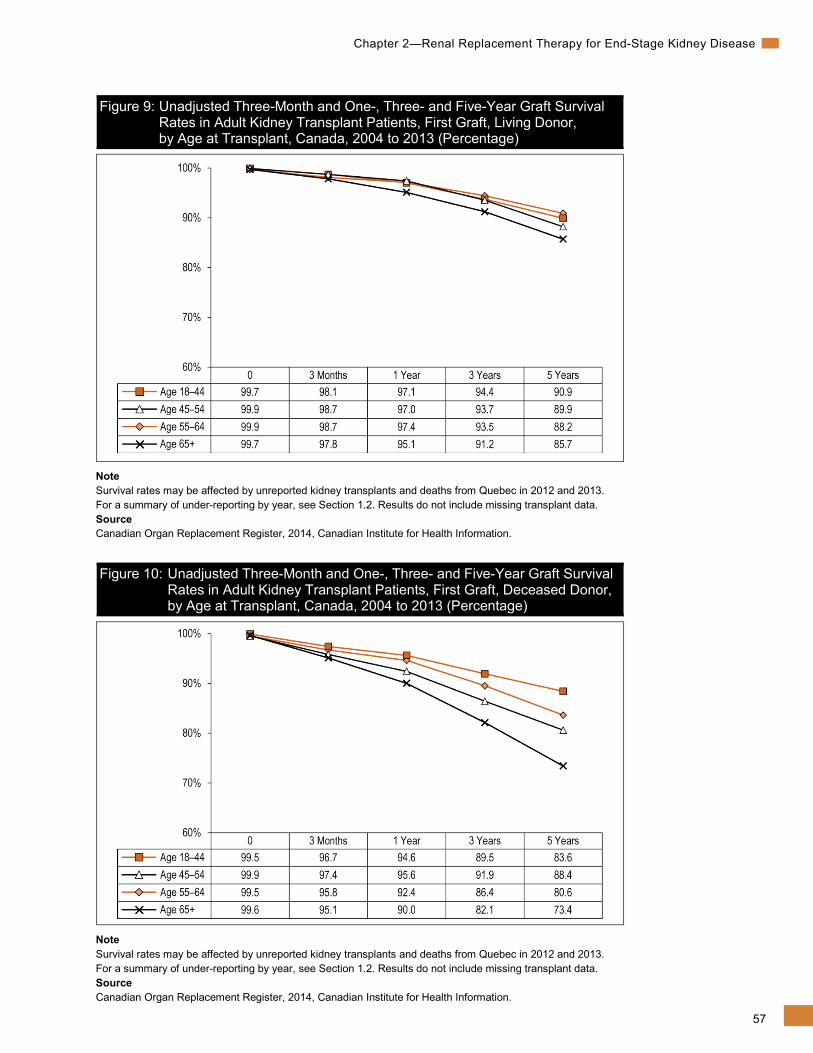
Since 2004, the proportion of recipients older than age 60 receiving a kidney transplant from a deceased donor has increased from 31% to 42%; a similar trend was observed for living-donor transplants (14% to 21%) (Table 27). The average age of recipients of deceased donor kidneys increased from 51 to 55 (Table 27). Glomerulonephritis continued to be the predominant diagnosis among adult kidney transplant recipients (308) (Table 28).
Figures 9 and 10 present graft survival rates by age for living-donor kidney recipients and deceased-donor kidney recipients, respectively.
53
Chapter 2—Renal Replacement Therapy for End-Stage Kidney Disease
Table 23: Kidney Transplants* by Year and Donor Type, Adult Recipients, Canada, 2004 to 2013 (Number)
2004 2005 2006 2007 2008 2009 2010 2011 2012† 2013† Total Kidney-Only, First Graft, Deceased Donor
514 504 606 631 634 667 646 683 712 705 6,302
Kidney-Only, First Graft, Living Donor
345 370 415 413 409 403 413 404 392 437 4,001
Kidney Combination, First Graft, Deceased Donor‡
3 5 10 8 9 11 7 6 5 6 70
Re-Transplants 104 104 119 133 114 91 125 103 136 119 1,148 Total 966 983 1,150 1,185 1,166 1,172 1,191 1,196 1,245 1,267 11,521
Notes * Excludes simultaneous kidney–pancreas transplants. See Chapter 6. † For a summary of under-reporting by year, see Section 1.2. Counts do not include missing transplant data. ‡ Includes kidney–liver, kidney–lung, kidney–heart and kidney–bowel combination transplants. Source Canadian Organ Replacement Register, 2014, Canadian Institute for Health Information.
Table 24: Deceased-Donor Kidney Transplants* by Year and Province of Treatment, Adult Recipients, Canada, 2004 to 2013 (Number)
Province of Treatment 2004 2005 2006 2007 2008 2009 2010 2011 2012† 2013† Total B.C. 52 40 61 61 83 54 89 91 107 108 746 Alta. 67 83 78 71 66 61 74 74 58 80 712 Sask. 18 15 21 21 21 14 — — 8 7 125 Man. 13 6 22 27 24 22 33 17 23 18 205 Ont. 208 206 243 291 253 323 308 296 371 303 2,802 Que.† 196 173 197 204 217 207 172 206 174 226 1,972 N.S. 35 49 67 52 49 50 49 74 69 48 542 Total 589 572 689 727 713 731 725 758 810 790 7,104
Notes * Excludes simultaneous kidney–pancreas transplants. See Chapter 6. Includes first transplants and re-transplants. † For a summary of under-reporting by year, see Section 1.2. Counts do not include missing transplant data. Source Canadian Organ Replacement Register, 2014, Canadian Institute for Health Information.
54
Canadian Organ Replacement Register Annual Report: Treatment of End-Stage Organ Failure in Canada, 2004 to 2013
Table 25: Living-Donor Kidney Transplants by Year and Province of Treatment, Adult Recipients, Canada, 2004 to 2013 (Number)
Province of Treatment 2004 2005 2006 2007 2008 2009 2010 2011 2012* 2013* Total B.C. 74 70 98 100 75 87 89 94 80 123 890 Alta. 61 50 46 60 51 40 66 54 64 61 553 Sask. 12 11 9 7 13 1 3 2 4 8 70 Man. 12 19 24 21 17 18 20 19 24 18 192 Ont. 157 186 206 199 211 224 208 199 189 200 1,979 Que.* 38 46 47 44 47 39 51 43 44 36 435 N.S. 23 29 31 27 39 32 29 27 30 31 298 Total 377 411 461 458 453 441 466 438 435 477 4,417
Note * For a summary of under-reporting by year, see Section 1.2. Counts do not include missing transplant data. Source Canadian Organ Replacement Register, 2014, Canadian Institute for Health Information.
Table 26: Dialysis Duration Prior to First Kidney Transplant by Province of Treatment, Adult Kidney Transplant Recipients, Canada, 2011 to 2013
B.C. Alta. Sask. Man. Ont. Que.*,† N.S. Canada Duration on Dialysis (Median Days), Deceased Donor
1,642 1,314 1,380 1,740 1,499 1,297 922 1,417
Duration on Dialysis (Median Days), Deceased Donor, No Pre-Emptive
1,642 1,351 1,499 1,746 1,510 1,489 993 1,476
Duration on Dialysis (Median Days), Living Donor
237 343 594 441 335 173 364 324
Duration on Dialysis (Median Days), Living Donor, No Pre-Emptive
585 621 659 632 536 659 469 581
Notes * For a summary of under-reporting by year, see Section 1.2. Results do not include missing transplant data. † In 2012, Quebec introduced a new kidney allocation algorithm. As a result, median times on dialysis are higher than reported
in earlier reports. In the calculation of median days on dialysis, pre-emptive kidney transplant recipients were given a value of 0 for their wait time. A patient who receives a pre-emptive transplant has not been treated with dialysis prior to the transplant. There were 3,350 adult first kidney transplants performed in Canada between 2011 and 2013; of these, 581 were pre-emptive transplants. Source Canadian Organ Replacement Register, 2014, Canadian Institute for Health Information.
55
Chapter 2—Renal Replacement Therapy for End-Stage Kidney Disease
Table 27: Adult Kidney Transplant Recipients, Selected Characteristics, First Graft, Canada, 2004 to 2013 (Number, Percentage)
Donor Characteristic 2004 2005 2006 2007 2008 2009 2010 2011 2012* 2013*
Dec
ease
d
Percentage Male 62.1 63.9 61.9 63.8 65.0 63.6 63.6 64.7 63.9 64.8
Percentage Age 60+ 30.6 29.5 29.7 34.9 35.8 37.5 39.4 42.7 34.7 42.3
Average Age 51.2 51.8 51.9 53.4 53.2 53.8 54.2 54.5 53.5 55.0
Age Standard Deviation 13.2 12.4 12.7 12.8 13.0 12.9 12.7 12.9 12.2 12.6
Cause of ESKD† (%)
Diabetes 14.5 17.5 17.0 21.6 23.5 19.8 24.3 26.9 23.7 23.3
Renal Vascular 13.2 10.6 10.7 9.1 10.1 9.1 9.8 11.6 11.6 11.5
Glomerulonephritis 36.4 30.3 31.0 28.3 27.2 30.7 29.4 24.2 25.5 27.6
Other† 31.9 37.5 37.2 36.6 33.6 33.5 32.8 33.8 33.6 33.6
Unknown Diagnosis 4.1 4.1 4.1 4.4 5.6 6.9 3.7 3.5 5.6 3.9
Median Peak PRA 2 3 0 0 0 2 1 1 3 6
Peak PRA >50% (%) 7.3 7.5 2.2 6.5 7.2 10.6 11.1 9.4 10.2 12.1
Duration of Dialysis (Median Days)
1,305 1,261 1,283 1,338 1,199 1,252 1,381 1,334 1,445 1,467
Livi
ng
Percentage Male 59.1 63.0 62.4 63.4 59.9 59.6 65.6 60.4 63.0 61.3
Percentage Age 60+ 14.5 14.6 14.7 18.6 19.3 21.6 26.4 20.5 22.4 21.1
Average Age 44.6 46.6 45.4 46.0 46.8 47.0 48.4 46.5 47.7 47.5
Age Standard Deviation 13.2 12.6 13.1 13.8 13.4 13.6 14.2 14.1 14.1 13.2
Cause of ESKD† (%)
Diabetes 16.8 16.5 13.3 16.9 14.7 16.6 15.3 16.8 16.6 19.0
Renal Vascular 4.6 5.7 7.2 7.7 7.3 6.9 6.5 5.9 4.6 6.6
Glomerulonephritis 38.0 31.1 35.4 29.1 29.3 28.0 32.0 31.7 25.3 25.6
Other† 35.7 41.1 36.1 36.6 41.1 38.5 34.4 34.9 41.3 38.2
Unknown Diagnosis 4.9 5.7 8.0 9.7 7.6 9.9 11.9 10.6 12.2 10.5
Median Peak PRA 0 0 0 0 0 1 0 0 1 0
Peak PRA >50% (%) 5.0 4.2 1.9 4.5 8.4 8.1 5.9 7.4 8.7 7.9
Duration of Dialysis (Median Days)
343 286 314 304 356 285 280 302 320 329
Notes * For a summary of under-reporting by year, see Section 1.2. Counts do not include missing transplant data. † For a list of all primary diagnoses captured by CORR, see Appendix F. PRA: Panel reactive antibody. Source Canadian Organ Replacement Register, 2014, Canadian Institute for Health Information.
56
Canadian Organ Replacement Register Annual Report: Treatment of End-Stage Organ Failure in Canada, 2004 to 2013
Table 28: Kidney Transplant Recipients* by Age Group and Primary Renal Diagnosis Category, Adult Recipients, First Graft, Canada, 2013 (Number)
Age 18–44 Age 45–54 Age 55–64 Age 65+ Total†
Glomerulonephritis 110 66 90 42 308
Pyelonephritis 22 9 7 9 47
Polycystic Kidney Disease 14 58 45 30 147
Renal Vascular Disease 22 27 22 40 111
Diabetes 49 60 81 59 249
Other‡ 79 43 57 33 212
Unknown/Not Reported 21 24 19 10 74
Total 317 287 321 223 1,148
Notes * Based on patients with first grafts. Both diagnoses provided at incident dialysis treatment and subsequent diagnoses at time of
kidney transplant are included in this table. † For a summary of under-reporting by year, see Section 1.2. Counts do not include missing transplant data. ‡ For a list of all primary diagnoses captured by CORR, see Appendix F. Source Canadian Organ Replacement Register, 2014, Canadian Institute for Health Information.
Table 29: Unadjusted Three-Month and One-, Three- and Five-Year Graft Survival Rates in Adult Kidney Transplant Recipients, First Graft, Canada, 2004 to 2013 (Percentage)
2004 2005 2006 2007 2008 2009 2010 2011 2012* 2013* Deceased Donor
N 517 509 616 639 643 678 653 689 717 711
3 Months 95.0 96.1 95.5 96.4 95.6 95.3 97.4 97.0 97.4 96.6
1 Year 91.7 92.3 93.2 93.1 92.1 92.5 94.8 92.9 94.8 —
3 Years 85.5 85.6 86.2 87.0 86.6 87.9 90.0 — — —
5 Years 78.1 79.9 81.2 81.4 82.6 — — — — —
Living Donor N 345 370 415 413 409 403 413 404 392 437
3 Months 98.5 97.8 97.6 98.8 97.8 98.8 98.1 98.3 98.7 99.3
1 Year 98.3 95.7 96.4 96.6 96.3 97.5 96.1 97.5 97.7 —
3 Years 94.5 91.9 93.3 92.7 93.2 94.5 93.9 — — —
5 Years 89.8 88.9 88.0 87.9 89.2 — — — — —
Note * Survival rates may be affected by unreported kidney transplants and deaths from Quebec in 2012 and 2013. For a summary
of under-reporting by year, see Section 1.2. Results do not include missing transplant data. Source Canadian Organ Replacement Register, 2014, Canadian Institute for Health Information.
57
Chapter 2—Renal Replacement Therapy for End-Stage Kidney Disease
Figure 9: Unadjusted Three-Month and One-, Three- and Five-Year Graft Survival Rates in Adult Kidney Transplant Patients, First Graft, Living Donor, by Age at Transplant, Canada, 2004 to 2013 (Percentage)
Note Survival rates may be affected by unreported kidney transplants and deaths from Quebec in 2012 and 2013. For a summary of under-reporting by year, see Section 1.2. Results do not include missing transplant data. Source Canadian Organ Replacement Register, 2014, Canadian Institute for Health Information.
Figure 10: Unadjusted Three-Month and One-, Three- and Five-Year Graft Survival Rates in Adult Kidney Transplant Patients, First Graft, Deceased Donor, by Age at Transplant, Canada, 2004 to 2013 (Percentage)
Note Survival rates may be affected by unreported kidney transplants and deaths from Quebec in 2012 and 2013. For a summary of under-reporting by year, see Section 1.2. Results do not include missing transplant data. Source Canadian Organ Replacement Register, 2014, Canadian Institute for Health Information.
58
Canadian Organ Replacement Register Annual Report: Treatment of End-Stage Organ Failure in Canada, 2004 to 2013
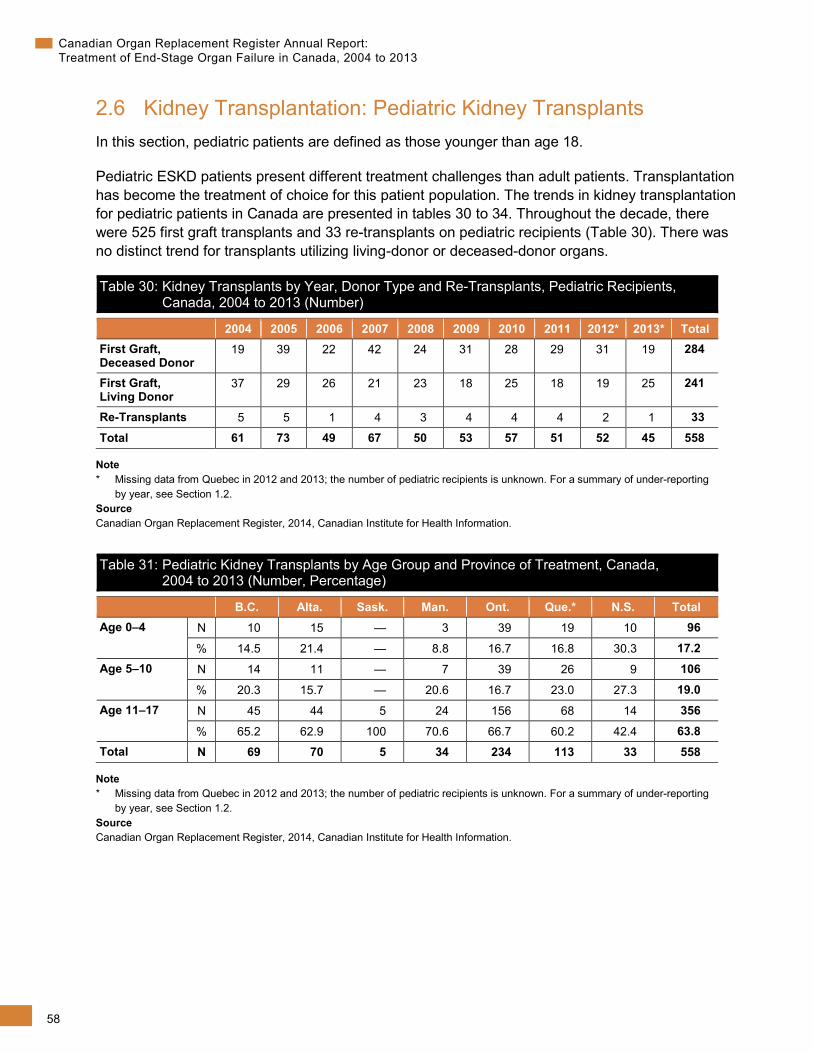
2.6 Kidney Transplantation: Pediatric Kidney Transplants In this section, pediatric patients are defined as those younger than age 18.
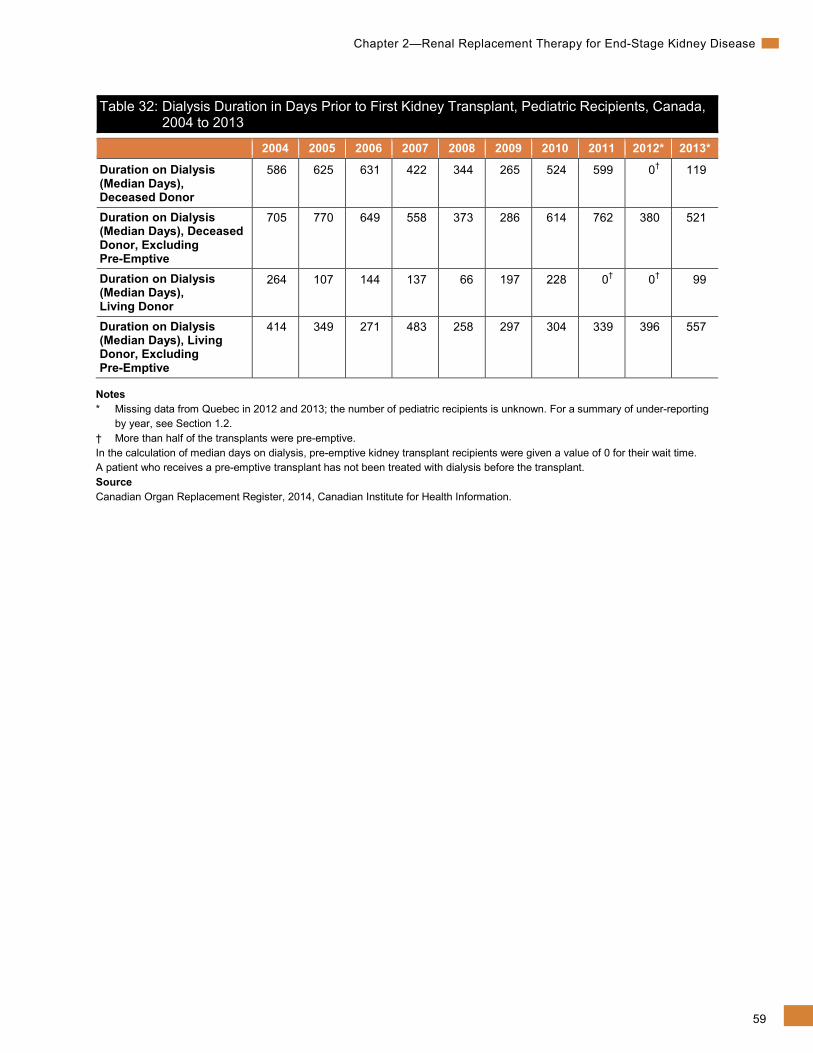
Pediatric ESKD patients present different treatment challenges than adult patients. Transplantation has become the treatment of choice for this patient population. The trends in kidney transplantation for pediatric patients in Canada are presented in tables 30 to 34. Throughout the decade, there were 525 first graft transplants and 33 re-transplants on pediatric recipients (Table 30). There was no distinct trend for transplants utilizing living-donor or deceased-donor organs.
Table 30: Kidney Transplants by Year, Donor Type and Re-Transplants, Pediatric Recipients, Canada, 2004 to 2013 (Number)
2004 2005 2006 2007 2008 2009 2010 2011 2012* 2013* Total First Graft, Deceased Donor
19 39 22 42 24 31 28 29 31 19 284
First Graft, Living Donor
37 29 26 21 23 18 25 18 19 25 241
Re-Transplants 5 5 1 4 3 4 4 4 2 1 33 Total 61 73 49 67 50 53 57 51 52 45 558
Note * Missing data from Quebec in 2012 and 2013; the number of pediatric recipients is unknown. For a summary of under-reporting
by year, see Section 1.2. Source Canadian Organ Replacement Register, 2014, Canadian Institute for Health Information.
Table 31: Pediatric Kidney Transplants by Age Group and Province of Treatment, Canada, 2004 to 2013 (Number, Percentage)
B.C. Alta. Sask. Man. Ont. Que.* N.S. Total Age 0–4 N 10 15 — 3 39 19 10 96
% 14.5 21.4 — 8.8 16.7 16.8 30.3 17.2 Age 5–10 N 14 11 — 7 39 26 9 106
% 20.3 15.7 — 20.6 16.7 23.0 27.3 19.0 Age 11–17 N 45 44 5 24 156 68 14 356
% 65.2 62.9 100 70.6 66.7 60.2 42.4 63.8 Total N 69 70 5 34 234 113 33 558
Note * Missing data from Quebec in 2012 and 2013; the number of pediatric recipients is unknown. For a summary of under-reporting
by year, see Section 1.2. Source Canadian Organ Replacement Register, 2014, Canadian Institute for Health Information.
59
Chapter 2—Renal Replacement Therapy for End-Stage Kidney Disease
Table 32: Dialysis Duration in Days Prior to First Kidney Transplant, Pediatric Recipients, Canada, 2004 to 2013
2004 2005 2006 2007 2008 2009 2010 2011 2012* 2013*
Duration on Dialysis (Median Days), Deceased Donor
586 625 631 422 344 265 524 599 0† 119
Duration on Dialysis (Median Days), Deceased Donor, Excluding Pre-Emptive
705 770 649 558 373 286 614 762 380 521
Duration on Dialysis (Median Days), Living Donor
264 107 144 137 66 197 228 0† 0† 99
Duration on Dialysis (Median Days), Living Donor, Excluding Pre-Emptive
414 349 271 483 258 297 304 339 396 557
Notes * Missing data from Quebec in 2012 and 2013; the number of pediatric recipients is unknown. For a summary of under-reporting
by year, see Section 1.2. † More than half of the transplants were pre-emptive. In the calculation of median days on dialysis, pre-emptive kidney transplant recipients were given a value of 0 for their wait time. A patient who receives a pre-emptive transplant has not been treated with dialysis before the transplant. Source Canadian Organ Replacement Register, 2014, Canadian Institute for Health Information.
60
Canadian Organ Replacement Register Annual Report: Treatment of End-Stage Organ Failure in Canada, 2004 to 2013
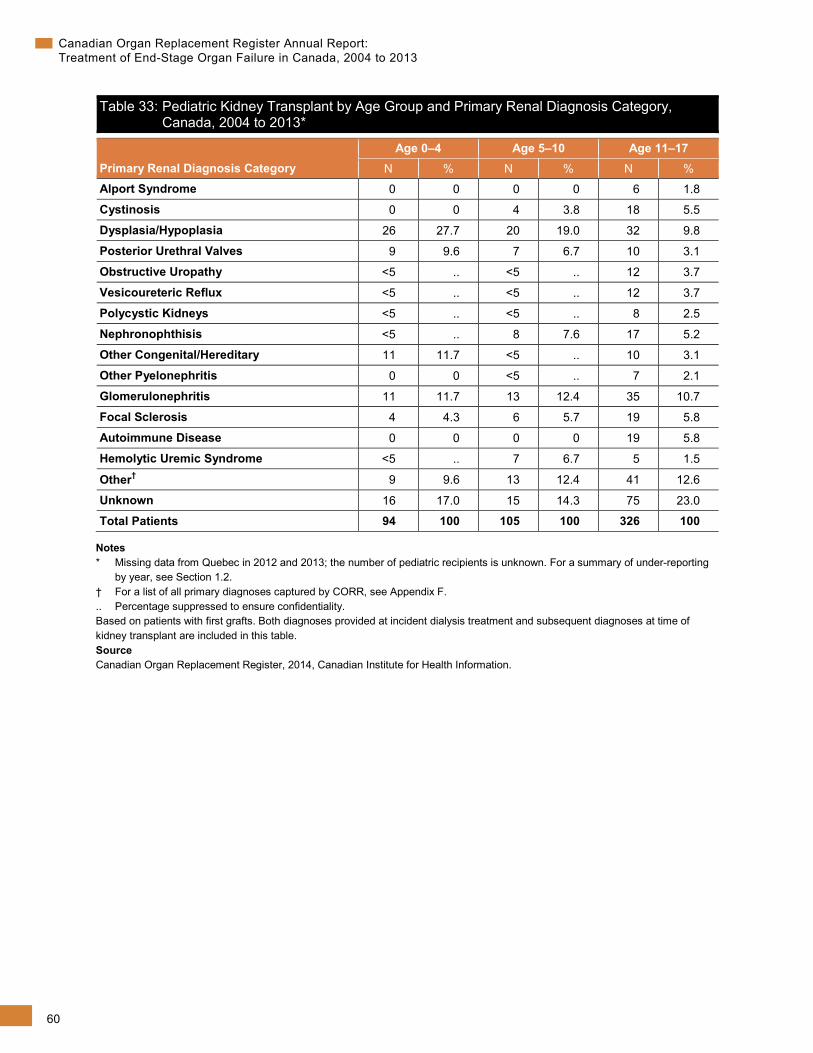
Table 33: Pediatric Kidney Transplant by Age Group and Primary Renal Diagnosis Category, Canada, 2004 to 2013*
Primary Renal Diagnosis Category Age 0–4 Age 5–10 Age 11–17
N % N % N %
Alport Syndrome 0 0 0 0 6 1.8
Cystinosis 0 0 4 3.8 18 5.5
Dysplasia/Hypoplasia 26 27.7 20 19.0 32 9.8
Posterior Urethral Valves 9 9.6 7 6.7 10 3.1
Obstructive Uropathy <5 .. <5 .. 12 3.7
Vesicoureteric Reflux <5 .. <5 .. 12 3.7
Polycystic Kidneys <5 .. <5 .. 8 2.5
Nephronophthisis <5 .. 8 7.6 17 5.2
Other Congenital/Hereditary 11 11.7 <5 .. 10 3.1
Other Pyelonephritis 0 0 <5 .. 7 2.1
Glomerulonephritis 11 11.7 13 12.4 35 10.7
Focal Sclerosis 4 4.3 6 5.7 19 5.8
Autoimmune Disease 0 0 0 0 19 5.8
Hemolytic Uremic Syndrome <5 .. 7 6.7 5 1.5
Other† 9 9.6 13 12.4 41 12.6
Unknown 16 17.0 15 14.3 75 23.0
Total Patients 94 100 105 100 326 100
Notes * Missing data from Quebec in 2012 and 2013; the number of pediatric recipients is unknown. For a summary of under-reporting
by year, see Section 1.2. † For a list of all primary diagnoses captured by CORR, see Appendix F. .. Percentage suppressed to ensure confidentiality. Based on patients with first grafts. Both diagnoses provided at incident dialysis treatment and subsequent diagnoses at time of kidney transplant are included in this table. Source Canadian Organ Replacement Register, 2014, Canadian Institute for Health Information.
61
Chapter 2—Renal Replacement Therapy for End-Stage Kidney Disease
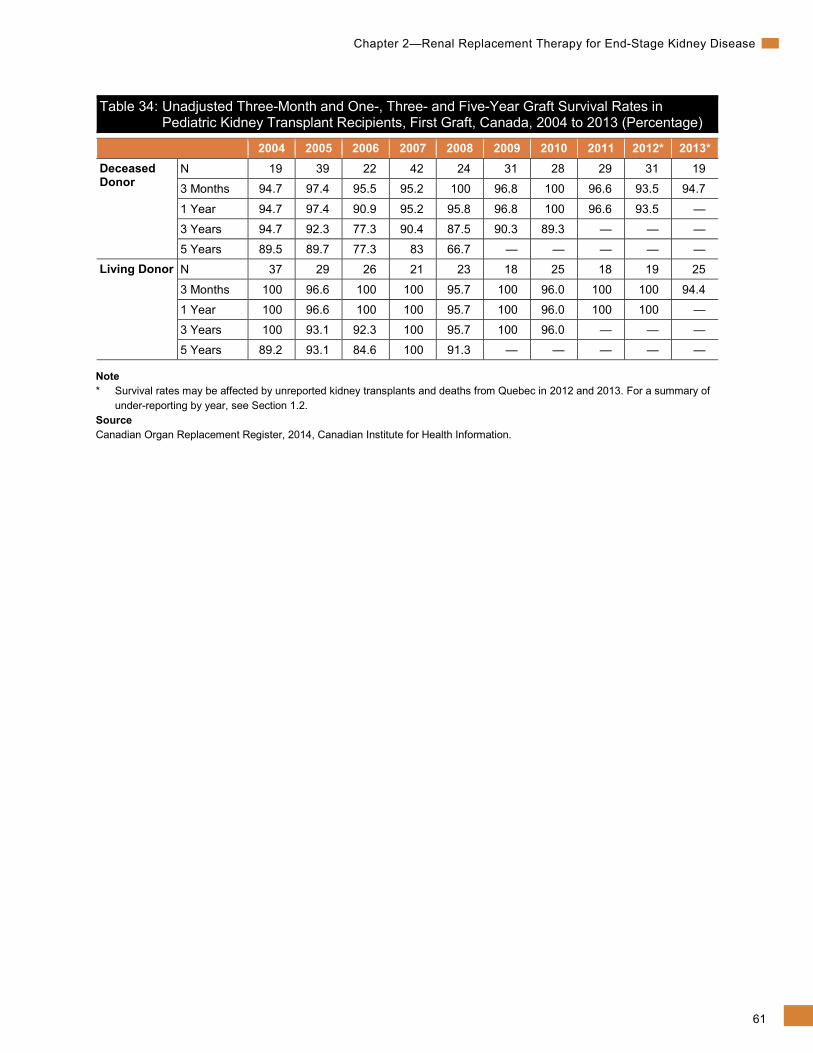
Table 34: Unadjusted Three-Month and One-, Three- and Five-Year Graft Survival Rates in Pediatric Kidney Transplant Recipients, First Graft, Canada, 2004 to 2013 (Percentage)
2004 2005 2006 2007 2008 2009 2010 2011 2012* 2013* Deceased Donor
N 19 39 22 42 24 31 28 29 31 19
3 Months 94.7 97.4 95.5 95.2 100 96.8 100 96.6 93.5 94.7
1 Year 94.7 97.4 90.9 95.2 95.8 96.8 100 96.6 93.5 —
3 Years 94.7 92.3 77.3 90.4 87.5 90.3 89.3 — — —
5 Years 89.5 89.7 77.3 83 66.7 — — — — — Living Donor N 37 29 26 21 23 18 25 18 19 25
3 Months 100 96.6 100 100 95.7 100 96.0 100 100 94.4
1 Year 100 96.6 100 100 95.7 100 96.0 100 100 —
3 Years 100 93.1 92.3 100 95.7 100 96.0 — — —
5 Years 89.2 93.1 84.6 100 91.3 — — — — —
Note * Survival rates may be affected by unreported kidney transplants and deaths from Quebec in 2012 and 2013. For a summary of
under-reporting by year, see Section 1.2. Source Canadian Organ Replacement Register, 2014, Canadian Institute for Health Information.
