chapter 3 backfill experimental study
TRANSCRIPT

Chapter 3: Backfill experimental study
33
CHAPTER 3
BACKFILL EXPERIMENTAL STUDY 3.1 WHY BENTONITE/GRANULAR MATERIAL MIXTURES? Bentonite/sand mixtures have been commonly used in the construction of landfills and liners for municipal, mining and industry waste storage for the last 40 years (Alther, 1987). Sands are usually mixed with bentonites (mainly sodium bentonites) to decrease its hydraulic conductivity. Bentonite clay was chosen because of its ability to adsorb water and then to swell closing voids, cracks, gaps or fissures and also because of its low hydraulic conductivity and effective diffusion. In the last 30 years, bentonites have gained importance in nuclear waste isolation projects as well. Most of nuclear waste isolation concepts use natural bentonites as sealing material. Some of these concepts use bentonite-granular material mixtures due to economical reasons (to decrease the total amount of bentonite used) and environmental reasons (reuse of granular material coming from the excavation of repositories and to alter natural geochemical properties as little as possible). Different granular materials have been or are being considered among different nuclear waste managing agencies: sand (Gray et al. 1984; Komine & Ogata, 1999; Sivapullaiah et al. 1999; Miehe et al. 2000; Romero et al. 2002), crushed granite (Radhakrishna & Chan, 1982; Holopainen, 1985; Allen & Wood, 1988; Radhakrishna et al. 1989; Mingarro et al. 1991; Gunnarsson et al. 2001; Börgesson et al. 2002; Engelhardt, 2002) or crushed salt rock (Pfeifle & Brodsky, 1991). These Agencies are: PNC (Japan), SKB (Sweden), Posiva Oy (Finland), AECL (Canada) or DOE (United States) (after Daeman & Ran, 1996). The main thermo-hydro-mechanical-chemical properties of these mixtures are being intensively investigated in a long perspective to assure the safety of an engineered barrier for nuclear waste. Within the Backfill and Plug Test Project (BPTP), carried out at the Äspö Hard Rock Laboratory (ÄHRL), SKB is characterising a mixture of sodium bentonite and crushed granite rock (30/70 by weight). The study is focused on the hydraulic behaviour of such a mixture and the influence of salt water on the mixture hydraulic conductivity. As the mixture contains 30% of sodium bentonite its activity is still large if compared with kaolinite or illite, as a result influence of pore water chemistry on hydro-mechanical behaviour was studied as well. Therefore, the chapter starts with a brief compilation of previous investigation performed by several authors on the influence of pore fluid chemistry on the hydro-mechanical behaviour of active clayey soils as volume change, hydraulic conductivity, soil structure or retention properties. After this brief summary, the backfill is introduced and the tests performed in laboratory by Clay Technology AB, CIEMAT and UPC are presented and analysed. 3.2 CHEMICAL EFFECTS ON HYDRO-MECHANICAL BEHAVIOUR OF ACTIVE
SOILS Considerable experimental testing research has been carried out on unsaturated and saturated pure bentonite or bentonite-granular materials mixtures as sealant materials in engineered barriers for nuclear waste disposal sites or other hazardous waste. In such a problem, interest in studying the chemical effects of salts on the hydro-mechanical properties of soils is very

Chapter 3: Backfill experimental study
34
important because of the possible hydration with seawater, brine, or leachates coming from the waste. It is well known that mechanical and hydraulic behaviour of clay soils can be strongly affected by the clay-fluid system interaction (Mitchell, 1993) and, as a result, the safety of the barrier could be notably affected. This effect may eventually be very important in the long-term behaviour of field test being conducted at Äspö HRL. A great number of experimental studies dealing with the chemical effects on hydro-mechanical properties of saturated and unsaturated clays, limes and sandy soils are available in the literature. Most of these studies focused on the effect on hydraulic conductivity (Pupisky & Sheinberg, 1979; D’Appolonia, 1980; Goldenberg & Magaritz, 1983; Fernandez & Quigley, 1985; Gipson, 1985; Holopainen, 1985; Shackelford, 1994; Yanful et al. 1995; Petrov & Rowe, 1997; Dixon et al. 1999; Pusch, 2001). Others studied the effect on swelling pressure (Low, 1980; Komine & Ogata, 1996; Daupley, 1997; Karnland, 1997; Dixon, 2000; Pusch, 2001). Others on volume change (Bolt, 1956, Mesri & Olsen, 1970, 1971; Yang & Barbour, 1992; Barbour & Yang, 1993; Di Maio, 1996; Abdullah et al. 1997), on compacting behaviour (Ridley et al. 1984), on residual strength (Moore, 1991; Di Maio, 1996) and on retention curve (Miller & Nelson, 1992; Mata et al. 2002). Most of the experimental works available in the literature have been carried out at very high void ratios (very high water contents) and/or strong salt concentrations. In these conditions, influence of pore water changes on active clay behaviour is very important and can be qualitatively explained by the diffuse double layer theory. Such quantity of experimental information clearly contrasts with the difficulties to develop mathematical models able to explain all the phenomena involved in the problem of reactive transport coupled with hydro-mechanical soil behaviour. The diffuse double layer (DDL) theory by Gouy-Chapman has been used to explain the changes in physico-chemical properties of soils under very restrictive conditions. It works for homo-ionic clays and permeants of the same valency and only in colloidal suspensions. However, this theory can qualitatively explain some observed changes in hydraulic conductivity (Achari et al. 1999), compressibility (Sridharan & Jayadeva, 1982; Sridharan, 2001) and swelling pressure (Komine & Ogata, 1996) of active clayey soils permeated with fluids of different chemical composition and concentration. The thickness of the diffuse double layer, d, can be estimated from the Gouy-Chapman theory in accordance to equation (1) (Mitchell, 1993).
02 2
02DBTd
n e vε= (1)
Where ε0 is the permittivity of vacuum (8.8542·10-12 C2/J·m), D is the dielectric constant of the medium (ε = ε0D), B is the Boltzmann constant (1.38⋅10-23 J/K), T is the temperature (K), n0 is the electrolyte concentration, e is the electronic charge (1.602⋅10-19 C) and v is the cation valence. Equation (1) can qualitatively explain how, for instance, hydraulic conductivity increases when the valence of the cation is increased (if the other parameters are kept constant). The thickness of the DDL decreases when v increases. Or, for example, when the electrolyte concentration increases, the thickness of the DDL decreases with similar results, and hydraulic conductivity increases. If the dielectric constant of the medium decreases, the thickness of the DDL decreases as well and the hydraulic conductivity increases. Some modifications were introduced in the Gouy-Chapman theory (in Mitchell, 1993), although this theory has still considerable uncertainties when it is used to represent the clay-fluid system. The hypotheses assumed by the DDL theory are very strong and restrictive. Its application to compacted active clayey soils is doubtful for engineering purposes. A number of factors are

Chapter 3: Backfill experimental study
35
attributed as the cause of the discrepancies between the real clay-fluid system behaviour and the DDL model. One of them is the possible failure of continuum mechanics approach in the vicinity of the clay platelet, and moreover, the assumption of parallel arrangement of the clay particles might introduce important errors as well (Hueckel et al. 2001). All the experimental work carried out to date has shown the importance of the clay-fluid interactions on the physico-chemical behaviour of active clays. The change of pore fluid chemistry can alter the micro and macrostructural behaviour as it has been widely shown. Recently, a chemo-mechanical model has been proposed and successfully used to simulate the experiments performed by Di Maio (1996) and Santamarina & Fam (1995). This model, within a double porosity framework for expansive clays (Gens & Alonso, 1992), introduces the geochemical variables into the microstructure behaviour (Guimarães, 2002; Sánchez, 2003). This model has been implemented in a finite element code and the equations of reactive transport are solved in a fully coupled way with the non-isothermal multi-phase flow of liquid and gas through deformable and unsaturated porous media equations. 3.2.1 Fluid-clay interaction effects on volume change and hydraulic conductivity of swelling
clays Salas & Serratosa (1953) and Bolt (1956) examined the importance of the clay-fluid interactions and their effects on compressibility in clay suspensions. They realised the influence of the absorbed cation on homo-ionic clay behaviour or the influence of salt concentration on volume change in clay suspensions. Mesri & Olson (1971) observed the influence of different salt concentrations and pH effects on compressibility of Wyoming sodium bentonite suspensions. They also proved that sodium bentonite was more sensitive to chemical influences that calcium bentonites, showing the importance of the absorbed cation on the physico-chemical behaviour of an active clay. Sridharan & Venkatappa Rao (1971, 1973) proposed, after some oedometer tests in swelling clays and different permeants (all of them organic fluids), a new conceptual model to explain the volume change in clayey soils. They proposed two different mechanisms that control the change of volume in soils: shearing resistance at inter-particle level (non-expanding soils) and the attractive and repulsive forces at the DDL (swelling clays). Mitchell et al. (1973) and Greenberg et al. (1973) described and set a model to explain the chemico-osmotic effects in fine-grained soils. They studied both numerically and experimentally the consolidation of fine-grained soils when osmotic effects are involved. They coupled the flow of water and flow of salt and introduced the flow of water due to a gradient of salt concentration. Therefore, two diffusion equations were obtained, both describing diffusion of water and diffusion of salts. The coupling between the diffusion phenomena and the consolidation phenomena was established by assuming a linear variation of soil void ratio and pore pressure, as in Terzaghi’s theory. The model was used to study the problem of salt intrusion in a basin (Greenberg et al. 1973). Sridharan et al. (1986) explained, under the modified DDL theory assumptions, the observed behaviour of different homo-ionic bentonites checking the influence of the absorbed cation on compressibility and hydraulic conductivity. They proved that effects of size of the hydrated radius of the absorbed cation on clay behaviour were more pronounced in monovalent bentonites than divalent or trivalent bentonites. However, ammonium and potassium bentonites showed closer behaviour to divalent homo-ionised bentonites than to monovalent homo-ionised (lithium and sodium) bentonites. This discrepancy between the expected

Chapter 3: Backfill experimental study
36
behaviour and the measured one can be caused by a partially irreversible potassium fixation or even due to experimental conditions (Di Maio, 1998). Barbour & Fredlund (1989) defined two mechanisms that produce osmotic volume change: osmotic consolidation and osmotically induced consolidation. Both mechanisms appear when clay is exposed to a different solution from its interstitial pore fluid, and their origins are totally different. They concluded from their experimental and theoretical studies in clay-brine interactions that osmotic consolidation is the predominant mechanism, and the same conclusion was drawn by Santamarina & Fam (1995). Figure 3.1 shows the phenomena of osmotic consolidation in a Canadian clay at constant load after being exposed to brine. Yong et al. (1992) investigated the effect of salt concentration on swelling pressure of a sodium montmorillonite. They checked that the lower the salt concentration, the higher the measured swelling pressure. Di Maio (1996) performed oedometer tests in Ponza sodium bentonite exposing the clay to different saturated salt solutions (KCl, NaCl and CaCl2). The absorbed cation, Na+, was displaced for the different cations and therefore, the original hydro-mechanical properties of the bentonite as volume change or residual shear strength were modified. Karnland (1997) conducted swelling pressure tests on highly compacted MX-80 and hydrated with brines. Figure 3.2 shows how the swelling pressure of a highly compacted MX-80 specimen decreased after being exposed to a saturated NaCl solution. Dixon (2000) studied the effect of different salinity at pore water on swelling pressure in bentonites and bentonite/sand mixtures. He defined the effective clay dry density (ECDD), which takes into account dry specific weight of the swelling clay fraction of a mixture. He concluded that if ECDD > 9 kN/m3 and total dissolved salts in the clay pore fluid ranges between 10 g/L and 75 g/L, a minimum swelling pressure of 100 kPa can be obtained for different bentonites (MX-80 Wyoming bentonite included). He also found that for high ECDD (12.2 kN/m3 or higher) the effect of changing the water chemistry should not strongly alter the swelling behaviour of bentonites due to the small number of water layers close to the clay particle. Pusch (2001) also checked out the influence of different NaCl and CaCl2 concentrations on swelling pressure in highly compacted Friedland active clay (45% of montmorillonite content). Swelling pressure was sensitive to salt concentration but not very different to those measured with distilled water. Many experimental works have also been developed to study how hydraulic conductivity is affected by pore fluid chemistry changes. Hydraulic conductivity is usually more sensitive to these changes than shrinkage or swelling behaviour. Their consequences can be crucial on ensuring the safety of barriers and liners. Some studies related to change of hydraulic conductivity of swelling clays exposed to brines have been performed in Canada by different authors (Ridley et al. 1984; Haug et al. 1988; Yang & Barbour, 1992). Fernandez & Quigley (1985) performed a good experimental study, similar to Sridharan & Venkatappa Rao (1973), but with flow tests instead of oedometer tests in a clayey soil with a cation exchange capacity (CEC) of 33 meq/100g and a specific surface of 120 m2/g. Measured differences of permeability at the same void ratio were up to 5 orders of magnitude. Their conclusion was, the higher the dielectric constant of the fluid, the lower the hydraulic conductivity is. This result agrees with the DDL theory (equation 1). If the dielectric constant of the medium increases, the thickness of the double layer also increases and then the hydraulic conductivity decreases (if all chemical variables are held constant except ε). Another important conclusion drawn from their study was the influence of different miscibility of the organic permeants used on the flow tests. Water-wet specimens permeated with insoluble aromatics produced no increase in hydraulic conductivity.

Chapter 3: Backfill experimental study
37
Yanful et al. (1995) conducted a series of flow tests in three different soils (one clayey soil and two tills) permeated with acid mine drainage. Only the hydraulic conductivity of the clayey soil increased by a factor of 2. They controlled the geochemistry of the effluent, checking the metals evolution and pH. With this information they could study different chemical reactions as desorption-adsorption of exchangeable metals, dissolution of alumino-silicate minerals or secondary minerals precipitation. However, hydraulic conductivity does not always increase when fluid-chemistry is changed. For example, Gipson (1985) measured a decrease of hydraulic conductivity in different clayey soils when permeated with acid liquor (expected effluent from a phosphogypsum disposal field, pH = 2.2). A possible explanation of this decrease was an important precipitation of gypsum as secondary mineral altering and clogging the soil structure. From these experimental works and others is clearly shown that the effects of fluid-clay interactions on shrinkage, swelling or hydraulic conductivity in active clayey soils can be important and it is not easy to handle and understand them. Some clear trends can be observed, but DDL theory cannot explain, even after several modifications, the behaviour of swelling clays when pore fluid chemistry changes. 3.2.2 Chemical effects on retention properties of swelling soils Water retention behaviour of chemically active clayey soils depends on some factors: void ratio, specific surface, temperature and pore fluid chemistry. Nevertheless, in this work, temperature effects on hydro-mechanical properties were not considered. As it was previously checked in saturated clay soils, water adsorption decreases when salt concentration increases (Mesri & Olson, 1971; Gleason et al. 1997; Kenney et al. 1992), or when the valence of the adsorbed cation increases (Sridharan et al. 1986) or when the dielectric constant of the permeant decreases (Sridharan & Venkatappa Rao, 1973). However, only a few laboratory results are available in the literature dealing with the retention behaviour of unsaturated clayey soils when pore-fluid chemistry changes (Miller & Nelson, 1992; Mata et al. 2002). Miller & Nelson (1992) measured the total suction of a moderately plastic silty clay by means of filter paper technique and pressure plate device following a drying path. From the laboratory results obtained in that work, osmotic suction, calculated by means of the Van’t Hoff equation (2) for very dilute solutions as an additive and constant term in the total water potential, was called into question.
1w
i* 2iw
aRT= ln RT CV a
π ≅
∑ (2)
Where π is the osmotic suction, R is the universal gas constant per mole (8.314 kPa·L/mol·K), T is the temperature (K), V* is the partial molar volume of water (mol/L), aw is the activity of water (superscript 1 for the low concentration solution and superscript 2 for the high concentration solution) and Ci is the molar concentration of the i chemical species present in the solution. Matric suction was measured on specimens saturated with distilled water and salt water containing 2% of NaCl, and it was showed that matric suction was clearly independent on salt water influences since the investigated soil, a silty soil, was not active. Nevertheless, measured total suction was bigger for specimens saturated with salt water than those saturated with distilled water. Therefore, osmotic suction was higher in specimens hydrated with salt water, and as a result, the retention curve of silt specimens saturated with salt water and silt specimens saturated with distilled water were different.

Chapter 3: Backfill experimental study
38
Mata et al. (2002) checked out the influence of specific surface, Ss, dry specific weight, γd, and salt concentration in the water used to mix and saturate the specimens on the retention properties of active soils. Different sodium bentonite-sand mixtures were studied by means of transistor psychrometers (B/S = 10/90, 30/70 and 70/30, B = Bentonite content and S = Sand content by weight). Osmotic suction, introduced by the salt water added to the mixtures, was calculated as the difference of total suction measured in specimens saturated with salt water and total suction measured in specimens saturated with distilled water. An increase of osmotic suction while water content decreased during drying paths was clearly monitored in all the cases. This can be explained as an increase of salt concentration in the soil structure as free water evaporates. Therefore, in drying paths, osmotic suction cannot be a constant value in active soils as usually assumed. Table 3.1 summarises the initial conditions of the specimens after compaction. Figures 3.3 to 3.6 show the results of the drying retention curve for different B/S ratios and both dry specific weights.
/B S sS (m2/g)
0C (g/L)
dγ (kN/m3)
0w (%)
fw
(%) 10/90 56 0 13.8 34.1 1.75
“ “ 16 13.6 25.6 1.75 “ “ 0 16.8 20.1 2.00 “ “ 16 16.9 20.4 2.00
30/70 168 0 13.5 34.6 4.63 “ “ 16 13.8 32.2 5.69 “ “ 0 16.5 21.2 3.90 “ “ 16 16.9 23.0 4.90
70/30 393 0 13.7 35.3 11.0 “ “ 16 13.4 38.8 12.2 “ “ 0 16.5 21.8 10.6 “ “ 16 16.4 24.6 11.9
Table 3.1: Details of the preparation of the specimens of different bentonite and sand mixtures. Ss is the specific surface of the mixture, obtained as bentonite content by mass regarding specific surface of pure sodium bentonite. Therefore, sand is assumed chemically inert. wf is the final density at a relative humidity of 47%. The osmotic suction of 16 g/L salt water (NaCl and CaCl2, 50/50 by mass) can be estimated from its electrical conductivity (EC = 29000 µS/cm). The following expression provides an experimental relationship between the electrical conductivity EC at 25ºC and the osmotic suction π of a heteroionic pore-water solution:
BECA·
1 S/ cm
π = µ (3)
where A = 0.019 kPa and B = 1.074, according to data reported by the USDA Agricultural Handbook (1950). From equation (3) the estimated value of osmotic suction is π = 1.18 MPa. This value agrees with the measured value using the psychrometers (1.15 MPa). Romero (1999) presented data relating salt mass concentration C (homoionic NaCl system) with electrical conductivity EC, which have been fitted to the following expression:

Chapter 3: Backfill experimental study
39
F
CEC J·1g / L
=
(4)
where J = 2046 µS/cm and F = 0.944. Introducing (4) in (3) an expression relating the osmotic suction π and mass concentration C for salt dissolutions can be obtained as
1.014C68.3 kPa
1g / L
π = ⋅
(5)
Expression (5) can be modified by introducing current salt mass concentration w0⋅C0/w, as free pore water evaporates (solvent is the only volatile constituent):
1.014
0 0w C68.3 kPaw 1g / L
π = ⋅ ⋅
(6)
where w0 is the water content at saturation, w is the current water content (w/w0 represents the current degree of saturation) and C0 is the initial salt mass concentration (16 g/L). This model was used to fit the experimental results and proved to be valid at low sodium bentonite contents and low dry specific weights where the hypothesis of free water in the soil structure can be correct. Comparison between this relationship and the experimental results is depicted in figures 3.7 and 3.8. It is clear that osmotic suction, introduced by salt water, was not constant while the drying process continued. Fredlund & Xing (1994) stated a maximum value of osmotic suction of 1.5 MPa in less active soils containing more dilute pore fluid solutions. This value was assumed as constant and a maximum value of osmotic suction. Osmotic suction has been generally disregarded as a driving force in the study of unsaturated and saturated soil behaviour. This is due, mainly, to experimental and conceptual difficulties to study the total water potential of an unsaturated soil, above all, when active clays are involved and also because of its importance in nature. Nevertheless, changes in osmotic suction can be important in some cases, as, for instance, when salt content of a soil is altered by chemical contamination (Fredlund & Rahardjo, 1993). Referring to salt water effects on retention properties of active soils, figure 3.9 shows the measured matric suction of MX-80 sodium bentonite – crushed granite mixture (30/70 by mass) in a suction plate (Johannesson et al. 1999). Different concentrations of salts were present in water used to saturate the specimens. Distilled water and the so-called Äspö water, which contains an average salt concentration of 12 g/L, were used. The results, even there is some scatter, show that measured matric suction for specimens hydrated with salt water was smaller than matric suction of specimens hydrated with distilled water. This fact seems to contradict the results obtained by Miller & Nelson (1992) on a non-active silty-clay. However, the reduction of matric suction measured in the salt hydrated specimens is in agreement with the expected change in retention properties due to the change of structure of bentonite as salt concentration in pore fluid is higher. A possible explanation is that the radius of the macropores increases and matric suction decreases because of the reduction of the capillarity potential. These results show another aspect of the interactions of pore fluid and hydro-mechanical behaviour of active soils as the backfill used in this project.

Chapter 3: Backfill experimental study
40
Flow and transport in a porous medium is controlled by different driving forces (Mitchell, 1993). During the current backfill hydration process in the ZEDEX gallery four main driving forces can be clearly described if gas phase and thermal effects are not considered. Two out of these four driving forces control water movement and the other two control the movement of ions through the porous medium. The first one is matric potential due to backfill unsaturated state related to capillarity effects or difference of water pressure. Flow of liquid phase in a porous media due to matric and gravitational potentials are usually mathematically expressed by means of Darcy’s law (Bear, 1972). Water also moves because of osmotic flow related to osmotic pressure or osmotic suction gradient that can be estimated in dilute solutions by means of equation (2). Water tends to equilibrate salt concentrations and moves to the side where salt concentration is higher. The third one is the gradient of concentration of different chemical species (or ions) expressed mathematically by means of Fick’s law. The last one is an advective movement of ions as water moves controlled by advective transport. Direction of different driving forces can be opposite. For instance, water tends to flow in the direction of decreasing matric suction. Ions tend to move in the direction of decreasing concentration. However, water tends to flow in the direction of increasing concentration due to osmotic gradients. Figure 3.10 shows a scheme of the coupled flow processes involved in the backfill hydration assuming that only one chemical species (incoming molar concentrations C1 and initial molar concentration in the soil C2) is involved in the transport problem where no chemical reactions of any type are considered. Due to the characteristics of backfill hydration process in the ZEDEX gallery, it is expected that gradients of matric potential and gradients of osmotic potential act in opposite directions as stated by Kemper (1961) in his experimental work. Figure 3.11 shows the evolution of four of the Wescor PST-55 psychrometers placed in the ZEDEX gallery. It can be observed that an increase of total suction was measured after backfill compaction. Not all the psychrometers installed in situ showed the same pattern. It is thought that seasonal effects did not produce this total suction increase. Temperature at ZEDEX gallery is more or less constant to 15ºC the whole year (Clay Technology, 2002). It is not expected a drying effect because of a redistribution of vapour after the compaction process. From the measurements of initial water content of backfill after the compaction process, it is not clear a relation between the increase of total suction observed in some devices and the initial water content at different layers of sections A3 and A4 (figure 2.14, chapter 2). Many reasons could explain such behaviour. The most probable one is a redistribution or water migration to dryer areas after compaction. However, two phenomena are discussed below in order to give an answer to the observed evolution at some psychrometers: a flow of water driven by an osmotic gradient due to different salt concentration existing in the pore fluid and in the injected salt water, and an increase of total water potential because of an increase of osmotic potential after the injection of salt water containing a higher salt content than the mixing water. A number of works dealt with water transport through saturated and unsaturated geologic media induced by osmotic phenomena (Kemper, 1961; Young & Low, 1965; Greenberg et al. 1973; Mitchell et al. 1973; Latey et al. 1969; Marine & Fritz, 1981; Barbour & Fredlund, 1989; Keijzer et al. 1999; Neuzil, 2000; Cey et al. 2001). A flow of water due to chemical osmosis acting in an opposite direction to the flow of water due to matric gradient can appear while injecting salt water. Neuzil (2000) proved the existence of osmotic flow in situ in saturated shale with high clay content and also proved the influence of soil porosity and concentration of salts. An in situ test was designed in that shale with four different boreholes, one containing distilled water, two containing high solutions of salt (up to 30 g/L of NaCl) and one containing pore water fluid squeezed from the shale (containing 3.5 g/L of NaCl).

Chapter 3: Backfill experimental study
41
From the observations after 9 years of monitoring, it was clear the increase of height of water in the boreholes containing solutions of NaCl with higher concentrations. He also solved the coupled equations of flow of water and salt and found that for very low porosity (lower than 0.05) very high osmotic pressure could be obtained (up to 20 MPa). Equations (7) express the coupled flow of fluid, jl, and the flow of a chemical species, jc, referred to the solid phase for a one-dimensional problem (Mitchell, 1993).
( )1
lw
cw
p RTk Cj kx x
p RTCk Cj Ck Dx x
ωγ
ω ωγ
∂ ∂= − ∂ ∂ ∂ ∂= − + − ∂ ∂
(7)
Where k is the soil hydraulic conductivity, C is the molar concentration of the chemical species, p is the water pressure, D is the effective diffusion coefficient, γw is the water specific weight and ω is the osmotic efficiency. Chemically driven hydraulic flow (or osmotic flow) primarily depends on this parameter. Osmotic efficiency of a soil is a measurement of its ability to act as a semipermeable membrane in preventing the passage of ions while allowing the passage of water. When ω = 1 the soil behaves as a perfect semipermeable membrane allowing water and neutral species passing through its porous matrix and preventing the ionic species to pass. This parameter depends on pore fluid chemistry, type of clay and also on clay porosity. Barbour & Fredlund (1989) found that high osmotic efficiencies were developed only at low water contents as, for instance, in very dense clays and also in dilute electrolyte systems. However, osmotically driven water flow may be significant relative to hydraulically driven water flow (Mitchell, 1993), nevertheless, Olsen (1969, 1972) stated that this flow can be important in geological media at deep depth after some tests performed in sodium kaolinite consolidated up to 60 MPa and low chemical gradients. Keijzer (2000) found low values of the osmotic efficiency for Ankerpoort Colclay A90 Na-bentonite from Wyoming (below 0.001 for porosities ranging from 0.55 to 0.64 and different concentration gradients). Recently, Cey et al. (2001) measured values of the osmotic efficiency ranging from 0.034 to 0.42 in a Canadian Cretaceous clay when mean concentration ranged from 840 meq/L to 96 meq/L respectively. When chemical concentrations increase, the passing of soluble ions increases, therefore, the semipermeable behaviour of the clayey soils reduces, and then, ω decreases. It is assumed that the increase of the passing of soluble ions, which reduces the osmotic efficiency, is due to a reduction of the double layer thickness (Appelo & Postma, 1993; Cey et al. 2001). After all this experimental information, it is believed that effect of osmotic flow of water in the MX-80 – crushed granite rock mixture can be negligible because of the range of salt concentrations involved in this problem and the high backfill porosity (φ > 0.35) in the barrier. The second phenomenon envisaged that could explain the increase of total suction observed in some psychrometers is a variation of osmotic suction with an increasing concentration of salts in the pore fluid. Figure 3.12 shows the measured total suction in a free bentonite backfill (100% crushed granite rock) during a wetting process. Äspö water and distilled water were added and the results compared. Wescor PST-55 was used to measure total water potential. It was observed that total water potential increased although water content also increased in specimens hydrated with Äspö wate (12 g/L). This behaviour is due to the increasing osmotic potential. These results do prove that total suction can increase even when degree of saturation is increasing and therefore, matric suction decreases.

Chapter 3: Backfill experimental study
42
In the following mathematical developments it is assumed that a wetting process of a non-active soil is being produced. By means of Kelvin’s equation a relationship between matric suction, ψm, and diameter of pores, D can be established.
24 cosH O
m Dσ θ
ψ = (8)
Where
2H Oσ is the surface tension of water and θ is the contact angle between water and the pore wall (usually cosθ = 1 for water). Kelvin equation predicts that matric suction decreases if D increases due to, for instance, the clay-fluid interactions. An increase of total suction can be produced by an increase of osmotic suction after the hydration of water containing a higher salt concentration. The injection of salt water increases the salt concentration in the pore fluid. Total water potential in a non-active soil can be expressed as:
( )t m i m rRT C Sψ π ψ ψ= + = +∑ (9) Where ψt is the total water potential and ψm is the matric potential depending on the degree of saturation, Sr. Matric potential is independent on pore fluid chemistry in non-active soils as stated by Miller & Nelson (1992). As the hydration process starts and salt water is injected, the osmotic suction increases and matric suction decreases. A simple model of total suction in a soil can be formulated depending on soil degree of saturation and salt concentration in the liquid phase. This model is only suitable for non-active soils assuming no change of structure and no interactions between fluid phase and solid phase. Moreover, a dilute solution is assumed, and thus, Van’t Hoff equation is applicable. Finally, it is important to point out that a wetting with salt water of a soil occurs. Some works have related the pore size distribution obtained by means of mercury intrusion porosimetry tests (MIP) to the matric suction retention curve (Prapaharan et al. 1985; Romero, 1999; Aung et al. 2001). If the results of a MIP test are worked out, a normalised degree of saturation of the intruded non-wetting mercury during the test,
nwrS , can be obtained. It can be easily checked that 1
nwr rS S+ = . From this relationship, the degree of saturation of the intruded mercury can be easily related to the soil degree of saturation. Figure 3.13 shows the measured evolution of the degree of saturation of the intruded mercury in a compacted specimen of Boom clay (Romero, 1999). The shape of this curve can be easily fitted by an exponential function depending on the entrance pore size or diameter, D. Equation (10) shows the exponential function, which depends on one parameter (δ), related to the pore size of the soil and it is depicted in figure 3.14.
1 exp expnwr rS S
D Dδ δ = − − → = −
(10)
The parameter of this model is related to the pore size at which a maximum of the derivative of the non-wetting degree of saturation distribution is obtained (δ = 2Dm). The derivative of the evolution of the degree of saturation of the intruded mercury is also shown in figure 3.14. The derivative is not exactly a density function, but reflects some characteristics of a density function. Therefore, from equation (10), a relationship between the soil degree of saturation and the porosimetry can be easily obtained.

Chapter 3: Backfill experimental study
43
The derivative of the distribution of the non-wetting degree of saturation is calculated as (11) and it is clear that if integrated in the positive range of pore sizes, the integral sums one.
2
0
2exp 1expnwrdSdj
dD D D j jδ δ δδ δ
∞ = − → = ∀
−∫ (11)
Using equation (8), which relates pore size to matric suction, an expression of matric suction depending on degree of saturation is obtained as:
( ) ( )2
lnexp exp
4 cosrm
r m mH O
SS δψ βψ ψ
σ θ β −= = − → = −
(12)
where β is the parameter of the model of this retention curve related to the air entry value. β, for its part, is directly related to the pore size at which the intruded volume of mercury reaches its maximum (δ = 2Dm). Therefore, by means of equation (12), the matric suction curve can be obtained from the distribution of the non-wetting degree of saturation. Figure 3.15 shows matric suction retention curves depending on different values of β. The model presented is very simple. However, further improvements are necessary in order to study double or triple modal soils. At this stage, the model assumes that pore size ranges from zero to infinity, which is clearly not correct. The Van’t Hoff equation can be used to relate concentration of chemical species to degree of saturation. Some hypotheses are necessary to relate concentration to degree of saturation of a soil in a simple way. Only one chemical species is injected and its concentration in the injected fluid is 0C . An unsaturated and non-active soil, where no changes of structure are produced due to chemical effects and there is no interaction between the salt and the solid phase, is considered. The initial volume of water in the pores is assumed as distilled free water and it is controlled by the initial degree of saturation, 0
rS . After these hypotheses, osmotic suction in a soil can be expressed as
( )0
0r r
r
S SRTC RT C
Sπ
−= = (13)
where 0
rS is the initial degree of saturation of the soil and 0C is the injected concentration in the incoming water. Finally, an expression relating the total water potential in a soil, or total suction, to the soil degree of saturation can be found as
( ) ( )0
0
lnr r rt m
r
S S SRT C
Sψ π ψ
β−
= + = − (14)
Figure 3.16 shows some total suction curves depending on different values of β and assuming an injecting concentration of 1 mol/L, 0C , and a residual or initial degree of saturation of 0.05. This model is very simple and it is not able to reflect the complexity of an active clay-fluid system where hydro-chemo-mechanical effects are coupled. Nevertheless, it can qualitatively explain the evolution of total suction when hydrating a non-active soil with salt

Chapter 3: Backfill experimental study
44
water containing a higher salt concentration than initial salt concentration in the free water within the soil structure. The model presented can be generalised to take into account the free variation of total concentration of salts in an unsaturated soil when, for instance, it is wetted with water containing different concentrations of salt. Concentration is a function of water content and the mass of salt, both quantities can change in a wetting path with salt water or a drying path where mass of salt is kept constant. The independent variables are the total concentration of salts in the pores of a representative elementary volume (REV) and the degree of saturation. Equation (14) can be generalised by considering i chemical species as the mass of salt, the volume of pores (constant as the main hypothesis of this model is soil is non-active) and degree of saturation.
( ) ( ) ( ) ( ) ( )0 0
0 0
ln, r r r r ri i
t r i m m rr r
S S S S SS C RT C S RT C
S Sψ π ψ ψ
β− −
= + = + = −∑ ∑ ∑ (15)
Where 0
iC is the initial concentration of the i-species. The shape of the retention surface obtained with this model is shown in figure 3.17 for a clayey soil (high value of the air value entry - β - equation 12) and in figure 3.18 for a sandy soil (low value of the air value entry - β - equation 12). It can be observed that for a sandy soil total water potential is strongly dependent on salt concentration and the resulting surface is almost horizontal. However, for a clayey soil, the model presents a stronger dependence on matric suction than osmotic suction. This model controls the total water potential in a non-active soil when salt concentration increases or decreases If total water potential of an active soil is studied and pore fluid interactions are taken into account, matric suction should be also dependent on salt concentration in the fluid phase because of changes of micro-macrostructure that affects the way water is stored by capillarity in the pores (weakly bounded water) as it was shown in figure 3.9 at high water content in the backfill. 3.2.3 Chemical effects on micro and macrostructure of active clays It is important to point out that chemical effects on hydro-mechanical behaviour of active clayey soils are due to changes at the different structural levels and the interactions among them. It is expected that hydro-mechanical behaviour at the microstructural and nanostructural levels of expansive clays will be controlled by the physicochemical interactions at particle level. Up to three different structural levels can be envisaged and defined in natural, compacted or expansive clays: nanostructure, microstructure and macrostructure (Olsen, 1969; Collins & McGown, 1974; Alonso et al. 1987; Gens & Alonso, 1992; Alonso, 1998; Hueckel et al. 2001) from different experimental results. Figure 3.19 shows a schematic representation of different fabrics of an expansive soil where the three different structural levels are explained. The current understanding of nano and microstructure and nanoscopic and microscopic phenomena is based on the organisation of the pore space and the water within the pores at different structural levels. The smallest structural level is the space available between the clay platelets (around 10-20 Å) filled up with water with assumed different physico-chemical properties than free water (Skipper et al. 1991). This water is strongly bonded to the solid phase and it is immobile under hydraulic gradients and it could be mobile only under tectonic stresses (Alonso, 2002). The arrangements of clay platelets

Chapter 3: Backfill experimental study
45
form what it is called cluster or elementary particle arrangement. Among the clusters there are pores (intra-aggregate pores) that can be filled with free water and their characteristic size is 1 µm (Hueckel et al. 2001). Therefore, water present in those pores is mobile. The clusters can form aggregates and the pores among the aggregates can be also filled with free water. Water at the macrostructural level is related to a different storage mechanism: capillarity. Acar & Olivieri (1989) performed a study of the fabric of kaolinite and Ca-montmorillonite after compaction and permeation with five different organic fluids (p-dioxane, nitrobenzene, benzene, acetone and phenol) by means of MIP tests. Kaolinite specimens were compacted dry of optimum and wet of optimum at different energy levels. After the compaction it was checked out that the large mode (macrostructure) was sensitive to the compaction process. However, the small mode (microstructure) was not significantly sensitive to the energy applied during the compaction at both water contents. The specimens were freeze-dried before the MIP tests in order to remove the water contained in the pores without altering the soil fabric. Different organic pemeants provided with different results. For example, specimens permeated with acetone, p-dioxane or phenol showed strongly different fabrics if compared with a reference fabric (specimens hydrated with a solution 0.1 N of CaSO4). The changes were mainly at the large mode or macrostructure and not important changes were observed at the microstructural level. Specimens hydrated with nitrobenzene and benzene did not show significant differences of fabric if compared with fabric of specimens hydrated with the reference solution. In order to find out the influence of pore fluid on the micro and macrostructural levels, four MIP tests were performed in compacted specimens of a mixture of sodium bentonite (B) and sand (S) with B/S = 70/30 (by mass) used to study the total suction at two dry specific weights and two salt concentration on water used to saturate them (Mata et al. 2002). Soil specimens were wetted with salt and distilled water, after the specimens were compacted at 16.7 kN/m3 and 13.7 kN/m3 and finally, air-dried in a room where relative humidity was 47% at free shrinkage conditions. Dry specific weight was not controlled after the drying process. Soil structure was then studied by means of porosimetry tests at the corresponding water content at this relative humidity. Soil specimens were not freeze-dried after the drying process in this controlled relative humidity room. Therefore, water content at the microstructural level might be high enough to prevent mercury intrusion affecting the results at this structural level. From the results two main features were observed: no microstructure differences were observed and macrostructure differences were measured after the MIP tests. MIP test results are depicted in figures 3.20 and 3.21 at both dry specific weights. It is interesting to note that at both dry specific weights and independently on water salinity, the predominant pore size in the microstructure was the same for the four specimens (0.017 µm) and the incremental intruded pore volume was also the same (around 105 mL/kg). However, specimens hydrated and saturated with salt water presented higher incremental intruded pore volume than those saturated with distilled water. From these results could be concluded that salt water effects were significant on the macropores and not important on the micropores. In addition to that, changes in dry specific weight of the specimens only induced changes in the volume of mercury intruded at the macrostructure level. The results obtained by Acar & Olivieri (1989) were similar when MIP tests were performed in compacted kaolinite specimens at different energy levels (specimens were freeze-dried) and no changes in the smaller mode were observed. From the above paragraphs, it is clear that the characterisation of the clay-fluid system and the understanding of the phenomena involved in such a system requires new developments in

Chapter 3: Backfill experimental study
46
experimental techniques and new modelling approaches as, for instance, Monte Carlo (Delville, 2001) or molecular dynamics simulations (Ichikawa et al. 2001) of the interlayer structure in order to define a physical model of the clay-fluid system. Further cooperation among scientists with different backgrounds is also necessary to reach full comprehension of the clay-fluid system. 3.2.4 Some usual chemical reactions involved in bentonites Nowadays, groundwater chemistry is a wide and interdisciplinary science. Interest in studying the chemistry of groundwater has been arising not only for drinking water but for preservation of the groundwater resources as well. Within this framework, the study of the reactive contaminant transport has been widely developed in the last 15 years (Appelo & Postma, 1993). The study of the reactive contaminant transport is essential to assure the safety and stability of an engineered barrier for nuclear waste. The most important aim of studying the reactive transport in engineered barriers is to assure the stability of the hydro-mechanical properties of bentonites and its mixtures in a long-term perspective. Different mechanisms contribute to the observed change in hydro-mechanical behaviour of active clayey soils when the clay-fluid system is altered due to reactive transport. These are: 1. Chemical reactions within the clay structure such as dissolution/precipitation of soil
minerals and redox processes. These reactions can increase-decrease the volume of micro and macropores within the clay structure. Gypsum and calcite are the two most important dissolving components in natural bentonites (Muurinen & Lehikoinen, 1998b).
2. Pore fluid substitution in the clay structure can lead to smaller or bigger double layer of the bound water surrounding the hydrated clay platelets, increasing or reducing the pore volume and changing the clay structure. The main reaction involved in these changes is the ion exchange of adsorbed cations.
3. Biological activity due to growth of aerobic and anaerobic bacteria in a long-term perspective (Darkin et al. 1997). This problem has not been studied or considered in this thesis. All the observed alterations in physico-chemical properties in the backfill are attributed to the two previous mechanisms.
Many studies have been carried out on these matters. It is not the aim of this thesis to provide an extensive discussion on this subject. Only the ion exchange reaction will be briefly described here. There are three main mechanisms of sorption and ion exchange: absorption, adsorption and exchange. Figure 3.22 shows a simple representation of the three processes. The ion exchange reaction is mainly controlled by the exchange capacity of the clay minerals. The exchange capacity of a clay mineral is determined by environmental conditions as temperature, pH, pore fluid chemistry and type of clay minerals. Depending on the type of clay, one cation or another one will be adsorbed-absorbed-exchanged (Mitchell, 1993; Appelo & Postma, 1993). Usually montmorillonite, vermiculite and saponite, for instance, have ion exchange capacities higher than 70 meq/100g of solid phase (Mitchell, 1993). Sodium, calcium, potassium and magnesium are the main exchangeable cations but also anions can be exchanged as, for instance, sulphate, chloride, phosphate and nitrate. It is believed that the exchange reactions do not ordinarily affect the structure of the clay particles, however, important changes in the physico-chemical properties of the soil can be observed. One of the most common ion exchange reactions is the one involving sodium and calcium: 2
22 2Na CaX NaX Ca+ ++ +

Chapter 3: Backfill experimental study
47
The reaction controlling the ion exchange of Na+/Ca2+ was considered in this thesis, as these are the most common cations in Äspö water. Other important reactions as gypsum dissolution or calcite dissolution were not considered. The resolution of a more complicated geochemical model for the backfill is a challenging task that was beyond the objective of this thesis. For example, a Spanish bentonite, which can be used in the Spanish concept of nuclear waste storage, was geo-chemically characterised (FEBEX, 2000) and a complete geo-chemical model was presented and numerically solved by means of a fully coupled THMC formulation (Guimarães, 2002). Some geochemical information of pure MX-80 has been provided by Olin et al. (1995) and Lehikoinen et al. (1997). Olin et al. (1995) proposed a geochemical model for compacted pure MX-80 bentonite. The bentonite-water system consists of three main parts: the external pore water (or water between particles or macropores), montmorillonite and the internal pore water (water between the platelets or micropores) and the solid phase, where the accessory minerals are. Therefore, a distinction between water in the microstructure and macrostructure is made. Both structural levels are connected and cations can move from one level to the other one. However, anions can move only in a fraction of the external pore water outside the montmorillonite particles. Figure 3.23 shows a schematic representation of the water-bentonite system assumed by Olin et al. (1995). 3.3 MIXTURE DESCRIPTION As indicated above, the backfill is made up by 30% of MX-80 sodium bentonite and 70% of crushed granite rock (by mass) coming from the excavation of a gallery in the ÄHRL at Sweden. SKB and Clay Technology AB chose this mixture after testing several other mixtures (10/90, 20/80 and 30/70). Hydraulic tests (water uptake tests and flow tests) and mechanical tests (swelling pressure and compaction tests) were conducted on these different mixtures. The results of the performed tests can be found in Börgesson et al. (1996) and Johannesson et al. (1999). The grain size distribution of this backfill was carefully chosen to get a low hydraulic conductivity and diffusion coefficient. Backfill can be easily compacted because of its grain size distribution (wopt = 13.0%, γd = 15.9 kN/m3 at 63% Proctor or wopt = 11.8%, γd = 19.56 kN/m3 at modified Proctor). Figure 3.24 shows the grain distribution of this 30/70 mixture. The maximum grain size of crushed granite rock is 20 mm. For particle size lower than sieve 200 ASTM (φ = 0.074 mm) the grain size distribution was obtained by the LASER diffraction technique. A series of water uptake tests were performed in specimens with two different initial water contents (6% and 13%). Different hydraulic conductivities were estimated from those water uptake tests as a result of different soil structures generated by compacting at different water contents (Mitchell et al. 1965). Numerical calculations were made to estimate backfill hydration time for both different initial water contents and different geometries (Clay Technology, 1998; Mata & Ledesma, 1999). After these calculations it was decided to compact the backfill in situ with 13% of initial water content. Bentonite and crushed granite were mixed and kept under controlled conditions of water content until backfilling the ZEDEX gallery at the ÄHRL. MX-80 and granite characteristics are summarised below. 3.3.1 MX-80 sodium bentonite MX-80 is the commercial name of a Wyoming sodium bentonite produced by American Colloid Co. and delivered by Volclay Ltd, Meryside, UK, in Europe. The origin of Wyoming bentonites is very old. Over 100 million years ago, during the Cretaceous Age, volcanoes in

Chapter 3: Backfill experimental study
48
the Yellowstone area of Wyoming were subjected to long periods of eruptions. Ash falling from these eruptions dropped into seas that covered much of Wyoming, where became sodium related, forming sediment layers as much as 15 meters deep. These sediments were slowly altered into the clay we know today as bentonite. These ash-beds are quite common in that part of the United States (Collins, 1997). Depending on environment or alteration conditions, bentonite composition and properties can be very different. Processing of bentonite from the ash-bed or bentonite seam to a dry powder involves some steps. Bentonite is removed using soil scrapers and bulldozers. The clay is spread on the ground and sun-dried. After that, the clay is dried in a rotary kiln at approximately 120ºC and then passed through crusher and sizing screens. Finally the dried clay is stored and delivered (Oscarson et al. 1990; Clay Technology, 2001). Müller-Vonmoos & Kahr (1983) and Madsen (1998) have determined the mineralogy of MX-80 sodium bentonite. Table 3.2 summarises the MX-80 mineralogical composition. Its high montmorillonite content assures a high swelling potential (i.e. sealing behaviour) even at low dry specific weights (swelling pressure >1 MPa for pure MX-80 and distilled water at γd = 13 kN/m3, after Madsen, 1998). This important swelling capacity (higher than calcium bentonites) is attributed to the big hydrated radius of Na+ cation (5.6 to 7.9 Angstroms, Mitchell, 1993). Mineral Montmorill. Quartz Mica Feldspar Carbonate Kaolinite Pyrite Accessories
(%) 75 15.2 < 1 5 – 8 1.4 < 1 0.3 2
Table 3.2: Mineralogical composition of MX-80 bentonite (Müller-Vonmoos & Kahr, 1983).
The specific surface calculated using Jagodzinski camera technique was 562 m2/g (Madsen, 1998) and calculated one by means of gas adsorption method according to Brunauer, Emmet & Teller apparatus (BET) was 700 m2/g (Pusch, 1982). Its chemical composition is shown in table 3.3 after Van Olphen & Fripiat (1979). The MX-80 bentonite is not a purely sodium-saturated clay. Calcium and magnesium are also representative in its pore water (Pusch, 1982). The cation exchange capacity (CEC) of this bentonite is 76 meq/100g (Madsen, 1998) or 76.4 meq/100g (Van Olphen & Fripiat, 1979). The main important exchanging cations are Na+ and Ca2+. The exchangeable cations are shown in table 3.4. The particle unit weight, γs, of the bentonite is 27.05 kN/m3 and the clay content (< 2 µm) is approximately 85% (Madsen, 1998). The MX-80 plastic limit is 70 and its liquid limit is 400 or higher (Lajudie et al. 1996). In the last 20 years a great number of different experimental works have been carried out to study the behaviour of the MX-80. Most of these studies were related to nuclear waste storage. A brief list of works dealing with the physico-chemical behaviour of this bentonite is detailed below:
Ion exchange capacity, anionic exclusion, sorption effects, pore water chemistry in the fluid-clay system, diffusion of ions and gas migration (Muurinen et al. 1988; Olin et al. 1995; Lehikoinen et al. 1996; Horseman et al. 1997; Lehikoinen et al. 1997; Muurinen & Lehikoinen, 1998a; Madsen, 1998; Muurinen & Lehikoinen, 1998b; Eriksen et al. 1999; Herbert & Moog, 1999; Egloffstein, 2001).
Retention curve as powder (Kahr et al. 1986; Fujita et al. 2001). Retention curve with temperature in compacted specimens (Villar, 2002 and Villar, 2003).
Hydro-mechanical properties as swelling pressure, hydraulic conductivity and volume change (Pusch, 1980; Pusch, 1982; Börgesson, 1985; Pusch & Carlsson, 1985; Pusch et al. 1991; Börgesson et al. 1995; Pusch, 1998; Madsen, 1998; Villar, 2002; Villar, 2003).
Long perspective behaviour and chemical transformations (Push & Karnland, 1990; Güven, 1990; Pusch & Güven, 1990).

Chapter 3: Backfill experimental study
49
Chemical component
SiO2 Al2O3 TiO2 Fe2O3 FeO MgO CaO Na2O K2O F P2O5 S CO2
(%) 62.9 19.6 0.09 3.35 0.32 3.05 1.68 1.53 0.53 0.11 0.05 0.05 1.33
Table 3.3: Chemical composition of the MX-80 bentonite (after Van Olphen & Fripiat, 1979).
Author Na+ K+ Mg2+ Ca2+ Madsen (1998) 62.4 0.2 3.0 7.4 Pusch (1982) 60.0 - 3.0 5.0
Table 3.4: Exchangeable cations in meq/100g of MX-80 bentonite.
3.3.2 Crushed granite rock Sweden is geologically located in the Fennoscandian shield or Baltic shield. This shield is dominated by gneisses and granitoids originated during the Precambrian age, 1900 million to 1800 million years ago (Ericsson, 1999). The Småland granite intrusions dominate this Precambrian basement, but dark, fine-grained old volcanic rocks can be found as inclusions in the Småland granite and gabbro-diorites or circular massifs, of a younger coarse-grained, red granite which intruded the older bedrock 1400 million years ago can be also found as dykes and irregular veins (SKB, 1996). Granite coming from the blasting of the ZEDEX gallery was used in the Backfill and Plug Test Project. This granite is called reddish grey Äspö diorite. This diorite, with the Småland granite that is a medium grained and porphyritic granite, makes up most of the rock mass in the Äspö tunnelling area. The Äspö diorite is a more basic and heavier variety of the Småland granite (SKB, 1996). There are veins and inclusions of fine-grained granite and pegmatite. Oxidation of wall rock around fractures is also quite common (Gunnarsson et al. 2001). There is a main fracture set which trends NW and these fractures are the main water bearing structures. An extensive geological study has been performed in the Äspö area to determine its feasibility as a geologically stable site for a deep vault (SKB, 1996). The ZEDEX gallery was excavated by means of careful blasting. The granite coming from the excavation was classified and crushed until the desired grain size distribution was obtained. The crushed granite was dried and mixed with the pure bentonite. The granite grain specific weight is 26.06 kN/m3 (Clay Technology, 1998). Crushed granite has been always assumed chemically inert due to its old origin and long contact with salt water coming from Baltic Sea. 3.4 COMPACTION TESTS Backfill compaction behaviour was studied by means of modified Proctor tests at the beginning of the project (Börgesson et al. 1996) and the results are shown in figure 3.25. Distilled water was used to perform the compaction tests. The obtained curve does not show the usual shape of these curves. It is flat, which means there is not a clear optimum water content. Pusch (2001) obtained similar results after carrying Proctor compaction tests with distilled water on the homogeneous Tertiary Friedland clay from North Germany. None of the authors provided an explanation for this response. Nevertheless, two modified Proctor tests were performed in the UPC laboratory and the results were significantly different. At first, the

Chapter 3: Backfill experimental study
50
backfill after the mixing was compacted and the result was 19.5 kN/m3 at 11.73% of water content. Then, some backfill was air-dried in a room for two weeks until no variation of mass was observed and finally compacted and the dry specific weight was 18.14 kN/m3 and the water content was 5.74%. No more modified Proctor tests were carried out in order to save material for other tests and moreover, backfill was not compacted in the barrier at this energy level. After these results, UPC studied backfill compaction properties by means of Standard Proctor tests. In order to take into account the effect of salt water on backfill compaction behaviour, salt water was added to the backfill and compacted. Very few references have dealt with salt water effects on the compaction behaviour of clayey soils (Ridley et al. 1984 and Barbour & Yang, 1993). In the work by Ridley et al. effects of 30% NaCl brine on hydraulic conductivity of six Canadian clays were studied. Three clays had montmorillonite as dominant mineral in the clayey fraction and the other three had illite and kaolinite as dominant clay minerals. Particularly, effects of brine on compaction behaviour of two of these clays were also investigated. Figure 3.26 shows the results of Standard Proctor tests carried out in an active clay (SS in the figure, 82% of clay content and limit liquid of 83%) and an illitic clay (WG in the figure, 34% of clay content and limit liquid of 24%). From these results it could be checked that for soil WG the chemical effects of brine were not relevant, however, soil SS presented a strongly dependent behaviour on the permeant used to carry out the tests. When the active soil was compacted with distilled water (virgin) the optimum water content was 29.6% and the dry specific weight was 13.64 kN/m3. When the active soil was compacted with specimens soaked in brine the optimum water content was 26.1% and the dry specific weight was 14.50 kN/m3. Brine clearly decreased the optimum water content and increased the dry specific weight. Double layer theory can be used to explain qualitatively this response. Brine decreases the double layer (equation 1) because of an increase of n0 (the electrolyte concentration). When this happens, soil particles are closer among them and thus the structure can be more compacted at the same level of energy if compared with a distilled water structure. Moreover, the water absorption capacity of the clay fraction is reduced. Barbour & Yang (1993) speculated that the true effective stress transmitted to the soil skeleton could be greater due to the reduction of repulsive forces between clay platelets because of salt concentration increase. Following the previous work carried out by Clay Technology, simple and double energy Standard Proctor tests were performed in the backfill. Backfill was compacted in three layers in a cylindrical cast of one litre of volume. Twenty-five blows were applied to each layer with the mass of two and half kilograms. The height of the impact was 30.5 cm. The maximum backfill grain size is 20 mm that it is just the limit set by Jiménez Salas & Justo (1975) as boundary between the modified proctor test and the standard proctor test. The applied compaction energy by means of this test is 558.6 kJ/m3 in the single energy tests and 1117.2 kJ/m3 in the double energy tests. Distilled water (electric conductivity < 20 µS/cm) and 16 g/L (electric conductivity = 26700 µS/cm) salt water were used. Salt water contained NaCl and CaCl2 (50/50 by mass). Soil was dried in a room where relative humidity was approximately 50% until water content was around 7% - 8%. Then, backfill was hydrated with different water (distilled or salt water) by adding some water until the water content was increased in one or two percent each step. Figure 3.27 shows the compaction curve at both energy levels for distilled water and figure 3.28 shows the same results for salt water (16 g/L of salt content). From the tests performed with distilled water can be concluded that at single energy the shape of the curve presents a clear optimum. However, it seems that when energy is increased, the curve gets a flatter shape

Chapter 3: Backfill experimental study
51
above all in the dry side of the curve. Moreover, the optimum water content decreased when double energy was provided compared to calculated one with simple energy. When salt water was used in the tests, similar optimum water contents were observed at both levels of energy (around 14.3%). At water contents higher than 18%, corresponding to 86% of degree of saturation, both lines were really similar. All the compaction curves are close to the zero air voids lines for high water contents. Table 3.5 shows the optimum water content and dry specific weights for the four curves.
Distilled water Salt water w (%) γd (kN/m3) w (%) γd (kN/m3) Simple energy 17.2 17.2 14.3 17.7 Double energy 15.0 18.0 14.3 18.1
Table 3.5: Summary of the optimum water content and dry specific weight obtained after the Proctor compaction tests with distilled and salt water. Figure 3.29 shows the comparison of results for distilled water and salt water when backfill was compacted with simple energy and figure 3.30 shows the same comparison when double energy was provided during the compaction process. At single energy, dry specific weight obtained with backfill hydrated with salt water was higher than obtained one when backfill was hydrated with distilled water. Differences between the compaction curve obtained for distilled water and salt water were more important at simple energy, than differences observed in those curves obtained at double energy. This means that chemical effects on compaction curves were also strongly dependent on the applied compaction energy. The higher the energy applied, the lower the observed chemical effects on the compaction curve (at this salt water concentration). The observed behaviour was the same as the measured by Ridley et al. (1984). The addition of salt water can change the fabric or the arrangement of clay particles. For instance, by hydrating with salt water, the fabric could be more aggregated (figure 3.19b) than the fabric obtained by hydrating with distilled water. This difference between fabrics could explain the higher compaction effectiveness when backfill was hydrated with salt water. 3.5 WATER UPTAKE TESTS Water uptake tests were performed in this backfill in order to study the saturation process. Influence of different salt contents in the hydration water used to saturate the specimens on backfill hydraulic conductivity was the main goal of this study. Clay Technology performed tests on dynamically compacted specimens from 1997 to 1999 and CIEMAT performed tests on statically compacted specimens from 2001 and 2002. Unsaturated backfill specimens were connected to water repositories (approximately to atmospheric pressure) and water content was measured after the beginning of the saturation process. The technique used to determine the backfill unsaturated behaviour was a variation of the instantaneous profile method as reported by Klute (1972). Using a finite element simulator the evolution of water content was reproduced and compared with the measurements. In this way, backfill hydraulic parameters were back-analysed by trial error (further detailed in chapter 5). Water uptake test has proven to be reliable to estimate unsaturated hydraulic conductivity of sandy and clayey soils (Elzeftawy & Cartwright, 1981; Hamilton et al. 1981). In our case, profiles of water content were measured instead of suction profiles as proposed by Elzeftawy & Cartwright, (1981) or Hamilton et al. (1981). No evolution of suction was

Chapter 3: Backfill experimental study
52
measured in any of the performed tests. However, water volume inflow was measured in tests performed by CIEMAT. The water uptake tests consisted of a cylindrical specimen, confined in an impervious tube that was set in vertical position. Total or matric suction was not measured along the axis of the specimen, but such information would have been useful in the numerical study of the results. Water flow was induced by injecting water in the bottom of the specimen at atmospheric pressure. The opposite end of the permeameter was impervious to water. After a period of time, the specimen was extruded from the tube and cut in slices. Finally, water content of each slice was measured by means of the oven-drying technique. 3.5.1 Statically compacted soil specimens. CIEMAT performed some water uptake tests in 2001 and 2002. The aim of this study was to check out the influence of salt water on backfill hydration process and the unsaturated backfill hydraulic conductivity (CIEMAT, 2002). The water uptake tests were performed in two stainless steel cells 15.0 cm in internal diameter and height of 12.9 cm consisting of a cylindrical body, a cover and a base joined by bolts. Backfill was axially compacted directly within the cell in just one layer with a 50 Tn press. Compacting pressure between 1.0 and 1.5 MPa was necessary to compact the backfill up to a dry specific weight of 16.7 kN/m3. Figure 3.31 shows some backfill within the cylindrical body prior to its static compaction. A porous stone and filter paper were placed between the hydration surface and the specimen. The hydration inlets were connected to a water deposit placed 1.5 m above. Between the deposit and the cell an automatic volume change apparatus with an accuracy of 0.001 cm3 was installed, connected in turn to a data acquisition system. The scheme of the layout is shown in figure 3.32. In the case of saline water infiltration, an intermediate deposit is placed between the automatic volume change apparatus and the cell. The hydration water has been either distilled or saline. In the last case, salinity of water was 1.2% (12 g/L) and it was obtained by mixing CaCl2 and NaCl in a weight ratio 32/68. The chemical analysis of salt water used in the water uptake tests provided 3.0 g/L of Na+ and 1.4 g/L of Ca2+. Different specimens were prepared and connected to the water repository during 240, 600, 1200 and 2400 hours. At the end of the each period of time, the specimen was extracted from the cell, measured, weighted and cut into 5 sections. Water content was determined in each of these sections and, in some tests, the dry specific weight as well. Water content is obtained by oven drying for 24 hours at 110 °C. Dry specific weight was determined by immersing samples in a recipient containing mercury and by weighing the mercury displaced. After the completion of all the tests, it was considered necessary to check the initial variability of dry specific weight along the specimen. For that reason, another specimen was compacted in the same way the other specimens had been prepared. After compaction, the specimen was kept inside the hermetic cell for 20 days and afterwards, it was extracted and cut into five sections, the dry specific weight and water content of each section were determined. Due to the inconsistency of backfill (that kept their initial low water content, as the specimen had not been saturated), the paraffin method was chosen to determine the dry specific weight. It consisted on the determination of the volume of a sample of known weight by coating it with paraffin (bulk specific weight 8.82 kN/m3) and weighing it first in air and then again while immersed in a liquid of known density (distilled water), making use of the Archimedes’ principle. The values of dry specific weight estimated showed that density in the upper five centimetres (those closer to the compaction surface and far away from the hydration surface) were higher (18.23 kN/m3 – 17.54 kN/m3) than those found in the rest of the block (16.85 kN/m3), which

Chapter 3: Backfill experimental study
53
do not show further variations. The non-homogeneity of the initial dry specific weight was mainly due to friction with the compaction mould during of backfill static compaction. Another factor could help to introduce such a profile of dry specific weight is the swelling of backfill in the area close to the saturation inlet. However, it is believed that backfill swelling capacity is not so high to be the only factor producing the measured variations of dry specific weight. Because of this reason the tests performed by Clay Technology AB and CIEMAT for the same salinity content (12 g/L) are not comparable because those performed by CIEMAT have a non-homogeneous initial dry density distribution. As a result, higher porosity in the side of the water inlet (the side where compaction effort was less effective because of friction) and also higher water content at saturated state were measured. It is important to point out that a different ratio of NaCl/CaCl2 existed between water uptake tests performed by CIEMAT and Clay Technology AB in the hydrating water used to saturate the specimens (68/32 by CIEMAT and 50/50 by CT). Figure 3.33 shows the comparison of the injected volume of water in a water uptake tests performed with salt water and another one performed with distilled water. It was clear that water salinity speeded up the saturation of backfill. It was clear that a leakage of water, as most likely reason, during the tests after calculating the injected flow rate. A leakage of 0.1 cm3/h was estimated by deriving the variation with time of the injected volume of water and it could be produced by a leakage or due to evaporation of water. The calculated leakage was very similar in both tests for distilled and salt water, which means that it could be present in all the specimens and produced by the same reason. Evolution of water content in each section in the specimens hydrated with distilled water at different times after the beginning of the tests is shown in figure 3.34 and figure 3.35 depicts the evolution of water content of specimens hydrated with salt water for each section. Figure 3.36 shows the measured distribution of dry specific weight for specimens hydrated with salt water. It also shows the initial distribution of dry specific weight after compaction. Water content of backfill used to study the effect of the compaction procedure was 7.5%, drier than backfill used for the water uptake tests (10%). Therefore, measured initial dry specific weights after compaction were a little bit higher than those estimated from wetter backfill specimens. Figure 3.37 shows one of the specimens after being hydrated for 100 days with distilled water. 3.5.2 Dynamically compacted soil specimens Clay Technology performed a number of water uptake tests from 1997 to 1999 in order to estimate the time required for full backfill saturation due to its importance for the schedule of the Backfill and Plug Test Project (Börgesson et al. 1996; Johannesson et al. 1999; Clay Technology, 1998 and Clay Technology, 1999). Specimens, 10 cm height, were dynamically compacted in five layers in a proctor cylinder 10 cm height at a dry specific weight of 17.15 kN/m3. The cylinder, 115 mm in diameter, was placed on a bottom plate with a filter. A piston was then placed on the top of the specimen and a total pressure applied to the specimen by loading the piston. The bottom of the specimen was connected to a water repository with a pressure of 5-7 kPa. Water supply was interrupted at a specified time ant water content determined at different distances from the water inlet by cutting the specimens in slices. Salt concentration of hydrating water was changed in order to study the effects of different salt water concentrations on unsaturated hydraulic conductivity of backfill. NaCl and CaCl2 were added to prepare the different electrolytes used in these tests. The ratio was always 50/50 by weight in all the electrolytes prepared. Effects of different initial water content of backfill (6%
Chapter 3: Backfill experimental study
54
and 13%) were also investigated, but only the results of 13% of water content are shown in this thesis. Figures 3.38 and 3.39 show the evolution of backfill water content when salt water content in hydrating water varied from 6 g/L to 24 g/L after 198 and 1007 hours of the beginning of the saturation process. From these tests, it was clear that the higher the salt concentration, the faster the saturation of the specimens. However, it can be observed that the measurement of water content was not easy because of the problems when backfill specimens were cut in slices. Big particles of crushed granite made really difficult this study and the results showed some scatter. Water uptake tests performed by Clay Technology were numerically simulated in order to find the backfill unsaturated hydraulic conductivity and the liquid phase relative permeability. The results of the simulation will be detailed in chapter 5. Results of water uptake tests performed by CIEMAT were not performed as a non-uniform profile of dry specific weight existed after the compaction process of the specimen by static loading. 3.6 BACKFILL WATER RETENTION BEHAVIOUR Backfill retention properties were studied at first by Clay Technology AB (Johannesson et al. 1999) and later by UPC (Mata & Ledesma, 2002) due to the observed backfill heterogeneous behaviour and the importance of this property when studying the unsaturated behaviour of the mixture. The study performed by UPC was focused on the osmotic suction of sodium bentonite and granular material mixtures. Different techniques were used to study the retention properties of such mixtures. 3.6.1 Tests performed by Clay Technology. Clay Technology used the vapour transfer technique and transistor psychrometers (Wescor PST-55) to measure backfill total suction and backfill matric suction was studied by means of suction plate tests. The vapour transfer technique was used, at the beginning, to analyse the water retention properties of the backfill. Table 3.6 shows the saturated salt solutions used, the relative humidity each solution can impose at 20ºC and the calculated total suction applied assuming the psychrometric law by means of Kelvin equation. Compacted and non-compacted backfill specimens were studied under these conditions and moreover, salt water content was also taken into account in the tests carried out. The results obtained are shown in figure 3.40. Some important features could be observed: the hysteretic behaviour of the retention curve is clear and differences between drying and wetting conditions were important. Retention curve of specimens used in wetting paths and hydrated with salt water was below the retention curve obtained in specimens hydrated with distilled water. This is an unexpected result because total suction was supposed to be higher in specimens hydrated with salt water due to the higher osmotic suction. However, revising the procedure followed by Clay Technology, the differences could be attributed to some scatter. At first, specimens were oven dried at 105ºC. Then, Äspö water was added (12 g/L of salt content) to the initial water content (low in a wetting path and high in a drying path). When specimens are within the recipients, water vapour is transferred to the specimens or to the recipient under steady relative humidity conditions. Water vapour is mainly adsorbed in soil structure in the liquid phase or free water evaporates from the specimen. In this way, a wetting path cannot be performed by increasing the salt concentration of water in the pores. Therefore, this procedure yields a somewhat inconsistent situation at equilibrium, since the

Chapter 3: Backfill experimental study
55
change from initial water content to equilibrium water content is made with salt free water, which means that the salt concentration in the pore water will be higher in the drying tests and lower in the wetting paths (Johannesson et al. 1999). Finally, the effect of the compaction process on the backfill water retention properties seemed to be unimportant at low water contents and more important at higher water contents. This result is somehow surprising. As the bentonite content increases in a mixture, it is expected higher total suction at higher dry specific weight as it was measured in water retention tests performed in bentonite-sand mixtures (figures 3.3 to 3.6). However, it is possible that the range of relative humidity induced by using the saturated salts is low for this soil (81.3 to 94 %) and therefore, backfill water content is also low and water is mainly stored by adsorption in the bentonite and not stored by capillarity, as capillarity (weak bounded water) is a mechanism directly related to dry specific weight, while adsorbed water (strong bounded water) is a mechanism directly related to type of clay and its content in the mixture.
Salt Solution
Relative Humidity
(%)
Total Suction (MPa)
(NH4)2SO4 81.3 28.03KCl 85.4 21.37
BaCl2 89.8 14.56KH2PO4 94.0 8.37
Table 3.6: Saturated salt solutions used in the determination of wetting and drying paths in the backfill (Johannesson et al. 1999). Transistor psychrometers were used to measure the backfill total suction in specimens hydrated with distilled water and salt water (1.2% of salt). Wescor PST-55 psychrometer was used in this determination. The measuring range of this device is from 6000 kPa to 500 kPa. Figure 3.41 shows the comparison between the drying retention curve of backfill specimens hydrated with salt water containing 1.2% of salt and the drying retention curve of backfill specimens hydrated with distilled water. The wetting retention curve was not studied by means of psychrometers due to the difficulties of adding water to such a mixture. Measurement of backfill matric suction was performed by using the filter paper technique and the suction plate technique. Both kind of waters, saline and distilled, were used when hydrating the backfill specimens. A compilation of all results obtained with different techniques is shown in figure 3.42 (Clay Technology, 2000). The results presented some scatter, however, it can be concluded that osmotic suction introduced by injected salt water to saturate the specimens was about 1 MPa. The added salt content to injecting water was in all cases 1.2% (12 g/L). 3.6.2 Tests performed by UPC The aim of these tests was to characterise the osmotic suction in the backfill. The backfill osmotic suction was not estimated directly because of the big size of the granite particles. The size of the soil specimens needed for this test would be too big and equilibrium times for the vapour transfer technique would be prohibitively long. To overcome this problem, crushed granite was substituted by sand, decreasing the size of the necessary specimens. With this substitution, transistor psychrometers and vapour transfer technique could be used and time to

Chapter 3: Backfill experimental study
56
perform the tests became reasonable. Osmotic suction was assumed, as usual, independent on soil structure. It was expected that the influence of this substitution of crushed granite rock by sand was unimportant when adsorption was the main storage mechanism (strongly bounded water). But it could be important when the main storage mechanism in the soil structure was capillarity (weakly bounded water). The drying retention curve was measured by means of transistor psychrometers under free shrinkage conditions. The main wetting curve was determined by vapour transfer in a suction controlled atmosphere, by means of different salt solutions under free swelling conditions, after a long period to reach equilibrium. Determination of the osmotic suction was also performed in this bentonite-sand mixture. The sand mixed with pure bentonite used for the determination of the retention curve was uniform poorly graded beach sand (D10 = 0.15 mm and D60 = 0.25 mm). Its air entry value varied from 2 to 5 kPa (γd = 14.4 kN/m3) and its particle unit weight was 26.0 kN/m3. The sand was washed with distilled water (electric conductivity < 3 µS/cm) to take out the salts and impurities that might have been present and then oven dried. Sand was assumed to be an inert material in these tests. 3.6.2.1 Drying path of MX80 – sand mixture The drying path was obtained by means of SMI type transistor psychrometers (Woodburn et al. 1993). The hygroscopic water content of the bentonite was 10.9% and the hygroscopic water content of the sand was 0.1%. They were mixed at this initial water content. Salt water with 6 g/L was added in stages as mixing was continued until the correct proportion was reached depending on the desired dry specific weight (16.6 kN/m3) and the initial water content (12%). When this water content was reached, salt water with 16g/L was added until saturation (water content of 22.6%). Once the mixture was hydrated, it was cured in a controlled humidity room for a minimum of 48 hours. Then was statically compacted in a strain-controlled press. Height of specimens was 10 mm and diameter was 50 mm. Two soil tubes were inserted in this soil specimen, extracting the final soil samples. The rest of the soil sample was used to calculate the water content at the saturated state. Size of soil samples used in these tests was 10 mm of height and 15 mm of diameter. Once the samples were compacted and placed at the soil tubes, the initial total suction was measured (this value would correspond to osmotic suction because matric suction can be assumed as zero). Two points of the drying curve were obtained each day. Three hours were left with the soil specimen tube open in a temperature controlled room (22 ± 1ºC and an average relative humidity of 47%) before measuring the suction and the water mass loss by evaporation, which means the ending of the first step of this multi-step path. Three hours later another measurement was taken. At night, the soil specimen tubes were carefully sealed with plastic bags to prevent the evaporation of water in an uncontrolled manner. 3.6.2.2 Wetting path of MX80 – sand mixture The wetting path was obtained from specimens prepared in the same way as in the drying path. Once the specimens were hydrated and compacted, they were left in a room where the relative humidity was 47%. When no more water losses were observed in the different soil specimens, the initial water content was measured. The soil specimens were then introduced in sealed containers with different salt solutions. In this way relative humidity was imposed in the small volume of each container. One month was left for equilibration of the soil

Chapter 3: Backfill experimental study
57
specimens. After that month, the soil specimens were retired and weighted to calculate the final water content. Table 3.7 summarises the used salts and the applied total suctions to soil specimens using the psychrometric law.
Salt Solution Total Suction (MPa)
Mg(NO3)2 (saturated) 84.01
NaNO2 (saturated) 57.01
(NH4)2SO4 (saturated) 24.51
CaSO4 (saturated) 12.81
KNO3 (saturated) 8.41
NaCl (1.39 mol/kg H2O) 6.32
NaCl (0.89 mol/kg H2O) 4.02
NaCl (0.46 mol/kg H2O) 2.02
Table 3.7: Salts used in the determination of the main wetting path of the bentonite-sand mixture. (1 Suction and concentration for saturation available in Lide & Frederikse, 1997). 2 Suction and concentration available in Romero, 1999). Figure 3.43 shows the retention curve and the hysteretic behaviour of the mixture. The represented dots are the average of twelve measurements in the case of the drying path and four measurements in the wetting path. This figure also shows the comparison between the measured wetting retention curve by UPC in MX-80 sodium bentonite/sand mixture and the measured one by Clay Technology in the backfill considering matric suction. Measured in situ data confirms that total suction is around 3.0 MPa (Clay Technology, 2001). This value agrees with the measured values at similar degree of saturation (50-55%) in the bentonite-sand mixture. From the drying and wetting paths performed in the sodium bentonite-sand mixture, the osmotic suction close to the saturated state could be estimated as 1.7 MPa. Therefore, osmotic suction was defined as a constant value. This constant value was subtracted to the wetting retention curve measured after substituting the crushed granite by sand. In this way, the matric suction of this new mixture was estimated and compared with matric suctions measured by Clay Technology, observing a reasonable agreement. 3.7 OEDOMETER TESTS Six consolidation tests were performed in statically compacted specimens. The equipment used for these tests was a modification of the well-known Rowe’s cell. Two stainless steel (AISI 316L) cells were designed, built and used to carry out these oedometer tests. Diameter of the cells is 152 mm. The maximum load applied was about 2 MPa in all the consolidation tests. Figure 3.44 shows the general layout of the test. A rigid plate was placed on the porous stone at the top of the soil specimen to assure the equal strain in the soil specimen. The rigid plate has four holes, which allow passing water from or to the soil specimen. Due to the small diameter of the piston, the contact between the piston and the plate is not rigid. This means the plate rotates depending on the swelling of the specimen. Figure 3.45 shows the scheme of the used Rowe’s cell. Deformation of the two cells was calibrated to take it into account when calculating soil compressibility. Figures 3.46 and 3.47 show the cell deformation measured prior to the tests. These cell calibrations were performed with a steel rigid plate inside each cell. The main problem of the Rowe’s cell appears when the saturation of the backfill is

Chapter 3: Backfill experimental study
58
checked. It is very difficult to measure correctly the Skempton’s B parameter (Skempton, 1954) and important deformations may be applied to the soil when measuring this parameter because of the design of the cell, especially when the density of the soil is low. Three different solutions were used to saturate the backfill: 0 g/L (de-ionised water), 6 g/L and 16 g/L salt concentration by adding NaCl and CaCl2 (50/50 by mass). De-ionised water had an electrical conductivity, EC, lower than 20 µS/cm. Two initial dry specific weights (or packings) were tested (13.7 and 16.6 kN/m3). The height of the specimens was approximately 50 mm. Specimens were saturated from bottom to top with water with different salt concentrations. During saturation, null total vertical strain of backfill was set, thus an external load was applied depending on the measured vertical displacements. In this way, a swelling pressure, ps, as the difference between applied external air pressure and water pressure in the backfill, was determined. After saturation, more than 1200 hours in all cases, consolidation tests started from swelling pressure as initial effective stress in the specimens. Double drainage of the soil specimens was allowed to speed up the consolidation process. Initially it was assumed that a consolidation step was finished when vertical deformation velocity was less 5 µm/day (specimens 2 and 3), but this limit was increased up to 20 µm/day (specimens 1, 4, 5 and 6) since the previous limit produced very long loading steps (more than 300 hours). Heterogeneous behaviour was found when measuring the initial water content in some samples. Initial water content after the mixing process of backfill in Sweden was 13%, but in some samples smaller water contents were measured (9.45%, specimen number 5) due to heterogeneous behaviour and some evaporation after being stored some years. These differences in water content produced important changes at the initial conditions of the compacted specimens. Table 3.8 summarises the conditions of the six backfill specimens after compaction process (ac superscript) and after saturation process (as superscript). The Casagrande’s log t method (Casagrande & Fadum, 1940) was used to estimate the consolidation coefficient at both dry specific weights. The method provides with similar consolidation coefficients from those calculated from pore water pressure dissipation measurements and it can be used to estimate the consolidation coefficient in the absence of pore water pressure data (Robinson, 1999). However, at the low dry specific weight the Terzaghi’s approach is only an approximation as vertical strain was up to 28% of the initial height of the specimens.
Specimen Number
acdγ
(kN/m3) w0 (%)
eac eas Salt Conc. permeant (g/L)
1 16.7 10.57 0.577 0.571 0 2 16.9 12.13 0.551 0.543 6 3 17.1 12.63 0.534 0.531 16 4 13.8 10.60 0.916 0.905 0 5 14.7 9.45 0.805 0.805 6 6 13.5 12.04 0.938 0.822 16
Table 3.8: Initial conditions of the six backfill tested specimens in oedometer tests.
During the saturation process, some outgoing fluid was collected from specimens 1, 2 and 3 and chemically analysed. Predominant ions Na+, Ca2+ and Cl- concentrations, pH and electrical conductivity were determined. Oxidation of both cells occurred in the last tests and a big amount of ferrous salts appeared in the water flowing out the specimen while saturation. For that reason, chemical analysis of collected water from specimens 5 and 6 were not performed. The squeezing technique can be used to determine the pore water composition and

Chapter 3: Backfill experimental study
59
osmotic suction (Iyer, 1990; FEBEX, 2000). However, this method was not employed here and only collected water from the saturation process was analysed. These analyses clearly showed that exchange reaction between Na+ and Ca2+ existed. 3.7.1 Swelling pressure Measured swelling pressure was strongly dependent on dry specific weight. Specimens compacted at the low dry specific weight mainly presented a non-swelling behaviour. Only the specimen number 4 (de-ionised water and 13.7 kN/m3) had 23 kPa of swelling pressure. No swelling pressure for specimens 5 and 6 was measured, thus, swelling was affected by salt concentration at this dry specific weight. Swelling behaviour of compacted specimens at high dry specific weight also showed a slightly sensitive decrease of swelling pressure as water salinity increased. It can be noticed a small decrease in the swelling pressure measured for specimen 3 (16 g/L salt concentration) compared with specimen number 1 (de-ionised water). However, due to the low backfill bentonite content (30%) and range of salinity in this problem (up to 16 g/L), swelling pressure is not strongly dependent on water chemistry in these conditions. Figures 3.48 and 3.49 show the evolution of measured displacements during the saturation process of specimens 1 and 3. The procedure tried to keep those vertical displacements close to zero by applying external loading Table 3.9 summarises the obtained swelling pressure at the six specimens. Swelling pressure, ps, was calculated as the difference between the applied air and water pressures a total nil strain during saturation of the specimens.
Specimen number
1 2 3 4 5 6
sp (kPa) 196 202 183 23 ns ns Table 3.9: Swelling pressure, ps, measured for the six backfill specimens. NS means no swelling pressure was measured. 3.7.2 Void ratio vs effective stress relationship. Figures 3.50 and 3.51 show the consolidation evolution of the applied loading steps at specimens 1 and 3 once saturated. In average, every loading step lasted more than 200 hours due to the low permeability of this backfill and big size of the soil specimens. Figures 3.52 and 3.53 show the measured effective stress – void ratio relationships for the six soil specimens (16.6 kN/m3 and 13.7 kN/m3 respectively). It can be noticed from the experimental results that the change in water chemistry does not alter the mechanical behaviour or the measured compressibilities. The pre-consolidation stress, '
cp , can be estimated for the six specimens from these results (table 3.10). The pre-consolidation stress was around 250 kPa in all soil specimens compacted at the high dry specific weight. This value is directly related to the static compaction process. The pre-consolidation stress was strongly dependent of the followed stress history during the saturation process at the low dry density for the three specimens.

Chapter 3: Backfill experimental study
60
Specimen number
1 2 3 4 5 6
'cp (kPa) 250 250 250 128 40 44
Table 3.10: Pre-consolidation pressure, '
cp , measured for the six backfill specimens.
Soil compressibility was calculated as:
( )( ) ( )
2 1' '
1 2 1
- -1 -v
e em
e σ σ=
+ ⋅ (16)
where e2 – e1 is the variation of void ratio when soil is vertically loaded from σ1 to σ2. Figures 3.54 and 3.55 show the calculated compressibilities plotted against medium void ratio calculated as the medium value between e1 and e2. Backfill compressibility in the unloading and reloading paths is not shown because of the scatter of the results obtained and therefore, only the results of the loading processes have been depicted. Compression index, Cc, is shown in figures 3.56 and 3.57 for all soil the six specimens. The average value, Cc = 0.1, is typical of clayey soils even for the high percentage of particles bigger than 0.074 mm present in the backfill (figure 3.24). The most interesting result is that backfill compressibility was not dependent on water chemistry for this bentonite content, dry specific weights considered or range of salinity used in the water added to saturate the specimens. No secondary compression was observed during the consolidation steps of the six backfill specimens. 3.7.3 Consolidation coefficient The consolidation coefficient was calculated by means of Casagrande’s log t method. Thus, t50 is used to estimate the consolidation coefficient.
2
50
0.196v
HCt
= (17)
Figures 3.58 and 3.59 show the evolution of the consolidation coefficient for both dry specific weights plotted against void ratio variation. Variation of the consolidation coefficient is lower than one order of magnitude at the high dry specific weight. Variations of this parameter at the low dry specific weight are higher (more than two orders of magnitude). Tendency of curves corresponding to specimens 1, 2, 4, 5 and 6 are in agreement with normal response: important changes for applied stresses smaller than the pre-consolidation stress, and smooth variations for stresses larger than the pre-consolidation stresses. Curve corresponding to specimen number 3 (16 g/L and 16.6 kN/m3) presented important deviations from the expected response. These deviations were due to the evolution of monitored t50 in this soil specimen.

Chapter 3: Backfill experimental study
61
3.7.4 Hydraulic conductivity Hydraulic conductivity was, then, estimated from the measured soil compressibility and the estimated consolidation coefficient as v v wk C m γ= . The estimated variation of hydraulic conductivity at both dry specific weights is depicted in figures 3.60 and 3.61. Only the variation when the specimens were loaded is shown here. It is clear that pore fluid chemistry strongly influences the backfill hydraulic behaviour at both dry specific weights. Hydraulic conductivity increased up to 6 times at the high dry specific weight and 16 g/L salt concentration when compared with estimated ones from the specimens hydrated with de-ionised water, and almost two orders of magnitude at the low dry specific weight. For virgin states and dry specific weight of 16.6 kN/m3, the natural logarithm of saturated hydraulic conductivity was found to depend linearly on void ratio from 0.6 to 0.3, for different salt concentration in water used to saturate the specimens. Results of specimens 4, 5 and 6, corresponding to the low dry specific weight could be not representative during the firsts load steps. The confining stress is almost negligible in the three specimens and flow through the wall of the rigid permeameter could occur at low confining pressure (i.e. at low vertical loading)
ln k = 10.798·e - 32.426 C = 0 g/Lln k = 12.151·e - 32.498 C = 6 g/Lln k = 16.477·e - 33.350 C = 16 g/L
(18)
Table 3.11 shows a comparison of the estimated results for the six specimens at a void ratio of 0.5 while they were loaded. Similarities between comparable specimens, 1-4, 2-5 and 3-6 (same salt permeant concentration) are evident. Hydraulic conductivity and consolidation coefficient show clearly their dependency on void ratio and fluid-chemistry while measured compressibilities depend mainly on void ratio and initial stress state.
Specimen Number
eas Salt Conc. (g/L)
e k (m/s)
vm (MPa-1)
vC (m2/s)
1 0.571 0 0.5 1.8⋅10-12 0.125 1.5⋅10-9 4 0.905 0 0.5 1.1⋅10-12 0.100 1.1⋅10-9 2 0.543 6 0.5 3.5⋅10-12 0.130 2.6⋅10-9 5 0.805 6 0.5 5.9⋅10-12 0.300 2.0⋅10-9 3 0.531 16 0.5 1.0⋅10-11 0.130 9.0⋅10-9 6 0.822 16 0.5 2.7⋅10-11 0.300 9.0⋅10-9
Table 3.11: Estimated results by using the Casagrande’s t50 method for the six specimens at a void ratio of 0.5. eas is the void ratio after saturation. 3.8 SATURATED PERMEABILITY Backfill saturated permeability has been determined by Clay Technology and UPC by using different methods. In this chapter direct measurements performed by Clay Technology will be described and in chapter 4 the tests performed by UPC. The tests carried out at UPC were somehow different to those performed by CT as a specimen was compacted in a cylindrical cell and a new mini-piezometer was placed within the specimen and radial flow tests were carried out. In this way, constant head tests and variable head tests (pulse tests) were

Chapter 3: Backfill experimental study
62
performed, and backfill saturated hydraulic conductivity was estimated from both kinds of test. Clay Technology used different equipments in order to study the backfill hydraulic conductivity: triaxial equipment and rigid wall permeameter of a different diameter as, for instance, Rowe’s cell (250 mm). Backfill was compacted in layers at different densities and saturated while loaded to an external load close to the expected backfill swelling pressure. In this way, vertical displacement should be small and no important volumetric change should be measured. After the saturation of the specimens, a hydraulic gradient was applied and the intake and outgoing flow of water were measured and used to estimate the permeability. After steady conditions had been reached, the external load was increased and the specimen consolidated. Finally, another flow test was performed when no more vertical displacements were observed. A summary of the determinations of backfill permeability is shown in figure 3.62 and these results are compared with those obtained in the oedometer tests performed by UPC in figure 3.63. While the agreement of backfill permeability when specimens were saturated with distilled water is good if results by Clay Technology and UPC are compared, large differences appear when specimens were saturated with salt water. Clay Technology measured even higher differences between backfill hydraulic conductivity when specimens were saturated with distilled water or saturated with water containing salt, than differences estimated from oedometer tests performed by UPC. Moreover, salt content added to water (up to 16 g/L) by UPC was bigger than salt content at the so-called Äspö water (12 g/L). It is not easy to theoretically explain such a big difference calculated by Clay Technology at this range of salinity, dry specific weight (higher than 16.6 kN/m3 in all cases) and bentonite content (30%). These differences could be attributed to leakages appeared while performing the tests, and also because of the problems that rigid wall permeameters can provoke when measuring the hydraulic conductivity at low confining pressure. It has to be point out that performing flow tests when salt water is injected complicates the necessary layout due to corrosion. 3.9 CHEMICAL ANALYSIS OF PORE WATER Some chemical analyses were carried out the pore fluid obtained from some compacted backfill specimens. At first, some water, collected from three specimens placed at the oedometer cells during the saturation of the specimens, was chemically analysed. On the other hand, some aqueous extracts were performed in compacted backfill specimens (CIEMAT, 2002). Evolution of Ca2+ and Na+ was studied in specimens permeated with salt water and distilled water. The results also confirmed the importance of the ion exchange reaction between Na+ and Ca2+. 3.9.1 Collected water from oedometer tests Chemical analyses of outgoing fluid during the saturation process of specimens numbers 1, 2 and 3 were preformed. Concentrations of predominant species as sodium, calcium, potassium, magnesium, chloride, bicarbonates, sulphates, nitrates and nitrites were determined and pH and electric conductivity, EC, were measured as well. The results show an enrichment of sodium concentration and an important decrease of calcium concentration measured in the outgoing pore water. The sodium enrichment is controlled by the cation exchange of sodium by calcium. It means that the sodium bentonite is transforming into a calcium bentonite.

Chapter 3: Backfill experimental study
63
Tables 3.12 and 3.13 show the results of chemical analysis of mixing, incoming and outgoing water. An important increase in the concentration of sulphates is also noticed. Gypsum, as a secondary mineral, gets dissolved when the bentonite is hydrated. Nitrates and nitrites have an uncertain origin, however, nitrate concentration was higher than, for example, bicarbonate concentration. Possible reasons could be fertilizers used in the excavation area, organic substances or acid treatment (Muurinen, 2001).
Water Na+
(mg/L)Ca2+
(mg/L)Mg2+
(mg/L)K+
(mg/L)EC
(µS/cm) pH
6 g/L mixing 1391.8 1077.5 - - - - De-ionised water 3.0 5.6 2.6 0.0 20 7.9 Specimen number 1 6078.8 460.9 48.6 111.2 22800 7.2 6 g/L incoming 1269.2 1162.3 9.7 1.5 11000 6.5 Specimen number 2 6012.0 497.0 51.1 79.4 22000 7.2 16 g/L incoming 4141.6 2468.9 2.4 2.3 26700 7.0 Specimen number 3 7281.2 958.0 143.5 127.1 33600 7.4
Table 3.12: Results of the chemical analysis performed in pore water collected from soil specimen numbers 1, 2 and 3. Clay Technology (1999) provided data of 6 g/L mixing water.
Water Cl− (mg/L)
HC 3O− (mg/L)
S 24O −
(mg/L)N 3O−
(mg/L)N 2O−
(mg/L)I
(mol/L) C
(mol/L)6 g/L mixing 3104.5 - - - - - - De-ionised water 14.2 30.5 1.7 0.8 0.0 0.0009 0.0013Specimen number 1 3467.0 115.9 8516.0 594.8 23.5 0.3928 0.47906 g/L incoming 4310.7 42.7 10.2 0.8 0.0 0.1472 0.2069Specimen number 2 4948.5 85.4 4767.0 228.3 12.1 0.3324 0.472716 g/L incoming 11032.0 36.6 12.7 1.6 0.0 0.3688 0.5534Specimen number 3 10628.0 158.6 4621.0 524.4 60.1 0.4712 0.7095
Table 3.13: Results of the performed chemical analysis on collected pore fluid from soil specimen numbers 1, 2 and 3. Clay Technology (1999) provided data of 6 g/L mixing water. I = 20.5 i iC z∑ is the ionic strength in
mol/L and zi is the charge of the ion. iC C=∑ is the total molar concentration of chemical species in the pore fluid. It is important to notice the high concentration of sulphates when backfill was saturated with de-ionised water (more than 8.5 g/L). This means that gypsum is dissolving. Nevertheless, when salt water (containing CaCl2) was used to permeate the backfill, the rate of gypsum dissolution decreased notably (4.6 g/L when 16 g/L were injected). The injection of CaCl2 inhibits gypsum dissolution process. All the chemical reactions introduce an important variation of the hydraulic conductivity as it was measured in the oedometer tests. 3.9.2 Aqueous extracts from specimens used in water uptake tests At the end of the water uptake tests performed by CIEMAT (CIEMAT, 2002) an aqueous extract of each section was carried out and concentrations of soluble Ca2+ and Na+ were measured. The analysis of the distribution of ionic species may illustrate the movement of

Chapter 3: Backfill experimental study
64
water as well as the reaction substitution of sodium by calcium. Details of the preparation of the specimens studied in the water uptake tests performed by CIEMAT are provided in section 3.5.1. To perform the aqueous extracts around 100 g of material with the quantity of distilled water needed to give a dry soil to water ratio of ½ were mixed up. This paste was stirred during 48 hours and afterwards centrifuged at 15500 rpm during 30 minutes for three times. The supernatant, after the three centrifugation stages, was filtered by 0.45 µm and collected. Two aliquots were analysed to determine the concentration of cations. Ca2+ concentration (mg/L) was determined by inductively coupled plasma-atomic emission spectrometry and Na+ concentration (mg/L) by flame spectrophotometry. These values were converted into mg/kg units (mg of cation per kg of dry soil) by taking into account the solid to liquid ratio. The aqueous extract of backfill prior to hydration provided a Ca2+ concentration of 15 mg/kg (0.075 meq/100g solid phases) and a Na+ concentration of 1100 mg/kg (4.783 meq/100g solid phase). Profile of soluble sodium in the specimens hydrated with distilled and salt water are shown in figures 3.64 and 3.65 respectively. Figures 3.66 and 3.67 show the same results but comparing soluble calcium for distilled water and salt water respectively. As in the case of water content, large variations of values inside a given section can be expected as a consequence of backfill heterogeneous behaviour. It was observed that soluble cations concentrated inside the clay fraction but only on the surface of the rock fragments. Despite the variations found in the average concentration of cations in each test, it is clear that both Ca2+ and Na+ are leached near the hydration surface and concentrate forward. In the tests performed with distilled water, the maximum concentration of both cations is found 4 cm away from the hydration surface, despite the duration of the infiltration, although this behaviour is not yet displayed in the 10-day duration test (figures 3.64 to 3.67). In the rest of the block, where the water content is lower, the concentration of both cations remains nearly constant. As expected, the measured concentrations at the end of the tests performed with saline water were higher. The cations are also leached from the zones closest to the hydration surface, but they are concentrated further the longer the duration of the tests. Figures 3.68 and 3.69 make patent the highest concentration of soluble cations in the tests performed with saline water and the displacement of the maximum of concentration towards the upper part of the block as saturation proceeds in the tests performed with saline water. Advection of ions with the injected water would be the mechanism to explain this behaviour (CIEMAT, 2002). The short extent of salt redistribution in the tests performed with distilled water points to a small movement of the soluble salts already present in the material as a result of saturation. 3.10 CONCLUSIONS An experimental characterisation of a mixture of sodium bentonite MX-80 and crushed granite rock has been performed by means of compaction tests, determination of retention curve, water uptake tests and oedometer tests. This experimental campaign has been focused on the salt water effects on the backfill hydro-mechanical behaviour. It must be pointed out the enormous difficulties that the experimental study of this material presents. The maximum grain size of crushed granite (up to 20 mm) complicates the tests and usual equipment in a soil mechanics laboratory is not suitable for this grain size if representative results of the backfill behaviour are desired, above all when the unsaturated behaviour is considered.

Chapter 3: Backfill experimental study
65
Moreover, the content of sodium bentonite is high enough to decrease notably the backfill permeability and diffusion. Therefore, when hydraulic-diffusive behaviour is studied, long duration of the tests is necessary to obtain good results. The mechanisms that control the clay-fluid system and the way different chemical species change or alter the measured or observed hydro-mechanical macroscopic behaviour of active clays are not clear yet. The macroscopic behaviour of clayey soils is understood, but current knowledge at the microscopic level is still somehow obscure and many uncertainties arise. A large number of references dealing with the chemical effects on the hydro-mechanical properties of active soils are available in the literature. However, this experimental amount of work mainly shows the macroscopic behaviour of active clays. Understanding and comprehension of processes occurring at the microstructural level and its effects on the macroscopic behaviour is the next step on the characterisation of soil behaviour. Deducing or extrapolating information from the smaller structural levels is also difficult and usual laboratory tests in soil mechanics are not useful to measure and estimate properties of such structural levels. Diffuse Double Layer theory is able to explain qualitatively some processes that occur in active clayey soils at the microstructural level when temperature is assumed to be constant. Nevertheless, it is not able to explain all the phenomena observed in a compacted bentonite-fluid system. This model cannot be used to explain all the transformations and changes such a system can experience. More sophisticated models are necessary to consider the complexity of the clay-fluid system and their interactions with the macroscopic behaviour. Water osmotic potential is strongly dependent on the behaviour of the bentonite-water system. However, osmotic suction, as a part of total water potential in a soil, has been usually neglected or assumed constant. This is not true as it was stated after experimental work by means of drying and wetting paths in active soils and where chemistry of pore fluid was changed. Further research is necessary in order to develop new techniques to perform independent measurements of water potential associated to chemistry of pore fluid. Constant osmotic suction is not a valid hypothesis even when capillarity and water absorption are not affected or influenced by the chemistry of the pore fluid, i.e. non-active clays. Moreover, the role of osmotic suction gradients as driving force of water is not clear yet in compacted and active clayey soils. Importance of osmotic flow of water due to gradients of osmotic suction has to be studied in this kind of problems where hydration with salt water can occur or problems where municipal, mining or industrial leachates can hydrate a barrier or landfill. It was shown that when backfill was hydrated with salt water and compacted at simple energy, the maximum dry specific weight was higher than dry specific weight obtained when backfill was hydrated with distilled water. Water content at the maximum dry specific weight when backfill was hydrated with salt water was smaller than water content obtained when backfill was hydrated with distilled water. However, at double energy, the chemical influence on compaction results was not very important. Similar results were found when backfill was hydrated with salt water or distilled water at this level of compaction. Therefore, chemical effects are depending on mechanical effects and vice versa. The water uptake tests clearly showed that the higher the salt concentration in the water used to saturate the backfill, the faster the hydration process. It was also checked out that when performing this test in active clays, where the pore fluid chemistry plays an important role, it is necessary to obtain more information as, for instance, suction evolution profiles, measurement of the injected volume of water, chemical analyses of interstitial pore fluid and aqueous extracts to study the evolution of the main cations in the solid phase. Backfill presented heterogeneous behaviour when measuring water content and densities. This is due

Chapter 3: Backfill experimental study
66
to its mixture origin and the big size of the particles (up to 20 mm). Full saturation of backfill specimens hydrated with distilled water compacted at an average dry specific weight of 16.7 kN/m3 was not reached after 2400 hours of the beginning of the saturation process. However, saturation of backfill specimens with salt water containing 12 g/L (NaCl and CaCl2, 68/32 by mass) was much faster (tests performed by CIEMAT). Similar results were obtained in backfill specimens dynamically compacted at slightly higher dry specific weight (tests performed by CT). A non-uniform profile of dry specific weight was measured by CIEMAT after the static compaction of backfill specimens 12.9 cm height. This profile of dry specific weight was not produced when specimens for water uptake tests were dynamically compacted in different layers by Clay Technology. Therefore, friction effects have to be controlled when compacting statically soil specimens. Backfill retention properties are difficult to study due to the big size of the crushed granite rock. Moreover, backfill compacted at the ZEDEX gallery is being saturated with salt water, which means that the degree of saturation decreases but concentration of salts (osmotic suction) increases and therefore, osmotic suction increases as well. To study backfill retention behaviour when liquid salt water is transferred to the soil is not technically simple. The vapour transfer technique is not the same process than when liquid water (containing salts) is directly transferred to the soil skeleton. Backfill matric and total suction was studied by means of different experimental techniques as suction plates, vapour transfer technique and transistor psychrometers. Transistor psychrometers provided more reliable results than results obtained by vapour transfer technique. Osmotic suction was successfully inferred from another soil obtained by substituting the crushed granite by sand. By this substitution, total suction of saturated specimens of this new mixture was studied by means of transistor psychrometers. Osmotic suction was assumed to be totally independent on the soil structure and only dependent on the amount of bentonite in the soil and the pore fluid chemistry. The maximum osmotic suction measured was 1.7 MPa when specimens were saturated with water containing 16 g/L. Six oedometer tests were performed in this backfill in Rowe cells. Influence of dry specific weight and salt concentration in water added to saturate the backfill on swelling pressure, compressibility and hydraulic conductivity was investigated. Swelling pressure at a dry specific weight of 16.6 kN/m3 was higher than 180 kPa when salinity of water added to saturate the backfill ranged from 0 to 16 g/L. This swelling pressure is high enough to assure the backfill sealing capacity necessary at the ZEDEX gallery. No swelling capacity at a dry specific weight of 13.7 kN/m3 and hydrated with salt water was observed. This means that backfill has no swelling capacity at low dry specific weights and when it is hydrated with salt water. No swelling of backfill is expected in those areas of the ZEDEX gallery where compaction problems appeared, close to the roof and the ground, because of the low dry specific weights reached. That may create problems in a future vault and backfill cannot be able to assure the sealing in those areas. Backfill compressibility showed to be independent on salinity of water injected during its saturation at both dry specific weights. Calculated compression index at higher dry specific was around 0.1 and ranged from 0.13 to 0.2 at the lower dry specific weight. These values are considered medium to high and typical of clayey soils. Estimated backfill hydraulic conductivity was sensitive to salinity of injected water during backfill saturation. At the high dry specific weight, hydraulic conductivity of backfill saturated with 16 g/L was six times bigger than estimated backfill hydraulic conductivity

Chapter 3: Backfill experimental study
67
when saturated with distilled water. Estimated hydraulic conductivity at the lower dry specific weight was more sensitive to the salinity of water used to saturate the samples. These results have to be carefully considered due to the big strains applied to the samples at this low dry specific weight and therefore, Terzaghi’s consolidation theory could provide unreliable parameters. In such conditions, hydraulic conductivity of backfill permeated with 16 g/L was up to twenty (or more) times bigger than those obtained when backfill was hydrated with distilled water. Backfill hydraulic conductivity at a void ratio of 0.58 (dry specific weight of 16.7 kN/m3) and saturated with distilled water ranged from 2·10-12 m/s to 4.5·10-12 m/s. Backfill hydraulic conductivity at the same void ratio when salinity of water used to saturate the samples was 16 g/L ranged from 3·10-11 m/s to 7·10-11 m/s. These values of backfill permeability are considered to be small enough to guarantee the effectiveness of the barrier in reducing the flow of water, chemical species and radionuclides. Backfill diffusion has not been experimentally studied, however, this parameter is very important because of the low backfill permeability. It is a fact that the main transport mechanism might be controlled by diffusion instead of advection in low permeability media (Zornberg, 2002). Influence of crushed granite on this parameter is not clear, but it could be not really important when bentonite content is higher than 30% (Mingarro et al. 1991; Miehe et al. 2000). In chapter 5 backfill diffusion will be further considered by means of numerical coupled simulation of flow of water and transport of salt. Chemical analyses of collected water during the saturation process of specimens compacted at the high dry specific weight clearly showed the enrichment of sodium of the pore fluid when it was compared with sodium content in water injected to saturate the backfill. In the same way, it was noticed a decrease of the calcium content in the pore fluid if compared with content of calcium in injected water used to saturate the specimens. This means that sodium bentonite is being transformed into a calcium bentonite among other processes. From the same analysis, chloride transport was nearly conservative as concentrations of chloride in collected water and injected water were similar. Finally, gypsum dissolution showed to be an important reaction as well. Gypsum is one of the most important easily dissolving components of bentonite (together with calcite) when bentonite is hydrated. However, observed rate of gypsum dissolution was higher when distilled water was used to saturate the specimens. Calcium injected in salt water inhibited the calcite and gypsum dissolution. The aqueous extracts performed in specimens permeated with distilled water and salt water containing 12 g/L of salts (32/68 NaCl/CaCl2 by mass) also showed the transformation of the sodium bentonite into a calcium bentonite. 3.11 REFERENCES Abdullah, W.S., Al-Zou’bi, M.S. & Alshibli, K.A. (1997). On the physicochemical aspects of
compacted clay compressibility. Can. Geotech. J., 34, p. 551-559. Acar, Y.B. & Olivieri, I. (1989). Pore fluid effects on the fabric and hydraulic conductivity of
laboratory-compacted clay. Transportation Research Record, 1219, p. 144-159. Achari, G., Joshi, R.C., Bentley, L.R., & Chatterji, S. (1999). Prediction of the hydraulic
conductivity of clays using the electric double layer theory. Can. Geotech. J., 36, p. 783-792.
Allen, C.C. & Wood, M.I. (1988). Bentonite in nuclear waste disposal: A review of research in support of the Basalt Waste Isolation Project. Applied Clay Science 3 (1), p. 11-30.
Alonso, E.E. (1998). Modelling the expansive soil behaviour. Keynote lecture. Proc. 2nd Int. Conf. on Unsaturated Soils, UNSAT 1998, Beijing, China, Vol. 2, p. 37-70.
Chapter 3: Backfill experimental study
68
Alonso, E.E. (2002). Personal communication. Alonso, E.E., Gens, A. & Hight, D.W. (1987). Special problem soils. General report. Proc. 9th
European Conf. on Soil Mech. and Foundations Eng., Vol 3. Balkema, Dublin. p. 1087-1146.
Alther, G.R. (1987). The qualifications of bentonite as a soil sealant. Engineering Geology, 23, p. 177-191.
Appelo, C.A.J. & Postma, D. (1993). Geochemistry, groundwater and pollution. Third Edition, Balkema, Rotterdam, The Netherlands.
Aung, K.K., Rahardjo, H., Leong, E.C. & Toll, D.G. (2001). Relationship between porosimetry measurement and soil-water characteristic curve for an unsaturated residual soil. Geotechnical and Geological Engineering, 19, p. 401-416.
Barbour, S.L. & Fredlund, D.G. (1989). Mechanisms of osmotic flow and volume change in clay soils. Can. Geotech. J., 26, p. 551-562.
Barbour, S.L. & Yang, N. (1993). A review of the influence of clay-brine interactions on the geotechnical properties of Ca-montmorillonitic clays from Western Canada. Can. Geotech. J., 30, p. 920-934.
Bear, J (1972). Dynamics of fluids in porous media. Dover Publications, Inc. Bolt, G.H. (1956). Physico-chemical analysis of the compressibility of pure clays.
Géotechnique, 6 (4), p. 695-707. Börgesson, L. (1985). Water flow and swelling pressure in non-saturated bentonite-based clay
barriers. Engineering Geology, 21, p. 229-237. Börgesson, L., Johannesson, L.E., Sandén, T. & Hernelind, J. (1995). Modelling of the
physical behaviour of water saturated clay barriers. Laboratory tests, material models, and finite element application. SKB Technical Report, TR-95-20. Sweden.
Börgesson, L., Johannesson, L.E. & Sandén, T. (1996). Backfill materials based on crushed rock. Geotechnical properties determined in laboratory. SKB Progress Report HRL-96-15, Sweden.
Börgesson, L., Johannesson, L.E. & Gunnarsson, D. (2002). Influence of soil structure inhomogeneities on the behaviour of backfill materials based on mixtures of bentonites and crushed rock. In: Preprints of Contributions to the Workshop on Microstructural Modelling of Natural and Artificially Prepared Clay Soils with Special Emphasis on the Use of Clays for Waste Isolation, Pusch, R. (Ed.), Lund, 15-17 October, Sweden.
Casagrande A. & Fadum R.E. (1940). Notes on soil testing for engineering purposes. Soil mechanics series, 8. Harvard Graduate School of Engineering.
Cey, B.D., Barbour, S.L. & Hendry, M.J. (2001). Osmotic flow through a Cretaceous clay in southern Saskatchewan, Canada. Can. Geotech. J., 38, p. 1025-1033.
CIEMAT, (2002). Infiltration tests for the Backfill and Plug Test Project. Report for SKB. Clay Technology, (1998 to 2002). Personal communication. Collins, J.G. (1997). Characteristics and origin of the Cedar Hill bentonite bed. Lower Austin
chalk, Dallas County vecinity. M. Sc. thesis, Department of Geology, University of Texas. Arlington.
Collins, K. & McGown, A. (1974). The form and function of microfabric features in a variety of natural soils. Géotechnique, 24, p. 223-254.
D’Appolonia, D.J. (1980). Soil-bentonite slurry trench cutoffs. J. Geotech. Eng. Div., 106 GT4, p. 399-417.
Daeman, J. & Ran, Ch. (1996). Bentonite as a Waste Isolation Pilot Plant shaft sealing material. SAND96-1968. Albuquerque, NM: Sandia National Laboratories.
Darkin, M.G., Wright, S.P., Williams, J.B., Langdom, N.J. & Sangha, C.M. (1997). Physico-chemical and microbial factors affecting the passage of leachate through clay liners. Geoenvironmental Engineering. Contaminated ground: fate of pollutants and remediation. Yong, R.N. & Thomas, H.R. (Eds.).p. 68-73. University of Wales, Cardiff, Great Britain.

Chapter 3: Backfill experimental study
69
Daupley, X. (1997). Etude du potentiel de l’eau interstitielle d’une roche argileuse et des relations entre ses propriétés hydriques et méchaniques, PhD thesis. Ecole National des Mines de Paris. (In French).
Delville, A. (2001). The influence of electrostatic forces on the stability and the mechanical properties of clay suspensions. International Workshop Clay behaviour: Chemo-mechanical coupling. Di Maio, C., Hueckel, T. and Loret, B. (Eds.), Maratea, Italy.
Di Maio, C. (1996). Exposure of bentonite to salt solution: osmotic and mechanical effects. Géotechnicque, 46 (4), p. 695-707.
Di Maio, C. (1998). Exposure of bentonite to salt solution: osmotic and mechanical effects. (Discussion). Géotechnicque, 48 (3), p. 433-436.
Dixon, D.A., Graham, J. & Gray, M.N. (1999). Hydraulic conductivity of clays in confined tests under low hydraulic gradients. Can. Geotech. J., 36, p. 815-825.
Dixon, D.A. (2000). Pore water salinity and the development of swelling pressure in bentonite-based buffer and backfill materials. POSIVA report OY 2000-04, ISBN 951-652-090-1, ISSN 1239-3096, Helsinki, Finland.
Egloffstein, T.A. (2001). Natural bentonites – influence of the ion exchange and partial desiccation on permeability and self-healing capacity of bentonites used in GCLs. Geotextiles and Geomembranes, 19, p. 427-444.
Elzeftawy, A. & Cartwright, K. (1981). Evaluating the saturated and unsaturated hydraulic conductivity of soils. Permeability and Groundwater Contaminant Transport, ASTM STP 746, Zimmie, T.F. & Riggs, C.O. (Eds.), American Society for Testing and Materials, p. 168-181.
Engelhardt, I. (2002). Thermal-Hidrologic experiments with bentonite/crushed rock mixtures and estimation of effective parameters by inverse modelling. In: Preprints of Contributions to the Workshop on Microstructural Modelling of Natural and Artificially Prepared Clay Soils with Special Emphasis on the Use of Clays for Waste Isolation, Pusch, R. (Ed.), Lund, 15-17 October, Sweden.
Eriksen, T.E., Jansson, M. & Molera, M. (1999). Sorption effects on cation diffusion in compacted bentonite. Engineering Geology, 54, p. 231-236.
Ericsson, L.O. (1999). Geoscientific R&D for high-level radioactive waste disposal in Sweden current status and future plans. Engineering Geology, 52, p. 305-317.
FEBEX (2000). Full-scale engineered barriers experiment for a deep geological repository for high level radioactive waste in crystalline host rock. Final Report. ENRESA, TR 1/2000.
Fernandez, F. & Quigley, R.M. (1985). Hydraulic condcutivity of natural clays permeated with simple liquid hydrocarbons. Can. Geotech. J., 22, p. 205-214.
Fredlund, D.G. & Rahardjo, H. (1993). Soil Mechanics for Unsaturated Soils. John Wiley & Sons, Inc. New York.
Fredlund, D.G. & Xing, A. 1994. Equations for the soil-water characteristic curve. Can. Geotech. J., 31, p. 521-532.
Fujita, T., Suzuki, H., Sugita, Y., Sugino, H. & Nakano, M. (2001). Hydraulic properties in compacted bentonite under unsaturated condition. In Clay Science for Engineering, p. 229- 238. Adachi & Fukue (Eds.). Balkema, Rotterdam.
Gens, A. & Alonso, E.E. (1992). A framework for the behaviour of unsaturated expansive clays. Can. Geotech. J., 29, p.1013-1032.
Gipson, A.H. Jr. (1985). Permeability testing on clayey soil and silty sand-bentonite mixture using acid liquor. Proc. Hydraulic barriers in soil and rock, ASTM STP 874. Johnson, A.I., Frobel, R.K., Cavalli, N.J. & Petterson, C.B. (Eds.). American Society for Testing and Materials, Philadelphia, 1985.
Gleason, M.H., Daniel, D.E. & Eykholt, G.R. (1997). Calcium and sodium bentonite for hydraulic containment applications. J. Geotech. and Geoenvironm. Eng., 123 (5), p. 438-445.

Chapter 3: Backfill experimental study
70
Goldenberg, L.C. & Magaritz, M. (1983). Experimental investigation on irreversible changes of hydraulic conductivity on the seawater-freshwater interface in coastal aquifers. Water Res. Res., 19 (1), p. 77-85.
Goudarzi, R., Gunnarsson, D., Johannesson, L-E. & Börgesson, L. (2002).Äspö Hard Rock Laboratory. Backfill and Plug Test. Sensors data report (period 990601-020101). Report Nº 4. International Progress Report IPR-02-10. SKB, Sweden.
Gray, M.N., Cheung, S.C.H. & Dixon, D.A. (1984). The influence of sand content on swelling pressures and structure developed in statically compacted Na-bentonite. AECL-7825, Manitoba, Canada.
Greenberg, J.A., Mitchell, J.K. & Witherspoon, P.A. (1973). Coupled salt and water flows in a groundwater basin. J. Geophysical Res., 78 (27), p. 6341-6353.
Guimarães L. do N. (2002). Análisis multi-componente no isotermo en medio poroso deformable no saturado. PhD Thesis, Dept. of Geotechnical Engineering and Geosciences, Technical University of Catalonia, Barcelona, Spain. (In Spanish).
Gunnarsson, D., Börgesson, L., Hökmark, H., Johannesson, L.E. & Sandén, T. (2001). Äspö Hard Rock Laboratory. Report on the installation of the Backfill and Plug Test. International Progress Report IPR-01-07.
Güven, N. (1990). Longevity of bentonite as buffer material in a nuclear-waste repository. Engineering Geology, 28, p. 233-247.
Hamilton, J.M., Daniel, D.E. & Olson, R.E. (1981). Measurement of hydraulic conductivity of partially saturated soils. Permeability and Groundwater Contaminant Transport, ASTM STP 746, Zimmie, T.F. & Riggs, C.O. (Eds.), American Society for Testing and Materials, p. 168-181.
Haug, M.D., Barbour, S.L. & Longval, P. (1988). Design and construction of a prehydrated sand-bentonite liner to contain brine. Can. J. Civ. Eng., 15, p. 955-963.
Herbert, H.J. & Moog, H.C. (1999). Cation exchange, interlayer spacing and water content of MX-80 bentonite in high molar saline solutions. Engineering Geology, 54, p. 55-65.
Holopainen, P. (1985). Crushed-aggregate-bentonite mixtures as backfill material for repositories of low - and intermediate - level radioactive waste. Engineering Geology, 21, p. 239-245.
Horseman, S.T., Harrington, J.F. & Sellin, P. (1997). Gas migration in MX-80 buffer bentonite. In Scientific Basis for Nuclear Waste Management XX. Gray, W.J. & Triay, I.R. (Eds.). Mat. Res. Soc. Proc., 465, p. 1003-1010. Pittsburgh, P.A.
Hueckel, T.; Loret, B. & Gajo, A. (2001). Swelling materials as reactive, deformable, two-phase continua: Basic modelling concepts and options. International Workshop Clay behaviour: Chemo-mechanical coupling. Di Maio, C., Hueckel, T. and Loret, B. (Eds.), Maratea, Italy.
Ichikawa, Y., Kawamura, K., Nakano, M., Kitayama, K., Seiki, T. & Theramast, N. (2001). Seepage and consolidation of bentonite saturated with pure or salt-water by the method of unified molecular dynamics and homogenisation analysis. Engineering Geology, 60, p. 127-138.
Iyer, B. (1990). Pore fluid extraction-Comparison of saturation extract and high-pressure squeezing. Physico-Chemical Aspects of Soil and Related Materials. ASTM STP 1095, K.B. Hoddinott and R.O. Lamb, Eds., American Society for Testing and Materials, Philadelphia, p. 159-170.
Jiménez Salas, J.A. & de Justo Alpañes, J.L. (1975). Geotecnia y cimientos I. Propiedades de los suelos y de las rocas. Editorial Rueda. Madrid.
Johannesson, L.E., Börgesson, L. & Sandén, T. (1999). Backfill materials based on crushed rock (part 2). Geotechnical properties determined in laboratory. SKB ÄHRL IPR-99-23, Sweden.

Chapter 3: Backfill experimental study
71
Kahr, G., Krähenbühl, F., Müller-Vonmoos, M. & Stoekli, H.F. (1986). Wasseraufnahme und Wasserbewegung in hochverdichtetem Bentonit. NAGRA, NTB-86-14, Baden. (In German).
Karnland, O. (1997). Bentonite swelling pressure in strong NaCl solutions. Correlation between model calculations and experimentally determined data. SKB TR-97-31, Sweden.
Keijzer, Th.J.S., Kleingeld, P.J. & Loch, J.P.G. (1999). Chemical osmosis in compacted clayey material and the prediction of water transport. Engineering Geology, 53, p. 151-159.
Keijzer, Th.J.S. (2000). Chemical osmosis in natural clayey material. Ph.D. thesis, University of Utrecht, Utrecht, the Netherlands.
Kemper, W.D. (1961). Movement of water as affected by free energy and pressure gradients: II Experimental analysis of porous systems in which free energy and pressure gradients act in opposite directions. Soil Science Soc. Am. J., 25, p. 260-265.
Kenney, T.C., van Veen, W.A., Swallow, M.A. & Sungaila, M.A. (1992). Hydraulic conductivity of compacted bentonite-sand mixtures. Can. Geotech. J., 29, p. 364-374.
Komine, H. & Ogata, N. (1996). Prediction for swelling characteristics of compacted bentonite. Can. Geotech. J., 33, p. 11-22.
Komine, H. & Ogata, N. (1999). Experimental study on swelling characteristics of sand-bentonite mixture for nuclear waste disposal. Soils and Foundations, 39 (2), p. 83-97.
Klute, A. (1972). The determination of the hydraulic conductivity and diffusivity of unsaturated soils. Soil Science, 113(4), p. 264-276.
Lajudie, A., Raynal, J., Petit, J.C. & Toulhoat, P. (1996). Clay-based materials for engineered barriers: a review. In Scientific Basis for Nuclear Waste Management XVIII. Murakami, T. & Ewing, R.C. (Eds.). Mat. Res. Soc. Proc., 353, p. 221-230. Pittsburgh, P.A.
Latey, J., Kemper, W.D. & Noonan, L. (1969). The effect of osmotic pressure gradients on water movements in unsaturated soils. Soil Science Soc. Am. J., 33, p. 15-18.
Lehikoinen, J., Carlsson, T., Muurinen, A., Olin, M. & Salonen, P. (1996). Evaluation of factors affecting diffusion in compacted bentonite. In Scientific Basis for Nuclear Waste Management XIX. Murphy, W.M. & Knecht, D.A. (Eds.). Mat. Res. Soc. Proc., 412, p. 675-682. Pittsburgh, P.A.
Lehikoinen, J., Muurinen, A., Melamed, A. & Pitkänen, P. (1997). Determination of pore water chemistry in compacted bentonite. In Scientific Basis for Nuclear Waste Management XX. Gray, W.J. & Triay, I.R. (Eds.). Mat. Res. Soc. Proc., 465, p. 1011-1018. Pittsburgh, P.A.
Lide, D.R. & Frederikse, H.P.R. (1997). CRC Handbook of Chemistry and Physics. A ready-reference book of chemical and physical data. CRC Press, New York.
Low, P.F. (1980). The swelling of clay II: Montmorillonites. Soil Sci. Soc. Am. J., 44, p. 667-676.
Madsen F.T. (1998). Clay mineralogical investigations related to nuclear waste disposal. Clay Minerals, 33, p. 109-129.
Marine, I.W. & Fritz, S.J. (1981). Osmotic model to explain anomalous hydraulic heads. Water Res. Res., 17, p. 73-82.
Mata, C. & Ledesma, A. (1999). Äspö Backfill and Plug Test. Informe de la contribución de la UPC-CIMNE de 1997 a 1999. UPC-CIMNE. Internal Report for ENRESA, Madrid (In Spanish).
Mata, C. & Ledesma, A. (2002). Laboratory tests for the Backfill and Plug Test. UPC-CIMNE. Report for SKB, Sweden.
Mata, C., Romero, E. & Ledesma, A. (2002). Hydro-chemical effects on water retention in bentonite-sand mixtures. Proc. 3rd Int. Conf. on Unsaturated Soils, UNSAT 2002, Jucá, J.F.T., de Campos, T.M.P. & Marinho, F.A.M. (Eds.), Recife, Brazil, Vol. 1, p. 283-288.
Chapter 3: Backfill experimental study
72
Mesri, G. & Olson, R. (1970). Shear strenght of montmorillonite. Géotechnique, 20, p. 261-270.
Mesri, G. & Olson, R. (1971). Consolidation characteristics of montmorillonite. Géotechnique, 21 (4), p. 341-352.
Miehe, R., Jockwer, N., Wieczorek, K. & Rothfuchs, T. (2000). Qualification of clay barriers in underground repository systems. EUROSAFE 2000, Forum for Nuclear Safety, Köln, Germany, 6-7 November 2000.
Miller, D.J. & Nelson, J.D. (1992). Osmotic suction as a valid state in unsaturated soils. Proc. 7th Int. Conf. Expansive Soils. Dallas, p. 179-184.
Mingarro, E., Rivas, P., del Villar, L.P., de la Cruz, B., Gómez, P., Hernández, A., Turrero, M.J., Villar, M.V., Campos, R. & Cozar, J. (1991). Characterization of Clay (Bentonite)/Crushed Granite Mixtures to Build Barriers Against the Migration of Radionuclides: Diffusion Studies and Physical Properties. Technical Report EUR 13666 EN. Luxembourg: Commission of the European Communities.
Mitchell, J.K., Hooper, D.R. & Campanella, R.G. (1965). Permeability of compacted clay. J. Soil Mech. and Foundations Div., 91 SM4, p. 41-65.
Mitchell, J.K., Greenberg, J.A & Whitherspoon, P.A. (1973). Chemico-osmotic effects in fine-grained soils. J. Soil Mech. and Foundations Div., 99 SM4, p. 307-322.
Mitchell, J.K (1993). Fundamentals of soil behavior. 2nd Edition. John Wiley & Sons, Inc. New York.
Moore, R. (1991). The chemical and mineralogical controls upon the residual strength of pure and natural clays. Géotechnique, 41 (1), p. 35-47.
Müller-Vonmoos, M. & Kahr, G., (1983). Mineralogiche Untersuchungen von Wyoming Bentonit MX-80 und Montigel. NAGRA, NTB83-12, Baden. (In German).
Muurinen, A. (2001). Personal Communication. Muurinen, A., Panttilä-Hiltunen, P. & Uusheimo, K. (1988). Diffusion of chloride in
compacted sodium bentonite. In Scientific Basis for Nuclear Waste Management XII. Lutze, W. & Ewing, R.C. (Eds.). Mat. Res. Soc. Proc., 127, p. 743-748. Pittsburgh, P.A.
Muurinen, A. & Lehikoinen, J. (1998a). Pore water chemistry in compacted bentonite. In: Preprints of Contributions to the Workshop on Microstructural Modelling of Natural and Artificially Prepared Clay Soils with Special Emphasis on the Use of Clays for Waste Isolation, Pusch, R. (Ed.), Lund, Sweden, 12-14 October.
Muurinen, A. & Lehikoinen, J. (1998b). Evolution of pore water chemistry in compacted bentonite. In Scientific Basis for Nuclear Waste Management XXI. McKinley, I.G. & McCombie, C. (Eds.). Mat. Res. Soc. Proc., 506, p. 415-422. Pittsburgh, P.A.
Neuzil, C.E. (2000). Osmotic generation of ‘anomalous’ fluid pressures in geological environments. Nature, 403, p. 182-184.
Olin, M., Lehikoinen, J. & Muurinen, A. (1995). Coupled chemical and diffusion model for compacted bentonite. In Scientific Basis for Nuclear Waste Management XVIII. Murakami, T. & Ewing, R.C. (Eds.). Mat. Res. Soc. Proc., 353, p. 253-260. Pittsburgh, P.A.
Olsen, H.W. (1969). Simultaneous fluxes of liquid and charge in saturated kaolinite. Soil Sci. Am. J., 33 (3), p. 338-344.
Olsen, H.W. (1972). Liquid movement through kaolinite under hydraulic, electric and osmotic gradients. The Am. Assoc. of Petroleum Geol. Bull., 56 (10), p. 2022-2028.
Oscarson, D.W., Dixon, D.A. & Gray, M.N. (1990). Swelling capacity and permeability of an unprocessed and a processed bentonitic clay. Engineering Geology, 28, p. 281-289.
Pfeifle, T.W. & Brodsky, N.S. (1991). Swelling pressure, water uptake and permeability of 70/30 crushed salt/bentonite. SAND91-7070. Albuquerque, NM: Sandia National Laboratories.

Chapter 3: Backfill experimental study
73
Petrov, R.J. & Rowe, R. K. (1997). Geosynthetic clay liner (CGL) – chemical compatibility by hydraulic conductivity testing and factors impacting its performance. Can. Geotech. J., 34, p. 863-885.
Prapaharan, S., Altschaeffl, A.G. & Dempsey, B.J. (1985). Moisture curve of a compacted clay: mercury intrusion method. J. Geotech. Eng., ASCE, 111 (9), p. 1139-1143.
Pupisky, H. & Sheinberg, I. (1979). Salt effects on the hydraulic conductivity of a sandy soil. Soil Sci. Soc. Am. J., 43, p. 429-433.
Pusch, R. (1980). Water uptake, migration and swelling characteristics of unsaturated and saturated highly compacted bentonite. SKB, Technical Report, TR80-11. Sweden.
Pusch, R. (1982). Mineral-water interactions and their influence on the physical behaviour of highly compacted Na bentonite. Can. Geotech. J., 19, p. 381-387.
Pusch, R. (1998). Transport phenomena in smectite clay explained by considering microstructural features. In Scientific Basis for Nuclear Waste Management XXI. McKinley, I.G. & McCombie, C. (Eds.). Mat. Res. Soc. Proc., 506, p. 439-448. Pittsburgh, P.A.
Pusch, R. (2001). Experimental study of the effect of high pore-water salinity on the physical properties of a natural smectitic clay. SKB, Technical Report, TR-01-07. Sweden.
Pusch, R. & Carlsson, T. (1985). The physical state or pore water of Na smectite used as barrier component. Engineering Geology, 21, p. 257-265.
Pusch, R. & Güven, N. (1990). Electron microscopic examination of hydrothermally treated bentonite clay. Engineering Geology, 28, p. 303-314.
Pusch, R. & Karnland, O. (1990). Preliminary report on longevity of montmorillonite clay under repository-related conditions. SKB, Technical Report, TR-90-44. Sweden.
Pusch, R., Karnland, O. & Hökmark, H. (1991). The nature of expanding clays as exemplified by the multifaced smectite mineral montmorillonite. Workshop on stress partitioning in engineered clay barriers. Duke University, Durham, N.C.
Radhakrishna, H.S., & Chan, H.T. (1982). Laboratory study of physical properties of clay buffers for a nuclear fuel waste vault. Proc. Int. Conf. On Radioactive Waste Management, Winnipeg, Manitoba, September 12-15. (1982). Feraday, M.A. (Ed). Toronto, Ontario: Canadian Nuclear Society, p. 84-90.
Radhakrishna, H.S., Chan, H.T., Crawford, A.M. & Lau, K.C. (1989). Thermal and physical properties of candidate buffer-backfill materials for a nuclear fuel waste disposal vault. Can. Geotech. J., 26, p. 629-639.
Ridley, K.J.D., Bewtra, J.K. & McCorquodale J.A. (1984). Behaviour of compacted fine-grained soil in a brine environment. Can. J. Civ. Eng., 11, p. 196-203.
Robinson, R.G. (1999). Consolidation analysis with pore pressure measurements. Géotechnique, 49 (1), p. 127-132.
Romero, E. (1999). Characterization and thermo-hydro-mechanical behavior of unsaturated Boom clay: an experimental study. PhD Thesis, Dept. of Geotechnical Engineering and Geosciences, Technical University of Catalonia, Barcelona, Spain.
Romero, E., Alonso, E.E., García, I. & Knobelsdorf, J. (2002). Microstructural changes affecting air permeability through an unsaturated 80/20 sand-bentonite mixture. In: Preprints of Contributions to the Workshop on Microstructural Modelling of Natural and Artificially Prepared Clay Soils with Special Emphasis on the Use of Clays for Waste Isolation, Pusch, R. (Ed.), Lund, 15-17 October, Sweden.
Salas, J.A. & Serratosa, J.M. (1953). Compressibility of clays. Proc. Third Int. Conf. Soil Mech., 1, p. 192-198. Zurich.
Sánchez, M. (2003). Análisis Termo-Hidro-Mecánicos acoplados en medios de baja permeabilidad. PhD Thesis, Dept. of Geotechnical Engineering and Geosciences, Technical University of Catalonia, Barcelona, Spain. (In Spanish).

Chapter 3: Backfill experimental study
74
Santamarina, J.C. & Fam, M. (1995). Changes in dielectric permittivity and shear wave velocity during concentration diffusion. Can. Geotech. J., 32, p. 647-659.
Shackelford, C.D. (1994). Waste-soil interaction that alter the hydraulic conductivity. Proc. Hydraulic conductivity and waste contaminant transport in soil. ASTM STP 1142. D.E. Daniel & S.J. Trautwein (Eds.). American Society for Testing and Materials, Philadelphia, 1994.
Sivapullaiah, P.V., Sridharan, A. & Stalin V.K. (1999). Hydraulic conductivity of bentonite-sand mixtures. Can. Geotech. J., 37, p. 406-413.
SKB (1996). Äspö Hard Rock Laboratory. 10 years of research. SKB. Hammarström, M & Olson, O. (Eds.). Stockholm, Sweden.
Skempton, A.W. (1954). The pore pressure coefficients A and B. Géotechnique, 4, p. 143-147.
Skipper, N.T., Refson, K. & McConnell, J.D.C. (1991). Computer simulation of interlayer water in 2 :1 clays. J. Chem. Phys., 94 (11), p. 7434-7445.
Sridharan, A. & Venkatappa Rao, G. (1971). Effective stress theory of shrinkage phenomena. Can. Geotech. J., 8, p. 503-513.
Sridharan, A. & Venkatappa Rao, G. (1973). Mechanisms controlling volume change of saturated clays and the role of the effective stress concept. Géotechnique, 23, p. 359-382.
Sridharan, A. & Jayadeva, M.S. (1982). Double layer theory and compressibility of clays. Géotechnique, 32 (2), p. 133-144.
Sridharan, A., Rao, S.M. & Murthy, N.S. (1986). Compressibility behaviour of homoionized bentonites. Géotechnique, 36 (4), p. 551-564.
Sridharan, A. (2001). Engineering behaviour of clays: Influence of mineralogy. International Workshop Clay behaviour: Chemo-mechanical coupling. Di Maio, C., Hueckel, T. and Loret, B. (Eds.), Maratea, Italy.
U.S.D.A. Agricultural Handbook Nº60 (1950). Diagnosis and improvement of saline and alkali soils.
Van Olphen, M. & Fripiat, J.J. (1979). Data handbook for clay materials and other non-metallic minerals. Pergamon Press. Oxford.
Villar, M.V. (2002). Äspö Hard Rock Laboratory. Annual scientific report. 2001, CIEMAT contribution. CIEMAT/DIAE/54540/1/02. Madrid, Spain.
Villar, M.V. (2003). Äspö Hard Rock Laboratory. Annual scientific report. 2002, CIEMAT contribution. CIEMAT/DIAE/54540/2/03. Madrid, Spain.
Woodburn, J.A., Hold. J. & Peter, P. (1993). The transistor psychrometer: a new instrument for measuring soil suction. Unsaturated Soils Geotechnical Special Publications Nº 39, Dallas, S.L. Houston and W.K. Wray (Eds). ASCE, p. 91-102.
Yanful, E.K., Shikatani, K.S. & Quirt, D.H. (1995). Hydraulic conductivity of natural soils permeated with acid mine drainage. Can. Geotech. J., 32, p. 624-646.
Yang, N. & Barbour, S.L. (1992). The impact of soil structure and confining stress on the hydraulic conductivity of clays in brine environments. Can. Geotech. J., 29, p. 730-739.
Yong, R.N., Mohamed, A.M.O. & Warkentin, B.P. (1992). Principles of contaminant transport in soils. Developments in Geotechnical Engineering, 73, Elsevier, Amsterdam.
Young, A. & Low, P.F. (1965). Osmosis in argillaceous rocks. Bull. of the Am. Assoc. of Petr. Geol., 49, p. 1004-1008.
Zornberg, J.G. (2002). Personal communication.

Chapter 3: Backfill experimental study
75
Figure 3.1: Comparison of the deformation due to an external loading and the osmotic consolidation at constant vertical load after soaking the soil specimen to brine (Barbour & Yang, 1993).
Figure 3.2: Swelling pressure test on strongly compacted MX-80 sodium bentonite (Karland, 1997). At the beginning, distilled water is used to saturate the specimen. After full saturation brine is injected and an important reduction of the swelling pressure was observed.
Sample exposed to6.1 M NaCl solution

Chapter 3: Backfill experimental study
76
0 5 10 15 20 25Water content (%)
2
5
2
5
2
5
0.1
1.0
10.0
100.0
Tota
l Suc
tion
(MPa
)
Distilled waterγd= 16·6 kN/m3
70/30
30/70
10/90
Figure 3.3: Total suction obtained by means of psychrometers in compacted specimens of different bentonite/sand ratio when specimens were mixed and hydrated with distilled water and at a dry specific weight of 16.6 kN/m3 (Mata et al. 2002).
0 5 10 15 20 25Water content (%)
2
5
2
5
2
5
0.1
1.0
10.0
100.0
Tota
l Suc
tion
(MPa
)
Salt waterγd= 16·6 kN/m3
70/30
30/70
10/90
Figure 3.4: Total suction obtained by means of psychrometers in compacted specimens of different bentonite/sand ratio when specimens were mixed and hydrated with salt water containing 16 g/L of salt and at a dry specific weight of 16.6 kN/m3 (Mata et al. 2002).

Chapter 3: Backfill experimental study
77
0 5 10 15 20 25 30 35 40Water content (%)
2
5
2
5
2
5
0.1
1.0
10.0
100.0
Tota
l Suc
tion
(MPa
)
Distilled waterγd= 13·7 kN/m3
70/30
30/70
10/90
Figure 3.5: Total suction obtained by means of psychrometers in compacted specimens of different bentonite/sand ratio when specimens were mixed and hydrated with distilled water at a dry specific weight of 13.7 kN/m3 (Mata et al. 2002).
0 5 10 15 20 25 30 35 40Water content (%)
2
5
2
5
2
5
0.1
1.0
10.0
100.0
Tota
l Suc
tion
(MPa
)
Salt waterγd= 13·7 kN/m3
70/30
30/70
10/90
Figure 3.6: Total suction obtained by means of psychrometers in compacted specimens of different bentonite/sand ratio when specimens were mixed and hydrated with salt water containing 16 g/L of salt and at a dry specific weight of 13.7 kN/m3 (Mata et al. 2002).

Chapter 3: Backfill experimental study
78
0 5 10 15 20 25Water content (%)
2
5
2
5
2
0.1
1.0
10.0π
= Ψ
salt -
Ψdi
st (
MPa
)
70/30
30/70
10/90
70/30 model
30/70 model
10/90 model
γd = 16.6 kN/m3
Figure 3.7: Difference between total suction of the salt water case and the distilled water case at γd = 16.6 kN/m3 and the predictions with the model presented in equation 6 (after Mata et al. 2002).
0 5 10 15 20 25 30 35 40Water content (%)
2
5
2
5
2
0.1
1.0
10.0
π =
Ψsa
lt - Ψ
dist (
MPa
)
70/30
30/70
10/90
70/30 model
30/70 model
10/90 model
γd = 13.7 kN/m3
Figure 3.8: Difference between total suction of the salt water case and the distilled water case at γd = 13.7 kN/m3 and the predictions with the model presented in equation 6 (after Mata et al. 2002).

Chapter 3: Backfill experimental study
79
8 16 24 32 40Water content (%)
10
100
1000
Mat
ric
Suct
ion
(kPa
)
30/70 backfill
Äspö water - 12 g/L
Distilled water
Figure 3.9: Measured matric suction of a mixture of 30% of MX-80 sodium bentonite and 70% of crushed granite as a function of water content (Johannesson et al. 1999). It can be observed that measured matric suction when specimens were hydrated with salt water (Äspö water) was smaller than measured matric suction when specimens were hydrated with distilled water. A change of backfill macrostructure due to salt water effects is the most probable explanation.
Figure 3.10: Scheme of coupled flows occurring while a non-active soil is saturated with water containing only one chemical species. Meaning of symbols is referred to the text.
C2, p2 C1, p1
C1 > C2 p1 > p2 (negative)
Water flows due to ∇π w
RTk Cx
ωγ
∂ ∂
Water flows due to ∇ p pkx
∂ ∂
Ions flow due to advective flow ( )1 pCkx
ω ∂ − ∂
Diffusion of salts ∇ C CDx
∂ ∂

Chapter 3: Backfill experimental study
80
0 200 400 600 800 1000 1200Time (days)
0
500
1000
1500
2000
2500
3000
3500
Tota
l Suc
tion
(kPa
)
W20 (A4/4/0,0)
W8 (A3/3/0,0)
W19 (A4/3/0,0)
W22 (A5/3/0,0)
Figure 3.11: Evolution of four psychrometers placed at different sections of compacted backfill at the ZEDEX gallery where an increase of total suction was observed (Goudarzi et al. 2002).
4 6 8 10 12 14 16Water content (%)
0
200
400
600
800
1000
1200
Tota
l Suc
tion
(kPa
)
0/100 backfill
Äspö water - 12 g/L
Distilled water
Figure 3.12: Total suction evolution in a free bentonite backfill (0/100 by mass) when specimens were hydrated with distilled water and salt water (Äspö water ≈ 12 g/L). Wescor PST-55 psychrometer was used to determine the total suction (Johannesson et al. 1999). Below 500 kPa it is necessary to perform a large number of measurements to obtain reliable results with this equipment.

Chapter 3: Backfill experimental study
81
Figure 3.13: Pore size distributions of two different soil packings after MIP tests in compacted Boom clay (Romero, 1999). The results of the MIP tests were normalised and translated to degree of saturation of the intruded mercury during the test,
nwrS .
1 10 100 1000 10000 100000
Entrance pore size, d (nm)
0.00
0.10
0.20
0.30
0.40
0.50
0.60
0.70
0.80
0.90
1.00
Pore
siz
e di
strib
utio
n, n
/no
or S
r nw
Macroporosityfilling apparatus
Microporosity unit
Extrusion dataIntrusion data
Extrusion data
γd = 16.7 kN/m3
γd = 13.7 kN/m3
150nm - 200nmdelimiting zone of intraand inter-aggregate pores

Chapter 3: Backfill experimental study
82
1E+0 1E+1 1E+2 1E+3 1E+4 1E+5Pore diameter (nm)
0.0
0.2
0.4
0.6
0.8
1.0
Mer
cury
Deg
ree
of S
atur
atio
n (S
r nw )
δ = 30 nm
δ = 300 nm
δ = 3000 nm
1E-7
1E-6
1E-5
1E-4
1E-3
1E-2
1E-1
dSr n
w /
dx
δ = 30 nm
δ = 300 nm
δ = 3000 nm
Figure 3.14: Proposed simple model of the evolution of the degree of saturation of the intruded mercury during a MIP test in a soil following equation (10). Dm is the pore size or diameter at which the intruded volume of mercury reaches a maximum.
Dm = 1500 nm
Dm = 150 nm
Dm = 15 nm

Chapter 3: Backfill experimental study
83
0.0 0.2 0.4 0.6 0.8 1.0Degree of saturation
1E+0
1E+1
1E+2
1E+3
1E+4
1E+5
1E+6
Mat
ric
Suct
ion
(kPa
)
β = 0.0001 kPa -1
β = 0.001 kPa -1
β = 0.01 kPa -1
Figure 3.15: Matric suction of a soil from the exponential relation between the pore size of the soil structure and the degree of saturation of the intruded mercury (equation 10). This model has only one parameter closely related to the entrance pore size at which the maximum volume of mercury was intruded (D = δ/2) The three curves correspond to the three non-wetting degree of saturation curves previously depicted in figure 3.14.
0.0 0.2 0.4 0.6 0.8 1.0Degree of Saturation
1E+2
1E+3
1E+4
1E+5
Tota
l Suc
tion
(kPa
)
Sr
0= 0.05; C0= 1 mol/L
β = 0.0001 kPa -1
β = 0.001 kPa -1
β = 0.01 kPa -1
Figure 3.16: Evolution of total suction using the model depending on salt concentration and degree of saturation (equation 14) when a representative volume of soil (REV) is hydrated with salt water. It can be observed the importance of the parameter β on the behaviour of the soil. Small values of β (high air entry values) provide a “normal” retention curve with a decreasing suction when the degree of saturation decreases. However, high values of β (low air entry values) correspond to retention curves in which the osmotic suction increases faster than matric suction decreases.

Chapter 3: Backfill experimental study
84
Figure 3.17: Shape of the total water potential in a clayey soil (low value of β - equation 12) taking into account the effect of the variation of total concentration of salts (by wetting the soil structure with salt water or by drying paths).
Figure 3.18: Shape of the total water potential in a granular soil (high value of β - equation 12) taking into account the effect of the variation of total concentration of salts (by wetting the soil structure with salt water or by drying paths).

Chapter 3: Backfill experimental study
85
Figure 3.19: Schematic representation of the fabric of an expansive soil. a) Soil structure compacted wet of optimum. b) Soil structure compacted dry of optimum. c) Elementary particle arrangement in a parallel configuration (Alonso et al. 1987).

Chapter 3: Backfill experimental study
86
1E-3 1E-2 1E-1 1E+0 1E+1 1E+2 1E+3Pore diameter (µm)
0
30
60
90
120
150
Incr
em. I
ntru
ded
Pore
Vol
ume
(mL/
kg)
γd= 16.6 kN/m3
Salt water
Distilled water
Figure 3.20: Mercury intrusion porosimetry tests for bentonite/sand ratio of 70/30 and compacted at a dry specific weight of γd = 16.6 kN/m3. The specimens were not freeze-dried (after Mata et al. 2002).
1E-3 1E-2 1E-1 1E+0 1E+1 1E+2 1E+3Pore diameter (µm)
0
30
60
90
120
150
Incr
em. I
ntru
ded
Pore
Vol
ume
(mL/
kg)
γd= 13.7 kN/m3
Salt water
Distilled water
Figure 3.21: Mercury intrusion porosimetry tests for bentonite/sand ratio of 70/30 and compacted at a dry specific weight of γd = 13.7 kN/m3. The specimens were not freeze-dried (after Mata et al. 2002).
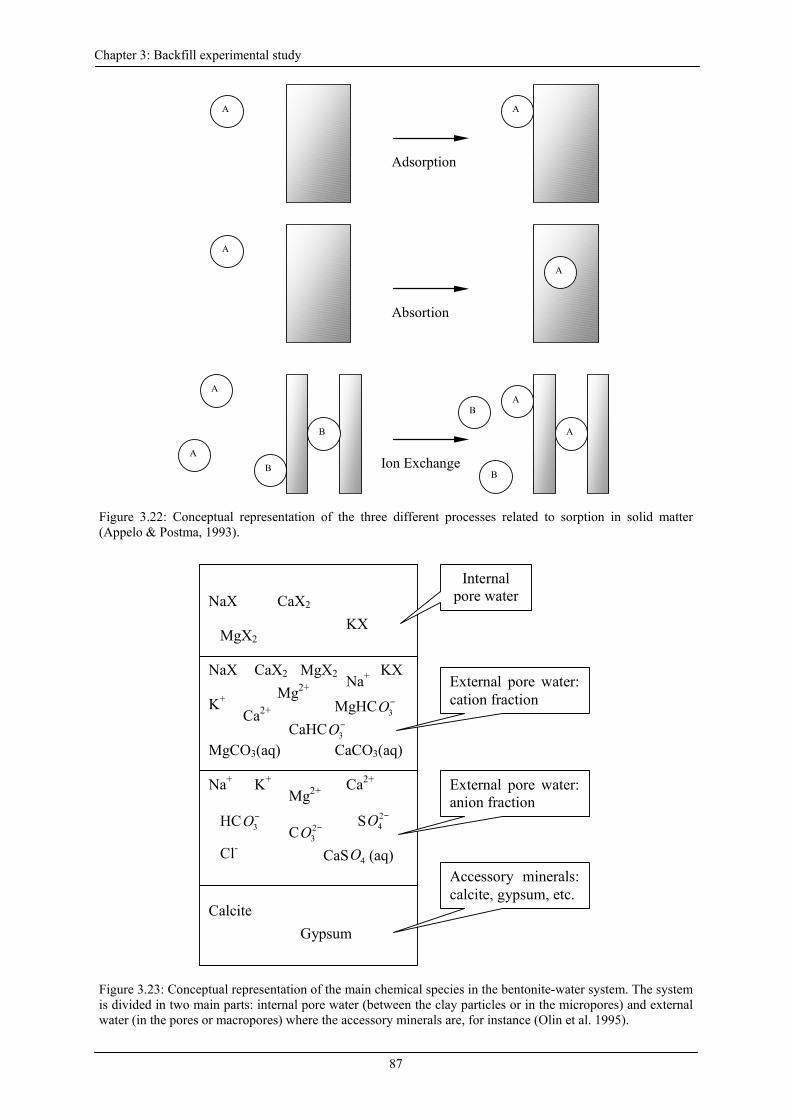
Chapter 3: Backfill experimental study
87
Figure 3.22: Conceptual representation of the three different processes related to sorption in solid matter (Appelo & Postma, 1993).
Figure 3.23: Conceptual representation of the main chemical species in the bentonite-water system. The system is divided in two main parts: internal pore water (between the clay particles or in the micropores) and external water (in the pores or macropores) where the accessory minerals are, for instance (Olin et al. 1995).
A A
Adsorption
A
A
Absortion
A
A
B
B
B
B
A
A
Ion Exchange
NaX CaX2 KX
MgX2
NaX Na+CaX2
Ca2+
CaCO3(aq)
MgX2
MgCO3(aq)
Mg2+ KX
K+ MgHC 3O− CaHC 3O−
Na+ K+ Mg2+
Ca2+
HC 3O− C 2
3O − S 2
4O −
Cl- CaS 4O (aq)
Calcite Gypsum
Internal pore water
External pore water: cation fraction
External pore water: anion fraction
Accessory minerals: calcite, gypsum, etc.

Chapter 3: Backfill experimental study
88
3 3 3 3 3 31E-4 1E-3 1E-2 1E-1 1E+0 1E+1 1E+2Grain size (mm)
0
20
40
60
80
100
% p
assi
ng
SievingLASER diffraction method
Figure 3.24: Grain size distribution of the 30/70 backfill.
0 4 8 12 16 20Water content (%)
16
17
18
19
20
γ d (k
N/m
3)
Sl= 1
Modified Proctor curve
SKB, 1998
UPC, 2002
Figure 3.25: Modified Proctor tests performed in the backfill by Clay Technology (Börgesson et al. 1996) and UPC.
s wd
s wwγ γγ
γ γ=
+

Chapter 3: Backfill experimental study
89
Figure 3.26: Results of Standard Proctor tests performed in two different soils in order to check the influence of brine on their compacting behaviour (Ridley et al. 1984).
8 12 16 20 24Water content (%)
14
15
16
17
18
19
γ d (k
N/m
3)
Distilled Water
Single Energy
Double Energy
Sl= 1
Figure 3.27: Comparison of the backfill compaction tests performed with distilled water at two different levels of energy.

Chapter 3: Backfill experimental study
90
8 12 16 20 24Water content (%)
14
15
16
17
18
19
γ d (k
N/m
3)
Salt Water
Single Energy
Double Energy
Sl= 1
Figure 3.28: Comparison of the backfill compaction tests performed with salt water at two different levels of energy.
8 12 16 20 24Water content (%)
14
15
16
17
18
19
γ d (k
N/m
3)
Single Energy
Distilled Water
Salt Water
Sl= 1
Figure 3.29: Comparison of the results of the backfill compaction tests at the same energy level (simple energy was applied) but when salt content in the hydrating water was changed.

Chapter 3: Backfill experimental study
91
8 12 16 20 24Water content (%)
14
15
16
17
18
19
γ d (k
N/m
3)
Double Energy
Distilled Water
Salt Water
Sl= 1
Figure 3.30: Comparison of the results of the backfill compaction tests at the same energy level (double energy was applied) but when salt content in the hydrating water was changed.
Figure 3.31: Backfill within CIEMAT’s metallic mould before to its static compaction. A water uptake test with distilled water was performed in this specimen after compaction (CIEMAT, 2002).

Chapter 3: Backfill experimental study
92
Data acquisition
Volume changemeasurement
Mixture
Hydrationcircuit
Steel
Porous stoneWater deposit
1.5 m
Figure 3.32: General layout of the water uptake test performed in backfill by CIEMAT (CIEMAT, 2002).
0 500 1000 1500 2000 2500 3000Time (hours)
0
100
200
300
400
500
Wat
er v
olum
e (c
m 3)
Volume of water
Distilled Water
Salt Water
1E-3
1E-2
1E-1
1E+0
1E+1
1E+2
Flo
w o
f rat
e (c
m 3/ h
our)
Flow of rate
Distilled water
Salt water
Figure 3.33: Evolution of injected water volume in two backfill specimens. One specimen was saturated with salt water and the other one was saturated with distilled water. It was clear that salt water speeded up the backfill saturation (CIEMAT, 2002). It can be observed a leakage (≈ 0.1 cm3/h) that clearly affected the tests. This leakage should be taken into account when performing numerical simulations of those tests.

Chapter 3: Backfill experimental study
93
0.00 0.02 0.04 0.06 0.08 0.10 0.12Distance from the water inlet (m)
6
10
14
18
22
26
30
Wat
er C
onte
nt (%
)
Distilled Water
t = 240 hours
t = 600 hours
t = 1200 hours
t = 2400 hours
Figure 3.34: Evolution of backfill water content after water uptake tests performed with distilled water as permeant (CIEMAT, 2002).
0.00 0.02 0.04 0.06 0.08 0.10 0.12Distance from the water inlet (m)
6
10
14
18
22
26
30
Wat
er C
onte
nt (%
)
Salt Water
t = 240 hours
t = 600 hours
t = 1200 hours
t = 2400 hours
Figure 3.35: Evolution of backfill water content after water uptake tests performed with salt water containing 12 g/L of salt as permeant (CIEMAT, 2002).

Chapter 3: Backfill experimental study
94
0.00 0.02 0.04 0.06 0.08 0.10 0.12Distance from the water inlet (m)
13
15
17
19
21
Dry
Spe
cific
Wei
ght (
kN/m
3) t = 0 hours
t = 240 hours
t = 600 hours
t = 1200 hours
t = 2400 hours
Compacting side
Hydrating side
Figure 3.36: Evolution of dry specific weight of specimens hydrated with salt water containing 12 g/L of salt. Moreover, the initial dry specific weight distribution was measured in order to check the effect of friction during the static compaction on this parameter (CIEMAT, 2002).
Figure 3.37: A backfill specimen after being hydrated during 100 days with distilled water. When the backfill was extruded from the cylindrical mould, the water content was measured in five different slices (CIEMAT, 2002).

Chapter 3: Backfill experimental study
95
0.00 0.02 0.04 0.06 0.08 0.10Distance from the water inlet (m)
13
15
17
19
21
23
Wat
er c
onte
nt (%
)
t = 198 hours
6 g/L
12 g/L
18 g/L
24 g/L
Figure 3.38: Comparison of water content profiles after 198 hours of the beginning of the saturation phase of backfill specimens when salt concentration was changed in the hydrating water (Clay Technology, 1998 and 1999).
0.00 0.02 0.04 0.06 0.08 0.10Distance from the water inlet (m)
13
15
17
19
21
23
Wat
er c
onte
nt (%
)
t = 1007 hours
6 g/L
12 g/L
18 g/L
24 g/L
Figure 3.39: Comparison of water content profiles after 1007 hours of the beginning of the saturation phase of backfill specimens when salt concentration was changed in the hydrating water (Clay Technology, 1998 and 1999).

Chapter 3: Backfill experimental study
96
5 6 7 8 9 10 11Water Content (%)
2
5
2
5
1
10
100
Tota
l Suc
tion
(MPa
)
2
5
2
5
10
100
Tota
l Suc
tion
(MPa
)
Dist. water; wetting; loose
1.2 g/L salt; wetting; loose
Dist. water; drying; loose
1.2 g/L salt; drying; loose
Dist. water; wetting; loose
Dist. water; wetting; compacted
Figure 3.40: Results of backfill retention experiments carried out by means of vapour transfer technique. These experiments were performed by Clay Technology (Johannesson et al. 1999).

Chapter 3: Backfill experimental study
97
8 10 12 14 16 18 20Water Content (%)
2
3
5
1
10
Tota
l Suc
tion
(MPa
)
Distilled Water
Salt Water (1.2%)
Figure 3.41: Results of the backfill retention experiments using the Wescor PST-55 transistor psychrometer (after Johannesson et al. 1999).
10
100
1000
10000
100000
5 10 15 20 25 30 35 40
Water ratio (%)
Suct
ion
(kPa
)
30/70 RH, wetting30/70 RH, drying30/70 Psychrometer30/70 Matric suctionFilter paper
Äspö water
Figure 3.42: Compilation of experimental results obtained by Clay Technology when measuring the matric and total suction by means of different techniques in the backfill (Clay Technology, 1999).

Chapter 3: Backfill experimental study
98
0.0 0.2 0.4 0.6 0.8 1.0Degree of Saturation
0.01
0.10
1.00
10.00
100.00
Suct
ion
(MPa
)
UPC - Total Suction - Drying (Sand)
UPC - Total Suction - Wetting (Sand)
UPC - Matric Suction - Drying (Sand)
CT - Matric Suction (Backfill)
Figure 3.43: Summary of the drying and wetting retention curves obtained in the MX-80 – sand mixture. In addition, the matric suction curve measured by Clay Technology is provided.
Figure 3.44: General layout designed and used to perform the oedometer tests at UPC.
π =1.7 MPa

Chapter 3: Backfill experimental study
99
Figure 3.45: Scheme of the modified Rowe’s cell.
0.00 0.04 0.08 0.12 0.16 0.20 0.24Vertical deformation (mm)
0
500
1000
1500
2000
2500
3000
Ext
erna
l Air
Pre
ssur
e (k
Pa)
UNLOAD
LOAD
Figure 3.46: Loading and unloading cycles performed in one of the Rowe cells. These cycles were fit with a mathematical expression and used to take into account the cell deformation during the consolidation steps.

Chapter 3: Backfill experimental study
100
0.00 0.03 0.06 0.09 0.12 0.15 0.18Vertical deformation (mm)
0
500
1000
1500
2000
2500
3000
Ext
erna
l Air
Pre
ssur
e (k
Pa)
UNLOAD
LOAD
Figure 3.47: Loading and unloading cycles performed in the other Rowe cell. These cycles were also fit with a mathematical expression and used to take into account the cell deformation during the consolidation steps.

Chapter 3: Backfill experimental study
101
0 500 1000 1500 2000 2500Time (hours)
-1.4
-1.2
-1.0
-0.8
-0.6
-0.4
-0.2
0.0
0.2
Ver
tical
dis
plac
emen
t (m
m)
40
80
120
160
200
240
p a- p w
(kP
a)
Vertical displacement < 0 (swelling of the soil sample)
Water and airpressure increased
B = 0.91
pa= 400 kPapw= 204 kPa
Figure 3.48: Displacements and swelling pressure evolution of the specimen number 1 (0 g/L salt content and 16.6 kN/m3). B is the Skempton B parameter. pa is the air pressure applied as external load to the specimen in order to keep the vertical displacement close to zero, and pw is the water back pressure applied to the specimen while its saturation.

Chapter 3: Backfill experimental study
102
0 250 500 750 1000 1250 1500Time (hours)
-0.4
-0.3
-0.2
-0.1
0.0
0.1
0.2
Ver
tical
dis
plac
emen
t (m
m)
50
100
150
200
250
p a- p w
(kP
a)
Vertical displacement < 0 (swelling of the soil sample)
Drainageclosed
B = 0.92
pa= 188 kPapw= 5 kPa
Figure 3.49: Displacements and swelling pressure evolution of the specimen number 1 (16 g/L salt content and 16.6 kN/m3). B is the Skempton B parameter. pa is the air pressure applied as external load to the specimen in order to keep the vertical displacement close to zero, and pw is the water back pressure applied to the specimen while its saturation.

Chapter 3: Backfill experimental study
103
1E-3 1E-2 1E-1 1E+0 1E+1 1E+2 1E+3Time (hours)
42
44
46
48
50
52Sa
mpl
e he
ight
(mm
)0 g/L salt contentγd = 16.6 kN/m3
∆σ = 39.2 kPa
∆σ = 78.4 kPa
∆σ = 156.8 kPa
∆σ = 313.6 kPa
∆σ = 627.2 kPa
∆σ = 1254.4 kPa
Figure 3.50: Evolution of the consolidation process during loading steps for specimen number 1 (0 g/L and 16.6 kN/m3).
1E-3 1E-2 1E-1 1E+0 1E+1 1E+2 1E+3Time (hours)
40
42
44
46
48
50
Sam
ple
heig
ht (
mm
)
16 g/L salt contentγd = 16.6 kN/m3
∆σ = 39.2 kPa
∆σ = 78.4 kPa
∆σ = 156.8 kPa
∆σ = 313.6 kPa
∆σ = 627.2 kPa
∆σ = 1254.4 kPa
Figure 3.51: Evolution of the consolidation process during loading steps for specimen number 3 (16 g/L and 16.6 kN/m3).
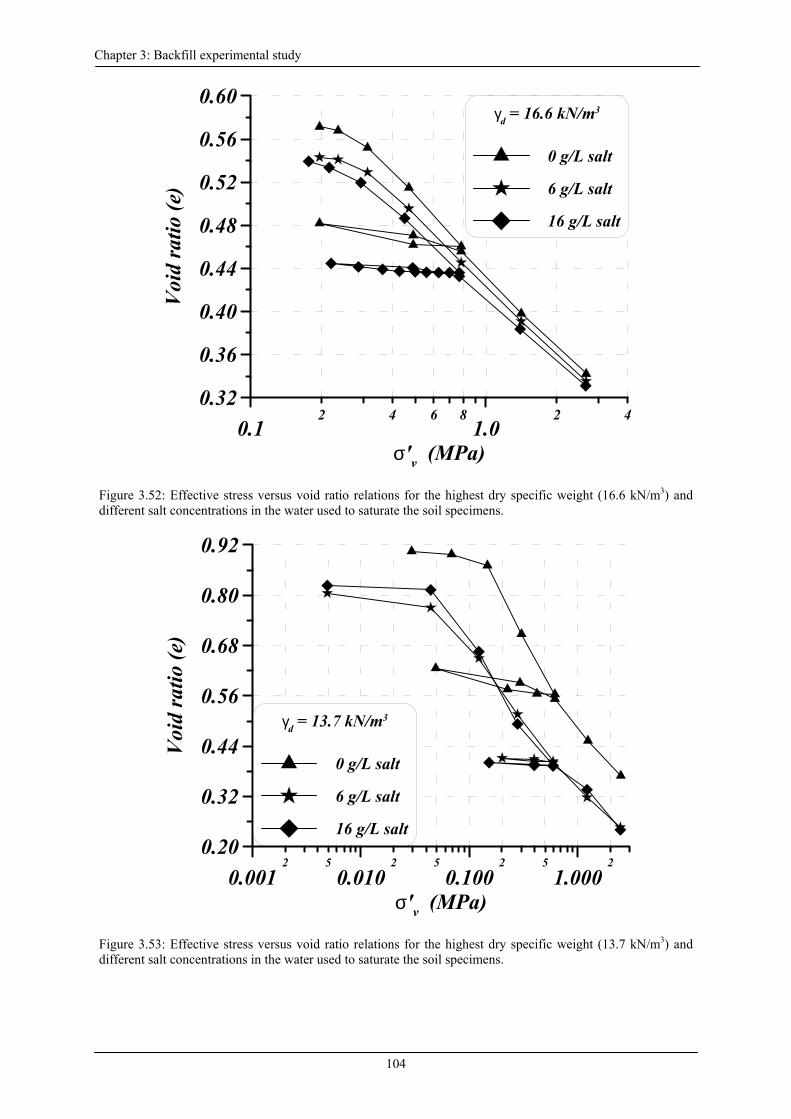
Chapter 3: Backfill experimental study
104
2 4 6 8 2 40.1 1.0
σ'v (MPa)
0.32
0.36
0.40
0.44
0.48
0.52
0.56
0.60
Voi
d ra
tio (e
)
γd = 16.6 kN/m3
0 g/L salt
6 g/L salt
16 g/L salt
Figure 3.52: Effective stress versus void ratio relations for the highest dry specific weight (16.6 kN/m3) and different salt concentrations in the water used to saturate the soil specimens.
2 5 2 5 2 5 20.001 0.010 0.100 1.000
σ'v (MPa)
0.20
0.32
0.44
0.56
0.68
0.80
0.92
Voi
d ra
tio (e
)
γd = 13.7 kN/m3
0 g/L salt
6 g/L salt
16 g/L salt
Figure 3.53: Effective stress versus void ratio relations for the highest dry specific weight (13.7 kN/m3) and different salt concentrations in the water used to saturate the soil specimens.

Chapter 3: Backfill experimental study
105
0.30 0.35 0.40 0.45 0.50 0.55 0.60Void ratio (e)
2
3
5
2
3
5
0.01
0.10
1.00
mv (
MPa
-1)
γd = 16.6 kN/m3
0 g/L salt
6 g/L salt
16 g/L salt
Figure 3.54: Calculated soil compressibility from the void ratio variations measured (highest dry specific weight, 16.6 kN/m3).
0.2 0.3 0.4 0.5 0.6 0.7 0.8 0.9 1.0Void ratio (e)
2
4
68
2
4
68
0.01
0.10
1.00
mv
(MPa
-1)
γd = 13.72 kN/m3
0 g/L salt
6 g/L salt
16 g/L salt
Figure 3.55: Calculated soil compressibility versus void ratio from the void ratio variations measured (lowest dry specific weight, 13.7 kN/m3).

Chapter 3: Backfill experimental study
106
0.30 0.35 0.40 0.45 0.50 0.55 0.60Void ratio (e)
0.01
0.10
1.00
Cc
γd= 16.6 kN/m3
0 g/L salt
6 g/L salt
16 g/L salt
Figure 3.56: Compression index calculated in the loading branch for the soil specimens initially compacted at 16.6 kN/m3.
0.2 0.4 0.6 0.8 1.0Void ratio (e)
0.00
0.01
0.10
1.00
Ccγd= 13.7 kN/m3
0 g/L salt
6 g/L salt
16 g/L salt
Figure 3.57: Compression index calculated in the loading branch for the soil specimens initially compacted at 13.7 kN/m3.

Chapter 3: Backfill experimental study
107
0.25 0.30 0.35 0.40 0.45 0.50 0.55 0.60Void ratio (e)
2
3
5
1E-9
1E-8
Cv
(m2 /s
)γd = 16.6 kN/m3
0 g/L salt
6 g/L salt
16 g/L salt
Figure 3.58: Consolidation coefficient versus void ratio for the high dry specific weight.
0.2 0.3 0.4 0.5 0.6 0.7 0.8 0.9 1.0Void ratio (e)
3
3
3
3
3
1E-10
1E-9
1E-8
1E-7
1E-6
1E-5
Cv
(m2 /s
)
γd = 13.72 kN/m3
0 g/L salt
6 g/L salt
16 g/L salt
Figure 3.59: Consolidation coefficient versus void ratio for the small dry specific weight.

Chapter 3: Backfill experimental study
108
0.30 0.35 0.40 0.45 0.50 0.55 0.60Void ratio (e)
235
235
235
1E-13
1E-12
1E-11
1E-10
Hyd
raul
ic C
ondu
ctiv
ity (
m/s
) γd = 16.6 kN/m3
0 g/L salt
6 g/L salt
16 g/L salt
Figure 3.60: Estimated hydraulic conductivity for the high dry specific weight.
0.2 0.3 0.4 0.5 0.6 0.7 0.8 0.9 1.0Void ratio (e)
3
3
3
3
3
1E-13
1E-12
1E-11
1E-10
1E-9
1E-8
Hyd
raul
ic C
ondu
ctiv
ity (
m/s
) γd = 13.72 kN/m3
0 g/L salt
6 g/L salt
16 g/L salt
Figure 3.61: Estimated hydraulic conductivity for the small dry specific weight.

Chapter 3: Backfill experimental study
109
Figure 3.62: Summary of the hydraulic tests performed by Clay Technology (Clay Technology, 2000) in order to estimate backfill saturated permeability. Equipment of different diameters was used in the study. Äspö water (12 g/L) and distilled water were injected to saturate the specimens. Initial water content of the specimens was close to 13% excepting the one, which is marked as its initial water content was 6.5%.
16 17 18 19 20γd (kN/m3)
1E-13
1E-12
1E-11
1E-10
1E-9
Hyd
raul
ic c
ondu
ctiv
ity (m
/s)
Triaxial, Dist., (CT)
Flow, Dist., φ = 250 mm (CT)
Flow, Äspö, φ = 250 mm (CT)
Flow, Äspö, φ = 101 mm (CT)
Oedom., Dist., (CT)
Oedom., Dist., φ = 152 mm (UPC)
Oedom., 6 g/L, φ = 152 mm (UPC)
Oedom., 16 g/L, φ = 152 mm (UPC)
Figure 3.63: Comparison of backfill hydraulic conductivity estimated from the oedometer tests performed by UPC in compacted specimens at dry specific weight of 16.6 kN/m3 and different salinity and the results obtained by Clay Technology. It is important to point out that Äspö water contains 12 g/L of salt.
1.E-13
1.E-12
1.E-11
1.E-10
1.E-09
1.E-08
1.E-07
1.5 1.6 1.7 1.8 1.9 2 2.1
Dry Density, g/cm³
Hyd
raul
ic C
ondu
ctiv
ity, m
/sØ 250 mm Dist.Ø 250 mm ÄspöØ 101 mm ÄspöØ 101 mm ÄspöTriaxial cell ÄspöOedometer tests
wini = 6.5%

Chapter 3: Backfill experimental study
110
0.00 0.02 0.04 0.06 0.08 0.10 0.12Distance from water inlet (m)
250
500
750
1000
1250
1500
Solu
ble
Sodi
um (m
g/kg
)
Sodium - Distilled water
t = 10 days
t = 25 days
t = 50 days
t = 100 days
Figure 3.64: Distribution of soluble sodium after the infiltration tests or water uptake tests when backfill specimens were hydrated with distilled water (CIEMAT, 2002).
0.00 0.02 0.04 0.06 0.08 0.10 0.12Distance from water inlet (m)
0
250
500
750
1000
1250
1500
1750
2000
Solu
ble
Sodi
um (m
g/kg
)
Sodium - Salt water
t = 10 days
t = 25 days
t = 50 days
t = 100 days
Figure 3.65: Distribution of soluble sodium after the infiltration tests or water uptake tests when backfill specimens were hydrated with salt water containing 12 g/L of NaCl and CaCl2, 68/32 by mass (CIEMAT, 2002).

Chapter 3: Backfill experimental study
111
0.00 0.02 0.04 0.06 0.08 0.10 0.12Distance from water inlet (m)
0
10
20
30
40
50
Solu
ble
Cal
cium
(mg/
kg)
Calcium - Distilled water
t = 10 days
t = 25 days
t = 50 days
t = 100 days
Figure 3.66: Distribution of soluble calcium after the infiltration tests or water uptake tests when backfill specimens were hydrated with distilled water (CIEMAT, 2002).
0.00 0.02 0.04 0.06 0.08 0.10 0.12Distance from water inlet (m)
-10
0
10
20
30
40
50
Solu
ble
Cal
cium
(mg/
kg)
Calcium - Salt water
t = 10 days
t = 25 days
t = 50 days
t = 100 days
Figure 3.67: Distribution of soluble calcium after the infiltration tests or water uptake tests when backfill specimens were hydrated with salt water containing 12 g/L of NaCl and CaCl2, 68/32 by mass (CIEMAT, 2002).

Chapter 3: Backfill experimental study
112
0.00 0.02 0.04 0.06 0.08 0.10 0.12Distance from water inlet (m)
250
500
750
1000
1250
1500
1750
2000
Solu
ble
Sodi
um (m
g/kg
)
t = 10 days
Distilled water
Salt water
0.02 0.04 0.06 0.08 0.10 0.12Distance from water inlet (m)
250
500
750
1000
1250
1500
1750
2000
Solu
ble
Sodi
um (m
g/kg
)
t = 25 days
Distilled water
Salt water
t = 50 days
Distilled water
Salt water
t = 100 days
Distilled water
Salt water
Figure 3.68: Concentration of soluble Na in different sections of the clay specimen after the water uptake tests. A comparison of distilled and saline water used for each duration (10, 25, 50 and 100 days) is depicted (CIEMAT, 2002).
0.00 0.02 0.04 0.06 0.08 0.10 0.12Distance from water inlet (m)
0
10
20
30
40
50
Solu
ble
Cal
cium
(mg/
kg)
t = 10 days
Distilled water
Salt water
0.02 0.04 0.06 0.08 0.10 0.12Distance from water inlet (m)
10
20
30
40
50
Solu
ble
Cal
cium
(mg/
kg)
t = 25 days
Distilled water
Salt water
t = 50 days
Distilled water
Salt water
t = 100 days
Distilled water
Salt water
Figure 3.69: Concentration of soluble Ca in different sections of the clay specimen after the water uptake tests. A comparison of distilled and saline water used for each duration (10, 25, 50 and 100 days) is depicted (CIEMAT, 2002).