chapter 3: dealing with household debt - world economic outlook
TRANSCRIPT

3chapter Dealing with householD Debt
International Monetary Fund | April 2012 89
Does household debt amplify downturns and weaken recoveries? Based on an analysis of advanced economies over the past three decades, we find that housing busts and recessions preceded by larger run-ups in household debt tend to be more severe and protracted. These patterns are consistent with the predictions of recent theoretical models. Based on case studies, we find that government policies can help prevent prolonged contractions in economic activity by addressing the problem of excessive household debt. In particular, bold household debt restructuring programs such as those implemented in the United States in the 1930s and in Iceland today can significantly reduce debt repayment burdens and the number of household defaults and foreclosures. Such policies can therefore help avert self-reinforcing cycles of household defaults, further house price declines, and additional contractions in output.
Household debt soared in the years leading up to the Great Recession. In advanced economies, during the five years preceding 2007, the ratio of household debt to income rose by an average of 39 percent-age points, to 138 percent. In Denmark, Iceland, Ireland, the Netherlands, and Norway, debt peaked at more than 200 percent of household income. A surge in household debt to historic highs also occurred in emerging economies such as Estonia, Hungary, Latvia, and Lithuania. The concurrent boom in both house prices and the stock market meant that household debt relative to assets held broadly stable, which masked households’ growing exposure to a sharp fall in asset prices (Figure 3.1).
When house prices declined, ushering in the global financial crisis, many households saw their wealth shrink relative to their debt, and, with less income and more unemployment, found it harder to meet mortgage payments. By the end of 2011, real house prices had fallen from their peak by about 41
percent in Ireland, 29 percent in Iceland, 23 percent in Spain and the United States, and 21 percent in Denmark. Household defaults, underwater mort-gages (where the loan balance exceeds the house value), foreclosures, and fire sales are now endemic to a number of economies. Household deleveraging by paying off debts or defaulting on them has begun in some countries. It has been most pronounced in the United States, where about two-thirds of the debt reduction reflects defaults (McKinsey, 2012).
What does this imply for economic performance? Some studies suggest that many economies’ total gross debt levels are excessive and need to decline.1 For example, two influential reports by McKin-sey (2010, 2012) emphasize that to “clear the way” for economic growth, advanced economies need to reverse the recent surge in total gross debt. Yet others suggest that the recent rise in debt is not necessar-ily a reason for concern. For example, Fatás (2012) argues that the McKinsey reports’ focus on gross debt is “very misleading,” since what matters for countries is net wealth and not gross debt.2 A high level of private sector debt as a share of the economy is also often interpreted as a sign of financial devel-opment, which in turn is beneficial for long-term growth (see, for example, Rajan and Zingales, 1998). Similarly, Krugman (2011) notes that because gross debt is “(mostly) money we owe to ourselves,” it is not immediately obvious why it should matter. However, Krugman also cautions that gross debt can become a problem. Overall, there is no accepted wis-dom about whether and how gross debt may restrain economic activity.
1Sovereign debt rose sharply in advanced economies as a result of the crisis, and overall gross debt has reached levels not seen in half a century.
2To illustrate this point, Fatás (2012) refers to Japan, where the gross-debt-to-GDP ratio is exceptionally high but where, reflecting years of current account surpluses, the economy is a net creditor to the rest of the world. Similarly, the elevated Japanese gross government debt stock corresponds to large private sector assets.
The main authors of this chapter are Daniel Leigh (team leader), Deniz Igan, John Simon, and Petia Topalova, with con-tributions from Edda Rós Karlsdóttir and Franek Rozwadowski and support from Shan Chen and Angela Espiritu. Christopher Carroll was the external consultant.

wo r l d e co n o m i c o u t lo o k : G r ow t h r e s um i n G, da n G e r s r e ma i n
90 International Monetary Fund | April 2012
This chapter contributes to the debate over gross debt by focusing on the household sector. Previous studies have focused more on deleveraging by other sectors.3 In particular, we address the following questions: • What is the relationship between household
debt and the depth of economic downturns? Are busts that are preceded by larger run-ups in gross household debt typically more severe?
• Why might gross household debt be a problem? What are the theoretical mechanisms by which gross household debt and deleveraging may restrain economic activity?4
• What can governments do to support growth when household debt becomes a problem? In particular, what policies have been effective in reducing the extent of household debt overhang and in averting unnecessary household defaults, foreclosures, and fire sales? How effective have recent initiatives been?5
To address these questions, we first conduct a statistical analysis of the relationship between house-hold debt and the depth of economic downturns. Our purpose is to provide prima facie evidence rather than to establish causality. We focus on hous-ing busts, given the important role of the housing market in triggering the Great Recession, but also consider recessions more generally. We then review the theoretical reasons why household debt might constrain economic activity. Finally, we use selected case studies to investigate which government policies have been effective in dealing with excessive house-
3For example, see Chapter 3 of the October 2010 World Economic Outlook, which assesses the implications of sovereign deleveraging (fiscal consolidation). Since deleveraging by various sectors—household, bank, corporate, and sovereign—will have different implications for economic activity, each is worth study-ing in its own right.
4A related question is what level of household debt is optimal, but such an assessment is beyond the scope of this chapter.
5We do not investigate which policies can help prevent the excessive buildup of household debt before the bust, an issue that is addressed in other studies. These two sets of policies are not mutually exclusive. For example, policies that prevent an exces-sive buildup in household debt during a boom can alleviate the consequences of a bust. See Crowe and others (2011), Chapter 3 of the September 2011 Global Financial Stability Report, and Dell’Ariccia and others (forthcoming) for policies designed to avert real estate price booms and restrain rapid growth in private sector debt.
Sources: Eurostat; Haver Analytics; Federal Reserve Bank of New York; Reserve Bank of Australia; Bank of Spain; U.K. Council of Mortgage Lenders; Statistics Iceland; Central Bank of Ireland; Chapter 3 of April 2011 Global Financial Stability Report; and IMF staff calculations.Note: The shaded areas in panels 1 and 2 denote the interquartile range of the change in the household debt-to-income ratio since 2002 and the real house price index, respectively. Nonperforming loans are loans more than 90 days in arrears.
3. Nonperforming Mortgage Loans(percent of total household mortgage loans outstanding)
United States
United Kingdom SpainCanada
Ireland
Australia
01
2345
6789
10
2002 04 06 08 10:Q4
2. Real House Prices(2002 = 100)
80
100
120
140
160
180
2002 04 06 08 10
United States
Ireland
Spain
MedianNorway
Denmark
United Kingdom
Netherlands
Iceland
1. Household Debt-to-Income Ratio(change since 2002; percentage points)
–20
0
20
40
60
80
100
120
2002 04 06 08 10
United States
Ireland
SpainMedianIceland
Denmark
NetherlandsNorway
United Kingdom
Household debt and house prices soared in the years leading up to the Great Recession. When house prices declined, ushering in the global financial crisis, household nonperforming mortgage loans rose sharply in a number of economies.
Figure 3.1. Household Debt, House Prices, and Nonperforming Mortgage Loans, 2002–10
©International Monetary Fund. Not for Redistribution
c h a p t e r 3 D e A l i n g w i t h h o u s e h o l D D e bt
International Monetary Fund | April 2012 91
hold debt. The episodes considered are the United States in the 1930s and today, Hungary and Iceland today, Colombia in 1999, and the Scandinavian countries in the early 1990s. In each case, there was a housing bust preceded by or coinciding with a substantial increase in household debt, but the policy responses were very different.
These are the chapter’s main findings: • Housing busts preceded by larger run-ups in gross
household debt are associated with significantly larger contractions in economic activity. The declines in household consumption and real GDP are substantially larger, unemployment rises more, and the reduction in economic activity persists for at least five years. A similar pattern holds for recessions more generally: recessions preceded by larger increases in household debt are more severe.
• The larger declines in economic activity are not simply a reflection of the larger drops in house prices and the associated destruction of household wealth. It seems to be the combination of house price declines and prebust leverage that explains the severity of the contraction. In particular, household consumption falls by more than four times the amount that can be explained by the fall in house prices in high-debt economies. Nor is the larger contraction simply driven by financial crises. The relationship between household debt and the contraction in consumption also holds for economies that did not experience a banking crisis around the time of the housing bust.
• Macroeconomic policies are a crucial element of forestalling excessive contractions in economic activity during episodes of household deleverag-ing. For example, monetary easing in econo-mies in which mortgages typically have variable interest rates, as in the Scandinavian countries, can quickly reduce mortgage payments and avert household defaults. Similarly, fiscal transfers to households through social safety nets can boost households’ incomes and improve their ability to service debt, as in the Scandinavian countries. Such automatic transfers can further help prevent self-reinforcing cycles of rising defaults, declining house prices, and lower aggregate demand. Mac-roeconomic stimulus, however, has its limits. The zero lower bound on nominal interest rates can
prevent sufficient rate cuts, and high government debt may constrain the scope for deficit-financed transfers.
• Government policies targeted at reducing the level of household debt relative to household assets and debt service relative to household repayment capacity can—at a limited fiscal cost—substan-tially mitigate the negative effects of household deleveraging on economic activity. In particular, bold and well-designed household debt restruc-turing programs, such as those implemented in the United States in the 1930s and in Iceland today, can significantly reduce the number of household defaults and foreclosures. In so doing, these programs help prevent self-reinforcing cycles of declining house prices and lower aggregate demand. The first section of this chapter conducts a statisti-
cal analysis to shed light on the relationship between the rise in household debt during a boom and the severity of the subsequent bust. It also reviews the theoretical literature to identify the channels through which shifts in household gross debt can have a negative effect on economic activity. The second section provides case studies of government policies aimed at mitigating the negative effects of household debt during housing busts. The last section discusses the implications of our findings for economies facing household deleveraging.
how household Debt can constrain economic activity
This section sheds light on the role of gross household debt in amplifying slumps by analyzing the experience of advanced economies over the past three decades. We also review the theoretical reasons gross household debt can deepen and prolong eco-nomic contractions.
stylized Facts: household Debt and housing busts
Are housing busts more severe when they are preceded by large increases in gross household debt? To answer this question, we provide some stylized facts about what happens when a housing bust occurs in two groups of economies. The first has a
WEO_Ch 03.indd 91 4/11/12 2:03 PM

wo r l d e co n o m i c o u t lo o k : G r ow t h r e s um i n G, da n G e r s r e ma i n
92 International Monetary Fund | April 2012
housing boom but no increase in household debt. The other has a housing boom and a large increase in household debt. We focus on housing busts, given how prevalent they were in advanced economies during the Great Recession.6 But we also report results for recessions in general, whether or not they are associated with a housing bust. We start by summarizing how different economies fared during the Great Recession depending on the size of their household debt buildup. We then use a more refined statistical approach to consider the broader historical experience with housing busts and recessions and to distinguish the role of household debt from the roles of financial crises and house price declines.
The Great Recession
The Great Recession was particularly severe in economies that had a larger buildup in household debt prior to the crisis. As Figure 3.2 shows, the consumption loss in 2010 relative to the precrisis trend was greater for economies that had a larger rise in the gross household debt-to-income ratio during 2002–06.7 The consumption loss in 2010 is the gap between the (log) level of real household consumption in 2010 and the projection of where real household consumption would have been that year based on the precrisis trend. The precrisis trend is, in turn, defined as the extrapolation of the (log) level of real household consumption based on a linear trend estimated from 1996 to 2004, follow-ing the methodology of Chapter 4 of the September 2009 World Economic Outlook. The estimation of the precrisis trend ends several years before the crisis so that it is not contaminated by the possibility of an unsustainable boom during the run-up to the crisis or a precrisis slowdown. The slope of the regres-sion line is –0.26, implying that for each additional 10 percentage point rise in household debt prior to the crisis, the consumption loss was larger by 2.6
6Housing-related debt (mortgages) comprises about 70 percent of gross household debt in advanced economies. The remainder consists mainly of credit card debt and auto loans.
7See Appendix 3.1 for data sources. Glick and Lansing (2010) report a similar finding for a smaller cross-section of advanced economies.
–50
–40
–30
–20
–10
0
10
–20 –9 2 13 24 36 47 58 69 80
ROM
POL
SVN
HRV LTU
HUN
LVA
EST
SVKCZE
KOR
TWN
ISRCYP
NZLAUS
ESP
PRT
IRLISL
GRC
FINJPN
CANCHE
SWENOR
NLDITA
DEUFRA
DNKBEL
AUT
GBRUSA
Cons
umpt
ion
loss
in 2
010
(per
cent
of p
recr
isis
tren
d)
Household debt-to-income ratio increase (2002–06)
Figure 3.2. The Great Recession: Consumption Loss versus Precrisis Rise in Household Debt (Percent)
The Great Recession was particularly severe in economies that experienced a larger run-up in household debt prior to the crisis.
Sources: Eurostat; Haver Analytics; and IMF staff calculations.Note: The consumption loss in 2010 is the gap between the (log) level of real household
consumption in 2010 and the projection of where real household consumption would have been that year based on the precrisis trend. The precrisis trend is defined as the extrapolation of the (log) level of real household consumption based on a linear trend estimated from 1996 to 2004. AUS: Australia; AUT: Austria; BEL: Belgium; CAN: Canada; CHE: Switzerland; CYP: Cyprus; CZE: Czech Republic; DEU: Germany; DNK: Denmark; ESP: Spain; EST: Estonia; FIN: Finland; FRA: France; GBR: United Kingdom; GRC: Greece; HRV: Croatia; HUN: Hungary; IRL: Ireland; ISL: Iceland; ISR: Israel; ITA: Italy; JPN: Japan; KOR: Korea; LTU: Lithuania; LVA: Latvia; NLD: Netherlands; NOR: Norway; NZL: New Zealand; POL: Poland; PRT: Portugal; ROM: Romania; SVK: Slovak Republic; SVN: Slovenia; SWE: Sweden; TWN: Taiwan Province of China; USA: United States.
WEO_Ch 03.indd 92 4/11/12 2:03 PM

c h a p t e r 3 D e A l i n g w i t h h o u s e h o l D D e bt
International Monetary Fund | April 2012 93
percentage points, a substantial (and statistically significant) relationship.8
Historical experience
Is the Great Recession part of a broader historical pattern—specifically, are busts that are preceded by larger run-ups in gross household debt usually more severe? To answer this question, we use statistical techniques to relate the buildup in household debt during the boom to the nature of economic activity during the bust. Given the data available on gross household debt, we focus on a sample of 24 Organi-zation for Economic Cooperation and Development (OECD) economies and Taiwan Province of China during 1980–2011. First, we identify housing busts based on the turning points (peaks) in nominal house prices compiled by Claessens, Kose, and Terrones (2010).9 For our sample of 25 economies, this yields 99 housing busts. Next, we divide the housing busts into two groups: those that involved a large run-up in the household debt-to-income ratio during the three years leading up to the bust and those that did not.10 We refer to the two groups as “high-debt” and “low-debt” busts, respectively. Other measures of leverage (such as debt-to-assets and debt-to-net-worth ratios) are not widely avail-able for our multicountry sample. Finally, we regress
8The sharper fall in consumption in high-debt growth econo-mies does not simply reflect the occurrence of banking crises. The relationship between household debt accumulation and the depth of the Great Recession remains similar and statistically significant after excluding the 18 economies that experienced a banking crisis at some point during 2007–11, based on the banking crises identified by Laeven and Valencia (2010). The sharper contrac-tion in consumption also does not reflect simply a bigger precrisis consumption boom. The finding of a strong inverse relationship between the precrisis debt run-up and the severity of the recession is similar and statistically significant when controlling for the precrisis boom in consumption.
9Claessens, Kose, and Terrones (2010) identify turning points in nominal house prices using the Harding and Pagan (2002) algorithm.
10For our baseline specification, we define a “large” increase in debt as an increase above the median of all busts, but, as the robustness analysis in Appendix 3.2 reports, the results do not depend on this precise threshold. The median is an increase of 6.7 percentage points of household income over the three years lead-ing up to the bust, and there is a wide variation in the size of the increase. For example, the household debt-to-income ratio rose by 17 percentage points during the period leading up to the U.K. housing bust of 1989 and by 68 percentage points before the Irish housing bust of 2006.
measures of economic activity on the housing bust dummies for the two groups using a methodology similar to that of Cerra and Saxena (2008), among others. Given our focus on the household sector, we start by considering the behavior of household consumption and then report results for GDP and its components, unemployment, and house prices.
Specifically, we regress changes in the log of real household consumption on its lagged values (to capture the normal fluctuations of consumption) as well as on contemporaneous and lagged values of the housing bust dummies. Including lags allows house-hold consumption to respond with a delay to hous-ing busts.11 To test whether the severity of housing busts differs between the two groups, we interact the housing bust dummy with a dummy variable that indicates whether the bust was in the high-debt group or the low-debt group. The specification also includes a full set of time fixed effects to account for common shocks, such as shifts in oil prices, and economy-specific fixed effects to account for differences in the economies’ normal growth rates. The estimated responses are cumulated to recover the evolution of the level of household consumption following a housing bust. The figures that follow indicate the estimated response of consumption and 1 standard error band around the estimated response.
The regression results suggest that housing busts preceded by larger run-ups in household debt tend to be followed by more severe and longer-lasting declines in household consumption. Panel 1 of Figure 3.3 shows that the decline in real household consumption is 4.3 percent after five years for the high-debt group and only 0.4 percent for the low-debt group. The difference between the two samples is 3.9 percentage points and is statistically significant at the 1 percent level, as reported in Appendix 3.2. These results survive a variety of robustness tests, including different estimation approaches (such as generalized method of moments), alternative specifications (changing the lag length), and drop-ping outliers (as identified by Cook’s distance). (See Appendix 3.2 on the robustness checks.)
11Appendix 3.2 provides further details on the estimation methodology.
WEO_Ch 03.indd 93 4/11/12 2:03 PM

wo r l d e co n o m i c o u t lo o k : G r ow t h r e s um i n G, da n G e r s r e ma i n
94 International Monetary Fund | April 2012
Housing busts preceded by larger run-ups in household leverage result in more contraction of general economic activity. Figure 3.3 shows that real GDP typically falls more and unemployment rises more for the high-debt busts. Net exports typically make a more positive contribution to GDP––par-tially offsetting the fall in domestic demand––but this reflects a greater decline in imports rather than a boom in exports.12
A logical question is whether the larger decline in household spending simply reflects larger declines in house prices. Panel 1 of Figure 3.4 shows that real house prices do indeed fall significantly more after highly leveraged busts. The fall in real house prices is 10.8 percentage points larger in the high-debt busts than in the low-debt busts, and the differ-ence between the two samples is significant at the 1 percent level. However, this larger fall in house prices cannot plausibly explain the greater decline in household consumption. Real consumption declines by more than 3.9 percentage points more in the high-debt busts, implying an elasticity of about 0.4, well above the range of housing wealth consumption elasticities in the literature (0.05–0.1). Based on this literature, the fall in house prices therefore explains at most one-quarter of the decline in household consumption. To further establish that the decline in consumption reflects more than just house price declines, we repeat the analysis while replacing the housing bust dummy variable with the decrease in house prices (in percent). The results suggest that for the same fall in real house prices (1 percent), real household consumption falls by about twice as much during high-debt busts as during low-debt busts. Therefore, it seems to be the combination of house price declines and the prebust leverage that explains the severity of the contraction of household consumption.
Moreover, household deleveraging tends to be more pronounced following busts preceded by a larger run-up in household debt. In particular, the household debt-to-income ratio declines by 5.4 per-
12Estimation results for investment also show a larger fall for the high-debt busts. Estimation results for residential investment (for which data are less widely available) also show a larger fall for the high-debt busts, but the responses are not precisely estimated due to the smaller sample size.
–4
–3
–2
–1
0
1
2
0 1 2 3 4 5–0.5
0.0
0.5
1.0
1.5
2.0
0 1 2 3 4 5
–6
–5
–4
–3
–2
–1
0
1
2
0 1 2 3 4 5
2. GDP 3. Unemployment
4. Domestic Demand Contribution
–1.0
–0.5
0.0
0.5
1.0
1.5
2.0
2.5
0 1 2 3 4 5
5. Net Exports Contribution
High-debt busts Low-debt busts
–6
–5
–4
–3
–2
–1
0
1
0 1 2 3 4 5
1. Household Consumption
Source: IMF staff calculations.Note: X-axis units are years, where t = 0 denotes the year of the housing bust. Dashed
lines indicate 1 standard error bands. High- and low-debt busts are defined, respectively, as above and below the median increase in the household debt-to-income ratio during the three years preceding the bust. The unemployment rate and the contributions to GDP are in percentage points; all other variables are in percent.
Real household spending and GDP fall more during housing busts preceded by a larger run-up in household debt, and the unemployment rate rises more. There is a greater fall in domestic demand, which is partly offset by a rise in net exports.
Figure 3.3. Economic Activity during Housing Busts
WEO_Ch 03.indd 94 4/11/12 2:03 PM

c h a p t e r 3 D e A l i n g w i t h h o u s e h o l D D e bt
International Monetary Fund | April 2012 95
centage points following a high-debt housing bust (Figure 3.5). The decline is statistically significant. In contrast, there is no decline in the debt-to-income ratio following low-debt housing busts. Instead, there is a small and statistically insignificant increase. This finding suggests that part of the stronger con-traction in economic activity following high-debt housing busts reflects a more intense household deleveraging process.
It is important to establish whether the results are driven by financial crises. The contractionary effects of such crises have already been investigated by previous studies (Cerra and Saxena, 2008; Chapter 4 of the September 2009 World Economic Outlook; and Reinhart and Rogoff, 2009, among others). We find that the results are not driven by the global financial crisis—similar results apply when the sample ends in 2006, as reported in Appendix 3.2. Moreover, we find similar results when we repeat the analysis but focus only on housing busts that were not preceded or followed by a systemic banking crisis, as identified by Laeven and Valencia (2010), within a two-year window on either side of the housing bust. For this limited set of housing busts, those preceded by a larger accumulation of household debt are followed by deeper and more prolonged downturns (Figure 3.6). So the results are not simply a reflection of banking crises.
Finally, it is worth investigating whether high household debt also exacerbates the effects of other adverse shocks. We therefore repeat the analysis but replace the housing bust dummies with reces-sion dummies. We construct the recession dummies based on the list of recession dates provided by Howard, Martin, and Wilson (2011). Figure 3.6 also shows that recessions preceded by a larger run-up in household debt do indeed tend to be more severe and protracted.
Overall, this analysis suggests that when house-holds accumulate more debt during a boom, the subsequent bust features a more severe contraction in economic activity. These findings for OECD economies are consistent with those of Mian, Rao, and Sufi (2011) for the United States. These authors use detailed U.S. county-level data for the Great Recession to identify the causal effect of household debt. They conclude that the greater decline in
1. Real House Prices(difference between high- and low-debt busts; percentage points)
2. Real Household Consumption(difference between high- and low-debt busts; percentage points)
House price component
Total
0.103. Consumption following a 1 percent Decline in House Prices(percent)
–16–14
–12–10–8
–6–4–2
02
4
0 1 2 3 4 5
–5
–4
–3
–2
–1
0
1
2
0 1 2 3 4 5
–0.35
–0.30
–0.25
–0.20
–0.15
–0.10
–0.05
0.00
0.05
0 1 2 3 4 5
High-debt Low-debt
Source: IMF staff calculations.Note: X-axis units are years, where t = 0 denotes the year of the housing bust. Dashed
lines indicate 1 standard error bands. House price component is defined as the fall in real house prices multiplied by a benchmark elasticity of consumption relative to real housing wealth, based on existing studies (0.075). High- and low-debt are defined, respectively, as above and below the median increase in the household debt-to-income ratio during the three years preceding the fall in house prices.
House prices fall more during housing busts preceded by a larger run-up in debt, but this alone cannot explain the sharper decline in consumption in the wake of such busts. The larger fall in house prices explains about a quarter of the greater decline in consumption based on a standard elasticity of consumption with respect to housing wealth. Also, a 1 percent decline in real house prices is typically associated with a larger decline in real household consumption when it is preceded by a larger run-up in household debt.
Figure 3.4. Housing Wealth and Household Consumption
WEO_Ch 03.indd 95 4/11/12 2:03 PM

wo r l d e co n o m i c o u t lo o k : G r ow t h r e s um i n G, da n G e r s r e ma i n
96 International Monetary Fund | April 2012
consumption after 2007 in U.S. counties that accumulated more debt during 2002–06 is too large to be explained by the larger fall in house prices in those counties.13 This is consistent with the cross-country evidence in Figure 3.4. They also find evidence of more rapid household deleveraging in high-debt U.S. counties, which underscores the role of deleveraging and is consistent with the cross-country evidence in Figure 3.5. In related work, Mian and Sufi (2011) show that a higher level of household debt in 2007 is associated with sharper declines in spending on consumer durables, residen-tial investment, and employment (Figure 3.7). Based on their findings, they conclude that the decline in aggregate demand driven by household balance sheet weakness explains the majority of the job losses in the United States during the Great Recession (Mian and Sufi, 2012).
The findings are also broadly consistent with the more general finding in the literature that recessions preceded by economy-wide credit booms—which may or may not coincide with household credit booms—tend to be deeper and more protracted than other recessions (see, for example, Claessens, Kose, and Terrones, 2010; and Jordà, Schularick, and Taylor, 2011). This conclusion is also consistent with evidence that consumption volatility is positively correlated with household debt (Isaksen and others, 2011).
why Does household Debt Matter?
We have found evidence that downturns are more severe when they are preceded by larger increases in household debt. This subsection discusses how the pattern fits with the predictions of theoreti-cal models. A natural starting point is to consider a closed economy with no government debt. In such an economy, net private debt must be zero, because one person’s debt is another’s asset. Some people may accumulate debt, but this would simply
13In particular, by comparing house price declines with consumption declines in counties with high and low levels of household debt, they obtain an implicit elasticity of consump-tion relative to house prices of 0.3 to 0.7, which is well above the range of estimates in the literature. This suggests that only 14 to 30 percent of the greater decline in consumption in high-debt counties is due to the larger falls in house prices in those counties.
–10
–8
–6
–4
–2
0
2
4
0 1 2 3 4 5
High-debt busts Low-debt busts
The reduction in household debt (deleveraging) is more pronounced during housing busts preceded by a larger buildup in indebtedness.
Source: IMF staff calculations.Note: X-axis units are years, where t = 0 denotes the year of the housing bust. Dashed
lines indicate 1 standard error bands. High- and low-debt busts are defined, respectively, as above and below the median increase in the household debt-to-income ratio during the three years preceding the bust.
Figure 3.5. Household Debt during Housing Busts(Percentage points)
WEO_Ch 03.indd 96 4/11/12 2:03 PM

c h a p t e r 3 D e A l i n g w i t h h o u s e h o l D D e bt
International Monetary Fund | April 2012 97
represent “money we owe to ourselves” (Krugman, 2011) with no obvious macroeconomic implications. Nevertheless, even when changes in gross household debt imply little change in economy-wide net debt, they can influence macroeconomic performance by amplifying the effects of shocks. In particular, a number of theoretical models predict that build-ups in household debt drive deep and prolonged downturns.14
We now discuss the main channels through which household debt can amplify downturns and weaken recoveries. We also highlight the policy implications. In particular, we explain the circumstances under which government intervention can improve on a purely market-driven outcome.
Differences between borrowers and lenders
The accumulation of household debt amplifies slumps in a number of recent models that differ-entiate between borrowers and lenders and feature liquidity constraints. A key feature of these models is the idea that the distribution of debt within an economy matters (Eggertsson and Krugman, 2010; Guerrieri and Lorenzoni, 2011; Hall, 2011).15 As Tobin (1980) argues, “the population is not dis-tributed between debtors and creditors randomly. Debtors have borrowed for good reasons, most of which indicate a high marginal propensity to spend from wealth or from current income or from any other liquid resources they can command.”16 Indeed, household debt increased more at the lower ends
14In an open economy, gross household debt can have addi-tional effects. In particular, a reduction in household debt could signal a transfer of resources from domestic to foreign households, implying even larger macroeconomic effects than in a closed economy.
15In an earlier theoretical sketch, King (1994) discusses how differences in the marginal propensity to consume between borrowing and lending households can generate an aggregate downturn when household leverage is high.
16Differences in the propensity to consume can arise for a number of reasons. Life-cycle motives have been emphasized as a source of differences in saving behavior across cohorts (see Modigliani, 1986, among others). Others have focused on the role of time preferences, introducing a class of relatively impatient agents (see Iacoviello, 2005; and Eggertsson and Krugman, 2010). Dynan, Skinner, and Zeldes (2004) find a strong positive relationship between personal saving rates and lifetime income, suggesting that the rich consume a smaller proportion of their income than the poor.
1. Household Consumption during Housing Busts Not Associated with a Banking Crisis
2. Household Consumption during Recessions
–3.0
–2.0
–1.0
0.0
1.0
2.0
0 1 2 3 4 5
High-debt busts
Low-debt busts
–9–8
–7–6–5
–4–3–2
–101
0 1 2 3 4 5
High-debt recessions
Low-debt recessions
Source: IMF staff calculations.Note: In panel 1, x-axis units are years, where t = 0 denotes the year of the housing
bust. Housing busts associated with a systemic banking crisis within two years of the bust are not considered in the analysis. Systemic banking crisis indicators are from the updated Laeven and Valencia (2010) database. Dashed lines indicate 1 standard error bands. High- and low-debt busts are defined, respectively, as above and below the median increase in the household debt-to-income ratio during the three years preceding the housing bust. In panel 2, x-axis units are years, where t = 0 denotes the year of the recession. Dashed lines indicate 1 standard error bands. High- and low-debt recessions are defined, respectively, as above and below the median increase in the household debt-to-income ratio during the three years preceding the recession.
The finding that consumption falls more during housing busts preceded by a larger run-up in household debt is not driven by banking crises. It holds for a subset of housing busts not associated with a systemic banking crisis within a two-year window. In addition, recessions are generally deeper if they are preceded by a larger run-up in household debt.
Figure 3.6. Household Consumption(Percent)
WEO_Ch 03.indd 97 4/11/12 2:03 PM

wo r l d e co n o m i c o u t lo o k : G r ow t h r e s um i n G, da n G e r s r e ma i n
98 International Monetary Fund | April 2012
of the income and wealth distribution during the 2000s in the United States (Kumhof and Rancière, 2010).
A shock to the borrowing capacity of debtors with a high marginal propensity to consume that forces them to reduce their debt could then lead to a decline in aggregate activity. Deleveraging could stem from a realization that house prices were overvalued (as in Buiter, 2010; and Eggertsson and Krugman, 2010), a tightening in credit standards (Guerrieri and Lorenzoni, 2011), a sharp revision in income expectations, or an increase in economic uncertainty (Fisher, 1933; Minsky, 1986). Here, a sufficiently large fall in the interest rate could induce creditor households to spend more, thus offsetting the decline in spending by the debtors. But, as these models show, the presence of the zero lower bound on nominal interest rates or other price rigidities can prevent these creditor households from picking up the slack. This feature is particularly relevant today because policy rates are near zero in many advanced economies.
Consumption may be further depressed following shocks in the presence of uncertainty, given the need for precautionary saving (Guerrieri and Lorenzoni, 2011; Carroll, Slacalek, and Sommer, 2011). The cut in household consumption would then be particu-larly abrupt, “undershooting” its long-term level (as it appears to have done in the United States today; see Glick and Lansing, 2009). Such a sharp con-traction in aggregate consumption would provide a rationale for temporarily pursuing expansionary macroeconomic policies, including fiscal stimulus targeted at financially constrained households (Egg-ertsson and Krugman, 2010; Carroll, Slacalek, and Sommer, 2011), and household debt restructuring (Rogoff, 2011).
Negative price effects from fire sales
A further negative effect on economic activity of high household debt in the presence of a shock, pos-tulated by numerous models, comes from the forced sale of durable goods (Shleifer and Vishny, 1992; Mayer, 1995; Krishnamurthy, 2010; Lorenzoni, 2008). For example, a rise in unemployment reduces households’ ability to service their debt, implying a rise in household defaults, foreclosures, and creditors
1. Auto Sales
2. Residential Investment
3. Employment
0
20
40
60
80
100
120
140
160
2004 05 06 07 08 09 10:Q3
0
20
40
60
80
100
120
140
2004 05 06 07 08 09 10:Q2
90
95
100
105
110
2004 05 06 07 08 09 10:Q3
U.S. counties with low household debt
U.S. counties with high household debt
Mian and Sufi (2011) find that in U.S. counties where households accumulated more debt before the Great Recession there was deeper and more prolonged contraction in household consumption, investment, and employment.
Source: Mian and Sufi (2011).Note: Shaded area indicates U.S. recession based on National Bureau of Economic
Research dates.
Figure 3.7. Economic Activity during the Great Recession in the United States(Index; 2005:Q4 = 100)
WEO_Ch 03.indd 98 4/11/12 2:03 PM

c h a p t e r 3 D e A l i n g w i t h h o u s e h o l D D e bt
International Monetary Fund | April 2012 99
selling foreclosed properties at distressed, or fire-sale, prices. Estimates suggest that a single foreclosure lowers the price of a neighboring property by about 1 percent, but that the effects can be much larger when there is a wave of foreclosures, with estimates of price declines reaching almost 30 percent (Camp-bell, Giglio, and Pathak, 2011). The associated nega-tive price effects in turn reduce economic activity through a number of self-reinforcing contraction-ary spirals. These include negative wealth effects, a reduction in collateral value, a negative impact on bank balance sheets, and a credit crunch. As Shleifer and Vishny (2010) explain, fire sales undermine the ability of financial institutions and firms to lend and borrow by reducing their net worth, and this reduction in credit supply can reduce productivity-enhancing investment. Such externalities—banks and households ignoring the social cost of defaults and fire sales—may justify policy intervention aimed at stopping household defaults, foreclosures, and fire sales.
The case of the United States today illustrates the risk of house prices “undershooting” their equilib-rium values during a housing bust on the back of fire sales. The IMF staff notes that “distress sales are the main driving force behind the recent declines in house prices—in fact, excluding distress sales, house prices had stopped falling” and that “there is a risk of house price undershooting” (IMF, 2011b, p. 20). And Figure 3.8 suggests that U.S. house prices may have fallen below the levels consistent with some fundamentals.17
Inefficiencies and deadweight losses from debt overhang and foreclosures
A further problem is that household debt over-hang can give rise to various inefficiencies. In the case of firms, debt overhang is a situation in which existing debt is so great that it constrains the abil-ity to raise funds to finance profitable investment projects (Myers, 1977). Similarly, homeowners with debt overhang may invest little in their property. They may, for example, forgo investments that improve the net present value of their homes, such
17Slok (2012) and The Economist (2011) report that U.S. house prices are undervalued.
U.S. house prices are now at or below the levels implied by regression-based estimates and some historical valuation ratios.
Figure 3.8. Estimated House Price Misalignment in the United States(Percent)
Sources: Federal Housing Administration; Organization for Economic Cooperation and Development; IMF, International Financial Statistics; and IMF staff calculations. Note: The regression model measure indicates the implied house price misalignment when house price changes are modeled as a function of changes in personal disposable income, working-age population, credit and equity prices, interest rate levels, and construction costs. See Chapter 1 of the October 2009 World Economic Outlook, Box 1.4, and Igan and Loungani (forthcoming) for further details. The price-to-rent ratio and price-to-income ratio depict the percent deviation of these ratios from their historical averages, calculated over 1970–2000.
–5
0
5
10
15
20
25
2007 08 09 10 11
Regression model
Deviation from historical price-to-rent ratio
Deviation from historical price-to-income ratio
WEO_Ch 03.indd 99 4/11/12 2:03 PM
wo r l d e co n o m i c o u t lo o k : G r ow t h r e s um i n G, da n G e r s r e ma i n
100 International Monetary Fund | April 2012
as home improvements and maintenance expendi-tures. This effect could be large. Based on detailed household-level U.S. data, Melzer (2010) finds that homeowners with debt overhang (negative equity) spend 30 percent less on home improvements and maintenance than homeowners without debt overhang, other things equal. While privately rene-gotiating the debt contract between the borrower and the lender could alleviate such debt overhang problems, renegotiation is often costly and difficult to achieve outside bankruptcy because of free-rider problems or contract complications (Foote and others, 2010).
Foreclosures and bankruptcy can be an inefficient way of resolving households’ inability to service their mortgage debt, giving rise to significant “deadweight losses” (BGFRS, 2012). These deadweight losses stem from the neglect and deterioration of proper-ties that sit vacant for months and their negative effect on neighborhoods’ social cohesion and crime (Immergluck and Smith, 2005, 2006). Deadweight losses are also due to the delays associated with the resolution of a large number of bankruptcies through the court system.
Overall, debt overhang and the deadweight losses of foreclosures can further depress the recovery of housing prices and economic activity. These prob-lems make a case for government involvement to lower the cost of restructuring debt, facilitate the writing down of household debt, and help prevent foreclosures (Philippon, 2009).
Dealing with household Debt: case studiesHaving established that household debt can
amplify slumps and weaken recoveries, we now investigate how governments have responded dur-ing episodes of household deleveraging. We start by reviewing four broad policy approaches that can, in principle, allow government intervention to improve on a purely market-driven outcome. These approaches are not mutually exclusive and can be complementary. Each has benefits and limitations. The approach a government decides to use is likely to reflect institutional and political features of the economy, the available policy room, and the size of the household debt problem.
• Temporary macroeconomic policy stimulus: As dis-cussed above, household deleveraging following a balance sheet shock can imply an abrupt contrac-tion in household consumption to well below the long-term level (overshooting). The costs of the associated contraction in economic activ-ity can be mitigated by an offsetting temporary macroeconomic policy stimulus. In an economy with credit-constrained households, this provides a rationale for temporarily pursuing an expan-sionary fiscal policy, including through govern-ment spending targeted at financially constrained households (Eggertsson and Krugman, 2010; Carroll, Slacalek, and Sommer, 2011).18 For example, simulations of policy models developed at six policy institutions suggest that, in the cur-rent environment, a temporary (two-year) transfer of 1 percent of GDP to financially constrained households would raise GDP by 1.3 percent and 1.1 percent in the United States and the European Union, respectively (Coenen and others, 2012).19 Financing the temporary transfer by a lump-sum tax on all households rather than by issuing gov-ernment debt would imply a “balanced-budget” boost to GDP of 0.8 and 0.9 percent, respec-tively. Monetary stimulus can also provide relief to indebted households by easing the debt service burden, especially in countries where mortgages have variable rates, such as Spain and the United Kingdom. In the United States, the macroeco-nomic policy response since the start of the Great Recession has been forceful, going much beyond that of several other countries. It included efforts by the Federal Reserve to lower long-term interest rates, particularly in the key mortgage-backed-
18The presence of financially constrained households with a high marginal propensity to consume out of disposable income increases the effectiveness of fiscal policy changes—it renders the economy non-Ricardian—in a wide range of models (see Coenen and others, 2012, for a discussion). The presence of the zero lower bound on interest rates further amplifies the multipliers associated with temporary fiscal policy changes (Woodford, 2010).
19The six policy institutions are the U.S. Federal Reserve Board, the European Central Bank, the European Commission, the OECD, the Bank of Canada, and the IMF. The simulations assume that policy interest rates are constrained by the zero lower bound—a key feature of major advanced economies today—and that the central bank does not tighten monetary policy in response to the fiscal expansion. See Coenen and others (2012) for further details.
WEO_Ch 03.indd 100 4/11/12 2:03 PM

c h a p t e r 3 D e A l i n g w i t h h o u s e h o l D D e bt
International Monetary Fund | April 2012 101
security segment relevant for the housing market. Macroeconomic stimulus, however, has its limits. High government debt may constrain the avail-able fiscal room for a deficit-financed transfer, and the zero lower bound on nominal interest rates can prevent real interest rates from adjusting enough to allow creditor households to pick up the economic slack caused by lower consumption by borrowers.
• Automatic support to households through the social safety net: A social safety net can automatically provide targeted transfers to households with distressed balance sheets and a high marginal propensity to consume, without the need for additional policy deliberation. For example, unemployment insurance can support people’s ability to service their debt after becoming unemployed, thus reducing the risk of household deleveraging through default and the associated negative externalities.20 However, as in the case of discretionary fiscal stimulus, allowing auto-matic stabilizers to operate fully requires fiscal room.21
• Assistance to the financial sector: When the problem of household sector debt is so severe that arrears and defaults threaten to disrupt the operation of the banking sector, government intervention may be warranted. Household defaults can undermine the ability of financial institutions and firms to lend and borrow by reducing their net worth, and this reduction in credit supply can reduce produc-tive investment (Shleifer and Vishny, 2010). A number of policies can prevent such a tightening in credit availability, including recapitalizations and government purchases of distressed assets.22
20The generosity and duration of the associated welfare pay-ments differ by country. In Sweden, for example, workers are eligible for unemployment insurance for up to 450 days, although at declining replacement rates after 200 days. By contrast, in the United States, unemployment insurance is normally limited to 26 weeks, and extended benefits are provided during periods of high unemployment. The maximum duration of unemployment insur-ance was extended to 99 weeks (693 days) in February 2009, and this extension was renewed in February 2012.
21Furthermore, to provide targeted support in a timely manner, the safety net needs to be in place before household debt becomes problematic.
22See Honohan and Laeven (2005) for a discussion of the vari-ous policies used for the resolution of financial crises.
Such support mitigates the effects of household balance sheet distress on the financial sector. The U.S. Troubled Asset Relief Program established in 2008 was based, in part, on such considerations. Similarly, in Ireland, the National Asset Manage-ment Agency was created in 2009 to take over distressed loans from the banking sector. More-over, assistance to the financial sector can enable banks to engage in voluntary debt restructuring with households. However, strong capital buffers may be insufficient to encourage banks to restruc-ture household debt on a large scale, as is evident in the United States today. In addition, this approach does not prevent unnecessary household defaults, defined as those that occur as a result of temporary liquidity problems. Moreover, financial support to lenders facing widespread defaults by their debtors must be designed carefully to avoid moral hazard––indirectly encouraging risky lend-ing practices in the future.
• Support for household debt restructuring: Finally, the government may choose to tackle the prob-lem of household debt directly by setting up frameworks for voluntary out-of-court household debt restructuring—including write-downs—or by initiating government-sponsored debt restruc-turing programs. Such programs can help restore the ability of borrowers to service their debt, thus preventing the contractionary effects of unnecessary foreclosures and excessive asset price declines. To the extent that the programs involve a transfer to financially constrained households from less financially constrained agents, they can also boost GDP in a way comparable to the balanced-budget fiscal transfer discussed above. Such programs can also have a limited fiscal cost. For example, as we see later on, they may involve the government buying distressed mortgages from banks, restructuring them to make them more affordable, and later reselling them, with the revenue offsetting the initial cost. They also sometimes focus on facilitating case-by-case restructuring by improving the institutional and legal framework for debt renegotiation between the lender and the borrower, which implies no fiscal cost. However, the success of these programs depends on a combination of careful
WEO_Ch 03.indd 101 4/11/12 2:03 PM

wo r l d e co n o m i c o u t lo o k : G r ow t h r e s um i n G, da n G e r s r e ma i n
102 International Monetary Fund | April 2012
design and implementation.23 In particular, such programs must address the risk of moral hazard when debtors are offered the opportunity to avoid complying with their loan’s original terms.It is worth recognizing that any government
intervention will introduce distortions and lead to some redistribution of resources within the economy and over time. The question is whether the benefits of intervention exceed the costs. Moreover, if interven-tion has a budgetary impact, the extent of interven-tion should be constrained by the degree of available fiscal room. The various approaches discussed above differ in the extent of redistribution involved and the associated winners and losers. For example, the presence and generosity of a social safety net reflect a society’s preferences regarding redistribution and inequality. Government support for the banking sec-tor and household debt restructuring programs may involve clearer winners than, say, monetary policy stimulus or an income tax cut. The social friction that such redistribution may cause could limit its political feasibility. Mian, Sufi, and Trebbi (2012) discuss the political tug-of-war between creditors and debtors and find that political systems tend to become more polar-ized in the wake of financial crises. They also argue that collective action problems—struggling mortgage holders may be less well politically organized than banks—can hamper efforts to implement household debt restructuring. Moreover, all policies that respond to the consequences of excessive household debt need to be carefully designed to minimize the potential for moral hazard and excessive risk taking by both bor-rowers and lenders in the future.
To examine in practice how such policies can mit-igate the problems associated with household debt, we investigate the effectiveness of government action during several episodes of household deleveraging. We focus on policies that support household debt restructuring directly because of the large amount of existing literature on the other policy approaches. For example, there is a large literature on the deter-minants and effects of fiscal and monetary policy. There are also a number of studies on the interna-tional experience with financial sector policies.
23Laeven and Laryea (2009) discuss in detail the principles that should guide government-sponsored household debt restructuring programs.
The episodes we consider are the United States in the 1930s and today, Hungary and Iceland today, Colombia in 1999, and three Scandinavian countries (Finland, Norway, Sweden) in the 1990s. In each of these cases, there was a housing bust preceded by or coinciding with a substantial increase in household debt, but the policy response was different.24 We start by summarizing the factors that led to the buildup in household debt and what triggered household deleveraging. We then discuss the government response, focusing on policies that directly address the negative effect of household debt on economic activity. Finally, we summarize the lessons to be learned from the case studies.25
Factors underlying the buildup in household Debt
In each of these episodes, a loosening of credit constraints allowed households to increase their debt. This increase in credit availability was associated with financial innovation and liberalization and declining lending standards. A wave of household optimism about future income and wealth prospects also played a role and, together with the greater credit availability, helped stoke the housing and stock market booms.
The United States in the 1920s—the “roaring twenties”—illustrates the role of rising credit avail-
24We do not discuss the real estate bust in Japan in the 1990s because household leverage relative to both safe and liquid assets was low at the time and household deleveraging was not a key feature of the episode. As Nakagawa and Yasui (2009) explain: “The finances of Japanese households were not severely damaged by the mid-1990s bursting of the bubble. Banks, however, with their large accumulation of household deposits on the liability side of their balance sheets, were victims of their large holdings of defaulted corporate loans and the resulting capital deterioration during the bust; in response, banks tightened credit significantly during this period” (p. 82).
25Other economies today have also implemented measures to address household indebtedness directly. For example, in the United Kingdom, the Homeowners Mortgage Support Scheme aimed to ease homeowners’ debt service temporarily with a gov-ernment guarantee of deferred interest payments, the Mortgage Rescue Scheme attempted to protect the most vulnerable from foreclosure, while the expansion of the Support for Mortgage Interest provided more households with help in meeting their interest payments. Reforms currently being implemented in Ireland include modernizing the bankruptcy regime by making it less onerous and facilitating voluntary out-of-court arrangements between borrowers and lenders of both secured and unsecured debt. In Latvia, the authorities’ efforts have focused on strength-ening the framework for market-based debt resolution (see Erbenova, Liu, and Saxegaard, 2011).
WEO_Ch 03.indd 102 4/11/12 2:03 PM

c h a p t e r 3 D e A l i n g w i t h h o u s e h o l D D e bt
International Monetary Fund | April 2012 103
ability and consumer optimism in driving household debt. Technological innovation brought new con-sumer products such as automobiles and radios into widespread use. Financial innovation made it easier for households to obtain credit to buy such consumer durables and to obtain mortgage loans. Installment plans for the purchase of major consumer durables became particularly widespread (Olney, 1999). Gen-eral Motors led the way with the establishment of the General Motors Acceptance Corporation in 1919 to make loans for the purchase of its automobiles. By 1927, two-thirds of new cars and household appli-ances were purchased on installment. Consumer debt doubled from 4.5 percent of personal income in 1920 to 9 percent of personal income in 1929. Over the same period, mortgage debt rose from 11 percent of gross national product to 28 percent, partly on the back of new forms of lending such as high-leverage home mortgage loans and early forms of securitization (Snowden, 2010). Reflecting the economic expan-sion and optimism that house values would continue rising, asset prices boomed.26 Real house prices rose by 19 percent from 1921 to 1925,27 while the stock market rose by 265 percent from 1921 to 1929.
Rising credit availability due to financial liberal-ization and declining lending standards also helped drive up household debt in the more recent cases we consider. In the Scandinavian countries, extensive price and quantity restrictions on financial products ended during the 1980s. Colombia implemented a wave of capital account and financial liberalization in the early 1990s. This rapid deregulation substantially encouraged competition for customers, which, in combination with strong tax incentives to invest in housing and optimism regarding asset values, led to a household debt boom in these economies.28 Similarly, following Iceland’s
26Regarding the reasons for this optimism, Harriss (1951) explains that “In the twenties, as in every period of favorable eco-nomic conditions, mortgage debt was entered into by individuals with confidence that the burden could be supported without undue difficulty … over long periods the value of land and improvements had often risen enough to support the widely held belief that the borrower’s equity would grow through the years, even though it was small to begin with” (p. 7).
27In certain areas, such as Manhattan and Florida, the increase was much higher (30 to 40 percent).
28In Finland the ratio of household debt to disposable income rose from 50 percent in 1980 to 90 percent in 1989; in Sweden it rose from 95 percent to 130 percent. In Colombia bank credit
privatization and liberalization of the banking system in 2003, household borrowing constraints were eased substantially.29 It became possible, for the first time, to refinance mortgages and withdraw equity. Loan-to-value (LTV) ratios were raised as high as 90 percent by the state-owned Housing Financing Fund, and even further by the newly private banks as they competed for market share. In Hungary, pent-up demand com-bined with EU membership prospects triggered a credit boom as outstanding household debt grew from a mere 7 percent of GDP in 1999 to 33 percent in 2007. The first part of this credit boom episode was also character-ized by a house price rally, driven by generous housing subsidies. In the United States in the 2000s, an expan-sion of credit supply to households that had previously been unable to obtain loans included increased recourse to private-label securitization and the emergence of so-called exotic mortgages, such as interest-only loans, negative amortization loans, and “NINJA” (no income, no job, no assets) loans.
Factors that triggered household Deleveraging
The collapse of the asset price boom, and the asso-ciated collapse in household wealth, triggered house-hold deleveraging in all of the historical episodes we consider. The U.S. housing price boom of the 1920s ended in 1925, when house prices peaked. Foreclo-sure rates rose steadily thereafter (Figure 3.9), from 3 foreclosures per 1,000 mortgaged properties in 1926 to 13 per 1,000 by 1933. Another shock to household wealth came with the stock market crash of October 1929, which ushered in the Great Depression. A housing bust also occurred in the Scandinavian coun-tries in the late 1980s and in Colombia in the mid-1990s. Similarly, the end of a house price boom and a collapse in stock prices severely dented household wealth in Iceland and the United States at the start of the Great Recession. In all these cases, household
to the private sector rose from 32 percent of GDP in 1991 to 40 percent in 1997.
29Financial markets in Iceland were highly regulated until the 1980s. Liberalization began in the 1980s and accelerated during the 1990s, not least because of obligations and opportunities created by the decision to join the European Economic Area in 1994. Iceland’s three new large banks were progressively privatized between the late 1990s and 2003, amid widespread accusations of political favoritism (see OECD, 2009).
WEO_Ch 03.indd 103 4/11/12 2:03 PM

wo r l d e co n o m i c o u t lo o k : G r ow t h r e s um i n G, da n G e r s r e ma i n
104 International Monetary Fund | April 2012
deleveraging started soon after the collapse in asset prices. In addition, a tightening of available credit associated with banking crises triggered household deleveraging during all these episodes. The distress in household balance sheets due to the collapse of their wealth spread quickly to financial intermediaries’ bal-ance sheets, resulting in tighter lending standards and forcing further household deleveraging.
The experience of Iceland in 2008 provides a particularly grim illustration of how a collapse in asset prices and economic prospects, combined with a massive banking crisis, leads to household overin-debtedness and a need for deleveraging. Iceland’s three largest banks fell within one week in October 2008. Household balance sheets then came under severe stress from a number of factors (Figure 3.10). First, the col-lapse in confidence triggered sharp asset price declines, which unwound previous net wealth gains. At the same time, the massive inflation and large depreciation of the krona during 2008–09 triggered a sharp rise in household debt since practically all loans were indexed to the consumer price index (CPI) or the exchange rate. CPI-indexed mortgages with LTV ratios above 70 percent were driven underwater by a combination of 26 percent inflation and an 11 percent drop in house prices. Likewise, with the krona depreciating by 77 percent, exchange-rate-indexed mortgages with LTV ratios above 40 percent went underwater. Inflation and depreciation also swelled debt service payments, just as disposable income stagnated. The combination of debt overhang and debt servicing problems was devastating. By the end of 2008, 20 percent of homeowners with mortgages had negative equity in their homes (this peaked at 38 percent in 2010), while nearly a quarter had debt service payments above 40 percent of their disposable income.
the policy response
Having summarized the factors that drove up household debt and triggered household delever-aging, we turn to the policies that governments pursued to mitigate the negative effects on economic activity. For each episode, we start with an overview of the policies implemented and of the political context in which they were introduced. We then consider how effective the policies were in addressing
After the peak in house prices in 1925, foreclosure rates rose steadily for the following eight years. While widespread defaults lowered the stock of outstanding nominal debt starting in 1930, the collapse in household income meant that the debt-to-income ratio continued to rise until 1933.
Source: IMF staff calculations.Note: The debt-to-income ratio is in percentage points; nominal household debt is in
billions of dollars.
Figure 3.9. Foreclosures and Household Debt during the Great Depression in the United States
20
25
30
35
40
45
50
55
60
40
50
60
70
80
90
1920 25 30 35 40
0
50
100
150
200
250
300
0
2
4
6
8
10
12
14
1926 30 35 40 45
2. Household Debt
1. Foreclosures
Nominal debt (left scale)
Debt-to-income ratio (right scale)
Per 1,000 mortgaged structures (right scale)
Total (thousands; left scale)
WEO_Ch 03.indd 104 4/11/12 2:03 PM

c h a p t e r 3 D e A l i n g w i t h h o u s e h o l D D e bt
International Monetary Fund | April 2012 105
the negative effects of household debt on economic activity. In particular, we investigate whether the policies helped prevent foreclosures (by restructur-ing a large share of mortgages), provide transfers to credit-constrained households with a high marginal propensity to consume, and reduce debt overhang. At the same time, the small number of episodes considered and the lack of counterfactual experiences complicate quantifying the effect of these policies on macroeconomic aggregates, such as real GDP.
The discussion starts with two cases that illus-trate broadly successful approaches to dealing with household debt––the United States during the Great Depression and Iceland since the Great Recession. We then contrast these cases with less successful episodes––Colombia in the 1990s and Hungary and the United States since the Great Recession. Finally, we consider the case of the Scandinavian countries during the 1990s, when, despite a large increase in household debt, the authorities did not adopt discre-tionary household debt restructuring policies.
The United States during the Great Depression
This episode exemplifies a bold and broadly successful government-supported household debt restructuring program designed to prevent foreclo-sures, the U.S. Home Owners’ Loan Corporation (HOLC). HOLC was established in 1933 because a series of earlier initiatives designed to stop the rising number of foreclosures had achieved little (see Figure 3.9), and social pressure for large-scale interven-tion was high.30 As Harriss (1951) explains, “The tremendous social costs imposed by these conditions of deep depression are vividly and movingly revealed in the files of the Home Owners’ Loan Corporation. Demands for direct action by the government were insistent and nearly unanimous” (p. 9). In April 1933, a newly elected President Franklin Roosevelt urged Congress to pass legislation that would
30The earlier policies included a number of state initiatives to impose moratoriums on foreclosures and the Federal Home Loan Bank (FHLB) Act of 1932, designed to increase bank lending by providing funding for liquidity-constrained banks. The FHLB Act accepted only 3 out of 41,000 applications within its first two years.
The financial position of Iceland's households came under severe stress in 2008. The collapse in asset prices unwound previous net wealth gains, while widespread indexation coupled with higher inflation and exchange rate depreciation led to a rise in nominal household debt. The share of mortgage holders with negative equity in their homes rose steadily, reaching close to 40 percent by 2010.
Figure 3.10. Household Balance Sheets during the Great Recession in Iceland
Sources: Central Bank of Iceland; Statistics Iceland; and IMF staff estimates.Note: In panel 1, pension assets are corrected for an estimated tax of 25 percent. CPI =
consumer price index; Forex = foreign exchange.
1. Household Financial Position(percent of disposable income)
2. Price and Currency Developments(indices; 2005–07 = 100)
Assets excluding pensions
Assets
Debt-weighted Forex index
CPI for indexation
Wage index
House prices
3. Households with Negative Housing Equity(percent of households with mortgages)
All mortgages
Forex-linked
CPI-indexed
Debt
Dec.11
150
200
250
300
350
400
450
2000 02 04 06 08 11
406080100120140160180200220240260
2000 02 04 06 08 10
0
10
20
30
40
50
60
2007 08 09 Dec.10
WEO_Ch 03.indd 105 4/11/12 2:03 PM

wo r l d e co n o m i c o u t lo o k : G r ow t h r e s um i n G, da n G e r s r e ma i n
106 International Monetary Fund | April 2012
prevent foreclosures, and HOLC was established that summer.31
To prevent mortgage foreclosures, HOLC bought distressed mortgages from banks in exchange for bonds with federal guarantees on interest and prin-cipal. It then restructured these mortgages to make them more affordable to borrowers and developed methods of working with borrowers who became delinquent or unemployed, including job searches (Box 3.1 provides further details on the program). HOLC bought about 1 million distressed mortgages that were at risk of foreclosure, or about one in five of all mortgages. Of these million mortgages, about 200,000 ended up foreclosing when the bor-rowers defaulted on their renegotiated mortgages. The HOLC program helped protect the remaining 800,000 mortgages from foreclosure, corresponding to 16 percent of all mortgages (Table 3.1).32 HOLC mortgage purchases amounted to $4.75 billion (8.4 percent of 1933 GDP), and the mortgages were sold over time, yielding a nominal profit by the time of the HOLC program’s liquidation in 1951. The HOLC program’s success in preventing foreclosures at a limited fiscal cost may explain why academics and public figures called for a HOLC-style approach during the recent recession.
A key feature of HOLC was the effective transfer of funds to credit-constrained households with dis-tressed balance sheets and a high marginal propen-sity to consume, which mitigated the negative effects on aggregate demand discussed above. The objective, emphasized by President Roosevelt in a message to Congress, was to relieve “the small home owner … of the burden of excessive interest and principal pay-ments incurred during the period of higher values and higher earning power” (Harriss, 1951, p. 9). Accordingly, HOLC extended mortgage terms from a typical length of 5 to 10 years, often at variable rates, to fixed-rate 15-year terms, which were some-times extended to 20 years (Green and Wachter, 2005). By making mortgage payments more afford-
31Household debt had been falling in nominal terms since 1929 on the back of defaults but continued to rise as a share of households’ shrinking incomes until 1933 (see Figure 3.9).
32Fishback and others (2010) and Courtemanche and Snowden (2011) offer evidence that this action provided relief to the hous-ing market by supporting home values and home ownership.
able, it effectively transferred funds to households with distressed mortgages that had a higher mar-ginal propensity to consume and away from lenders with (presumably) a lower marginal propensity to consume.33 In a number of cases, HOLC also wrote off part of the principal to ensure that no loans exceeded 80 percent of the appraised value of the house, thus mitigating the negative effects of debt overhang discussed above.
Iceland during the Great Recession
The case of Iceland illustrates how a multipronged approach can provide debt relief to a large share of households and stem the rise in defaults. Iceland’s bold policy response was motivated by the sheer scale of its household debt problem (see Figure 3.10) and intense social pressure for government inter-vention. In some of the largest protests ever seen in Iceland, thousands of people took to the streets demanding debt write-downs. Over a two-year period, the government provided a framework for dealing with household debt in the context of an IMF-supported program.
The approach to resolving the household debt problem had several elements. At the outset, stopgap measures offered near-term relief in order to ensure that families did not lose their homes owing to temporary problems and to prevent a spike in fore-closures leading to a housing market meltdown. The measures included a moratorium on foreclosures, a temporary suspension of debt service for exchange-rate- and CPI-indexed loans, and rescheduling (payment smoothing) of these loans. About half the households with eligible loans took advantage of payment smoothing, which reduced current debt service payments by 15 to 20 percent and 30 to 40 percent for CPI-indexed and foreign-exchange-indexed loans, respectively.
At a later stage, households were given the option of restructuring their loans out of court by negotiat-ing with their lenders directly or with the help of a (newly created) Office of the Debtor’s Ombudsman
33HOLC also changed adjustable-rate, interest-only mortgages to fixed-rate, fully amortizing mortgages. This reduced uncertainty about future debt service obligations and implied less need for precautionary saving and helped homeowners avoid a large lump-sum payment at the loan’s maturity.
WEO_Ch 03.indd 106 4/11/12 2:03 PM
c h a p t e r 3 D e A l i n g w i t h h o u s e h o l D D e bt
International Monetary Fund | April 2012 107
acting on their behalf. The negotiations are on a case-by-case basis but use templates developed through dialogue between the government and the financial institutions. The templates provide for substantial write-downs designed to align secured debt with the supporting collateral, and debt service with the abil-ity to repay. The case-by-case negotiations safeguard property rights and reduce moral hazard, but they take time. As of January 2012, only 35 percent of the case-by-case applications for debt restructur-ing had been processed. To speed things up, a debt forgiveness plan was introduced, which writes down deeply underwater mortgages to 110 percent of the household’s pledgeable assets. In addition, a large share of mortgage holders receives a sizable interest rate subsidy over a two-year period, financed through temporary levies on the financial sector. Box 3.2 provides a detailed description of the household debt restructuring framework.34
Iceland’s financial institutions had both the incen-tive and the financial capacity to participate. After the spectacular collapse of the country’s banking sys-tem, the three large new banks that were assembled from the wreckage acquired their loan portfolios at fair value that took into account the need for write-downs. This gave them the financial room to bear the costs of write-downs, and they frequently took the initiative. Much of the cost of debt restructuring was borne indirectly by foreign creditors, who took significant losses when the banks collapsed. Aligning households’ incentives to participate was more com-plicated. The combination of indexation, inflation, and falling housing prices meant that the longer households waited, the larger the write-down. The unconditional moratorium on foreclosures and the suspension of debt service also reduced the incentive to resolve debt problems, and frequent revisions of the debt restructuring framework created an expecta-tion of ever more generous offers. It was only when a comprehensive framework was put in place with a clear expiration date that debt write-downs finally took off. As of January 2012, 15 to 20 percent of all mortgages have either been––or are in the process of being––written down (see Table 3.1).
34For a full discussion of household debt restructuring in Iceland, see Karlsdóttir, Kristinsson, and Rozwadowski (forthcoming).
Overall, while the jury is still out on Iceland’s approach to household debt, the policy response seems to address the main channels through which household debt can exert a drag on the economy. A spike in foreclosures was averted by the tempo-rary moratorium and the concerted effort to find durable solutions to the household debt problem. By enabling households to reduce their debt and debt service, the debt restructuring framework transfers resources to agents with a relatively high marginal propensity to consume. The financial-sector-financed interest subsidy is playing a similar role. Finally, the write-down of a substantial portion of excess house-hold debt (that is, in excess of household assets) mitigates the problems associated with debt over-hang. The extent to which the Icelandic approach is able to achieve the ultimate goal of putting house-holds back on their feet, while minimizing moral hazard, remains to be seen.
Colombia during the 1990s
This episode illustrates how household debt resolution measures that put the burden on a fragile banking sector can lead to a credit crunch. Fol-lowing the sudden stop in capital inflows in 1997 triggered by the Asian and Russian crises, and the associated rise in interest rates, household defaults increased sharply and mortgage lenders suffered substantial losses (Fogafin, 2009).With their mort-gage obligations increasing significantly while house prices collapsed and unemployment rose, many borrowers took their case to the courts (Forero, 2004). In response, the authorities conducted a bank restructuring program in 1999, and the constitu-tional court passed a series of rulings that aimed to lower households’ mortgage debt burden and prevent foreclosures. In particular, the court ruled that mortgages were no longer full-recourse loans—households now had the option of walking away from their mortgage debt. The court also declared the capitalization of interest on delinquent loans unconstitutional.
These reforms represented a substantial transfer of funds to households with distressed balance sheets—those likely to have a high marginal propensity to consume—but imposed heavy losses on the fragile financial sector. The reforms also encouraged strategic
WEO_Ch 03.indd 107 4/11/12 2:03 PM

wo r l d e co n o m i c o u t lo o k : G r ow t h r e s um i n G, da n G e r s r e ma i n
108 International Monetary Fund | April 2012
Table 3.1. Government-Supported Out-of-Court Debt Restructuring Programs in Selected Case-Study Countries
Program Beneficiaries Debt ModificationsIncentives and Burden
Sharing
Take-up (in percent of mortgages, unless specified otherwise)
United States 1929
Home Owners’ Loan Corporation
Households already in default (or at-risk mortgages held by financial institutions in distress)
Repayment burdens further reduced by extending loan terms and lowering interest rates.
Principal reductions to a maximum loan-to-value (LTV) ratio of 80 percent
Moral hazard avoided because program was limited to those already in default.
Participation was voluntary, but lenders were offered payouts above the amount they could recover in foreclosure.
Eligibility criteria ensured that the borrower could service the new loan and limited the potential losses to be borne by taxpayers.
Burden of principal reductions was shared between lenders and the government.
Government bore risk on restructured mortgages.
Total households: 25 million
Households with a mortgage: 5 million
Eligible mortgages: 50 percent
Applications: 38 percentApproved applications:
20 percentForeclosures avoided:
800,000Total authorization: $4.8
billion (8.5 percent of gross national product—GNP)
Total restructurings: $3.1 billion (5.5 percent of GNP)
Iceland 2008
Payment Smoothing Households with consumer price index (CPI)-linked and foreign exchange (FX)-linked mortgages and car loans
Debt service is reduced through rescheduling and maturity extension.
CPI-linked mortgages: Statutory requirement
FX-linked loans: Agreement between government and lenders
Total households: 130,000Households with a
mortgage: 85,000Indicators of distress
(excluding impact of measures):1
Households with negative equity (2010): 40 percent
Households with debt service exceeding 40
percent of disposable income (2010): 30 percent
Mortgages in default (2010): 15 percent
Take-up: CPI- and FX-payment
smoothing: 50 percentApproved and in-process
restructurings: Sector Agreement:
1.6 percent DO: 3.9 percent Mortgage Write-down for
Deeply Underwater Households: 14.9 percent
Sector Agreement (bank- administered voluntary restructuring)
Households with multiple creditors and debt service difficulties but able to service a mortgage amounting to at least 70 percent of the value of the house
Debt service is scaled down to capacity to pay.
Debt is reduced to 100 percent of collateral value if households remain current on reduced payments for three years.
Government fostered agreement among largest lenders.
Participation is voluntary. If agreement is not reached,
debtors may apply to the Debtor’s Ombudsman (DO) or the courts.
The burden of restructuring the loans falls on the lenders.
DO-Administered Voluntary Restructuring
Similar to Sector Agreement, but reaches less wealthy households. Aimed at households seeking advice and support in dealing with creditors.
Similar to Sector Agreement, but allows deeper temporary reduction in debt service. Procedures are more tailored and complex than under Sector Agreement.
Statutory framework that leads to court-administered restructuring in the event that negotiations are unsuccessful.
The burden of restructuring the loans falls on the lenders.
WEO_Ch 03.indd 108 4/11/12 2:03 PM

c h a p t e r 3 D e A l i n g w i t h h o u s e h o l D D e bt
International Monetary Fund | April 2012 109
Program Beneficiaries Debt ModificationsIncentives and Burden
Sharing
Take-up (in percent of mortgages, unless specified otherwise)
Iceland 2008
Mortgage Write-down for Deeply Underwater Households
Households with LTV ratio above 110 percent as of December 2010
Principal was reduced to 110 percent of the value of the debtor’s pledgeable assets.
Agreement between mortgage lenders and government. Participation was voluntary, but lenders signed on because the written-down value exceeded the re covery likely through bankruptcy.
Moral hazard was avoided because the program was limited to those with an LTV ratio above 110 percent in December 2010.
The burden of restructuring the loans falls on the lenders.
United States 2009
Home Affordable Modification Program (HAMP)2
Households in default Focused on reducing repayment burdens through (1) interest rate reductions, (2) term ex-tensions, (3) forbearance, and, since October 2010, principal reduction for loans outside the government-sponsored enterprises (Fannie Mae, Freddie Mac).
Participation is voluntary (except for receivers of Troubled Asset Relief Program funds).
Principal write-down not often used, increasing the likelihood that the modified loan will redefault.
Restructuring is initiated by servicers (not lenders), who have little incentive to participate.
Securitization and junior-claim holders create conflict of interest.
Total number of households: 114 million
Households with a mortgage: 51 million
Households with negative equity: 23 percent
Targeted reach: 6-8 percentTrial modifications: 4 percentPermanent modifications:
1.9 percentTotal committed: $29.9 billion
(0.2 percent of GDP)3
Total amount used: $2.3 billion3
Hungary 2011
September 2011 Borrowers in good standing with FX-denominated mortgages
Principal write-down through the ability to prepay mortgages at a preferential exchange rate
Mandated by statuteBurden of write-down borne
by lenders alonePrepayment requirement
limits ability of borrowers to participate.
Number of households: 4 million
Households with a mortgage: 800,000
Mortgages in arrears: 90,000Technically eligible: 90 percentPractically eligible: 25 percentPreliminary take-up:
15 percent
Colombia 1999
1999 Mortgage holders Banks forced to retake underwater property and treat loan as fully repaid
Repayment burden lowered through interest rate reduction
Participation mandated by court ruling
Moral hazard and loss of confidence led to credit crunch.
Number of households: ±10 million
Households with a mortgage: ±700,000
Mortgages in arrears: 126,000 (peak in 2002)
Repossessed homes: 43,000 (1999–2003)
Eligible borrowers: ±100 percent
1Near-universal indexation caused the indicators of distress to peak in 2010, two years after the crash.2HAMP is the flagship debt restructuring program. As discussed in the text, there are other initiatives under the Making Home Affordable (MHA) program. The description of the program and
cited numbers are as of the end of 2011. 3Source is Daily TARP Update for December 30, 2011 (Washington: U.S. Treasury). This reflects the amount obligated to all MHA initiatives. The total amount obligated for all housing
programs under the Troubled Asset Relief Program is $45.6 billion.
WEO_Ch 03.indd 109 4/11/12 2:03 PM

wo r l d e co n o m i c o u t lo o k : G r ow t h r e s um i n G, da n G e r s r e ma i n
110 International Monetary Fund | April 2012
default by households that would otherwise have repaid their loans, which further exacerbated lenders’ losses.35 Moreover, the court rulings weakened confidence regarding respect for private contracts and creditor rights. A severe and persistent credit crunch followed, and mortgage credit picked up only in 2005.
Hungary during the Great Recession
This episode illustrates how a compulsory pro-gram that is poorly targeted and puts the burden of debt restructuring on a fragile banking sector can jeopardize the stability of the financial system with-out achieving the desired economic objectives.
Hungarian households’ indebtedness in foreign currency is among the highest in eastern Europe, although total household debt peaked at a relatively modest level, 40 percent of GDP, and is concen-trated in roughly 800,000 households (or 20 percent of the total).36 With the sharp depreciation of the Hungarian forint after the start of the global financial crisis, concerns that the rising debt service was undermining private consumption compelled the authorities to help foreign-currency-indebted households.37 After a series of failed efforts to provide relief (such as a temporary moratorium on foreclosures and a voluntary workout initiative), the government introduced a compulsory debt restructuring program in September 2011, without prior consultation with stakeholders. During a fixed window (roughly five months), banks were forced to allow customers to repay their mortgages at a preferential exchange rate, roughly 30 percent below market rates. All losses from the implied debt reduc-tion would be borne by the banks alone.
The compulsory debt restructuring program appears to have achieved high participation based on preliminary estimates––about 15 percent of all mortgages (see Table 3.1). However, it has three core limitations. First, it is poorly targeted as far as reach-ing constrained households with a high marginal
35In order to compensate lenders for losses incurred by the court ruling, the national deposit insurance company established a line of credit with favorable rates for lenders in 2000.
36By the time the crisis arrived in 2008, 100 percent of all new lending and 50 percent of household loans outstanding were in Swiss francs and collateralized by housing.
37As IMF (2011a) explains, debt service for holders of foreign-currency-denominated loans increased by more than 50 percent.
propensity to consume. Only well-off households can repay outstanding mortgage balances with a one-time forint payment, implying limited redis-tribution toward consumers with a high marginal propensity to consume. Second, the compulsory program places the full burden of the losses on the banks, some of which are ill prepared to absorb such losses. Consequently, further bank deleveraging and a deepening of the credit crunch may result, with associated exchange rate pressure.38 And finally, the implicit retroactive revision of private contracts with-out consulting the banking sector hurts the overall investment climate.
The United States since the Great Recession
This episode, which is ongoing, illustrates how difficult it is to achieve comprehensive household debt restructuring in the face of a complex mortgage market and political constraints. The key programs have reached far fewer households than initially envisaged in the three years since their inception. These shortfalls led the authorities to adopt addi-tional measures in February 2012 to alleviate the pressure on household balance sheets.
Since the start of the Great Recession, a number of U.S. policymakers have advocated a bold house-hold debt restructuring program modeled on the HOLC of the Great Depression.39 However, support for such large-scale government intervention in the housing market has, so far, been limited.40 Instead,
38Realizing the potential adverse impact of the legislation on the banking sector, the authorities adopted additional measures in December 2011 to spread the burden (see IMF, 2011a).
39Specific proposals for household debt policies along the lines of HOLC include those of Blinder (2008) and Hubbard and Mayer (2008). Blinder (2008) proposed a HOLC-style program to refinance 1 to 2 million distressed mortgages for owner-occupied residences by borrowing and lending about $300 billion. Hubbard and Mayer (2008) proposed lowering repayment amounts and preventing foreclosures and estimated that this would stimulate consumption by approximately $120 billion a year, or 0.8 percent of GDP a year. Approximately half of this effect was estimated to come through the wealth effect––higher house prices due to fewer foreclosures––and half through the transfer of resources to constrained households (“HOLC effect”). See Hubbard and Mayer (2008) and Hubbard (2011). Analysis accompanying IMF (2011b, Chapter II) suggests that, for each 1 million foreclosures avoided, U.S. GDP would rise by 0.3 to 0.4 percentage point.
40The case of “cramdowns” illustrates how political constraints affected the policy response. As IMF (2011b) explains, the
WEO_Ch 03.indd 110 4/11/12 2:03 PM

c h a p t e r 3 D e A l i n g w i t h h o u s e h o l D D e bt
International Monetary Fund | April 2012 111
the authorities implemented a number of more modest policies.41 Here, we focus on the Home Affordable Modification Program (HAMP), the flagship mortgage debt restructuring initiative tar-geted at households in default or at risk of default. Announced in February 2009, HAMP’s goal was to stabilize the housing market and help struggling homeowners get relief by making mortgages more affordable through the modification of first-lien loans. The program was amended in October 2010 to allow principal write-downs under the Principal Reduction Alternative (PRA) and further enhanced in 2012, as discussed below. HAMP is part of the Making Home Affordable (MHA) initiative, which helps struggling homeowners get mortgage relief through a variety of programs that aid in modifica-tion, refinancing, deferred payment, and foreclosure alternatives. Other options under the MHA initia-tive include the Home Affordable Refinance Pro-gram (HARP), which also aims at reducing monthly mortgage payments. However, households already in default are excluded from HARP, and the impact on preventing foreclosures is likely to be more limited.42
HAMP had significant ambitions but has thus far achieved far fewer modifications than envisaged. Millions of households remain at risk of losing their homes. The stock of properties in foreclosure at the end of 2011 stood at about 2.4 million—a nearly fivefold increase over the precrisis level—and the so-called shadow inventory of distressed mortgages sug-gests that this number could rise significantly (Figure
authorities viewed allowing mortgages to be modified in courts (cramdowns) as a useful way to encourage voluntary modifica-tions at no fiscal cost, but noted that a proposal for such a policy had failed to garner sufficient political support in 2009. Mian, Sufi, and Trebbi (2012) argue that creditors’ greater ability to organize politically and influence government policy may be the reason they were better able to protect their interests during the recent financial crisis: “Debtors, on the other hand, were numer-ous and diffused, therefore suffering from typical collective action problems” (p. 20).
41Early attempts to fix the household debt problem were the Federal Housing Administration (FHA) Secure program, the Hope Now Alliance, the Federal Deposit Insurance Corporation’s Mod in a Box, and Hope for Homeowners.
42The MHA initiative also includes the FHA’s Short Refinance Program for borrowers with negative equity, Home Affordable Unemployment Program, Home Affordable Foreclosure Alterna-tives Program, Second Lien Modification Program, and Housing Finance Agency Innovation Fund for the Hardest Hit Housing Markets.
House prices (index; left scale)
Household debt (percent of disposable income; left scale)
Number of properties in foreclosure (thousands; right scale)
Shadow inventory(thousands; right scale)
There were about 2.4 million properties in foreclosure in the United States at the end of 2011, a nearly fivefold increase over the precrisis level, and the “shadow inventory” of distressed mortgages suggests that this number could rise further.
Sources: Office of the Comptroller of the Currency; Office of Thrift Supervision; U.S. Treasury; Federal Reserve; Haver Analytics; and IMF staff calculations.
Note: Shadow inventory indicates properties likely to go into foreclosure based on a number of assumptions. It includes a portion of all loans delinquent 90 days or more (based on observed performance of such loans); a share of modifications in place (based on redefault performance of modified mortgages); and a portion of negative equity mortgages (based on observed default rates). Data on modifications and negative equity are not available prior to 2008:Q2.
Figure 3.11. The U.S. Housing Market, 2000–11
50
60
70
80
90
100
110
120
130
140
150
0
500
1,000
1,500
2,000
2,500
3,000
3,500
4,000
4,500
5,000
2000 02 04 06 08 10 11:Q3
WEO_Ch 03.indd 111 4/11/12 2:03 PM

wo r l d e co n o m i c o u t lo o k : G r ow t h r e s um i n G, da n G e r s r e ma i n
112 International Monetary Fund | April 2012
3.11). Meanwhile, the number of permanently modi-fied mortgages amounts to 951,000, or 1.9 percent of all mortgages (see Table 3.1).43 By contrast, some 20 percent of mortgages were modified by the Depres-sion-era HOLC program, and HAMP’s targeted reach was 3 to 4 million homeowners (MHA, 2010).44 By the same token, the amount disbursed under MHA as of December 2011 was only $2.3 billion, well below the allocation of $30 billion (0.2 percent of GDP).
Issues with HAMP’s design help explain this disap-pointing performance. The specific issues are as follows: • Limited incentives for the parties to participate
in the program and tight eligibility criteria for borrowers have resulted in low take-up. The initial legislation made creditor cooperation completely voluntary, thereby enabling many creditors to opt out of the program. Loan servicers have little incentive to initiate a costly renegotiation process given that they are already compensated for some (legal) costs when delinquent loans enter foreclo-sure.45 The high probability of redefault may lead lenders and investors to prefer forbearance and foreclosure to modification (Adelino, Gerardi, and Willen, 2009). Securitization presents additional coordination and legal problems. In addition, conflicts of interest may arise, for example, when second-lien holders forestall debt restructuring
43As MHA (2012) explains, as of January 2012, 1.79 million trials had been started, but only 951,000 of these trials succeeded in becoming “permanent.” (The trial period allows the loan servicer to test the borrower’s ability to make the modified loan payment before finalizing the loan modification.) Note that some 200,000 of these modifications were subsequently canceled, leav-ing 769,000 active permanent modifications.
44In a report on the implementation of the HAMP program, the Office of the Special Inspector General for the Troubled Asset Relief Program (SIGTARP) clarified that “Treasury has stated that its 3 to 4 million homeowner goal is not tied to how many home-owners actually receive sustainable relief and avoid foreclosure, but rather that 3 to 4 million homeowners will receive offers for a trial modification” (SIGTARP, 2010). The report criticizes mea-suring trial modification offers—rather than foreclosures avoided through permanent modifications—as “simply not particularly meaningful.”
45As Kiff and Klyuev (2009) explain, a servicer’s primary duty is to collect mortgage payments from borrowers and pass them to the mortgage holders (trusts, in the case of securitized loans). Servicers also manage the escrow accounts they hold on behalf of borrowers to pay property taxes and insurance, and they employ various loss-mitigation techniques should the borrower default. Servicers are paid a fee for this work.
(IMF, 2011b). Several factors also hamper bor-rower participation. For instance, many of the expenses related to the outstanding loan, such as late fees and accrued interest, get folded into the new, modified loan. Finally, many distressed bor-rowers are effectively locked out of the program due to tight eligibility requirements. The unem-ployed are ineligible to apply for HAMP (they are eligible for a different initiative under MHA that is designed for the unemployed), and households that suffered large income losses often fail to meet the postmodification debt-to-income require-ments, especially without principal reduction. Overall, therefore, the program transfers only limited funds to distressed homeowners.
• HAMP has not reduced monthly mortgage pay-ments enough to restore affordability in many cases. HAMP includes strict step-by-step instruc-tions for modifying a loan, with the primary methods being interest rate reductions, term extensions, and forbearance. Certain exceptions to this step-by-step process are allowed. Non-GSE loans with an LTV above 115 percent may also be eligible for principal reductions under PRA.46 As of the end of 2011, 11 percent of HAMP permanent modifications included a principal write-down.47 The nonparticipation by GSEs, which hold about 60 percent of all outstanding mortgages, helps explain this low take-up. Importantly, the modifica-tions focus on bringing a narrow definition of the mortgage repayment burden down to 31 percent of monthly gross income rather than the total repayment burden (including other installment loans and second mortgages). As a result, most borrowers remain seriously constrained even after the modifications, with after-modification total debt repayment burdens averaging 60 percent of monthly gross income and the after-modification LTV sometimes actually increasing (MHA, 2012). This helps explain the high redefault rate on the modified loans, which currently averages 27
46The GSEs—government-sponsored enterprises—include the Federal National Mortgage Association (Fannie Mae) and the Federal Home Loan Mortgage Corporation (Freddie Mac).
47As MHA (2012) explains, 47,000 permanent modifications received principal write-downs (p. 4), which is equivalent to 11 percent of the 432,000 permanent modifications between Octo-ber 2010 and December 2011.
WEO_Ch 03.indd 112 4/11/12 2:03 PM

c h a p t e r 3 D e A l i n g w i t h h o u s e h o l D D e bt
International Monetary Fund | April 2012 113
percent after 18 months and as high as 41 percent in cases where the monthly payment reduction was less than or equal to 20 percent (MHA, 2012).In response to these shortcomings, the authorities
adopted additional measures to alleviate the pres-sure on household balance sheets. In February 2012, the authorities announced an expansion of HAMP, including broader eligibility and a tripling of the incentives for lenders to offer principal reductions. In addition, the program was extended by one year. However, participation of the GSEs in the program remains subject to approval by the Federal Hous-ing Finance Agency. Principal reductions are likely to reduce foreclosure rates and, if implemented on a large scale, would support house prices substan-tially—helping to eliminate the overall uncertainty weighing on the housing market via the shadow inventory.48
Scandinavia during the 1990s
The Scandinavian countries illustrate how institu-tional features, such as a large social safety net, may influence governments’ adoption of discretionary household debt restructuring policies. In contrast to the cases discussed above, these episodes featured few government initiatives directly targeted at house-hold debt. After housing prices peaked in the late 1980s and the subsequent onset of banking crises in these economies, the primary discretionary policy responses of the Scandinavian governments consisted of support for the financial system.
These economies did not initiate any household debt restructuring measures, but their large existing social safety nets supported household incomes and their ability to service their debt. The large safety nets are a result of a tradition of providing many public services, mainly as a way to promote equality in these economies.49 For example, unemployment
48Other measures include a pilot sale of foreclosed properties for conversion to rental housing. Transitioning properties into rentals should help reduce the negative impact of foreclosures on house prices. The authorities also called on Congress to broaden access to refinancing under HARP for both GSE-backed and non-GSE mortgages; these measures would support the recovery of the hous-ing market. In particular, they would allow non-GSE loans to be refinanced through a streamlined program operated by the FHA.
49For example, IMF (1991) explains that in Norway, “the Gov-ernment has traditionally sought to provide many basic services
benefits as a percentage of previous wages aver-aged 65 percent in Finland, Norway, and Sweden in 1991, well above the 47 percent average in other OECD economies (OECD, 1995, p. 61). In Swe-den, the wage replacement ratio was 83 percent. This government-provided insurance, along with other social safety net benefits, substantially mitigated the impact of job loss on households with distressed bal-ance sheets and supported their ability to pay their mortgages. At the same time, the automatic transfer programs combined with the recession implied a substantial rise in government debt. The government debt-to-GDP ratio rose from an average of 31 per-cent in 1990 to 64 percent in 1994 (Figure 3.12).50 In response, the authorities implemented cuts to social welfare payments in the mid- to late 1990s as part of a multiyear fiscal consolidation (Devries and others, 2011).
In addition, the variable mortgage rates prevalent in these economies allowed lower interest rates to pass through quickly to lower mortgage payments. The decline in short-term interest rates after the Scandinavian countries abandoned the exchange rate peg to the European Currency Unit in November 1992 was substantial. For example, the abandon-ment of the exchange rate peg allowed a cumulative 4 percentage point reduction in short-term interest rates in Sweden (IMF, 1993). By contrast, house-holds in economies where mortgage rates tend to be fixed over multiyear terms often need to apply for a new mortgage (refinance) in order to reap the ben-efit of lower prevailing rates, a process that can be hampered by lower house values and negative equity.
lessons from the case studies
Our investigation of the initiatives implemented by governments to address the problem of household debt during episodes of household deleveraging leads to the following policy lessons:
in the areas of health and education publicly, mainly as a way to promote equity but also for reasons of social policy. In addition, efforts to redistribute incomes and reduce regional differences have led to an extensive transfer system.” (p. 19)
50The rise in government debt was also a result of financial sup-port to the banking sector and discretionary fiscal stimulus aimed at reducing unemployment.
WEO_Ch 03.indd 113 4/11/12 2:03 PM
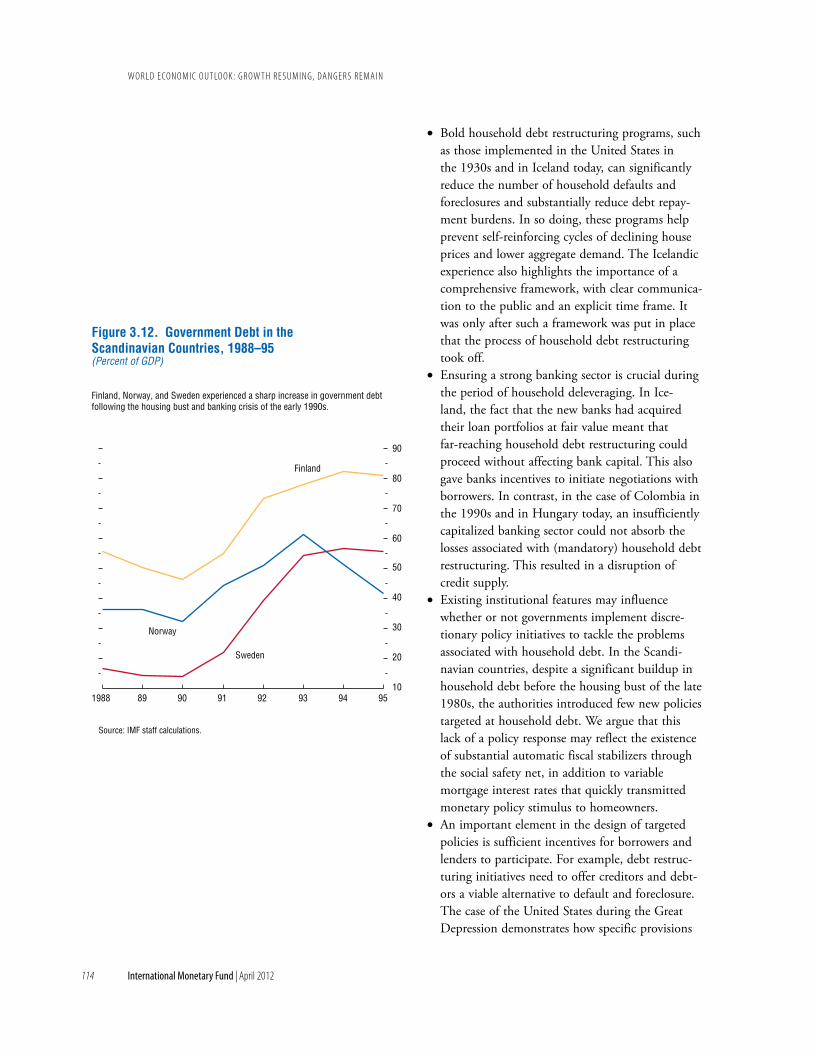
wo r l d e co n o m i c o u t lo o k : G r ow t h r e s um i n G, da n G e r s r e ma i n
114 International Monetary Fund | April 2012
• Bold household debt restructuring programs, such as those implemented in the United States in the 1930s and in Iceland today, can significantly reduce the number of household defaults and foreclosures and substantially reduce debt repay-ment burdens. In so doing, these programs help prevent self-reinforcing cycles of declining house prices and lower aggregate demand. The Icelandic experience also highlights the importance of a comprehensive framework, with clear communica-tion to the public and an explicit time frame. It was only after such a framework was put in place that the process of household debt restructuring took off.
• Ensuring a strong banking sector is crucial during the period of household deleveraging. In Ice-land, the fact that the new banks had acquired their loan portfolios at fair value meant that far-reaching household debt restructuring could proceed without affecting bank capital. This also gave banks incentives to initiate negotiations with borrowers. In contrast, in the case of Colombia in the 1990s and in Hungary today, an insufficiently capitalized banking sector could not absorb the losses associated with (mandatory) household debt restructuring. This resulted in a disruption of credit supply.
• Existing institutional features may influence whether or not governments implement discre-tionary policy initiatives to tackle the problems associated with household debt. In the Scandi-navian countries, despite a significant buildup in household debt before the housing bust of the late 1980s, the authorities introduced few new policies targeted at household debt. We argue that this lack of a policy response may reflect the existence of substantial automatic fiscal stabilizers through the social safety net, in addition to variable mortgage interest rates that quickly transmitted monetary policy stimulus to homeowners.
• An important element in the design of targeted policies is sufficient incentives for borrowers and lenders to participate. For example, debt restruc-turing initiatives need to offer creditors and debt-ors a viable alternative to default and foreclosure. The case of the United States during the Great Depression demonstrates how specific provisions
10
20
30
40
50
60
70
80
90
1988 89 90 91 92 93 94 95
Source: IMF staff calculations.
Figure 3.12. Government Debt in the Scandinavian Countries, 1988–95(Percent of GDP)
Finland, Norway, and Sweden experienced a sharp increase in government debt following the housing bust and banking crisis of the early 1990s.
Finland
Norway
Sweden
WEO_Ch 03.indd 114 4/11/12 2:03 PM

c h a p t e r 3 D e A l i n g w i t h h o u s e h o l D D e bt
International Monetary Fund | April 2012 115
can be implemented to ensure that the lenders willingly accept the government-supported modi-fications. In contrast, the case of the United States since the Great Recession, where loan modifica-tions may open the door to potential litigation by investors, illustrates how poorly designed house-hold debt restructuring efforts can result in low participation.
• Government support for household debt restruc-turing programs involves clear winners and losers. The friction caused by such redistribution may be one reason such policies have rarely been used in the past, except when the magnitude of the problem was substantial and the ensuing social and political pressures considerable.
summary and implications for the outlookHousing busts preceded by larger run-ups in gross
household debt are associated with deeper slumps, weaker recoveries, and more pronounced household deleveraging. The decline in economic activity is too large to be simply a reflection of a greater fall in house prices. And it is not driven by the occurrence of banking crises alone. Rather, it is the combination of the house price decline and the prebust leverage that seems to explain the severity of the contraction. These stylized facts are consistent with the predictions of recent theoretical models in which household debt and deleveraging drive deep and prolonged slumps.
Macroeconomic policies are a crucial element of efforts to avert excessive contractions in economic activity during episodes of household deleveraging. For example, fiscal transfers to unemployed house-holds through the social safety net can boost their incomes and improve their ability to service debt, as in the case of the Scandinavian economies in the 1990s. Monetary easing in economies in which mort-gages typically have variable interest rates can quickly reduce mortgage payments and prevent household defaults. Support to the financial sector can address the risk that household balance sheet distress will affect banks’ willingness to supply credit. Macro-economic stimulus, however, has its limits. The zero lower bound on nominal interest rates can prevent sufficient rate cuts, and high government debt may constrain the scope for deficit-financed transfers.
Targeted household debt restructuring policies can deliver significant benefits. Such policies can, at a relatively low fiscal cost, substantially mitigate the negative impact of household deleveraging on economic activity. In particular, bold household debt restructuring programs such as those implemented in the United States in the 1930s and in Iceland today can reduce the number of household defaults and foreclosures and alleviate debt repayment burdens. In so doing, these programs help prevent self-reinforcing cycles of declining house prices and lower aggregate demand. Such policies are particularly relevant for economies with limited scope for expansionary mac-roeconomic policies and in which the financial sector has already received government support.
However, the success of such programs depends on careful design. Overly restrictive eligibility criteria or poorly structured incentives can lead to programs having a fraction of their intended effect. Conversely, overly broad programs can have serious side effects and undermine the health of the financial sector.
appendix 3.1. Data construction and sourcesData on household balance sheets were col-
lected from a variety of sources. The main source is the Organization for Economic Cooperation and Development (OECD) Financial Accounts Data-base. The data set contains detailed information on households’ financial assets and liabilities for 33 economies, spanning the period 1950–2010, though the series for most of the economies begin in the 1990s. We focus on the household sector’s total financial liabilities. For several economies, the series on total financial liabilities were extended back using data from national sources (Finland, Italy, Korea, New Zealand, Norway, Sweden, United Kingdom, United States). Household financial liabilities series for Australia, Belgium, France, Germany, Greece, the Netherlands, and Portugal going back to 1980 were obtained from Cecchetti, Mohanty, and Zampolli (2011). More recent data on household balance sheets for several non-OECD countries (Bulgaria, Latvia, Lithuania, Romania) were obtained from Eurostat. Data for the United States before 1950 come from the U.S. Bureau of Economic Analysis and from Historical Statistics of the United States;
WEO_Ch 03.indd 115 4/11/12 2:03 PM

wo r l d e co n o m i c o u t lo o k : G r ow t h r e s um i n G, da n G e r s r e ma i n
116 International Monetary Fund | April 2012
for Iceland, data on household liabilities are from national sources.
The remainder of the series used in the chapter draw mostly on the IMF World Economic Outlook (WEO), World Bank World Development Indica-tors, OECD.Stat, and Haver Analytics databases. In particular, household disposable income, hous-ing prices, and unemployment rates are taken from OECD.Stat and spliced with Haver Analytics data to extend coverage. House price information for Colombia and Hungary are from the Global Property Guide; for Iceland, the housing price index is from national sources. Macroeconomic variables, such as real and nominal GDP, private consumption, invest-ment, and so on are from the WEO database.
Housing bust indicators are obtained from Claes-sens, Kose, and Terrones (2010), who use the Harding and Pagan (2002) algorithm to determine turning points in the (log) level of nominal house prices. Recession indicators are from Howard, Martin, and Wilson (2011), who define a recession as two consecu-tive quarters of negative growth. Because our empirical analysis relies on annual data, we assign the recession or housing bust, respectively, to the year of the first quar-ter of the recession or house price peak. Financial crisis indicators are from Laeven and Valencia (2010).
appendix 3.2. statistical Methodology and robustness checks
This appendix provides further details on the statistical methods used in the first section of the chapter and the robustness of the associated regres-sion results.
Model specification and estimation
The baseline specification is a cross-section and time-fixed-effects panel data model estimated for 24 Organization for Economic Cooperation and Devel-opment economies and Taiwan Province of China during 1980–2011:
2 2DYit = mi + lt + ∑ bj DYi,t–j + ∑ bs Busti,t–s j=0 s=0
2 + ∑ gs{Busti,t–s × HiDebti,t–s–1} s=0
2 + ∑ θs HiDebti,t–s–1 + vi,t , (3.1) s=0
where DYit denotes the change in the variable of interest. We start with the (log) of real household consumption and then examine the components of GDP, unemployment, household debt, and house prices. The term Bust denotes a housing bust dummy that takes the value of 1 at the start of a housing bust; HiDebt is a dummy variable that takes the value of 1 if the rise in the household debt-to-income ratio in the three years before the bust was “high.” In our baseline specification, we define the rise as high if it was above the median for all housing busts across all economies. We con-duct a number of robustness checks on this defini-tion of “high,” finding similar results (see below). We include country and time fixed effects to allow for global shocks and country-specific trends. We cumulate the estimates of equation (3.1) to obtain estimates of the response of the level of the variable of interest (Y ) along with the standard error (clus-tered by economy) using the delta method.
robustness checks
As Table 3.2 shows, the finding that housing busts preceded by a large buildup in household debt tend to be more severe holds up to a number of robustness checks. For each robustness check, we focus on the severity of the housing bust for the high- and low-debt groups in terms of the decline in real household consumption five years after the bust.51 The robustness tests include the following: • Definition of “high-debt” group: Our baseline
places a housing bust in the high-debt group if it was preceded by an above-median rise in the household debt-to-income ratio during the three years leading up to the bust. The results do not depend on whether the rise is defined in absolute terms (percentage point increase in the ratio) or in relative terms (proportionate increase in percent). The results are also similar if we define “high debt” as being in the top quartile and “low debt”
51Similar results are obtained at horizons of less than five years, but these are not reported, given space constraints.
WEO_Ch 03.indd 116 4/11/12 2:03 PM

c h a p t e r 3 D e A l i n g w i t h h o u s e h o l D D e bt
International Monetary Fund | April 2012 117
as being in the bottom quartile of the increase in the debt-to-income ratio.
• Time sample: The results are not driven by the Great Recession. Ending the sample in 2006 produces similar results.
• Outliers and specification: The results regarding the more severe contraction in economic activ-ity are robust to the exclusion of outliers using Cook’s distance. (This involves excluding outlier data points with large residuals or high influence.)
The results are also similar if we use a dynamic specification with four lags instead of the two lags in the baseline specification.
• Alternative estimation procedure: The results are also similar if we undertake the estimation using the Arellano-Bond (1991) estimator. This procedure addresses the possibility of bias because country fixed effects are correlated with the lagged dependent variables in the autoregressive equation.
Table 3.2. Real Consumption following Housing Busts: RobustnessHigh Debt Low Debt Difference
Baseline –4.315***(0.829)
–0.396(0.791)
–3.918***(0.970)
Alternative SamplesExcluding the Great Recession –4.098***
(0.987)–0.425(1.068)
–3.673***(1.294)
Excluding Financial Crises –1.757**(0.876)
0.504(0.735)
–2.261**(1.095)
Excluding Outliers –2.978***(0.755)
–0.133(0.726)
–2.845***(0.946)
Alternative Statistical ModelsGeneralized Method of Moments –4.142***
(0.996)–0.277(1.015)
–3.865***(1.301)
Four Lags of Dependent Variable –2.121**(1.071)
0.984(1.273)
–3.105**(1.310)
Alternative Definitions of High versus Low DebtAbove versus Below Median (percent increase in debt) –3.675***
(0.779)–0.543(0.841)
–3.132***(0.917)
Top versus Bottom Quartile (percentage point increase in debt)
–5.690***(1.601)
–0.948(1.236)
–4.742**(2.332)
Source: IMF staff calculations.
Note: The table presents the estimated cumulative response of real consumer spending following housing busts at year t = 5 for episodes with a low and high buildup in household debt in the three years prior to the housing bust. Robust standard errors, corrected for clustering at the economy level, are shown in parentheses. ***, **, and * indicate significance at the 1, 5, and 10 percent level, respectively.
WEO_Ch 03.indd 117 4/11/12 2:03 PM

wo r l d e co n o m i c o u t lo o k : G r ow t h r e s um i n G, da n G e r s r e ma i n
118 International Monetary Fund | April 2012
HOLC, a program that involved government purchases of distressed loans, was established June 13, 1933. The explicit goals of HOLC, set forth in its authorizing statute, were as follows: “To provide emergency relief with respect to home mortgage indebtedness, to refinance home mortgages, to extend relief to the owners of homes occupied by them and who are unable to amortize their debt elsewhere, to amend the Federal Home Loan Bank Act, to increase the market for obligations of the United States, and for other purposes.”
The program provided for (1) the exchange of HOLC bonds (with a federal guarantee at first of interest only but later, beginning in spring 1934, of both interest and principal) for home mortgages in default and, in a few cases, for (2) cash loans for payment of taxes and mortgage refinancing. HOLC loans were restricted to mortgages in default (or mortgages held by financial institutions in distress) and secured by nonfarm properties with dwelling space for not more than four families and appraised by HOLC officials at not more than $20,000 ($321,791 in 2008 dollars). No loans could exceed 80 percent of the HOLC appraisal, nor could any loan exceed $14,000. Loans were to carry no more than 5 percent interest and were to be amortized by monthly payments during their maturity of 15 years, which was sometimes extended to 20 years (Green and Wachter, 2005).
How It Worked
Eligibility criteria for borrowers and properties were stringently applied. In total (between June 13, 1933, and June 27, 1935) HOLC received 1,886,491 applications requesting $6.2 billion in refinancing, equivalent to roughly 35 percent of outstanding nonfarm mortgage loans, or 11 percent of gross national product, which exceeded its total authorization of $4.75 billion. Approximately 40 percent of those eligible for the program applied, and 46 percent of these applications were rejected or withdrawn. “Inadequate security” and “lack of distress” were the most cited reasons for rejection of an application. Some of the applications were
withdrawn as a result of voluntary bilateral agree-ments between the applicant and the lender, at the encouragement of HOLC. Nevertheless, HOLC bought and restructured about 1 million distressed mortgages that were at risk of foreclosure, or about one in five of all mortgages.
The success crucially depended on the lenders’ willingness to accept HOLC bonds in exchange for their outstanding mortgages. Lenders were reluctant to participate because of the initial limitation of the gov-ernment guarantee to interest only, with no commit-ment on principal, and the belief that HOLC would lose money. The relatively low 4 percent interest rate—roughly one-third below the customary rate on mortgages, some financial institutions’ legal restric-tions on investment policies, and the lack of confi-dence in the government’s credit were also reasons not to accept the exchange.
Yet the government guarantee of interest was much better than the promise of a distressed homeowner: an almost certain return of 4 percent was more attractive than an accruing but uncollectible 6 percent and came without collection and servicing costs or the expense of potential foreclosure. In addition, the appraisal standards might permit the receipt of more in bonds than could be obtained from sale at foreclosure. Finally, the bonds were exempt from state and local property taxes, and the income was exempt from state and federal normal income tax. To further improve the terms for the exchange, the legal restrictions on investment policies were lifted, the New York Real Estate Securities Exchange announced that the bonds would be admitted for trading, the Treasury autho-rized use of the bonds as collateral for deposits of pub-lic money, the Reconstruction Finance Corporation (RFC) agreed to accept the bonds as collateral at up to 80 percent of face value, and the Comptroller of the Currency reversed an earlier stand to permit receivers of national banks to accept the new bonds. In early 1934, the government guarantee was extended to the bond principal, undoubtedly enhancing their accept-ability, and HOLC announced new 18-year bonds, callable in 10 years and bearing a 3 percent coupon.
Appraisal values were critical in providing incen-tives for participation in the refinancing program as well as ensuring adequate reach and burden sharing.
box 3.1. the u.s. home owners’ loan corporation (holc)
The author of this box is Deniz Igan.
WEO_Ch 03.indd 118 4/11/12 2:03 PM

c h a p t e r 3 D e A l i n g w i t h h o u s e h o l D D e bt
International Monetary Fund | April 2012 119
The lower the valuation placed on properties, the less the risk for HOLC, but the fewer the number of homeowners who could benefit and the greater the sacrifice required from the former lenders. Appraisals were based on three equally weighted fac-tors: “the market value at the time of appraisal; the cost of a similar lot at the time of the appraisal, plus the reproduction cost of the building, less deprecia-tion; and the value of the premises as arrived at by capitalizing the monthly reasonable rental value of the premises over a period of the past ten years.” The result often exceeded the current market value given the circumstances in the housing market.
A couple of complications arose in the case of mortgages held by recently failed banks and in the case of second mortgages and other junior claims. A wholesale operation was established to handle the cases involving recently failed banks: the RFC would make a loan to a bank in difficulty and accept mortgages as collateral, and then HOLC
would process these mortgages and turn its bonds or cash over to the bank, which in turn repaid the RFC. About 13 percent of all HOLC-refinanced mortgages fell into this category. The policy for dealing with junior claim holders was to limit the total obligations on a property to 100 percent of its appraisal to ensure that borrowers could reason-ably be expected to carry out their obligations. The junior lien had to be secured by a bond and mort-gage, requiring foreclosure as a means of liquidation. (HOLC consent was required before the second-lien holder could foreclose.)
HOLC got off to a rough start: it underestimated the size of the task and was poorly organized. Its status as an independent organization gave it more freedom in terms of budgeting and administration, but the lack of precedent and the urgency of the situation posed challenges. Yet, within a few years, HOLC had gained a reputation for proper execu-tion and efficient provision of much-needed relief.
box 3.1. (continued)
WEO_Ch 03.indd 119 4/11/12 2:03 PM

wo r l d e co n o m i c o u t lo o k : G r ow t h r e s um i n G, da n G e r s r e ma i n
120 International Monetary Fund | April 2012
In the aftermath of Iceland’s devastating finan-cial crisis in 2008, the authorities sought to shield households from near-term distress, set them on a path to financial viability, and prevent a wave of foreclosures. Their policy initiatives fall into two broad categories: postponing or rescheduling debt service and reducing the stock of debt. The task was complicated by a Supreme Court finding, midway through the process, that most exchange-rate-linked obligations are illegal under a 2001 law. This stalled the debt reduction programs described below but also led to debt reduction equivalent to 10 percent of GDP, some of which would otherwise have been provided via those programs.1 Much of the cost of debt restructuring was borne indirectly by foreign creditors, who took significant losses when the banks collapsed.
Postponing or Rescheduling Debt Service
The immediate goal was to shield households from a ballooning in debt service stemming from the near universal indexation of debt to the consumer price index (CPI) or the exchange rate, both of which had risen sharply. A first step was to suspend debt service, temporarily, on all exchange-rate-linked loans and some local-currency mort-gages. Soon thereafter, the authorities introduced payment smoothing: a mechanism for reschedul-ing by rebasing debt service on an index that had risen much less than the CPI or the exchange rate. Payment smoothing provided up-front debt service relief of 15 to 20 percent for CPI-indexed loans and 30 to 40 percent for exchange-rate-indexed loans. The relief came at the cost of larger future payments and possible extensions of maturity. To encourage households to participate, payment smoothing was made the default option for CPI-indexed loans, and a three-year limit was placed on maturity extensions (with any remaining balances written off). About
The authors of this box are Edda Rós Karlsdóttir and Franek Rozwadowski.
1The illegal loans were recalculated as if they had been made in domestic currency on the best terms available at the time of the original loan. A February 2012 Supreme Court decision modified this treatment, but its effect is still unclear and is not reflected in this discussion.
50 percent of mortgages benefited from payment smoothing. A temporary moratorium on foreclo-sures of residential properties complemented these measures.
Debt Reduction
Several principles shaped Iceland’s approach to debt reduction. First, the financial burden was to fall on the financial sector, which had financial buf-fers, rather than on the public sector, whose debt was already high. Second, the needs of distressed households were to be weighed against preserving creditors’ rights. And finally, speed was an important consideration.
The approach rests on four pillars, each of which has been modified over time in light of experience. Three provide for case-by-case solutions admin-istered, respectively, by the courts, the financial sector, and the newly created Office of the Debtor’s Ombudsman (DO). The fourth is an agreement that allows fast-track write-downs for deeply underwater mortgages. • Court-administered solutions: The authorities
amended the Law on Bankruptcy in order to make it easier and cheaper for households to file for consolidation of unsecured debt and to shorten the discharge period in the event of bankruptcy. They also enacted the Law on Miti-gation of Residential Mortgage Payments, aimed at households with moderately priced homes. This law allows lenders to write down mortgages to 110 percent of collateral value (later reduced to 100 percent) and convert the written-down portion to an unsecured claim. This framework is cumbersome, but its basic elements—reduced payments during a specified period, a subsequent reduction of the lien, and possible cancellation of unsecured debt—were the model and legal basis for the out-of-court initiatives that followed. It also serves as a backstop in case out-of-court negotiations break down.
• Sector agreement: The authorities supported a sectorwide agreement on a bank-administered framework for fast-track out-of-court debt mitigation. This agreement addresses many of the problems associated with court-administered
box 3.2. household Debt restructuring in iceland
WEO_Ch 03.indd 120 4/11/12 2:03 PM

c h a p t e r 3 D e A l i n g w i t h h o u s e h o l D D e bt
International Monetary Fund | April 2012 121
restructuring. It integrates the handling of secured and unsecured debt and sets out guide-lines for third-party guarantees and collateral.
Under this framework, households seeking relief first liquidate nonessential assets and use any excess cash to reduce debt. Outstanding underwater mortgages (or auto loans) are then divided up into a secured loan, equal to 100 percent of the value of the collateral, and a provisionally unsecured loan. The general rule is that the household must service the secured loan in full and use its remaining “capacity to repay” to make partial pro rata payments on all unsecured loans.2 But there are also provisions for a three-year suspension of up to 30 percent of the mortgage. If the household remains current on all these payments for three years, the outstanding bal-ances of all unsecured loans are canceled.
• The Debtor’s Ombudsman: A third case-by-case framework was set up by legislation under a DO and its supporting legal framework. The DO provides households with legal and financial advice and appoints a supervisor to represent them in negotiations. The legislation seeks to reduce delays by introducing time limits for processing applications; it also incentivizes lend-ers by introducing a formal procedure for lodging claims, making court-administered restructuring the fallback (and threat) should negotiations fail. DO-administered debt restructuring has the same basic features as restructuring under the sector agreement, but it allows for more tailoring to individual circumstances, brings in a wider set of borrowers and creditors, and may provide for a smaller write-down of unsecured claims.
• Fast-track write-downs: The final pillar, erected in December 2010, was a government-fostered agreement by lenders on relatively simple rules for writing down deeply underwater mortgages to 110 percent of pledgeable assets. This agreement removed households’ incentive to hold back in the hope of a better deal later on by specifying the dates on which the mortgage and the prop-erty would be valued and by specifying the date
2Capacity to pay is defined as the difference between dis-posable income and the “normal” cost of living.
on which the offer would expire. The fast-track write-downs have reduced more debt and reached more households than all the other programs. As of January 31, 2012, close to 15 percent of households with mortgages have benefited from the fast-track write-downs, compared with fewer than 6 percent who have used or are using the sector agreement and the DO. That said, the case-by-case approaches may be reaching a larger number of households with high debt service ratios since only about a quarter of the house-holds benefiting from the fast-track write-downs were in this category (Ólafsson and Vignisdóttir, 2012).
Outcomes and Lessons
While the jury is still out on Iceland’s approach to household debt, a number of conclusions can already be drawn. First, measures with simple eligibility criteria, such as write-downs of deeply underwater mortgages, can provide quick relief with rough-hewn targeting. Second, case-by-case out-of-court frameworks can help bail out house-holds with complex problems faster than the courts. However, these frameworks are also slow: only 35 percent of the applications received had been processed by the end of January 2012. In part this is because key concepts (such as “capacity to repay”) were not defined precisely. But it is also because the legislation and the sector agreement leave more to be decided on the basis of individual circum-stances than is consistent with the fast-track objec-tive. Finally, in the same vein, the more complex structure of the DO approach contributes to long processing periods.
There appears to be a trade-off between speedy resolution and fine-tuning debt relief in order to protect property rights and reduce moral hazard. One way to minimize this trade-off is through the use of parallel frameworks—general measures for severe cases in which write-downs appear inevitable and case-by-case measures for more complex cases. Indeed the authorities’ decision to complement case-by-case frameworks with fast-track measures for deeply underwater mortgages is a step in the right direction.
box 3.2. (continued)
WEO_Ch 03.indd 121 4/11/12 2:03 PM

wo r l d e co n o m i c o u t lo o k : G r ow t h r e s um i n G, da n G e r s r e ma i n
122 International Monetary Fund | April 2012
referencesAdelino, Manuel, Kristopher Gerardi, and Paul Willen, 2009,
“Why Don’t Lenders Renegotiate More Home Mortgages? Redefaults, Self-Cures, and Securitization,” NBER Work-ing Paper No. 15159 (Cambridge, Massachusetts: National Bureau of Economic Research).
Arellano, Manuel, and Stephen Bond, 1991, “Some Tests of Specification for Panel Data: Monte Carlo Evidence and an Application to Employment Equations,” Review of Economic Studies, Vol. 58, pp. 277–97.
Blinder, Alan S., 2008, “From the New Deal, a Way Out of a Mess,” The New York Times, February 24.
Board of Governors of the Federal Reserve System (BGFRS), 2012, “The U.S. Housing Market: Current Conditions and Policy Considerations,” staff white paper (Washington, January).
Buiter, Willem H., 2010, “Housing Wealth Isn’t Wealth,” Economics—The Open-Access, Open-Assessment E-Journal, Vol. 4, No. 22, pp. 1–29.
Campbell, John, Stefano Giglio, and Parag Pathak, 2011, “Forced Sales and House Prices,” American Economic Review, Vol. 101, No. 5, pp. 2108–31.
Carroll, Christopher, Jiri Slacalek, and Martin Sommer, 2011, “Dissecting Saving Dynamics: Measuring Credit, Wealth and Precautionary Effects” (unpublished; Baltimore: Johns Hopkins University Press).
Cecchetti, Stephen G., M. S. Mohanty, and Fabrizio Zam-polli, 2011, “The Real Effects of Debt,” BIS Working Paper No. 352 (Basel: Bank for International Settlements).
Cerra, Valerie, and Sweta Saxena, 2008, “Growth Dynamics: The Myth of Economic Recovery,” American Economic Review, Vol. 98, No. 1, pp. 439–57.
Claessens, Stijn, Ayhan Kose, and Marco Terrones, 2010, “Financial Cycles: What? How? When?” in NBER Interna-tional Seminar on Macroeconomics, ed. by Richard Clarida and Francesco Giavazzi (Chicago: University of Chicago Press), pp. 303–43.
Coenen, Günter, Christopher J. Erceg, Charles Freedman, Davide Furceri, Michael Kumhof, René Lalonde, Douglas Laxton, Jesper Lindé, Annabelle Mourougane, Dirk Muir, Susanna Mursula, Carlos de Resende, John Roberts, Werner Roeger, Stephen Snudden, Mathias Trabandt, and Jan in’t Veld, 2012, “Effects of Fiscal Stimulus in Structural Models,” American Economic Journal: Macroeconomics, Vol. 4, No. 1, pp. 22–68.
Courtemanche, Charles, and Kenneth Snowden, 2011, “Repairing a Mortgage Crisis: HOLC Lending and Its Impact on Local Housing Markets,” Journal of Economic History, Vol. 71, No. 2, pp. 307–37.
Crowe, Christopher W., Giovanni Dell’Ariccia, Deniz Igan, and Pau Rabanal, 2011, “Policies for Macrofinancial Stabil-
ity: Options to Deal with Real Estate Booms,” IMF Staff Discussion Note No. 11/02 (Washington: International Monetary Fund).
Dell’Ariccia, Giovanni, Deniz Igan, Luc Laeven, and Hui Tong, forthcoming, “Policies for Macrofinancial Stability: Options to Deal with Credit Booms,” IMF Staff Discus-sion Note (Washington: International Monetary Fund).
Devries, Pete, Jaime Guajardo, Daniel Leigh, and Andrea Pescatori, 2011, “A New Action-Based Dataset of Fiscal Consolidation in OECD Countries,” IMF Working Paper No. 11/128 (Washington: International Monetary Fund).
Dynan, Karen, Jonathan Skinner, and Stephen P. Zeldes, 2004, “Do the Rich Save More?” Journal of Political Economy, Vol. 112, No. 2, pp. 397–444.
The Economist, 2011, “The Bursting of the Global Housing Bubble Is Only Halfway Through,” Nov. 26. www. economist.com/node/21540231.
Eggertsson, Gauti B., and Paul Krugman, 2010, “Debt, Dele-veraging, and the Liquidity Trap: A Fisher-Minsky-Koo Approach” (unpublished; Princeton, New Jersey: Princeton University).
Erbenova, Michaela, Yan Liu, and Magnus Saxegaard, 2011, “Corporate and Household Debt Distress in Latvia: Strengthening the Incentives for a Market-Based Approach to Debt Resolution,” IMF Working Paper No. 11/85 (Washington: International Monetary Fund).
Fatás, Antonio, 2012, “No Need to Deleverage Gross Debt.” http://fatasmihov.blogspot.com/2012/01/ no-need-to-deleverage-gross-debt.html.
Fishback, Price V., Alfonso Flores-Lagunes, William Horrace, Shawn Kantor, and Jaret Treber, 2010, “The Influence of the Home Owners’ Loan Corporation on Housing Markets During the 1930s,” Review of Financial Studies, Vol. 24, No. 6, pp. 1782–813.
Fisher, Irving, 1933, “The Debt-Deflation Theory of Great Depressions,” Econometrica, Vol. 1, No. 4, pp. 337–47.
Fondo de Garantías de Instituciones Financieras (Foga-fin), ed., 2009, Crisis Financiera Colombiana en los Años Noventa: Origen, Resolución y Lecciones Institucionales, Universidad Externado de Colombia (Bogotá).
Foote, Christopher, Kristopher Gerardi, Lorenz Goette, and Paul Willen, 2010, “Reducing Foreclosures: No Easy Answers,” NBER Macroeconomics Annual 2009, Vol. 24, pp. 89–138.
Forero, Efrain, 2004, “Evolution of the Mortgage System in Colombia: From the UPAC to the UVR1 System,” paper presented at the XLI Conferencia Interamericana para la Vivienda, Panama City, August 11–13, 2003.
Glick, Reuven, and Kevin J. Lansing, 2009, “U.S. Household Deleveraging and Future Consumption Growth,” FRBSF Economic Letter, May 15.
WEO_Ch 03.indd 122 4/11/12 2:03 PM
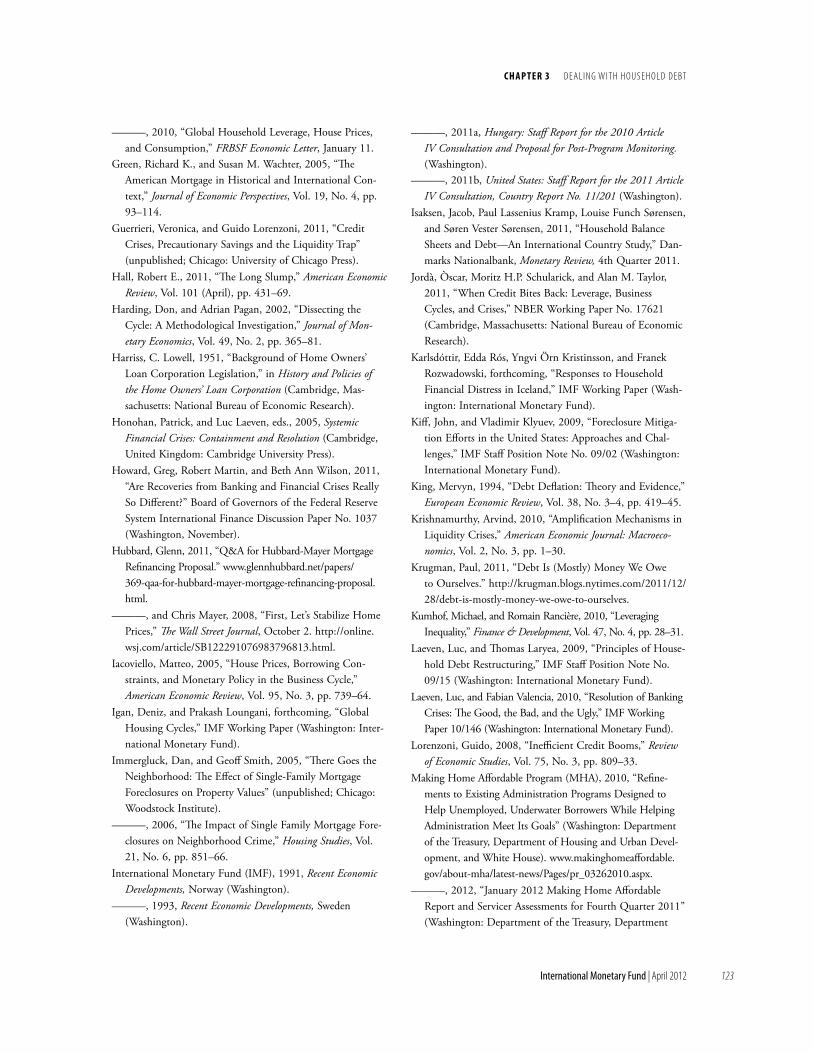
c h a p t e r 3 D e A l i n g w i t h h o u s e h o l D D e bt
International Monetary Fund | April 2012 123
———, 2010, “Global Household Leverage, House Prices, and Consumption,” FRBSF Economic Letter, January 11.
Green, Richard K., and Susan M. Wachter, 2005, “The American Mortgage in Historical and International Con-text,” Journal of Economic Perspectives, Vol. 19, No. 4, pp. 93–114.
Guerrieri, Veronica, and Guido Lorenzoni, 2011, “Credit Crises, Precautionary Savings and the Liquidity Trap” (unpublished; Chicago: University of Chicago Press).
Hall, Robert E., 2011, “The Long Slump,” American Economic Review, Vol. 101 (April), pp. 431–69.
Harding, Don, and Adrian Pagan, 2002, “Dissecting the Cycle: A Methodological Investigation,” Journal of Mon-etary Economics, Vol. 49, No. 2, pp. 365–81.
Harriss, C. Lowell, 1951, “Background of Home Owners’ Loan Corporation Legislation,” in History and Policies of the Home Owners’ Loan Corporation (Cambridge, Mas-sachusetts: National Bureau of Economic Research).
Honohan, Patrick, and Luc Laeven, eds., 2005, Systemic Financial Crises: Containment and Resolution (Cambridge, United Kingdom: Cambridge University Press).
Howard, Greg, Robert Martin, and Beth Ann Wilson, 2011, “Are Recoveries from Banking and Financial Crises Really So Different?” Board of Governors of the Federal Reserve System International Finance Discussion Paper No. 1037 (Washington, November).
Hubbard, Glenn, 2011, “Q&A for Hubbard-Mayer Mortgage Refinancing Proposal.” www.glennhubbard.net/papers/ 369-qaa-for-hubbard-mayer-mortgage-refinancing-proposal.html.
———, and Chris Mayer, 2008, “First, Let’s Stabilize Home Prices,” The Wall Street Journal, October 2. http://online.wsj.com/article/SB122291076983796813.html.
Iacoviello, Matteo, 2005, “House Prices, Borrowing Con-straints, and Monetary Policy in the Business Cycle,” American Economic Review, Vol. 95, No. 3, pp. 739–64.
Igan, Deniz, and Prakash Loungani, forthcoming, “Global Housing Cycles,” IMF Working Paper (Washington: Inter-national Monetary Fund).
Immergluck, Dan, and Geoff Smith, 2005, “There Goes the Neighborhood: The Effect of Single-Family Mortgage Foreclosures on Property Values” (unpublished; Chicago: Woodstock Institute).
———, 2006, “The Impact of Single Family Mortgage Fore-closures on Neighborhood Crime,” Housing Studies, Vol. 21, No. 6, pp. 851–66.
International Monetary Fund (IMF), 1991, Recent Economic Developments, Norway (Washington).
———, 1993, Recent Economic Developments, Sweden (Washington).
———, 2011a, Hungary: Staff Report for the 2010 Article IV Consultation and Proposal for Post-Program Monitoring. (Washington).
———, 2011b, United States: Staff Report for the 2011 Article IV Consultation, Country Report No. 11/201 (Washington).
Isaksen, Jacob, Paul Lassenius Kramp, Louise Funch Sørensen, and Søren Vester Sørensen, 2011, “Household Balance Sheets and Debt—An International Country Study,” Dan-marks Nationalbank, Monetary Review, 4th Quarter 2011.
Jordà, Òscar, Moritz H.P. Schularick, and Alan M. Taylor, 2011, “When Credit Bites Back: Leverage, Business Cycles, and Crises,” NBER Working Paper No. 17621 (Cambridge, Massachusetts: National Bureau of Economic Research).
Karlsdóttir, Edda Rós, Yngvi Örn Kristinsson, and Franek Rozwadowski, forthcoming, “Responses to Household Financial Distress in Iceland,” IMF Working Paper (Wash-ington: International Monetary Fund).
Kiff, John, and Vladimir Klyuev, 2009, “Foreclosure Mitiga-tion Efforts in the United States: Approaches and Chal-lenges,” IMF Staff Position Note No. 09/02 (Washington: International Monetary Fund).
King, Mervyn, 1994, “Debt Deflation: Theory and Evidence,” European Economic Review, Vol. 38, No. 3–4, pp. 419–45.
Krishnamurthy, Arvind, 2010, “Amplification Mechanisms in Liquidity Crises,” American Economic Journal: Macroeco-nomics, Vol. 2, No. 3, pp. 1–30.
Krugman, Paul, 2011, “Debt Is (Mostly) Money We Owe to Ourselves.” http://krugman.blogs.nytimes.com/2011/12/ 28/debt-is-mostly-money-we-owe-to-ourselves.
Kumhof, Michael, and Romain Rancière, 2010, “Leveraging Inequality,” Finance & Development, Vol. 47, No. 4, pp. 28–31.
Laeven, Luc, and Thomas Laryea, 2009, “Principles of House-hold Debt Restructuring,” IMF Staff Position Note No. 09/15 (Washington: International Monetary Fund).
Laeven, Luc, and Fabian Valencia, 2010, “Resolution of Banking Crises: The Good, the Bad, and the Ugly,” IMF Working Paper 10/146 (Washington: International Monetary Fund).
Lorenzoni, Guido, 2008, “Inefficient Credit Booms,” Review of Economic Studies, Vol. 75, No. 3, pp. 809–33.
Making Home Affordable Program (MHA), 2010, “Refine-ments to Existing Administration Programs Designed to Help Unemployed, Underwater Borrowers While Helping Administration Meet Its Goals” (Washington: Department of the Treasury, Department of Housing and Urban Devel-opment, and White House). www.makinghomeaffordable.gov/about-mha/latest-news/Pages/pr_03262010.aspx.
———, 2012, “January 2012 Making Home Affordable Report and Servicer Assessments for Fourth Quarter 2011” (Washington: Department of the Treasury, Department
WEO_Ch 03.indd 123 4/11/12 2:03 PM

wo r l d e co n o m i c o u t lo o k : G r ow t h r e s um i n G, da n G e r s r e ma i n
124 International Monetary Fund | April 2012
of Housing and Urban Development, and White House). www.treasury.gov/initiatives/financial-stability/results/MHA-Reports/Pages/default.aspx.
Mayer, Christopher J., 1995, “A Model of Negotiated Sales Applied to Real Estate Auctions,” Journal of Urban Eco-nomics, Vol. 38, No. 1, pp. 1–22.
McKinsey Global Institute (McKinsey), 2010, Debt and Dele-veraging: The Global Credit Bubble and Its Economic Conse-quences (Seoul, San Francisco, London, and Washington).
———, 2012, Debt and Deleveraging: Uneven Progress on the Path to Growth (Seoul, San Francisco, London, and Washington).
Melzer, Brian, 2010, “Debt Overhang: Reduced Investment by Homeowners with Negative Equity,” Kellogg School of Management Working Paper (Chicago).
Mian, Atif, Kamalesh Rao, and Amir Sufi, 2011, “Household Balance Sheets, Consumption, and the Economic Slump,” University of Chicago Booth School of Business Working Paper (Chicago).
Mian, Atif, and Amir Sufi, 2011, “Consumers and the Economy, Part II: Household Debt and the Weak U.S. Recovery,” FRBSF Economic Letter, January 18.
———, 2012, “What Explains High Unemployment? The Aggregate Demand Channel,” NBER Working Paper No. 17830 (Cambridge, Massachusetts: National Bureau of Economic Research).
Mian, Atif, Amir Sufi, and Francesco Trebbi, 2010, “The Political Economy of the U.S. Mortgage Default Crisis,” American Economic Review, Vol. 95, pp. 587–611.
———, 2012, “Resolving Debt Overhang: Political Con-straints in the Aftermath of Financial Crises,” NBER Working Paper No. 17831 (Cambridge, Massachusetts: National Bureau of Economic Research).
Minsky, Hyman, 1986, Stabilizing an Unstable Economy (New Haven, Connecticut: Yale University Press).
Modigliani, Franco, 1986, “Life Cycle, Individual Thrift, and the Wealth of Nations,” American Economic Review, Vol. 76, No. 3, pp. 297–313.
Myers, Stewart C., 1977, “Determinants of Corporate Borrowing,” Journal of Financial Economics, Vol. 5, No. 2, pp. 147–75.
Nakagawa, Shinobu, and Yosuke Yasui, 2009, “A Note on Japanese Household Debt: International Comparison and Implications for Financial Stability,” BIS Paper No. 46 (Basel: Bank for International Settlements).
Ólafsson, Tjörvi, and Karen Á. Vignisdóttir, 2012, “House-holds’ Position in the Financial Crisis in Iceland,” Central Bank of Iceland Working Paper (Reykjavik).
Olney, Martha L., 1999, “Avoiding Default: The Role of Credit in the Consumption Collapse of 1930,” The Quar-terly Journal of Economics, Vol. 114, No. 1, pp. 319–35.
Organization for Economic Cooperation and Development (OECD), 1995, Economic Survey, Sweden (Paris).
———, 2009, Economic Survey, Iceland (Paris).Philippon, Thomas, 2009, “The Macroeconomics of Debt
Overhang,” paper presented at the 10th Jacques Polak Annual Research Conference, November 5–6.
Rajan, Raghuram, and Luigi Zingales, 1998, “Financial Dependence and Growth,” American Economic Review, Vol. 88 (June), pp. 559–86.
Reinhart, Carmen M., and Kenneth Rogoff, 2009, This Time Is Different: Eight Centuries of Financial Folly (Princeton, New Jersey: Princeton University Press).
Rogoff, Kenneth, 2011, “Understanding the Second Great Contraction: An Interview with Kenneth Rogoff,” Mc Kinsey Quarterly (October). www.mckinseyquarterly.com/Understanding_the_Second_Great_Contraction_An_interview_with_Kenneth_Rogoff_2871.
Shleifer, Andrei, and Robert W. Vishny, 1992, “Liquida-tion Values and Debt Capacity: A Market Equilibrium Approach,” Journal of Finance, Vol. 47, No. 4, pp. 1343–66.
———, 2010, “Fire Sales in Finance and Macroeconomics,” NBER Working Paper No. 16642 (Cambridge, Massachu-setts: National Bureau of Economic Research).
Slok, Torsten, 2012, “Global Home Prices—Several Countries Still Overvalued,” presentation, Deutsche Bank Securities (New York).
Snowden, Kenneth, Jr., 2010, “The Anatomy of a Residential Mortgage Crisis: A Look Back to the 1930s,” in The Panic of 2008: Causes, Consequences and Proposals for Reform, ed. by Lawrence Mitchell and Arthur Wilmarth (Northamp-ton, Massachusetts: Edward Elgar).
Special Inspector General for the Troubled Asset Relief Program (SIGTARP), 2010, “Factors Affecting Implemen-tation of the Home Affordable Modification Program,” SIGTARP-10-005 (Washington, March 25).
Tobin, James, 1980, Asset Accumulation and Economic Activity: Reflections on Contemporary Macroeconomic Theory (Oxford: Basil Blackwell).
U.S. Office of the Comptroller of the Currency (OCC), 2011, Mortgage Metrics Report, Third Quarter (Washington).
Woodford, Michael, 2010, “Simple Analytics of the Govern-ment Expenditure Multiplier,” NBER Working Paper No. 15714 (Cambridge, Massachusetts: National Bureau of Economic Research).
WEO_Ch 03.indd 124 4/11/12 2:03 PM