chapter 3 delivering services - world bankdocuments.worldbank.org/curated/en/...uncovered egregious...
TRANSCRIPT

ing communication costs through digital platforms, they enable citizens to connect with one another at unprecedented scale, fostering citizen voice and col-lective action.
But the impact of these mechanisms on capability and empowerment depends on the strength of gov-ernment institutions. Institutions are the formal and informal rules that shape the incentives and behav-iors of politicians, government officials, and citizens. Strong institutions create incentives for politicians to work toward the public good and for bureaucrats to be accountable to those politicians. Digital tech-nologies, aligned with the incentives of politicians, government officials, and service providers, can thus be highly effective in improving outcomes. By con-trast, politicians in clientelist political institutions are largely accountable to a small set of elites and reject digitally enabled reforms that hurt vested inter-ests; instead, they use these technologies for greater control. And patronage-based bureaucracies resist e-government advances that would reduce discretion and rent-seeking. This misalignment between digital technologies and weak or unaccountable institutions creates the twin risks of increasing elite control and wasting scarce public resources on ineffective e-government projects.
Why do these institutional constraints persist? Digital technologies, particularly social media, have uncovered egregious abuses of public authority and triggered both virtual and physical citizen protests around scandals. But they haven’t sustained collective action around failures of service delivery. Service delivery problems are more difficult to monitor and attribute to specific government officials, and only rarely become salient in flashpoint events that trig-ger protests—like the excessive use of force by police. And they cannot be improved by one-off actions that change a bad policy or pass a new law. Addressing ser-vice delivery failures requires sustained citizen voice through effective offline mobilization by civil society
Have digital technologies made governments more willing and able to deliver services to their citizens? Not yet. Governments have invested heavily in dig-ital technology over the past two decades, and these efforts have made it easier in many countries for busi-nesses to file taxes, and for the poor to get an official identity allowing them to receive welfare payments and vote in elections. Digital technologies have also enabled governments to receive regular feedback from service users, improving service quality. But all too often the successes are isolated—limited to a few activities, sectors, or locales. Many investments in e-government fail to have any impact other than wasting scarce fiscal resources. Digital channels for mobilizing citizens to pressure policy makers to become more responsive have had little effect. And the new technologies have enhanced the capacity of unaccountable governments for surveillance and control. In sum, digital technologies have helped will-ing and able governments better serve their citizens, but they have not yet empowered citizens to make unwilling governments more accountable.
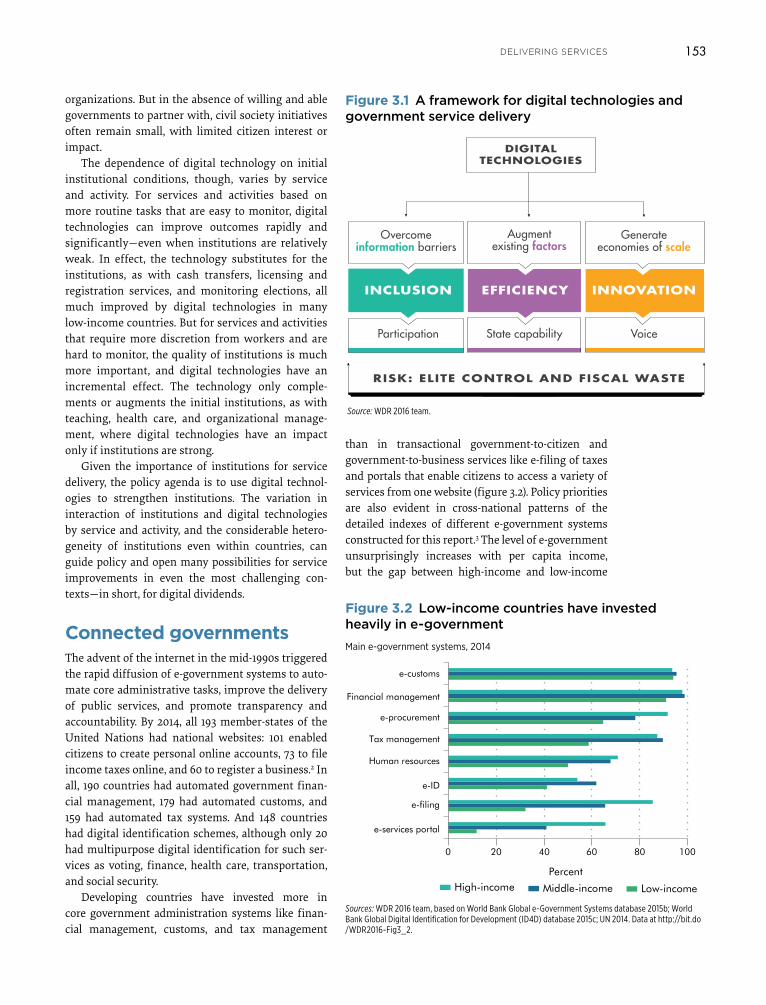
Efficient service delivery requires a capable gov-ernment that can implement policies and spend pub-lic resources effectively. It also requires an empow-ered citizenry able to hold politicians and policy makers to account so that governments serve citizens and not themselves or a narrow set of elites.1 Digital technologies can strengthen government capability and empower citizens through three mechanisms (figure 3.1). They overcome information barriers and promote participation by citizens in services and in elections. They enable governments to replace some factors used for producing services through the auto-mation of routine activities, particularly discretion-ary tasks vulnerable to rent-seeking, and to augment other factors through better monitoring, both by citizens through regular feedback on service quality and within government through better management of government workers. And by dramatically lower-
CHAPTER 3
Delivering services
153delivering services
than in transactional government-to-citizen and government-to-business services like e-filing of taxes and portals that enable citizens to access a variety of services from one website (figure 3.2). Policy priorities are also evident in cross-national patterns of the detailed indexes of different e-government systems constructed for this report.3 The level of e-government unsurprisingly increases with per capita income, but the gap between high-income and low-income
organizations. But in the absence of willing and able governments to partner with, civil society initiatives often remain small, with limited citizen interest or impact.
The dependence of digital technology on initial institutional conditions, though, varies by service and activity. For services and activities based on more routine tasks that are easy to monitor, digital technologies can improve outcomes rapidly and significantly—even when institutions are relatively weak. In effect, the technology substitutes for the institutions, as with cash transfers, licensing and registration services, and monitoring elections, all much improved by digital technologies in many low-income countries. But for services and activities that require more discretion from workers and are hard to monitor, the quality of institutions is much more important, and digital technologies have an incremental effect. The technology only comple-ments or augments the initial institutions, as with teaching, health care, and organizational manage-ment, where digital technologies have an impact only if institutions are strong.
Given the importance of institutions for service delivery, the policy agenda is to use digital technol-ogies to strengthen institutions. The variation in interaction of institutions and digital technologies by service and activity, and the considerable hetero-geneity of institutions even within countries, can guide policy and open many possibilities for service improvements in even the most challenging con-texts—in short, for digital dividends.
Connected governmentsThe advent of the internet in the mid-1990s triggered the rapid diffusion of e-government systems to auto-mate core administrative tasks, improve the delivery of public services, and promote transparency and accountability. By 2014, all 193 member-states of the United Nations had national websites: 101 enabled citizens to create personal online accounts, 73 to file income taxes online, and 60 to register a business.2 In all, 190 countries had automated government finan-cial management, 179 had automated customs, and 159 had automated tax systems. And 148 countries had digital identification schemes, although only 20 had multipurpose digital identification for such ser-vices as voting, finance, health care, transportation, and social security.
Developing countries have invested more in core government administration systems like finan-cial management, customs, and tax management
Figure 3.1 A framework for digital technologies and government service delivery
Overcomeinformation barriers
DIGITALTECHNOLOGIES
Augmentexisting factors
Generateeconomies of scale
Participation
RISK: ELITE CONTROL AND FISCAL WASTE
State capability Voice
EFFICIENCY INNOVATIONINCLUSION
Source: WDR 2016 team.
Sources: WDR 2016 team, based on World Bank Global e-Government Systems database 2015b; World Bank Global Digital Identification for Development (ID4D) database 2015c; UN 2014. Data at http://bit.do /WDR2016-Fig3_2.
0 20 40 60 80 100
e-services portal
e-filing
e-ID
Human resources
Tax management
e-procurement
Financial management
e-customs
PercentHigh-income Middle-income Low-income
Figure 3.2 Low-income countries have invested heavily in e-governmentMain e-government systems, 2014

154 WORLD DEVELOPMENT REPORT 2016
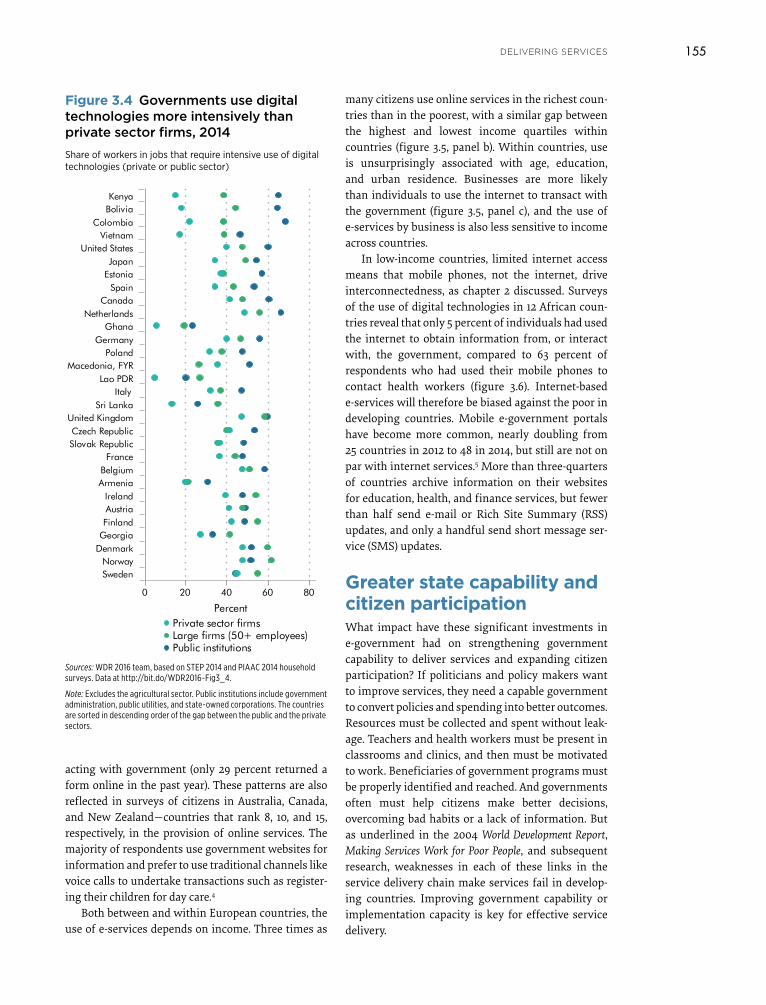
For example, more than 60 percent of public sector workers are in jobs that require intensive use of tech-nologies in Bolivia, Colombia, and Kenya, compared with only approximately 20 percent of private sector workers. But the gap persists in 22 of the countries when the public sector is compared only with large private sector firms (those with more than 50 employ-ees). Governments are also more intensive users of technology in high-income countries like Germany, Japan, and the United States.
Whether this substantial investment in e-government has strengthened state capability and improved outcomes will be explored at length in the next section. One indication of the limited return on these investments is citizen use of e-government services, which has lagged behind supply (figure 3.5, panel a). Even in countries where internet access is not a constraint, as in Europe, citizens use e-government mostly to get information (on average 44 percent of individuals in the European countries for which data are available visited a government website at least once in the past year to get information) and not for trans-
countries is lowest for administrative systems and highest for online services for citizens and businesses, with digital identification systems in the middle (fig-ure 3.3). Fifteen middle-income countries score in the top quartile of administrative e-government systems, with Brazil, Colombia, Mexico, and Peru in the top 10 worldwide, and Nepal, Rwanda, and Uganda scoring highly among low-income countries. India and Paki-stan have more advanced digital identification sys-tems than high-income North American countries, pointing to the potential for “leapfrogging” that these technologies offer.
Governments are more intensive users of infor-mation technology than firms. Survey data on the use of digital technologies (computers, mobile phones, and the internet) in nonagricultural jobs from 30 countries show that in all but one country, a higher share of public sector workers are in jobs that require frequent use of the technology in their daily work as compared to private sector workers (figure 3.4). This gap is not surprising for developing countries, where most firms are small and in the informal sector.
0 0.2 0.4 0.6 0.8 1.0 0 0.2 0.4 0.6 0.8 1.0 0 0.2 0.4 0.6 0.8 1.0
a. Core systems
Sub-Saharan Africa
East Asia and Pacific
Middle East and North Africa
South Asia
Latin America and the Caribbean
Europe and Central Asia
North America
Low-income
High-income: Non-OECD
Lower-middle-income
Upper-middle-income
High-income: OECD
All countries
b. Online services
Sub-Saharan Africa
South Asia
East Asia and Pacific
Latin America and the Caribbean
Middle East and North Africa
Europe and Central Asia
North America
Low-income
Lower-middle-income
Upper-middle-income
High-income: Non-OECD
High-income: OECD
All countries
c. Digital ID
North America
East Asia and Pacific
Sub-Saharan Africa
Latin America and the Caribbean
Europe and Central Asia
Middle East and North Africa
South Asia
Low-income
Lower-middle-income
Upper-middle-income
High-income: Non-OECD
High-income: OECD
All countries
Index Index Index
Figure 3.3 The priority in low-income countries has been core e-government systems, 2014Indexes of e-government systems, by income and region
Sources: WDR 2016 team, based on World Bank (2015b) Global e-Government Systems database; World Bank Global Digital Identification for Development (ID4D) database; UN 2014. Data at http://bit.do/WDR2016-Fig3_3.
Note: The left and right of each box plot represent the first and third quartiles, and the line in the middle of each box plot is the median. The two ends of the whiskers represent the 10th and the 90th percentile observations. The core e-government index in panel a measures the automation and integration of countries’ financial management information systems (including budget formulation and execution functions, source of public finance data, and treasury account structure); human resources management information systems (including personnel management and payroll); e-tax systems (including e-filing and tax administration systems); e-customs; and e-procurement. The online services, panel b, index is prepared by the United Nations Department of Economic and Social Affairs as part of its overall e-government index. The Digital ID index, panel c, measures the extent to which electronic identification can be used to access services, whether it features magnetic-strip or smart-chip technology, and whether it has embedded digital signature capabilities. OECD = Organisation for Economic Co-operation and Development.
155delivering services
0 20 40 60 80
Percent
SwedenNorway
DenmarkGeorgiaFinlandAustriaIreland
ArmeniaBelgium
FranceSlovak RepublicCzech Republic
United KingdomSri Lanka
ItalyLao PDR
Macedonia, FYRPoland
GermanyGhana
NetherlandsCanada
SpainEstoniaJapan
United StatesVietnam
ColombiaBoliviaKenya
Private sector firmsLarge firms (50+ employees)Public institutions
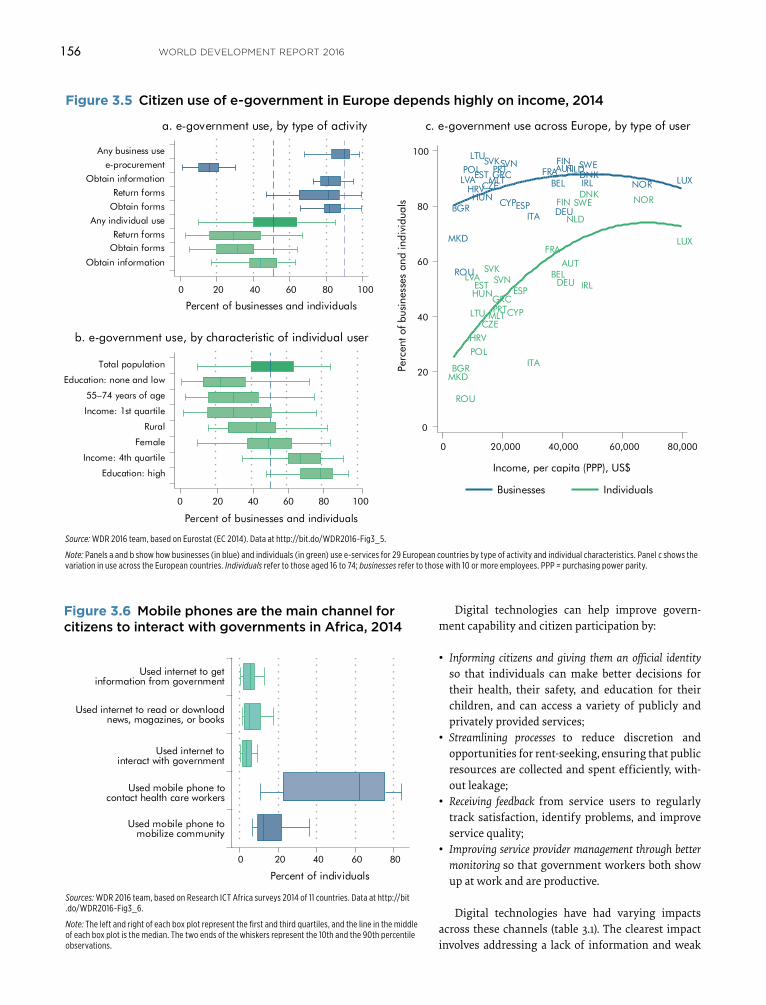
many citizens use online services in the richest coun-tries than in the poorest, with a similar gap between the highest and lowest income quartiles within countries (figure 3.5, panel b). Within countries, use is unsurprisingly associated with age, education, and urban residence. Businesses are more likely than individuals to use the internet to transact with the government (figure 3.5, panel c), and the use of e-services by business is also less sensitive to income across countries.
In low-income countries, limited internet access means that mobile phones, not the internet, drive interconnectedness, as chapter 2 discussed. Surveys of the use of digital technologies in 12 African coun-tries reveal that only 5 percent of individuals had used the internet to obtain information from, or interact with, the government, compared to 63 percent of respondents who had used their mobile phones to contact health workers (figure 3.6). Internet-based e-services will therefore be biased against the poor in developing countries. Mobile e-government portals have become more common, nearly doubling from 25 countries in 2012 to 48 in 2014, but still are not on par with internet services.5 More than three-quarters of countries archive information on their websites for education, health, and finance services, but fewer than half send e-mail or Rich Site Summary (RSS) updates, and only a handful send short message ser-vice (SMS) updates.
Greater state capability and citizen participationWhat impact have these significant investments in e-government had on strengthening government capability to deliver services and expanding citizen participation? If politicians and policy makers want to improve services, they need a capable government to convert policies and spending into better outcomes. Resources must be collected and spent without leak-age. Teachers and health workers must be present in classrooms and clinics, and then must be motivated to work. Beneficiaries of government programs must be properly identified and reached. And governments often must help citizens make better decisions, overcoming bad habits or a lack of information. But as underlined in the 2004 World Development Report, Making Services Work for Poor People, and subsequent research, weaknesses in each of these links in the service delivery chain make services fail in develop-ing countries. Improving government capability or implementation capacity is key for effective service delivery.
acting with government (only 29 percent returned a form online in the past year). These patterns are also reflected in surveys of citizens in Australia, Canada, and New Zealand—countries that rank 8, 10, and 15, respectively, in the provision of online services. The majority of respondents use government websites for information and prefer to use traditional channels like voice calls to undertake transactions such as register-ing their children for day care.4
Both between and within European countries, the use of e-services depends on income. Three times as
Figure 3.4 Governments use digital technologies more intensively than private sector firms, 2014Share of workers in jobs that require intensive use of digital technologies (private or public sector)
Sources: WDR 2016 team, based on STEP 2014 and PIAAC 2014 household surveys. Data at http://bit.do/WDR2016-Fig3_4.
Note: Excludes the agricultural sector. Public institutions include government administration, public utilities, and state-owned corporations. The countries are sorted in descending order of the gap between the public and the private sectors.
156 WORLD DEVELOPMENT REPORT 2016
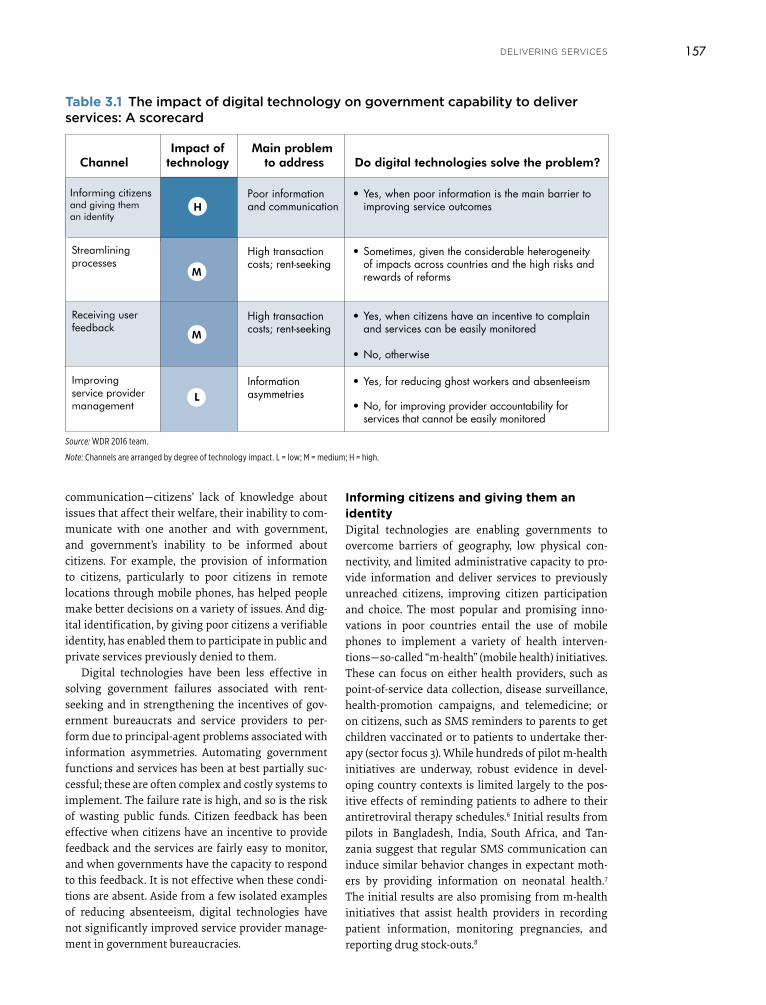
Digital technologies can help improve govern-ment capability and citizen participation by:
• Informing citizens and giving them an official identity so that individuals can make better decisions for their health, their safety, and education for their children, and can access a variety of publicly and privately provided services;
• Streamlining processes to reduce discretion and opportunities for rent-seeking, ensuring that public resources are collected and spent efficiently, with-out leakage;
• Receiving feedback from service users to regularly track satisfaction, identify problems, and improve service quality;
• Improving service provider management through better monitoring so that government workers both show up at work and are productive.
Digital technologies have had varying impacts across these channels (table 3.1). The clearest impact involves addressing a lack of information and weak
0 20 40 60 80 100
Percent of businesses and individuals
Obtain information
Obtain formsReturn forms
Any individual use
Obtain forms
Return forms
Obtain information
e-procurement
Any business use
a. e-government use, by type of activity
b. e-government use, by characteristic of individual user
AUT
BEL
BGR
HRVCYP
CZEDNKEST
FINFRA
DEU
GRC
HUN
IRL
ITA
LVA
LTU
LUX
MKD
MLTNLD
NOR
POL PRT
ROU
SVKSVN
ESP
SWE
AUTBEL
BGR
HRV
CYPCZE
DNK
EST
FIN
FRA
DEUHUN
IRL
ITA
LVA
LTU
LUX
MKD
MLT
NLD
NOR
POL
PRT
ROU
SVKSVN
ESP
SWE
0
20
40
60
80
100
Perc
ent o
f bus
ines
ses
and
ind
ivid
uals
0 20,000 40,000 60,000 80,000
Income, per capita (PPP), US$
c. e-government use across Europe, by type of user
GRC
0 20 40 60 80 100
Percent of businesses and individuals
Education: high
Income: 4th quartile
Female
Rural
Income: 1st quartile
55–74 years of age
Education: none and low
Total population
Businesses Individuals
Figure 3.5 Citizen use of e-government in Europe depends highly on income, 2014
Source: WDR 2016 team, based on Eurostat (EC 2014). Data at http://bit.do/WDR2016-Fig3_5.
Note: Panels a and b show how businesses (in blue) and individuals (in green) use e-services for 29 European countries by type of activity and individual characteristics. Panel c shows the variation in use across the European countries. Individuals refer to those aged 16 to 74; businesses refer to those with 10 or more employees. PPP = purchasing power parity.
Figure 3.6 Mobile phones are the main channel for citizens to interact with governments in Africa, 2014
Sources: WDR 2016 team, based on Research ICT Africa surveys 2014 of 11 countries. Data at http://bit .do/WDR2016-Fig3_6.
Note: The left and right of each box plot represent the first and third quartiles, and the line in the middle of each box plot is the median. The two ends of the whiskers represent the 10th and the 90th percentile observations.
0 20 40 60 80
Percent of individuals
Used mobile phone tomobilize community
Used mobile phone to contact health care workers
Used internet tointeract with government
Used internet to read or downloadnews, magazines, or books
Used internet to get information from government
157delivering services
Informing citizens and giving them an identityDigital technologies are enabling governments to overcome barriers of geography, low physical con-nectivity, and limited administrative capacity to pro-vide information and deliver services to previously unreached citizens, improving citizen participation and choice. The most popular and promising inno-vations in poor countries entail the use of mobile phones to implement a variety of health interven-tions—so-called “m-health” (mobile health) initiatives. These can focus on either health providers, such as point-of-service data collection, disease surveillance, health-promotion campaigns, and telemedicine; or on citizens, such as SMS reminders to parents to get children vaccinated or to patients to undertake ther-apy (sector focus 3). While hundreds of pilot m-health initiatives are underway, robust evidence in devel-oping country contexts is limited largely to the pos-itive effects of reminding patients to adhere to their antiretroviral therapy schedules.6 Initial results from pilots in Bangladesh, India, South Africa, and Tan-zania suggest that regular SMS communication can induce similar behavior changes in expectant moth-ers by providing information on neonatal health.7 The initial results are also promising from m-health initiatives that assist health providers in recording patient information, monitoring pregnancies, and reporting drug stock-outs.8
communication—citizens’ lack of knowledge about issues that affect their welfare, their inability to com-municate with one another and with government, and government’s inability to be informed about citizens. For example, the provision of information to citizens, particularly to poor citizens in remote locations through mobile phones, has helped people make better decisions on a variety of issues. And dig-ital identification, by giving poor citizens a verifiable identity, has enabled them to participate in public and private services previously denied to them.
Digital technologies have been less effective in solving government failures associated with rent- seeking and in strengthening the incentives of gov-ernment bureaucrats and service providers to per-form due to principal-agent problems associated with information asymmetries. Automating government functions and services has been at best partially suc-cessful; these are often complex and costly systems to implement. The failure rate is high, and so is the risk of wasting public funds. Citizen feedback has been effective when citizens have an incentive to provide feedback and the services are fairly easy to monitor, and when governments have the capacity to respond to this feedback. It is not effective when these condi-tions are absent. Aside from a few isolated examples of reducing absenteeism, digital technologies have not significantly improved service provider manage-ment in government bureaucracies.
H
M
L• Yes, for reducing ghost workers and absenteeism
• No, for improving provider accountability for services that cannot be easily monitored
Informationasymmetries
Improving service provider management
Do digital technologies solve the problem?Main problem
to addressImpact of
technologyChannel
M
Informing citizensand giving theman identity
Poor informationand communication
• Yes, when poor information is the main barrier to improving service outcomes
• Sometimes, given the considerable heterogeneity of impacts across countries and the high risks and rewards of reforms
• Yes, when citizens have an incentive to complain and services can be easily monitored
• No, otherwise
High transactioncosts; rent-seeking
High transactioncosts; rent-seeking
Streamlining processes
Receiving user feedback
Table 3.1 The impact of digital technology on government capability to deliver services: A scorecard
Source: WDR 2016 team.
Note: Channels are arranged by degree of technology impact. L = low; M = medium; H = high.
158 WORLD DEVELOPMENT REPORT 2016
Weaknesses in civil registration in developing countries mean that approximately 2.4 billion people in the world do not have birth certificates and other official documents to prove who they are, preventing many from opening bank accounts, registering prop-erty, or receiving public transfers.13 Digital identifi-cation (ID) programs that use biometrics to register and authenticate individuals, although complex and thus risky to implement, provide a robust solution to this problem. They enable poor countries to leapfrog the decades-long processes that developed countries went through to build their traditional, paper-based civil registration systems (see spotlight 4). These schemes are expanding; 148 of 197 countries have some form of electronic ID. But only 20 countries have a multipurpose ID with digital signature capa-bility that can be used for multiple online and offline services; 100 have digital identification systems lim-ited to a few functions (services like voting or public sector payroll that cover only subsets of the general population); and 49 have no digital ID of any kind.14
Evidence on the impact of these schemes, while largely anecdotal, points to significant potential ben-efits of reducing leakages in government welfare
This use of digital technologies to overcome geo-graphic, infrastructure, and administrative bottle-necks to information and communication is particu-larly powerful in emergencies like disease outbreaks, natural disasters, and conflict (box 3.1).
Digital technologies can also strengthen social norms and promote civic behavior like voluntary tax compliance or energy conservation through “peer comparisons”—making an individual’s actions more observable to others and making others’ actions more observable to the individual.9 For instance, tax evasion is pervasive in developing countries. Some governments collect less than half the taxes due to them.10 Simple behavioral nudges, such as naming and shaming tax delinquents by publishing their names on websites, can be a cost-effective inter-vention even in low government capacity contexts. Such peer comparisons have improved tax com-pliance in Norway and the United States, although the developing country evidence is more mixed.11 Comparisons of a household’s power consumption with that of neighbors, as done by companies like Opower, can also help conserve energy through peer pressure.12
Box 3.1 Digital technology and crisis management
Digital technologies have helped monitor and manage human and natural disasters, such as wars, floods, earth-quakes, and epidemics. The internet can help in coordi-nating data flows and improving the timeliness of decision making, while mobile phones can disseminate vital infor-mation. Social media can also help survivors communicate their status and mobilize volunteer resources and donations outside the disaster zone. A few examples of responses to recent crises show the range of possibilities:
• �The�Ebola�epidemic�in�Guinea,�Liberia,�and�Sierra�Leone�created logistical challenges for the organizations that responded, not least how to pay fieldworkers in remote and rural locations, many of them not local. The United Nations Development Programme set up a scheme to use mobile phones to make direct payments to the Ebola response workers in Sierra Leone and Liberia, who num-bered some 60,000 at the height of the crisis.a
• �The�earthquakes�that�struck�Nepal�in�April�and�May�2015�left at least 8,500 people dead, more than 17,000 injured,
and many thousands homeless. Although donations came in from all over the world, ensuring that aid reached the areas most affected proved a challenge. One response, coordinated by Kathmandu Living Labs,b was to develop a dynamic map (quakemap.org) as a centralized platform for displaying incident reports and offers of assistance. The map is built around the OpenStreetMap and uses the Ushahidi platform for incident reports—both based on open-source software and crowdsourced information.c
• �Recovering� from� conflict� and� civil� war� requires� long-term nation building, and more than 40 countries have adopted Truth and Reconciliation Commissions (TRCs) to assist in this process.d The Liberia TRC received some 20,000 statements from Liberians, at home and in the diaspora. Many depositions were audio and video recordings, now stored as a permanent memorial at the TRC website (http://trcofliberia.org/). Interestingly, the videos have been viewed four times more often than the TRC’s final report, indicating the reach of multimedia for storytelling at the human scale.e
a. See http://www.sl.undp.org/content/sierraleone/en/home/presscenter/articles/2015/05/12/mobile-pay-for-thousands-of-ebola-workers.html.b. See http://www.kathmandulivinglabs.org/. c. See http://www.bbc.com/news/world-asia-32603870. d. Kelly and Souter 2014.e. Best 2013.
159delivering services
programs and empowering women through financial inclusion and access to government cash transfers (box 3.2). Biometric registration, authentication, and pay-ments in India’s National Rural Employment Guarantee Scheme, the world’s largest workfare program, reduced the time for paying beneficiaries by 29 percent and leak-ages by 35 percent (see spotlight 4).15 But these schemes are complex and have all the risks of wastage associ-ated with large government information technology projects. They also raise concerns about government surveillance, violation of privacy, and data integrity.
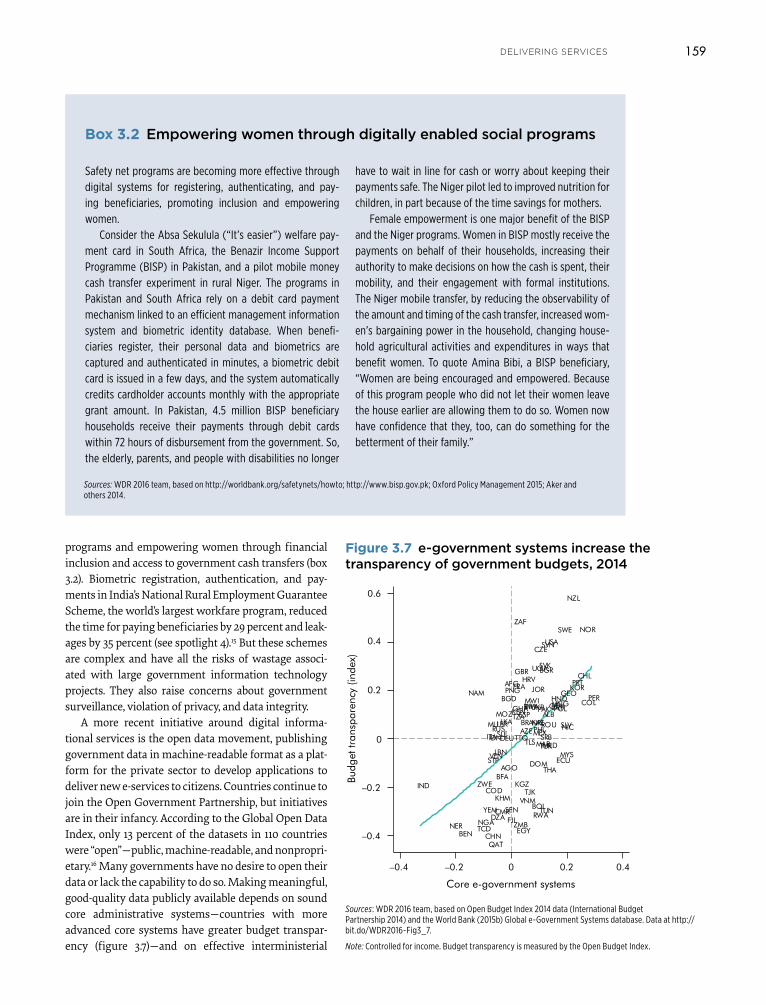
A more recent initiative around digital informa-tional services is the open data movement, publishing government data in machine-readable format as a plat-form for the private sector to develop applications to deliver new e-services to citizens. Countries continue to join the Open Government Partnership, but initiatives are in their infancy. According to the Global Open Data Index, only 13 percent of the datasets in 110 countries were “open”—public, machine-readable, and nonpropri-etary.16 Many governments have no desire to open their data or lack the capability to do so. Making meaningful, good-quality data publicly available depends on sound core administrative systems—countries with more advanced core systems have greater budget transpar-ency (figure 3.7)—and on effective interministerial
Figure 3.7 e-government systems increase the transparency of government budgets, 2014
Sources: WDR 2016 team, based on Open Budget Index 2014 data (International Budget Partnership 2014) and the World Bank (2015b) Global e-Government Systems database. Data at http:// bit.do/WDR2016-Fig3_7.
Note: Controlled for income. Budget transparency is measured by the Open Budget Index.
Box 3.2 Empowering women through digitally enabled social programs
Safety net programs are becoming more effective through digital systems for registering, authenticating, and pay-ing beneficiaries, promoting inclusion and empowering women.
Consider the Absa Sekulula (“It’s easier”) welfare pay-ment card in South Africa, the Benazir Income Support Programme (BISP) in Pakistan, and a pilot mobile money cash transfer experiment in rural Niger. The programs in Pakistan and South Africa rely on a debit card payment mechanism linked to an efficient management information system and biometric identity database. When benefi-ciaries register, their personal data and biometrics are captured and authenticated in minutes, a biometric debit card is issued in a few days, and the system automatically credits cardholder accounts monthly with the appropriate grant amount. In Pakistan, 4.5 million BISP beneficiary households receive their payments through debit cards within 72 hours of disbursement from the government. So, the elderly, parents, and people with disabilities no longer
have to wait in line for cash or worry about keeping their payments safe. The Niger pilot led to improved nutrition for children, in part because of the time savings for mothers.
Female empowerment is one major benefit of the BISP and the Niger programs. Women in BISP mostly receive the payments on behalf of their households, increasing their authority to make decisions on how the cash is spent, their mobility, and their engagement with formal institutions. The Niger mobile transfer, by reducing the observability of the amount and timing of the cash transfer, increased wom-en’s bargaining power in the household, changing house-hold agricultural activities and expenditures in ways that benefit women. To quote Amina Bibi, a BISP beneficiary, “Women are being encouraged and empowered. Because of this program people who did not let their women leave the house earlier are allowing them to do so. Women now have confidence that they, too, can do something for the betterment of their family.”
Sources: WDR 2016 team, based on http://worldbank.org/safetynets/howto; http://www.bisp.gov.pk; Oxford Policy Management 2015; Aker and others 2014.
AFG
ALB
DZA
AGO
AZE
BGD
BEN
BOL
BIHBWA
BRA
BGR
BFA
KHM
CMR
TCD
CHL
CHN
COL
COD
CRI
HRV
CZE
DOM ECU
EGY
SLV
FJI
FRAGEO
DEU
GHA GTMHND
IND
IDNITA
JOR
KAZKEN
KOR
KGZ
LBN
LBR
MKD
MWI
MYS
MLIMEX
MNG
MAR
MOZ
NAM
NPL
NZL
NIC
NER NGA
NOR
PAK
PNGPER
PHL
POL
PRT
QAT
ROURUS
RWA
STP
SEN
SRBSLE
SVK
SVN
ZAF
ESPLKA
SWE
TJK
TZA
THA
TLSTTO
TUN
TUR
UGA
UKR
GBR
USA
VEN
VNMYEM
ZMB
ZWEBudg
et tr
ansp
aren
cy (i
ndex
)
–0.4
–0.4
–0.2
–0.2
0
0
0.2
0.2
0.4
0.4
0.6
Core e-government systems
160 WORLD DEVELOPMENT REPORT 2016
routine manual processes prone to error and manip-ulation, reduces the number of government interme-diaries in a transaction, and establishes audit trails to curtail rent-seeking. Digital registration and payment systems have, for example, significantly reduced leak-ages in transport subsidies for the poor in Colombia (box 3.3). Given the importance of mobilizing and man-aging resources, almost all countries have tried to auto-mate budget preparation, execution, and accounting and some aspects of tax and customs administration. Management information systems are also exten-sively used in education, health, land management, and social protection services. In the past decade, one-stop shops or service centers that provide citizen and business services—such as registration, licensing, records, bill payments—in a single physical space or web portal have become popular, with initiatives in many countries, including Azerbaijan, Bangladesh, Brazil, Cambodia, India, Kenya, Moldova, Mozam-bique, Oman, Peru, and Uganda (box 3.4).
Given the methodological difficulties in measuring government productivity, the impact of e-government must be assessed indirectly through, for instance, changes in firms’ perceptions of tax compliance costs, the competitiveness of government procurement, and corruption in taxation and government contracting after the introduction of e-government systems in a country. These indirect measures, from regular sur-veys of firms in select European and Central Asian
cooperation and coordination. The necessary support-ive ecosystem of a vibrant private sector and civil soci-ety to use open data is also often missing.
The impact after governments open up is also unclear. In the United States and the United Kingdom, the take-up of open data has been limited to a few sec-tors where there is consumer demand, like real estate, transport, energy, and health care, so the private sector has an incentive to develop applications on the open data platform.17 In Kenya, Moldova, and the Philippines, which have opened hundreds of govern-ment datasets, the motive has been more to increase transparency than to spur business opportunities for the private sector. In locales in Kenya and the Philip-pines, fewer than 15 percent of survey respondents with internet access had heard of the Open Data Ini-tiative.18 Some media and civil society organizations use open data in their advocacy campaigns, but such initiatives generally are few and fragmented.
Streamlining processes
Automation applied to an efficient operation will mag-nify the efficiency . . . automation applied to an inefficient
operation will magnify the inefficiency.
—Bill Gates
The efficiency of some government tasks and services can be improved through automation that eliminates
Box 3.3 Targeted public transit benefits in Bogotá
Public transit is essential for 64 percent of the 8 million peo-ple living in Bogotá, Colombia. As in many major cities, hous-ing is often distant from work, especially for low-income resi-dents. But using public transit can be costly for the poor, who spend about 25 percent of their income on transportation, compared to 3.5 percent for high-income residents. To help overcome this spatial mismatch, the city built an integrated public transport system (SITP) anchored by the Transmilenio bus rapid transit and collective bus transport. To increase affordability for low-income users, the city introduced a subsidy—in 2014; it gave a 50-percent discount for 40 trips per month. Eligibility is tied to a database of beneficiaries of social programs (SISBEN), and by February 2015 it reached about 26 percent of the target population.
The subsidy is transferred on smart fare cards activated and replenished at charging stations. This technology
makes it easier and more flexible to provide targeted demand-side subsidies with lower scope for leakage and abuse. Most public transit systems, in contrast, rely on undifferentiated supply-side subsidies. Linking the transit user and SISBEN databases makes targeting effi-cient. Introduction of the smart card system has not been without startup problems. The smart cards do not work on the entire system yet. Someone traveling on different portions (“Phases”) of Transmilenio and on the collective system will need two smart cards and possibly cash as well. These parallel systems need to be integrated into the SITP. Technically, this is straightforward (for example, by using turnstiles that receive the smart cards in all the buses and stations). The challenge is to achieve consensus between the bus operators, the collection firm in charge of the smart cards, and the city’s government.
Source: Rodriguez and Monroy-Taborda, forthcoming, for the WDR 2016.
161delivering services
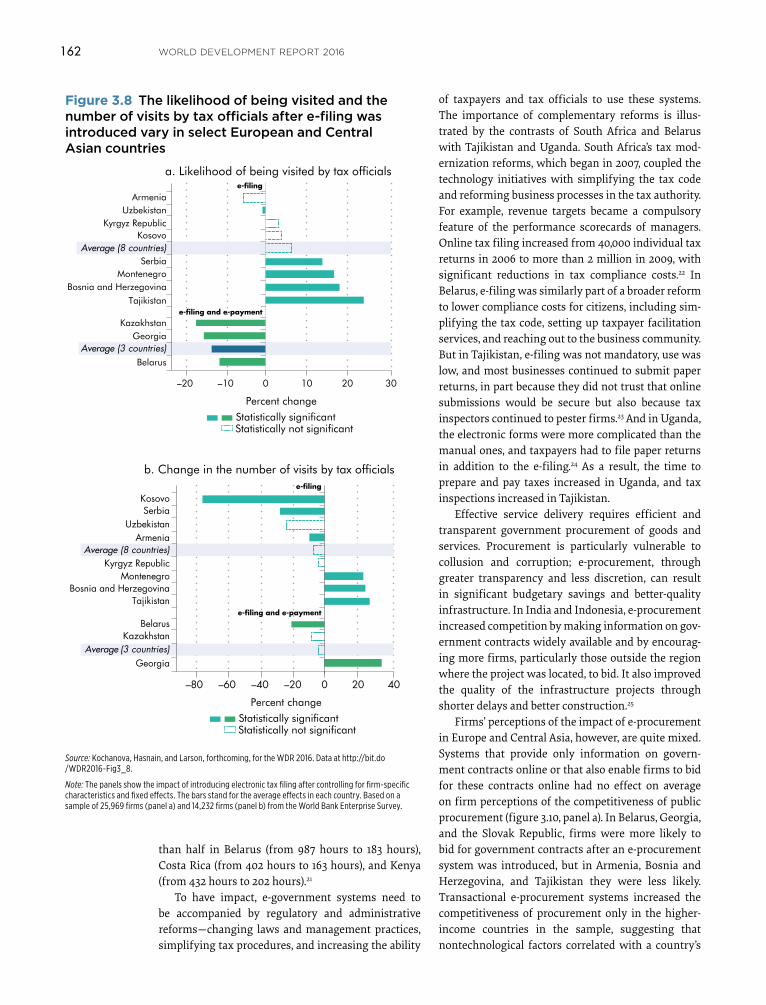
with Belarus, Kazakhstan, and Kosovo having the biggest declines in inspections, and Bosnia and Her-zegovina, Montenegro, and Tajikistan reporting an increase in inspections after the introduction of the e-government system. E-filing also lowered firms’ perceptions of paying bribes to tax officials only mar-ginally, with medium-size firms and firms that export less likely to pay bribes to tax officials after the intro-duction of e-filing.
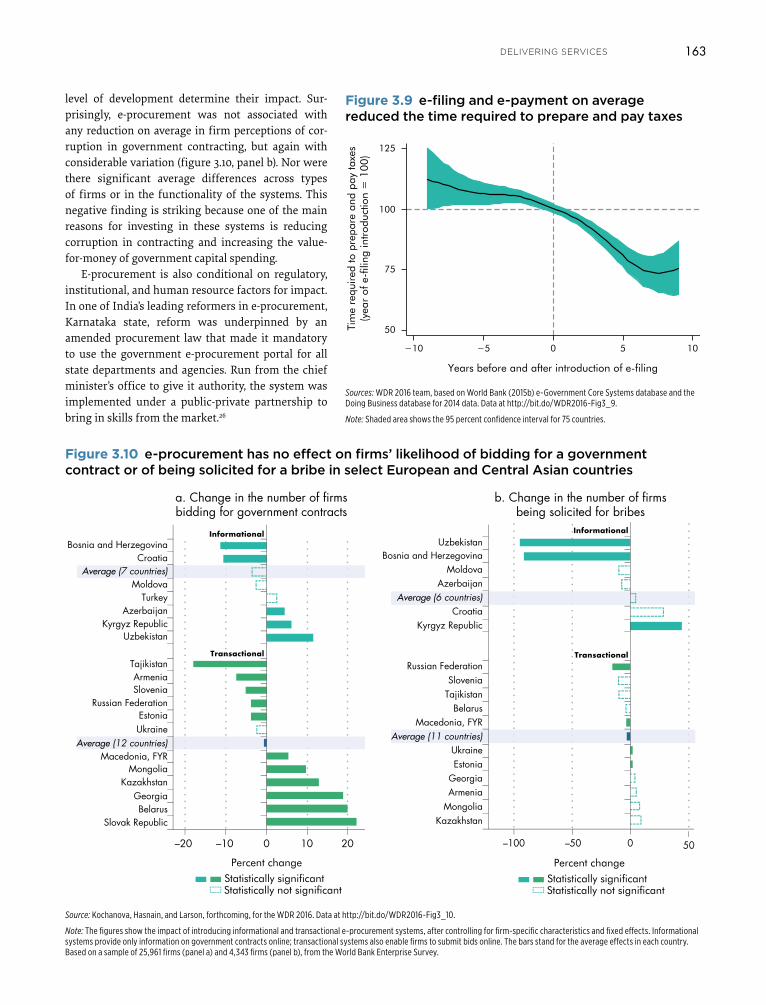
E-filing and e-payment help on average to reduce the time it takes businesses to prepare and pay taxes, as measured by the assessments of experts in the Doing Business data for 75 countries that introduced these systems between 2005 and 2014 (figure 3.9). Overall the time taken declined by roughly 25 percent in the five years after the system was introduced across the sample, with the time dropping by more
countries, show that the impact of e-government is mixed and varies considerably across countries.19
Filing of taxes electronically (e-filing) is meant to reduce the administrative burden to businesses and citizens by minimizing interactions with tax officials and reducing opportunities for rent-seeking—and by lowering the time it takes businesses to file tax returns, make payments, and receive refunds. Indeed, advanced e-filing systems in a country (e-filing of tax forms and e-payment of taxes) lowered the likelihood of being inspected by tax officials by an average 13 per-cent in select countries in Europe and Central Asia.20 But shifting only to the simpler e-filing system that did not enable online payment of taxes had no effect (figure 3.8, panel a). Nor did e-filing on average reduce the number of visits by tax officials (figure 3.8, panel b). These effects vary considerably across countries,
Box 3.4 Streamlining services through one-stop service centers
With committed political leadership, one-stop computer-ized service centers can provide citizens with access to a broad range of public services from multiple government departments at one location quickly and easily—expand-ing options, saving time, speeding delivery, and reducing opportunities for corruption.
In rural Karnataka, India, for instance, the more than 800 Nemmadi Centers operating since 2006 provide birth and death certificates, caste certificates, income certificates, ration cards, land records, and pensions, among other ser-vices. Compared with typical government offices, citizens get these services in the centers with 3.4 fewer visits, 58 fewer minutes spent in the visits, 23 days faster processing, and 50 percent less chance of being asked for a bribe.a But this experience of Karnataka is not replicated in many other states of India. One study found that the scope and impact of service centers vary considerably across states. The greater the prevalence of petty corruption, the fewer services offered, particularly services for which bribes can be extracted.
The integrated citizen assistance units (unidades de atendimento integrado, or UAI) in Minas Gerais, Brazil, provide another model. With 30 shops and 1,800 employ-ees, the UAI offer access to services from 15 government agencies. In 2012, they handled more than 6.2 million citi-zen transactions, up sevenfold in three years. Employment
and ID services are most popular, with the majority of users from lower-income groups.
The UAI were designed to overcome institutional con-straints that plagued the state’s prior attempt at service integration. The earlier generation of service centers was staffed by low-performing civil servants seconded by par-ticipating agencies and lacked standard operating proce-dures. Long wait times could be abused by citizens willing to pay to advance in the queue.
The new system strengthened oversight from the Secretariat for Planning and Management, which reports directly to the governor. It introduced a first-come, first-served ticketing system. And citizen complaints submitted online must be resolved within two days. Coordinators at the UAI “situation room” monitor the average wait time, the number of citizens served, and the number of atten-dants on duty at each service center to reallocate resources to manage demand in real time. A private contractor staffs the service centers, thus bypassing restrictions for civil servants and allowing the centers to offer extended hours to citizens. Each participating agency provides an on-site supervisor to oversee its programs. Conflicts occasionally arise between UAI coordinators and the agency-employed supervisors. As one government official noted, “When you tell a police officer he is no longer the authority in that place, it doesn’t go down very well.”b
Sources: Bussell 2012; Majeed 2014.
a. Bussell 2012.b. Majeed 2014.
162 WORLD DEVELOPMENT REPORT 2016
of taxpayers and tax officials to use these systems. The importance of complementary reforms is illus-trated by the contrasts of South Africa and Belarus with Tajikistan and Uganda. South Africa’s tax mod-ernization reforms, which began in 2007, coupled the technology initiatives with simplifying the tax code and reforming business processes in the tax authority. For example, revenue targets became a compulsory feature of the performance scorecards of managers. Online tax filing increased from 40,000 individual tax returns in 2006 to more than 2 million in 2009, with significant reductions in tax compliance costs.22 In Belarus, e-filing was similarly part of a broader reform to lower compliance costs for citizens, including sim-plifying the tax code, setting up taxpayer facilitation services, and reaching out to the business community. But in Tajikistan, e-filing was not mandatory, use was low, and most businesses continued to submit paper returns, in part because they did not trust that online submissions would be secure but also because tax inspectors continued to pester firms.23 And in Uganda, the electronic forms were more complicated than the manual ones, and taxpayers had to file paper returns in addition to the e-filing.24 As a result, the time to prepare and pay taxes increased in Uganda, and tax inspections increased in Tajikistan.
Effective service delivery requires efficient and transparent government procurement of goods and services. Procurement is particularly vulnerable to collusion and corruption; e-procurement, through greater transparency and less discretion, can result in significant budgetary savings and better-quality infrastructure. In India and Indonesia, e-procurement increased competition by making information on gov-ernment contracts widely available and by encourag-ing more firms, particularly those outside the region where the project was located, to bid. It also improved the quality of the infrastructure projects through shorter delays and better construction.25
Firms’ perceptions of the impact of e-procurement in Europe and Central Asia, however, are quite mixed. Systems that provide only information on govern-ment contracts online or that also enable firms to bid for these contracts online had no effect on average on firm perceptions of the competitiveness of public procurement (figure 3.10, panel a). In Belarus, Georgia, and the Slovak Republic, firms were more likely to bid for government contracts after an e-procurement system was introduced, but in Armenia, Bosnia and Herzegovina, and Tajikistan they were less likely. Transactional e-procurement systems increased the competitiveness of procurement only in the higher- income countries in the sample, suggesting that nontechnological factors correlated with a country’s
than half in Belarus (from 987 hours to 183 hours), Costa Rica (from 402 hours to 163 hours), and Kenya (from 432 hours to 202 hours).21
To have impact, e-government systems need to be accompanied by regulatory and administrative reforms—changing laws and management practices, simplifying tax procedures, and increasing the ability
e-filing
e-filing and e-payment
–20 –10 0 10 20 30
Percent change
BelarusAverage (3 countries)
GeorgiaKazakhstan
TajikistanBosnia and Herzegovina
MontenegroSerbia
Average (8 countries)Kosovo
Kyrgyz RepublicUzbekistan
Armenia
a. Likelihood of being visited by tax officials
Statistically not significantStatistically significant
e-filing
e-filing and e-payment
–80 –60 –40 –20 0 20 40
GeorgiaAverage (3 countries)
KazakhstanBelarus
TajikistanBosnia and Herzegovina
MontenegroKyrgyz Republic
Average (8 countries)Armenia
UzbekistanSerbia
Kosovo
Percent change
b. Change in the number of visits by tax officials
Statistically not significantStatistically significant
Source: Kochanova, Hasnain, and Larson, forthcoming, for the WDR 2016. Data at http://bit.do /WDR2016-Fig3_8.
Note: The panels show the impact of introducing electronic tax filing after controlling for firm-specific characteristics and fixed effects. The bars stand for the average effects in each country. Based on a sample of 25,969 firms (panel a) and 14,232 firms (panel b) from the World Bank Enterprise Survey.
Figure 3.8 The likelihood of being visited and the number of visits by tax officials after e-filing was introduced vary in select European and Central Asian countries
163delivering services
level of development determine their impact. Sur-prisingly, e-procurement was not associated with any reduction on average in firm perceptions of cor-ruption in government contracting, but again with considerable variation (figure 3.10, panel b). Nor were there significant average differences across types of firms or in the functionality of the systems. This negative finding is striking because one of the main reasons for investing in these systems is reducing corruption in contracting and increasing the value-for-money of government capital spending.
E-procurement is also conditional on regulatory, institutional, and human resource factors for impact. In one of India’s leading reformers in e-procurement, Karnataka state, reform was underpinned by an amended procurement law that made it mandatory to use the government e-procurement portal for all state departments and agencies. Run from the chief minister’s office to give it authority, the system was implemented under a public-private partnership to bring in skills from the market.26
Figure 3.9 e-filing and e-payment on average reduced the time required to prepare and pay taxes
Sources: WDR 2016 team, based on World Bank (2015b) e-Government Core Systems database and the Doing Business database for 2014 data. Data at http://bit.do/WDR2016-Fig3_9.
Note: Shaded area shows the 95 percent confidence interval for 75 countries.
50
75
100
125
Tim
e re
quire
d to
pre
pare
and
pay
taxe
s(y
ear
of e
-fili
ng in
trod
uctio
n =
100
)−10 −5 0 5 10
Years before and after introduction of e-filing
Informational
Transactional
–20 –10 0 10 20
BelarusSlovak Republic
GeorgiaKazakhstan
Tajikistan
Bosnia and Herzegovina
a. Change in the number of firmsbidding for government contracts
b. Change in the number of firmsbeing solicited for bribes
CroatiaAverage (7 countries)
Average (12 countries)
Kyrgyz RepublicUzbekistan
ArmeniaSlovenia
Russian FederationEstoniaUkraine
Macedonia, FYRMongolia
MoldovaTurkey
Azerbaijan
Percent change Percent change
Kyrgyz Republic
Belarus
Armenia
Russian Federation
Informational
Transactional
Tajikistan
–100 –50 0 50
Georgia
Kazakhstan
Bosnia and Herzegovina
CroatiaAverage (6 countries)
Average (11 countries)
Uzbekistan
Slovenia
EstoniaUkraine
Macedonia, FYR
Mongolia
MoldovaAzerbaijan
Statistically not significantStatistically significant
Statistically not significantStatistically significant
Figure 3.10 e-procurement has no effect on firms’ likelihood of bidding for a government contract or of being solicited for a bribe in select European and Central Asian countries
Source: Kochanova, Hasnain, and Larson, forthcoming, for the WDR 2016. Data at http://bit.do/WDR2016-Fig3_10.
Note: The figures show the impact of introducing informational and transactional e-procurement systems, after controlling for firm-specific characteristics and fixed effects. Informational systems provide only information on government contracts online; transactional systems also enable firms to submit bids online. The bars stand for the average effects in each country. Based on a sample of 25,961 firms (panel a) and 4,343 firms (panel b), from the World Bank Enterprise Survey.
164 WORLD DEVELOPMENT REPORT 2016
provide feedback, and the service provider must have the incentive and capacity to respond and resolve the complaint. Citizens are more likely to complain if they use the service frequently, if it is a private good (so there are no problems of free-riding), and if it is easy to identify the service failure. Governments are more likely to respond if the information provided by citi-zens on the service failure is specific and actionable, if it is clear who in government needs to resolve the complaint, and if the complaint also integrates with document management systems within the agency so that both the complaint and the response can be prioritized and tracked. Government responsiveness can further incentivize citizens to complain, creating a virtuous circle of feedback and responsiveness. For example, users of FixMyStreet—the platform in the United Kingdom that citizens use to report local road problems, which are then routed to the relevant local authorities—are 54 percent more likely to submit a second report if their first complaint was resolved.28
Household water supply and electricity are exam-ples of private goods that citizens use daily and have an incentive to monitor. The responsibility for deliver-ing these services lies clearly with a particular utility, and it is easy for citizens to know when the service is failing. MajiVoice is a complaint mechanism in the water and sewerage company in Nairobi, and there is a similar one in use in EDE Este, the electricity supply company for the eastern Dominican Republic. Given the limited internet use in the country, consumers initiate complaints mostly in person at the service desk in the utility or through phone calls, generating a ticket number as a tracking tool for both the customer and the utility. The customer receives an SMS message from the utility when the complaint is entered and another when the complaint is resolved. This tracking is possible because each complaint is registered on a dashboard that enables management to categorize the complaint, delegate the issue to a specific staff member on duty, and track resolution. The dashboard enables the utility regulator to track performance, and customers of EDE Este are also randomly contacted after the complaint is resolved to gauge their satisfac-tion with the service.
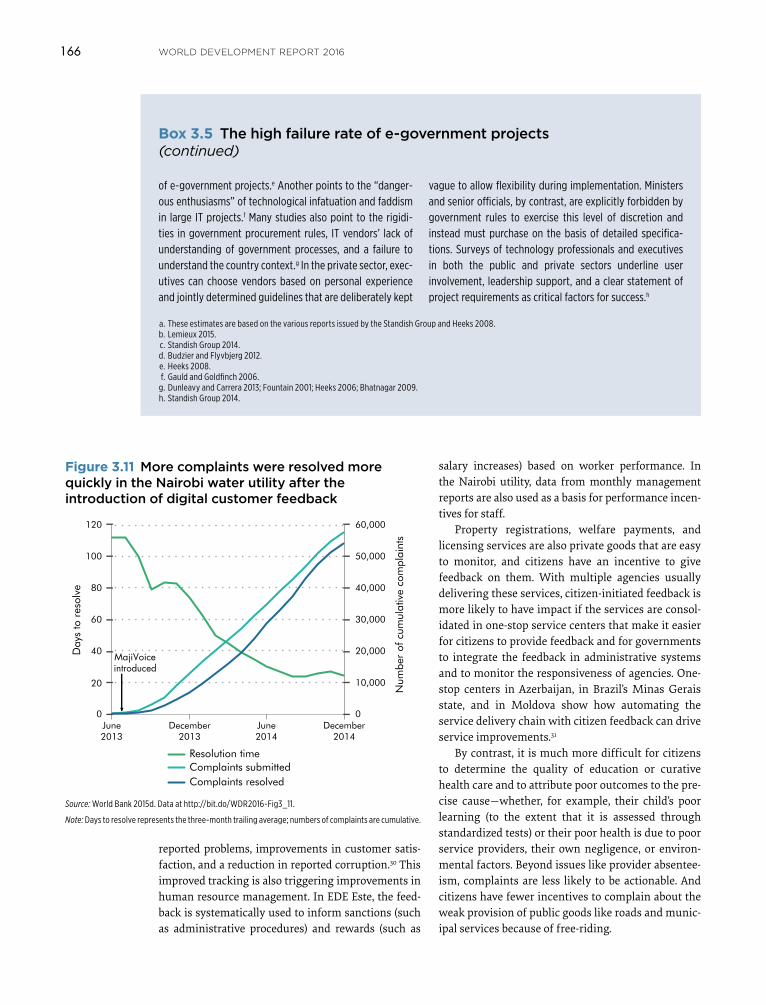
Initial results are impressive. Before MajiVoice was initiated, the Nairobi water company received on average 400 complaints a month. Since 2013, when MajiVoice was launched, the utility has been getting about 3,000 complaints a month, resolution rates climbed from 46 percent to 94 percent, and time to resolution dropped by 90 percent (figure 3.11).29 Since its implementation in 2011, the feedback channel in EDE Este has also recorded rising resolution rates for
The varied impact of e-filing, e-procurement, and one-stop centers reveals a broader, sobering trend: Many government digital technology projects are unsuccessful. They are either abandoned before completion or underused, wasting substantial public funds (box 3.5). A widely accepted explanation for this poor record is the big gap between the techno-logical capability and the institutional capacity of the government, as measured by processes, objectives, values, staffing numbers, skills, and management systems and structures.27
Receiving user feedbackOne potential catalyst for service improvements is user feedback on service quality. More than a decade ago, the private sector discovered customer relation-ship management—the use of digital technologies to integrate all aspects of a firm’s interaction with a customer to improve personalized communication and provide real-time information so that customers can track the status of their service requests. Gov-ernments have only recently discovered this man-agement approach, with most innovation in cities in the developed countries. Mobile phone apps like SeeClickFix and FixMyStreet, active in many munici-palities in the United States and the United Kingdom, and internet call centers allow users to report service issues and enable governments to report back to citizens on fix requests through integrated back-end systems. They are now standard in Barcelona, Boston, Chicago, London, New York, Seoul, and Singapore.
Developing countries are following suit. Given the considerable inefficiencies in public sector delivery systems, the gains from embedding digitally enabled citizen feedback in management are potentially greater than in developed countries. These feedback channels come in many varieties. They can be for a limited set of services tied to particular agencies or for multiple services and issues, usually housed in a center-of-government entity, either local or national. They can be complaint portals that invite citizens to report service issues, or government-initiated (“proactive”) feedback mechanisms through which government officials contact citizens to inquire about their service experience. Complaint portals and call centers for citizen feedback are spreading rapidly across developing countries, particularly in cities—Buenos Aires, Muscat, Rio de Janeiro, and Ulaanbaa-tar, to name a few. Proactive feedback mechanisms are more recent and thus limited in number—those in Albania and Pakistan are examples.
Two conditions are required for user feedback to have impact: Citizens must have an incentive to
165delivering services
Box 3.5 The high failure rate of e-government projects
Despite spending more than $600 billion on IT over the past decade, the federal government has achieved little of the productivity improvements that private industry has realized from IT. Too often, federal IT projects
run over budget, run behind schedule, or fail to deliver promised functionality.
—U.S. Office of Management and Budget 2010
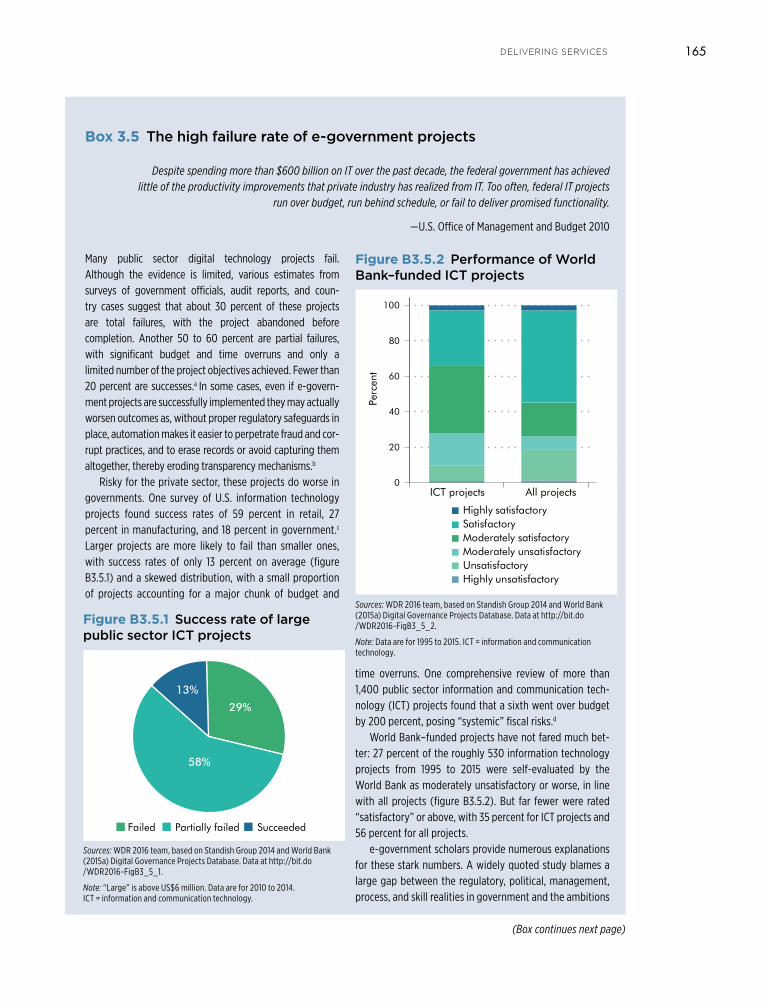
Many public sector digital technology projects fail. Although the evidence is limited, various estimates from surveys of government officials, audit reports, and coun-try cases suggest that about 30 percent of these projects are total failures, with the project abandoned before completion. Another 50 to 60 percent are partial failures, with significant budget and time overruns and only a limited number of the project objectives achieved. Fewer than 20 percent are successes.a In some cases, even if e-govern-ment projects are successfully implemented they may actually worsen outcomes as, without proper regulatory safeguards in place, automation makes it easier to perpetrate fraud and cor-rupt practices, and to erase records or avoid capturing them altogether, thereby eroding transparency mechanisms.b
Risky for the private sector, these projects do worse in governments. One survey of U.S. information technology projects found success rates of 59 percent in retail, 27 percent in manufacturing, and 18 percent in government.c Larger projects are more likely to fail than smaller ones, with success rates of only 13 percent on average (figure B3.5.1) and a skewed distribution, with a small proportion of projects accounting for a major chunk of budget and
time overruns. One comprehensive review of more than 1,400 public sector information and communication tech-nology (ICT) projects found that a sixth went over budget by 200 percent, posing “systemic” fiscal risks.d
World Bank–funded projects have not fared much bet-ter: 27 percent of the roughly 530 information technology projects from 1995 to 2015 were self-evaluated by the World Bank as moderately unsatisfactory or worse, in line with all projects (figure B3.5.2). But far fewer were rated “satisfactory” or above, with 35 percent for ICT projects and 56 percent for all projects.
e-government scholars provide numerous explanations for these stark numbers. A widely quoted study blames a large gap between the regulatory, political, management, process, and skill realities in government and the ambitions
Figure B3.5.2 Performance of World Bank–funded ICT projects
Sources: WDR 2016 team, based on Standish Group 2014 and World Bank (2015a) Digital Governance Projects Database. Data at http://bit.do /WDR2016-FigB3_5_2.
Note: Data are for 1995 to 2015. ICT = information and communication technology.
Figure B3.5.1 Success rate of large public sector ICT projects
Sources: WDR 2016 team, based on Standish Group 2014 and World Bank (2015a) Digital Governance Projects Database. Data at http://bit.do /WDR2016-FigB3_5_1.
Note: “Large” is above US$6 million. Data are for 2010 to 2014. ICT = information and communication technology.
13%
58%
29%
Partially failedFailed Succeeded
0All projectsICT projects
Perc
ent
20
40
60
80
100
Highly satisfactorySatisfactoryModerately satisfactoryModerately unsatisfactoryUnsatisfactoryHighly unsatisfactory
(Box continues next page)
166 WORLD DEVELOPMENT REPORT 2016
salary increases) based on worker performance. In the Nairobi utility, data from monthly management reports are also used as a basis for performance incen-tives for staff.
Property registrations, welfare payments, and licensing services are also private goods that are easy to monitor, and citizens have an incentive to give feedback on them. With multiple agencies usually delivering these services, citizen-initiated feedback is more likely to have impact if the services are consol-idated in one-stop service centers that make it easier for citizens to provide feedback and for governments to integrate the feedback in administrative systems and to monitor the responsiveness of agencies. One-stop centers in Azerbaijan, in Brazil’s Minas Gerais state, and in Moldova show how automating the service delivery chain with citizen feedback can drive service improvements.31
By contrast, it is much more difficult for citizens to determine the quality of education or curative health care and to attribute poor outcomes to the pre-cise cause—whether, for example, their child’s poor learning (to the extent that it is assessed through standardized tests) or their poor health is due to poor service providers, their own negligence, or environ-mental factors. Beyond issues like provider absentee-ism, complaints are less likely to be actionable. And citizens have fewer incentives to complain about the weak provision of public goods like roads and munic-ipal services because of free-riding.
reported problems, improvements in customer satis-faction, and a reduction in reported corruption.30 This improved tracking is also triggering improvements in human resource management. In EDE Este, the feed-back is systematically used to inform sanctions (such as administrative procedures) and rewards (such as
of e-government projects.e Another points to the “danger-ous enthusiasms” of technological infatuation and faddism in large IT projects.f Many studies also point to the rigidi-ties in government procurement rules, IT vendors’ lack of understanding of government processes, and a failure to understand the country context.g In the private sector, exec-utives can choose vendors based on personal experience and jointly determined guidelines that are deliberately kept
vague to allow flexibility during implementation. Ministers and senior officials, by contrast, are explicitly forbidden by government rules to exercise this level of discretion and instead must purchase on the basis of detailed specifica-tions. Surveys of technology professionals and executives in both the public and private sectors underline user involvement, leadership support, and a clear statement of project requirements as critical factors for success.h
Box 3.5 The high failure rate of e-government projects (continued)
a. These estimates are based on the various reports issued by the Standish Group and Heeks 2008. b. Lemieux 2015. c. Standish Group 2014. d. Budzier and Flyvbjerg 2012. e. Heeks 2008. f. Gauld and Goldfinch 2006. g. Dunleavy and Carrera 2013; Fountain 2001; Heeks 2006; Bhatnagar 2009. h. Standish Group 2014.
Source: World Bank 2015d. Data at http://bit.do/WDR2016-Fig3_11.
Note: Days to resolve represents the three-month trailing average; numbers of complaints are cumulative.
Figure 3.11 More complaints were resolved more quickly in the Nairobi water utility after the introduction of digital customer feedback
0
10,000
20,000
30,000
40,000
50,000
60,000
0
20
40
60
80
100
120
June2013
December2013
June2014
December2014
Num
ber
of c
umul
ativ
e co
mpl
aint
s
Day
s to
res
olve
Resolution timeComplaints submittedComplaints resolved
MajiVoiceintroduced

167delivering services
on acquiring actionable information. In Pakistan, under the Punjab Citizen Feedback Model, service providers record citizens’ mobile numbers. A gov-ernment call center sends SMS messages and voice calls to public service users to make targeted inqui-ries about satisfaction with 16 services, ranging from property registration to primary health care and potential incidents of corruption. The data are logged and tracked on dashboards.35 This system has been deployed at a very large scale, with more than 7 mil-lion citizens contacted since 2012—250,000 a month on average—and about 1 million having provided feedback from across the province.36 But the impact of the feedback on service delivery is unclear. Many offi-cials have tried to subvert the initiative, as reflected in the high and steady proportion of invalid phone numbers recorded by service providers—40 percent for citizens registering property, a service particularly prone to petty corruption. The government has taken more than 6,000 administrative actions against offi-cials based on the feedback. But given the protections afforded staff under civil service rules, the actions have been mostly warnings and formal apologies from the concerned official to the citizen, and only a handful have been suspensions or dismissals.
Governments in high-income countries are moving beyond user feedback to engage citizens in collaborative policy making. The northern European countries are on the vanguard in these moves to more direct democracy, as exemplified by Iceland’s crowd-sourced constitution, Estonia’s e-legislation portal,
These problems are evident in general citizen feedback portals recently introduced in Botswana, Indonesia, and the Philippines. The government of Indonesia’s complaint-handling system (LAPOR) allows citizens to submit reports on many issues, ranging from delays in welfare payments to damaged roads. It has received about 800 complaints a day on average from all over Indonesia since the portal’s launch in 2012. Of these complaints, only 10 percent are specific and actionable (figure 3.12, panel a) and are forwarded to the relevant agency for resolution. Of these actionable complaints, 28 percent and 18 per-cent, respectively, are for private benefits like welfare payments or fuel subsidies; less than 5 percent are for public goods like roads and public works (figure 3.12, panel b).32 The complaint portals of the governments of Botswana and the Philippines have similarly pro-vided limited actionable information to the govern-ment, particularly on public goods.33
Citizen feedback portals are also likely to be dispro-portionately used by better-off, more educated, and more digitally savvy individuals, potentially biasing government responses. For example, most users of FixMyStreet in the United Kingdom are male, older, more educated, and less likely to be from an ethnic minority than the general population.34 Similarly, the users of LAPOR are disproportionately from Jakarta, the largest city and the capital, than from the poorer and more remote regions in eastern Indonesia.
Government-initiated feedback can overcome these biases in citizen reporting and be more focused
Source: WDR 2016 team, based on 2015 LAPOR data. Data at http://bit.do/WDR2016-Fig3_12.
Figure 3.12 Citizens using Indonesia’s national feedback portal (LAPOR) have few actionable complaints, and these are mostly for private goods, 2015
Other
Social welfare
Fuel subsidies
Education
Transportation
Public works
Roads
Actionable
0 5 10 15
Percent
a. Percentage of actionable complaints b. Distribution of actionable complaints by service
20 25 30 35
Not actionable90%
10%
168 WORLD DEVELOPMENT REPORT 2016
absenteeism among government providers, who are difficult to dismiss and discipline.40 Technology must be accompanied by good management. In India, the monitoring of health workers did improve attendance, but many local governments did not use the data to sanction absent workers because of cumbersome civil service rules or for political reasons. In Uganda, absenteeism was reduced only by combining teacher incentive pay with monitoring technology. In Paki-stan, smartphone-based monitoring of district health supervisors in rural clinics doubled inspections of health facilities and reduced medical worker absen-teeism, but the results were highly contingent on the severity of patronage politics in a locality. In Haiti, the experiment failed because government teachers had not been paid for months and resented the additional unfairness imposed on them by digital monitoring. In Niger, by contrast, the experiment was conducted with contract teachers hired by a nongovernmental organization, and mobile phone–based monitoring by itself was sufficient to improve teacher effort and motivation as well as student learning outcomes.
Reducing absenteeism, while necessary, is not suf-ficient to ensure that doctors, teachers, and managers, once they show up to work, actually are motivated to perform well and to serve the public. Recent innova-tions in the private sector have extended these teacher monitoring technologies to the actual practice of teaching, through standard lesson plans and system-atic monitoring of teacher activities by management. The initial results are promising, again conditional on the strong relationships of accountability that can exist in private schools (box 3.6). But applying these lessons to a government bureaucracy will be chal-lenging. The typical developing country government bureaucracy is unable to recruit the best and brightest workers because of low pay and excessive influence by politicians. It promotes staff on the basis of senior-ity and not performance—in part because measuring performance is difficult and seniority is the only cred-ible standard—and is unable to motivate workers to work hard and serve the public. For many providers, the reason for joining the public sector is job security, not promoting student learning or public health.
These weaknesses are evident from perception surveys of government workers in Indonesia and the Philippines. Many staff believe that the best univer-sity graduates prefer working in the private sector, that their coworkers are often not productive, that promotions are based on politics rather than merit, and that their coworkers in other government agen-cies cannot be trusted (figure 3.13). Anecdotal evidence
and Reykjavik’s digital participatory budgeting.37 But even in these digitally and socioeconomically advanced countries, e-participatory policy making has engaged only a small, nonrepresentative subset of the population, has elicited limited government responsiveness, and is difficult to sustain. In Estonia, a global leader in e-services and e-voting, with high citizen use across all socioeconomic groups, only 8 percent of people polled had heard of http://www .osale.ee, the government’s e-legislation and policy making portal.
Improving service provider management
Technology can improve systems that are already working . . . but it doesn’t fix
systems that are broken. There is no knowledge management without management.
—Kentaro Toyama, University of Michigan School of Information
User feedback is effective when providers and man-agers have the incentive and the ability to respond to citizens, which depends on strong relationships of accountability between policy makers and providers. By better monitoring of workers and facilities and through better organization and performance man-agement in bureaucracies, digital technologies can strengthen accountability within the government by reducing information asymmetries between policy makers and service providers.
The absenteeism of teachers, doctors, nurses, and agricultural extension workers is pervasive in Africa and South Asia.38 Estimates suggest that in India roughly one-quarter of government teachers and over one-third of government doctors in primary health centers are absent without a legitimate reason on any given day, with similarly alarming numbers in several African countries.39 Physical monitoring of providers is costly, particularly in rural areas, and the monitors are just as likely to shirk as the providers or to collude with providers. Using mobile phones to record atten-dance—either with the photographs or thumbprints of the providers as evidence—and transmit data to a central database to generate monitoring reports can be a cost-effective solution to this seemingly intrac-table problem.
Evidence from impact evaluations in Haiti, India, Niger, Pakistan, and Uganda shows that digital mon-itoring can reduce absenteeism in general, but that technology on its own is not sufficient for curbing
169delivering services
ers reported that they had never had a meeting with the head teacher to discuss their performance, and two-thirds of the head teachers had themselves been absent from school at least once in the last five days.42
The low productivity of some government bureau-cracies reflects fundamental structural constraints that cannot easily be substituted for by technology. Where digital technologies can help is in monitoring goals and performance targets for organizational units and workers. For the private sector, firms that adopt
suggests that these problems are even more severe in low-income countries. Studies of teacher and health worker management in South Asia and Africa reveal a fundamentally broken system, with pervasive prob-lems of politicization, weak school management, low provider motivation, and shirking.41 A recent survey of public schools in Tanzania revealed that 67 percent of the teachers who were present in the school did not show up in classrooms to teach. Nor did school princi-pals hold them accountable: Three-quarters of teach-
Box 3.6 Digitally enabled teacher management in private schools
Private schools targeted to the world’s poorest have become a new model for education in developing countries with low-quality public education. Bridge International Academies (BIA) is an innovative for-profit private model operating in underserved communities in Kenya and Uganda that leverages standardization and technology to educate more than 118,000 children.
The BIA business and educational model is driven by a standardized set of curricular and managerial materials to keep classes consistent, students on task, and schools running smoothly. The core of these materials is an internet-enabled tablet computer, which downloads more than 3,400 lesson plans and teacher scripts at the beginning of each term. These plans include step-by-step instructions on how to prepare and present each lesson, homework assignments, and tests. BIA management tracks class-room progress—such as the speed of lessons and teacher attendance—with the tablet through automatic syncing. If a teacher falls behind in lessons, BIA managers in Nairobi and BIA’s U.S. headquarters know immediately and can follow up with the teacher hundreds or thousands of miles away. In addition to teacher monitoring, student progress is tracked by teacher-inputted student test scores and progress measures. This automation gives BIA headquarters instant access to school data and helps BIA manage their academies.
In addition to classroom management, standardization and technology are leveraged to improve school adminis-tration. Each “academy manager”—akin to a head teacher or principal—receives a smartphone to use for communi-cation and monitoring, and as a modem for the tablets. Academy managers follow standardized instructions on managing finances, personnel, and student and parent relationships, as well as on how to use a central payroll
system, expense-processing system, standardized assess-ments, and evaluation tools. Even paying school fees is standardized and technology-enabled; tuition payments are made electronically with M-Pesa or through Equity Bank Kenya. The standardized instruction, school man-agement, and assessment ensure that each student in a Bridge Academy receives the same education, regardless of location or instructor.
Initial evaluations show that this educational style may be effective. In 2013, a self-evaluation found that BIA students scored 0.32 standard deviations higher than peer students in public schools in reading fluency and comprehension, translating into an additional 16 words per minute and 252 additional learning days. In math skills, BIA students scored 0.51 standard deviations higher, equivalent to an additional 288 learning days. These findings need to be viewed cautiously, however, as the differences in out-comes may be entirely explained by differences in students between BIA and public schools.
This type of private education is not unequivocally embraced. The scripted lesson plans are particularly con-troversial, with questions about the effectiveness of a script to create a dynamic learning environment for children to develop higher-order thinking skills. In addition, Bridge Academies rely on large class sizes and teachers with only a secondary education to keep costs low. Low-cost private education is also criticized because of the potential to undermine public education systems. Countries that rely on private education may not invest as heavily in their public systems, and private schools often attract the best students, further diminishing the public education system. Even so, in contexts where public schools are failing, a stan-dardized private sector model may be a viable option for improving learning outcomes.
Sources: WDR 2016 team, based on Bridge Academies 2013; Heyneman and Stern 2014; Rangan and Lee 2010; Ross 2014.

170 WORLD DEVELOPMENT REPORT 2016
ment and level of trust in an organization—which can take years to build. There is little evidence, even in the OECD (Organisation for Economic Co-operation and Development) countries, that digital technologies have made any fundamental differences in the way government bureaucracies are managed, particularly for the better integration of policy making and service delivery across government. Even in New Zealand, known for its highly competent and innovative public administration, two-thirds of public officials surveyed were skeptical that digital technologies would induce greater collaboration and integration across govern-ment departments because the notion of a “joined-up government” conflicted with the annual agency-based budget appropriation process.45
In sum, these digitally enabled management improvements are isolated examples. Either they are pilots and experiments limited to a subset of activities, such as addressing absenteeism, that form the basic minimum required to improve teaching or health care, or they are limited to a few locales, sectors, or agencies and not taken to scale in the government as a whole. Developing country government bureaucracies now have a digital veneer over a largely unchanged struc-ture, culture, and performance orientation.
more structured performance management practices are more profitable, and digital technologies com-plement performance monitoring and performance incentives.43 Goal-setting and performance incentives are difficult—but not impossible—in government bureaucracies. The multiple demands on a public orga-nization, and the multiple interests it needs to serve, make it difficult to define goals, and performance incentives can trigger a host of perverse incentives. The key variable is the extent to which the tasks and outputs of agencies can be routinized and monitored.44
As MajiVoice and the EDE Este feedback systems show, eliciting citizen feedback on service quality, tracking complaint resolution, producing audit trails of worker effort, and offering performance incentives for staff can be a powerful combination for trans-forming government bureaucracies. This combina-tion is also being used in one-stop service centers in many countries.
Digitally enabled performance monitoring is much more difficult for services that are highly discretion-ary and hard to monitor, such as teaching and curative health care, and for policy and regulatory functions. Assessing performance is necessarily more subjective and therefore conditional on the quality of manage-
Sources: World Bank surveys of government officials, 2011 and 2013. Data at http://bit.do/WDR2016-Fig3_13.
Note: The survey in Indonesia was conducted in 2011 and covered about 3,000 government officials; the survey in the Philippines was done in 2013 and covered 2,500 officials.
Figure 3.13 Government officials in Indonesia and the Philippines have generally low opinions of human resource management practices
Your ministry easily recruitshigh-quality staff
a. Indonesia b. Philippines
Your coworkers are notproductive at work
Promotions are basedon merit
Underperformers areroutinely disciplined
Most people in otherdepartments can be trusted
The best and brightest jointhe private sector
You recommend jobs in yourdepartment to friends and family
Your coworkers arenot productive at work
Promotions are based onpolitics rather than merit
Underperformers areroutinely disciplined
Most people in otherdepartments can be trusted
Disagree or strongly disagree Neither Agree or strongly agree
0 25 50 75 100 0 25 50 75 100
Percent of respondentsPercent of respondents
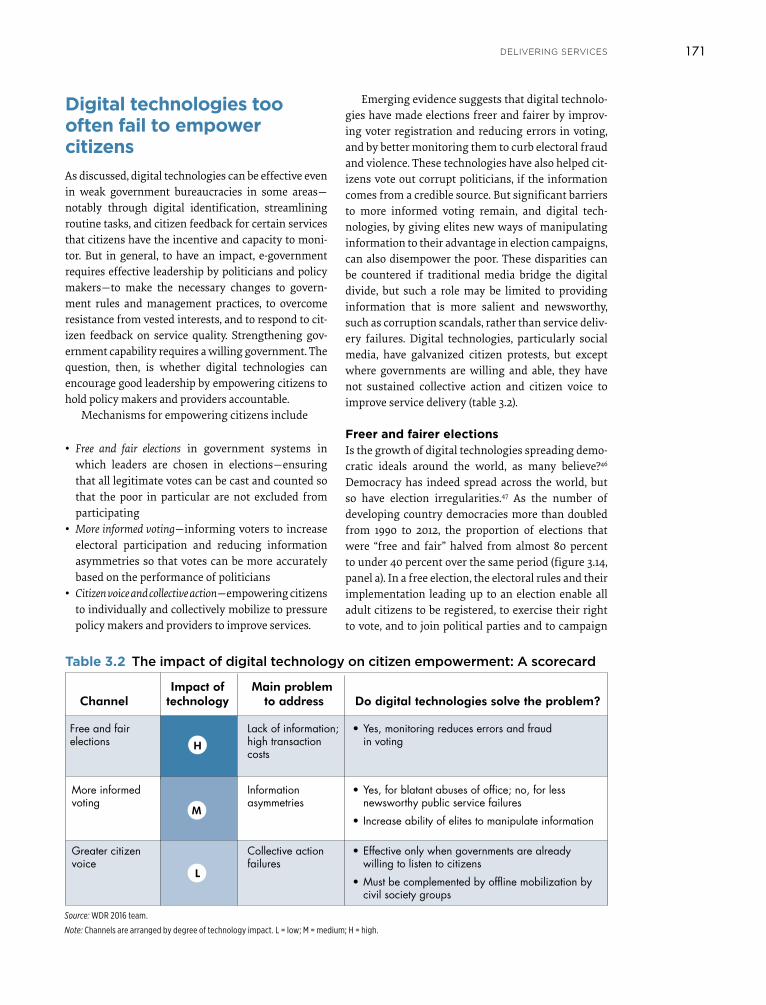
171delivering services
Emerging evidence suggests that digital technolo-gies have made elections freer and fairer by improv-ing voter registration and reducing errors in voting, and by better monitoring them to curb electoral fraud and violence. These technologies have also helped cit-izens vote out corrupt politicians, if the information comes from a credible source. But significant barriers to more informed voting remain, and digital tech-nologies, by giving elites new ways of manipulating information to their advantage in election campaigns, can also disempower the poor. These disparities can be countered if traditional media bridge the digital divide, but such a role may be limited to providing information that is more salient and newsworthy, such as corruption scandals, rather than service deliv-ery failures. Digital technologies, particularly social media, have galvanized citizen protests, but except where governments are willing and able, they have not sustained collective action and citizen voice to improve service delivery (table 3.2).
Freer and fairer electionsIs the growth of digital technologies spreading demo-cratic ideals around the world, as many believe?46 Democracy has indeed spread across the world, but so have election irregularities.47 As the number of developing country democracies more than doubled from 1990 to 2012, the proportion of elections that were “free and fair” halved from almost 80 percent to under 40 percent over the same period (figure 3.14, panel a). In a free election, the electoral rules and their implementation leading up to an election enable all adult citizens to be registered, to exercise their right to vote, and to join political parties and to campaign
Digital technologies too often fail to empower citizensAs discussed, digital technologies can be effective even in weak government bureaucracies in some areas—notably through digital identification, streamlining routine tasks, and citizen feedback for certain services that citizens have the incentive and capacity to moni-tor. But in general, to have an impact, e-government requires effective leadership by politicians and policy makers—to make the necessary changes to govern-ment rules and management practices, to overcome resistance from vested interests, and to respond to cit-izen feedback on service quality. Strengthening gov-ernment capability requires a willing government. The question, then, is whether digital technologies can encourage good leadership by empowering citizens to hold policy makers and providers accountable.
Mechanisms for empowering citizens include
• Free and fair elections in government systems in which leaders are chosen in elections—ensuring that all legitimate votes can be cast and counted so that the poor in particular are not excluded from participating
• More informed voting—informing voters to increase electoral participation and reducing information asymmetries so that votes can be more accurately based on the performance of politicians
• Citizen voice and collective action—empowering citizens to individually and collectively mobilize to pressure policy makers and providers to improve services.
H
L
Do digital technologies solve the problem?Main problem
to addressImpact of
technologyChannel
M
Free and fair elections
Lack of information;high transaction costs
• Yes, monitoring reduces errors and fraud in voting
• Yes, for blatant abuses of office; no, for less newsworthy public service failures
• Increase ability of elites to manipulate information
• Effective only when governments are already willing to listen to citizens
• Must be complemented by offline mobilization by civil society groups
Informationasymmetries
Collective actionfailures
More informedvoting
Greater citizenvoice
Table 3.2 The impact of digital technology on citizen empowerment: A scorecard
Source: WDR 2016 team.
Note: Channels are arranged by degree of technology impact. L = low; M = medium; H = high.
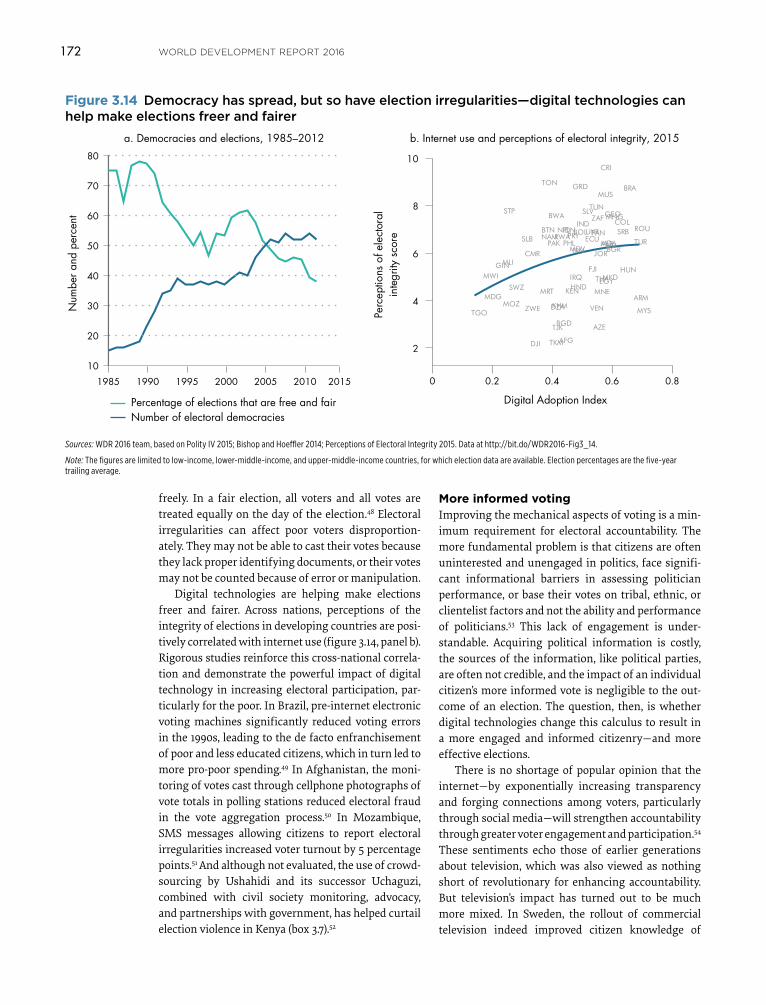
172 WORLD DEVELOPMENT REPORT 2016
More informed votingImproving the mechanical aspects of voting is a min-imum requirement for electoral accountability. The more fundamental problem is that citizens are often uninterested and unengaged in politics, face signifi-cant informational barriers in assessing politician performance, or base their votes on tribal, ethnic, or clientelist factors and not the ability and performance of politicians.53 This lack of engagement is under-standable. Acquiring political information is costly, the sources of the information, like political parties, are often not credible, and the impact of an individual citizen’s more informed vote is negligible to the out-come of an election. The question, then, is whether digital technologies change this calculus to result in a more engaged and informed citizenry—and more effective elections.
There is no shortage of popular opinion that the internet—by exponentially increasing transparency and forging connections among voters, particularly through social media—will strengthen accountability through greater voter engagement and participation.54 These sentiments echo those of earlier generations about television, which was also viewed as nothing short of revolutionary for enhancing accountability. But television’s impact has turned out to be much more mixed. In Sweden, the rollout of commercial television indeed improved citizen knowledge of
freely. In a fair election, all voters and all votes are treated equally on the day of the election.48 Electoral irregularities can affect poor voters disproportion-ately. They may not be able to cast their votes because they lack proper identifying documents, or their votes may not be counted because of error or manipulation.
Digital technologies are helping make elections freer and fairer. Across nations, perceptions of the integrity of elections in developing countries are posi-tively correlated with internet use (figure 3.14, panel b). Rigorous studies reinforce this cross-national correla-tion and demonstrate the powerful impact of digital technology in increasing electoral participation, par-ticularly for the poor. In Brazil, pre-internet electronic voting machines significantly reduced voting errors in the 1990s, leading to the de facto enfranchisement of poor and less educated citizens, which in turn led to more pro-poor spending.49 In Afghanistan, the moni-toring of votes cast through cellphone photographs of vote totals in polling stations reduced electoral fraud in the vote aggregation process.50 In Mozambique, SMS messages allowing citizens to report electoral irregularities increased voter turnout by 5 percentage points.51 And although not evaluated, the use of crowd-sourcing by Ushahidi and its successor Uchaguzi, combined with civil society monitoring, advocacy, and partnerships with government, has helped curtail election violence in Kenya (box 3.7).52
Figure 3.14 Democracy has spread, but so have election irregularities—digital technologies can help make elections freer and fairer
Sources: WDR 2016 team, based on Polity IV 2015; Bishop and Hoeffler 2014; Perceptions of Electoral Integrity 2015. Data at http://bit.do/WDR2016-Fig3_14.
Note: The figures are limited to low-income, lower-middle-income, and upper-middle-income countries, for which election data are available. Election percentages are the five-year trailing average.
10
20
30
40
50
60
70
80
2015201020052000199519901985
a. Democracies and elections, 1985–2012 b. Internet use and perceptions of electoral integrity, 2015
Num
ber a
nd p
erce
nt
Percentage of elections that are free and fairNumber of electoral democracies
BGR
AFG
DZAARM
AZEBGD
KHM
DJI
EGY
FJI
HND
HUNIRQ
JOR
KEN
MKD
MDG
MYS
MRT MNE
MOZ
SWZ
TJK
THA
TGO
TKM
IRNMDVALB
BTN BOL
BIH
BWA
BRA
CMR
COL
CRI
ECU
SLV GEO
GRD
GIN
INDIDN
MWI
MLI
MUS
MDA
MNG
NAMNPL
PAKPANPRY
PHL
ROURWA
STP
SRBSLB
ZAF
TON
TUN
TURUKR
VENZWE
2
4
6
8
10
Perc
eptio
ns o
f ele
ctor
alin
tegr
ity s
core
0 0.2 0.4 0.6 0.8
Digital Adoption Index
173delivering services
news media landscape, as internet political opinion is dominated by a small group of bloggers and outlets that receive the bulk of search engine hits.60 Finally, the internet can give voice to extreme opinions by enabling highly partisan media outlets to get suf-ficient readership and encouraging clustering of extreme views, particularly among the more polit-ically organized and aware, potentially increasing polarization in politics.61
Given that the internet is the main source of news for less than 2 percent of the population in South Asia and Sub-Saharan Africa,62 the informational effects of digital technologies are likely to be mediated through traditional media in those regions, as well as else-where in the developing world. A growing number of advocacy organizations in developing countries partner with media to provide voters with easy-to-understand information about politicians. For exam-ple, Mumbai Votes tracks legislators from Mumbai at all levels of government in India, reporting on their legislative activity and any court cases filed against them. The Fair Play Alliance of the Slovak Republic tracks campaign finance and procurement contracts to uncover corrupt relationships between businesses and politicians.63
politics and government policy and increased voter turnout.55 In the United States, however, it reduced voter turnout and knowledge of policy issues by crowding out local radio and newspapers, previously the main source of political information.56
Digital technologies can certainly provide a vari-ety of tools to improve the informational content of voting. For example, Voting Advice Applications are websites that enable citizens in several European countries to compare the platforms of competing political parties with their own preferences on salient issues; these increased voter turnout among youth in the Netherlands.57 But the internet also offers a variety of other entertainment options that compete for people’s time and can disengage them from poli-tics. In Germany and Italy, the internet reduced voter turnout by crowding out television, a greater source of political information.58
The internet also provides political parties, blog-gers, and opinion leaders with resources to shape public opinion. For example, a simple “I Voted” message on individuals’ Facebook pages increased voter turnout by more than 300,000 in the 2010 U.S. midterm elections.59 The “winner take all” feature of the internet economy is also replicated in the online
Box 3.7 Improving the integrity of elections through crowdsourcing and collaboration
Improving electoral integrity requires effective media, nongovernmental organizations, and partnerships between technologists, advocacy groups, and government watch-dogs to gather, analyze, disseminate, and act upon rele-vant information. Consider the contrasting experiences of Ushahidi and Uchaguzi, two digital election-monitoring initiatives in Kenya. Ushahidi, one of the best-known digital platforms in the world, was launched in the aftermath of Kenya’s tumultuous 2007 election and used “citizen report-ers” to crowdsource and map incidents of violence after the election. While the platform galvanized considerable interest initially—with more 45,000 users in its first few months—many of the reports were not actionable, and there was limited response from the authorities.
Learning from this experience, Ushahidi and a group of journalists and civil society organizations launched its successor, Uchaguzi, to monitor Kenya’s 2010 consti-tutional referendum. But this time, the effort combined
citizen crowdsourcing with analysis by specialized civil society organizations with experience monitoring elections to provide actionable information to local and national government officials, in particular the Interim Independent Electoral Commission. This partnership was a success, with the government responding to a majority of the reports.
Ushahidi’s implicit belief was that the platform would by itself be the agent of change. Uchaguzi—or “Ushahidi 2.0”—recognizes that the platform can work only if it amplifies existing institutions. The main lesson is that governments may be dysfunctional, but can only rarely be bypassed. As one of the founders of the initiative commented after the local police—infamous in Kenya for their venality and brutality—successfully responded to an online citizen report of a machete-armed mob gathering outside a local polling station, “We can’t compel organi-zations to act. We can support institutions, but we can’t replace them.”
Sources: WDR 2016 team, based on interviews with Ushahidi management; Fung, Russon Gilman, and Shkabatur 2013; Wrong 2013.
174 WORLD DEVELOPMENT REPORT 2016
countries by lowering the cost of voting, since votes can be cast from the convenience of one’s home. In Estonia, where about one-third of voting is online, the share of internet voters has increased by more than 4 percentage points in almost every election since 2005, contributing to an overall increase in voter turnout (figure 3.15, panel a). Studies show no differences in the demographic characteristics of internet versus offline voters.71 In Brazil, by contrast, internet voting on municipal budget proposals in the state of Rio Grande do Sul increased voter turnout by 8 percent (and these were new voters), but the online voters were more likely to be male, university educated, and higher-income (figure 3.15, panel b).72
These changes in the demographic profile of voters have not yet changed policy preferences, perhaps because the offline participatory mechanisms to determine the budget proposals that are then voted on limit the range of options subject to the vote. But they show how the internet can be biased against certain groups.
Overall, then, the evidence suggests that digital technologies have helped curtail blatant abuses of political office, conditional on supportive institutions of accountability (such as independent audit or anti-corruption bodies) and free media (to generate and help disseminate the relevant information to voters). Service delivery failures have not been salient enough to command the attention of even digitally enabled media to influence voting decisions by the poor.
Citizen voice and collective action
“Home run” cases in which a technological intervention almost by itself produces dramatic
increases in accountability . . . are exceedingly rare . . . The greatest opportunities [for technology
are in] amplifying NGO and governmental strategies of accountability.
—Archon Fung, Kennedy School of Government, and colleagues
One of the more widely held beliefs about the trans-formative power of digital technologies, particularly social media, is its ability to catalyze citizen voice and collective action to hold governments accountable. The internet promotes transparency by increasing the richness and customizability of the information for citizens. Less obvious—and unique to these tech-nologies—is that they also enable citizens to generate their own information (user-generated content), which can be aggregated at low cost to provide col-
For this digitally enabled political information to have impact, it must be easy to understand, be clearly attributable to a particular politician, and be credi-ble. A good example is the uncovering of corruption by public officials if the information comes from a trusted source, such as an independent anticorrup-tion commission or reliable media outlet. In 2003, the federal government of Brazil launched a national anticorruption program based on random audits of municipal governments by the national audit author-ity (the municipalities to be audited in a given month were chosen by lottery), with results publicly dissem-inated over radio, television, and print media. Voters punished incumbents who were found to be corrupt by not reelecting them. The effects were stronger in municipalities with local radio stations, pointing to the role of local media in informing voters.64 These findings have been replicated in studies of municipal audits in Mexico, again pointing to the importance of a credible source for information on corruption (a national audit by an independent and competent institution) and local television and radio to dissem-inate that information for electoral accountability.65
By contrast, provision of information about fail-ures in service delivery such as poor education or health care, or weak performance of legislatures—which is more complex and difficult to attribute to particular politicians—has been less effective.66 Information campaigns over local radio on public health and primary education in rural Benin had no effect on the incentives of politicians to provide better health and education services or on provider respon-siveness.67 Informing Indian voters about the perfor-mance of their legislators in legislative activity had no effect on voting behavior; but informing them on spending by parliamentarians on physical infrastruc-ture from funds allotted to them to spend on their constituencies did affect voting behavior, since this information was more salient to voters.68 Similarly, providing information on legislator performance to voters in Uganda had no effect on parliamentarians’ reelection rates.69 The experience of Open Data Ini-tiatives is also quite sobering. The mainstream media in Kenya, the Philippines, and Uganda have not been deeply engaged with the Open Data Initiatives, either in using data as a source of evidence in their report-ing or in reporting on efforts surrounding open data. Journalists interviewed said there was no “scoop” in the open data story.70
Digital technologies can also reinforce socioeco-nomic disparities in voter participation and knowl-edge, particularly in developing countries. Internet voting has increased participation in some European

175delivering services
technology-enabled effects hold for collective action around the more mundane service delivery failures. Identifying the precise government failure is much more difficult for services—these after all are hidden from the public eye in classrooms, rural health cen-ters, and in the substandard materials used to con-struct roads—just as is clearly attributing the failure itself to the actions of a particular individual or group of individuals. These failures only rarely become salient in flashpoint events like scandals or egregious abuses of public authority, such as the excessive use of force by the police or a patient dying because of poor care. And they cannot be addressed by the sim-ple “stroke of the pen” actions that protests tend to mobilize around, such as jailing a corrupt politician. Instead, they require sustained reforms to improve government capability, which in turn requires sus-tained citizen voice and collective action.
Given these difficulties in monitoring service failures, it is not surprising that the large academic empirical literature on nondigital instruments of col-lective action—citizen and community report cards, complaint mechanisms, community monitoring of service providers—presents frustratingly mixed evi-dence of impact.79 The main lesson is that the success of citizen collective action around service delivery failures depends on contextual factors, and each of
lective voice through crowdsourcing or community mapping. Social media can facilitate collective action by generating peer pressure as individuals observe the behavior and actions of others, improving within- group monitoring, reducing free-riding, and enabling groups to better coordinate their actions around specific events such as protests.73 These technologies also provide new platforms for citizens to engage with the government, lowering the costs to citizens of providing information, and enabling policy makers and service providers to seek information and track the feedback loop.
As a growing empirical literature shows, cell- phones and the use of Twitter and Facebook aided protests during the Arab Spring in the Arab Republic of Egypt,74 widespread demonstrations on social issues in Chile in 2011,75 antiwar demonstrations in the United States,76 and citizen mobilization across Africa, with the effect more pronounced in nondemo-cratic political systems where traditional channels for articulating interest were limited.77 The same mecha-nisms also imply that digital technologies can trigger harmful collective action, like ethnic conflict.78
Social media have the unique ability to make scandals and highly emotive government abuses of authority “go viral” and trigger parallel physical citizen mobilization. But it is less clear that similar
Figure 3.15 Internet voting can increase voter participation but can be biased toward more privileged groups
Source: WDR team, based on Vassil 2015, for the WDR 2016. Data at http://bit.do /WDR2016-Fig3_15a. Source: WDR team, based on Spada and others 2015. Data at http://bit.do
/WDR2016-Fig3_15b.
Note: BRL = Brazilian real.
Municipal
National
EuropeanParliament
Municipal
National
Municipal
European Parliament National
0
10
20
30
a. Increase in internet voting in variouselections in Estonia, 2005–15
e-vo
ters
as
a pe
rcen
tage
of
part
icip
atin
g vo
ters
2005 2010 2015
Online votersOffline voters
Income level (BRL/month)Education levelGender
Elem
entar
y
Fem
ale
Seco
ndar
y
Higher
<750
750–
1,50
0
1,50
0–6,
000
>6,00
0
Perc
ent
60
50
40
30
20
10
0
b. Profile of online and offline voters in a participatorybudgeting vote in Rio Grande do Sul, Brazil, 2011–12
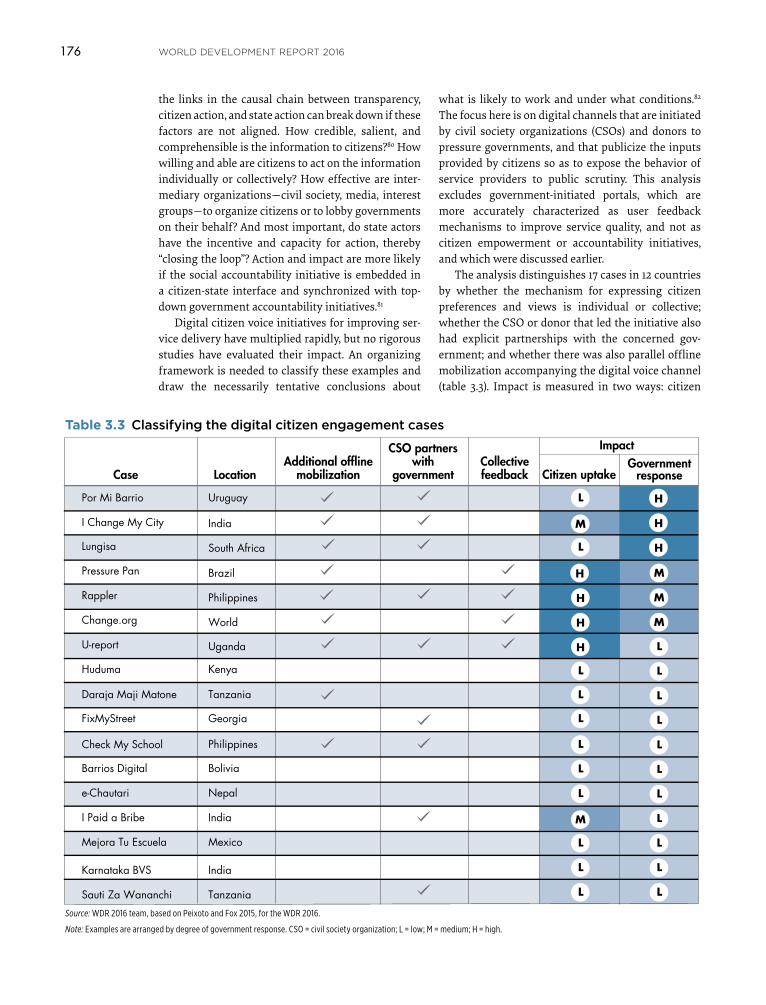
176 WORLD DEVELOPMENT REPORT 2016
what is likely to work and under what conditions.82 The focus here is on digital channels that are initiated by civil society organizations (CSOs) and donors to pressure governments, and that publicize the inputs provided by citizens so as to expose the behavior of service providers to public scrutiny. This analysis excludes government-initiated portals, which are more accurately characterized as user feedback mechanisms to improve service quality, and not as citizen empowerment or accountability initiatives, and which were discussed earlier.
The analysis distinguishes 17 cases in 12 countries by whether the mechanism for expressing citizen preferences and views is individual or collective; whether the CSO or donor that led the initiative also had explicit partnerships with the concerned gov-ernment; and whether there was also parallel offline mobilization accompanying the digital voice channel (table 3.3). Impact is measured in two ways: citizen
the links in the causal chain between transparency, citizen action, and state action can break down if these factors are not aligned. How credible, salient, and comprehensible is the information to citizens?80 How willing and able are citizens to act on the information individually or collectively? How effective are inter-mediary organizations—civil society, media, interest groups—to organize citizens or to lobby governments on their behalf? And most important, do state actors have the incentive and capacity for action, thereby “closing the loop”? Action and impact are more likely if the social accountability initiative is embedded in a citizen-state interface and synchronized with top-down government accountability initiatives.81
Digital citizen voice initiatives for improving ser-vice delivery have multiplied rapidly, but no rigorous studies have evaluated their impact. An organizing framework is needed to classify these examples and draw the necessarily tentative conclusions about
Table 3.3 Classifying the digital citizen engagement cases
Por Mi Barrio Uruguay
India
South Africa
Brazil
Philippines
World
Uganda
Kenya
Tanzania
Georgia
Philippines
Bolivia
Nepal
India
Mexico
India
Tanzania
Case Location
Impact
I Change My City
Lungisa
Pressure Pan
Rappler
Change.org
U-report
Huduma
FixMyStreet
Check My School
Barrios Digital
e-Chautari
I Paid a Bribe
Mejora Tu Escuela
Karnataka BVS
Sauti Za Wananchi
Citizen uptakeGovernment
response
H
H
H
H
H
H
H
M
M
M
M
M
L
L
L
L
L
L
L
L
L
L
L
L
L
L
L
L
L
L
L
L
L
L
Additional offlinemobilization
CSO partnerswith
governmentCollectivefeedback
Daraja Maji Matone
Source: WDR 2016 team, based on Peixoto and Fox 2015, for the WDR 2016.
Note: Examples are arranged by degree of government response. CSO = civil society organization; L = low; M = medium; H = high.
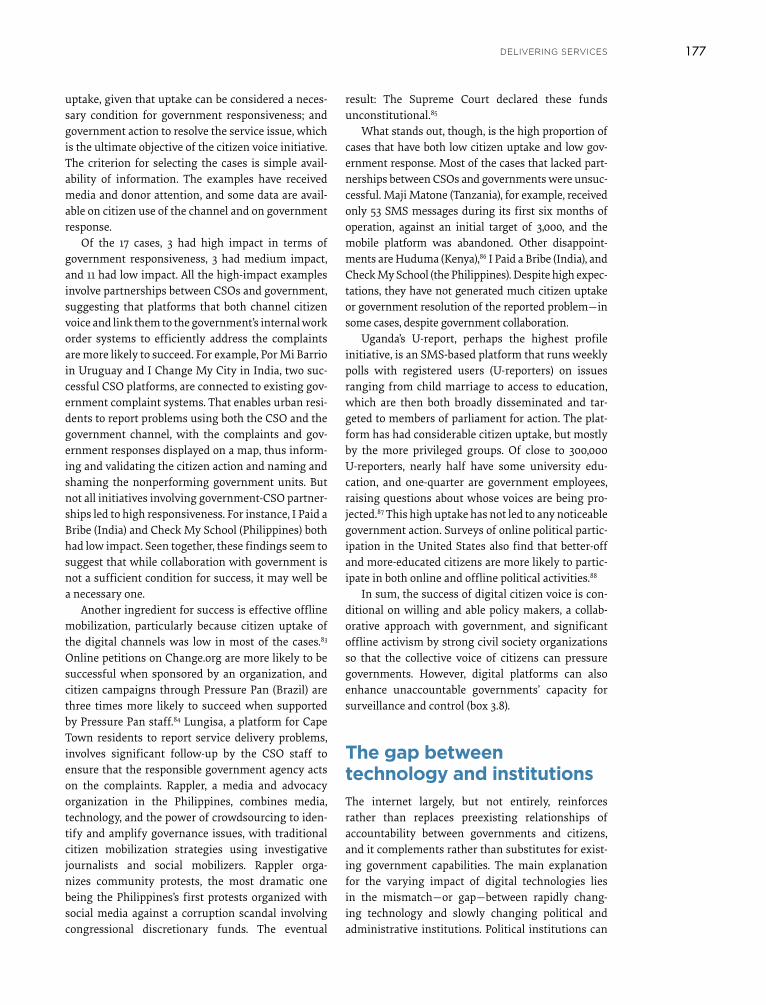
177delivering services
result: The Supreme Court declared these funds unconstitutional.85
What stands out, though, is the high proportion of cases that have both low citizen uptake and low gov-ernment response. Most of the cases that lacked part-nerships between CSOs and governments were unsuc-cessful. Maji Matone (Tanzania), for example, received only 53 SMS messages during its first six months of operation, against an initial target of 3,000, and the mobile platform was abandoned. Other disappoint-ments are Huduma (Kenya),86 I Paid a Bribe (India), and Check My School (the Philippines). Despite high expec-tations, they have not generated much citizen uptake or government resolution of the reported problem—in some cases, despite government collaboration.
Uganda’s U-report, perhaps the highest profile initiative, is an SMS-based platform that runs weekly polls with registered users (U-reporters) on issues ranging from child marriage to access to education, which are then both broadly disseminated and tar-geted to members of parliament for action. The plat-form has had considerable citizen uptake, but mostly by the more privileged groups. Of close to 300,000 U-reporters, nearly half have some university edu-cation, and one-quarter are government employees, raising questions about whose voices are being pro-jected.87 This high uptake has not led to any noticeable government action. Surveys of online political partic-ipation in the United States also find that better-off and more-educated citizens are more likely to partic-ipate in both online and offline political activities.88
In sum, the success of digital citizen voice is con-ditional on willing and able policy makers, a collab-orative approach with government, and significant offline activism by strong civil society organizations so that the collective voice of citizens can pressure governments. However, digital platforms can also enhance unaccountable governments’ capacity for surveillance and control (box 3.8).
The gap between technology and institutionsThe internet largely, but not entirely, reinforces rather than replaces preexisting relationships of accountability between governments and citizens, and it complements rather than substitutes for exist-ing government capabilities. The main explanation for the varying impact of digital technologies lies in the mismatch—or gap—between rapidly chang- ing technology and slowly changing political and administrative institutions. Political institutions can
uptake, given that uptake can be considered a neces-sary condition for government responsiveness; and government action to resolve the service issue, which is the ultimate objective of the citizen voice initiative. The criterion for selecting the cases is simple avail-ability of information. The examples have received media and donor attention, and some data are avail-able on citizen use of the channel and on government response.
Of the 17 cases, 3 had high impact in terms of government responsiveness, 3 had medium impact, and 11 had low impact. All the high-impact examples involve partnerships between CSOs and government, suggesting that platforms that both channel citizen voice and link them to the government’s internal work order systems to efficiently address the complaints are more likely to succeed. For example, Por Mi Barrio in Uruguay and I Change My City in India, two suc-cessful CSO platforms, are connected to existing gov-ernment complaint systems. That enables urban resi-dents to report problems using both the CSO and the government channel, with the complaints and gov-ernment responses displayed on a map, thus inform-ing and validating the citizen action and naming and shaming the nonperforming government units. But not all initiatives involving government-CSO partner-ships led to high responsiveness. For instance, I Paid a Bribe (India) and Check My School (Philippines) both had low impact. Seen together, these findings seem to suggest that while collaboration with government is not a sufficient condition for success, it may well be a necessary one.
Another ingredient for success is effective offline mobilization, particularly because citizen uptake of the digital channels was low in most of the cases.83 Online petitions on Change.org are more likely to be successful when sponsored by an organization, and citizen campaigns through Pressure Pan (Brazil) are three times more likely to succeed when supported by Pressure Pan staff.84 Lungisa, a platform for Cape Town residents to report service delivery problems, involves significant follow-up by the CSO staff to ensure that the responsible government agency acts on the complaints. Rappler, a media and advocacy organization in the Philippines, combines media, technology, and the power of crowdsourcing to iden-tify and amplify governance issues, with traditional citizen mobilization strategies using investigative journalists and social mobilizers. Rappler orga-nizes community protests, the most dramatic one being the Philippines’s first protests organized with social media against a corruption scandal involving congressional discretionary funds. The eventual
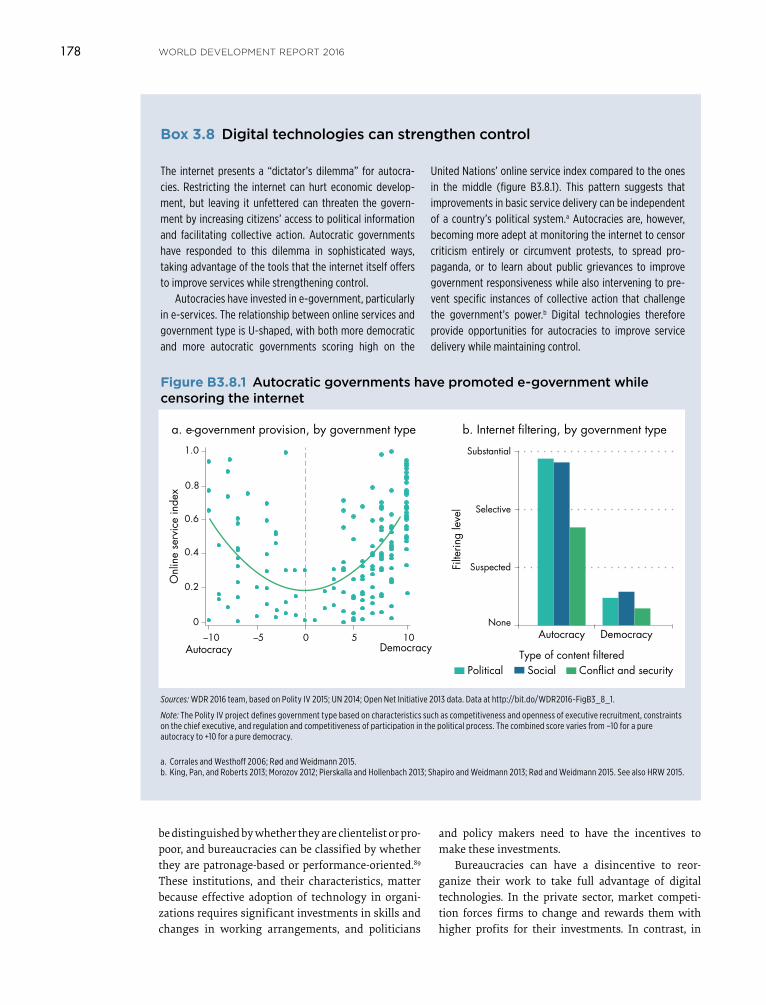
178 WORLD DEVELOPMENT REPORT 2016
and policy makers need to have the incentives to make these investments.
Bureaucracies can have a disincentive to reor-ganize their work to take full advantage of digital technologies. In the private sector, market competi-tion forces firms to change and rewards them with higher profits for their investments. In contrast, in
be distinguished by whether they are clientelist or pro-poor, and bureaucracies can be classified by whether they are patronage-based or performance-oriented.89 These institutions, and their characteristics, matter because effective adoption of technology in organi-zations requires significant investments in skills and changes in working arrangements, and politicians
Box 3.8 Digital technologies can strengthen control
The internet presents a “dictator’s dilemma” for autocra-cies. Restricting the internet can hurt economic develop-ment, but leaving it unfettered can threaten the govern-ment by increasing citizens’ access to political information and facilitating collective action. Autocratic governments have responded to this dilemma in sophisticated ways, taking advantage of the tools that the internet itself offers to improve services while strengthening control.
Autocracies have invested in e-government, particularly in e-services. The relationship between online services and government type is U-shaped, with both more democratic and more autocratic governments scoring high on the
United Nations’ online service index compared to the ones in the middle (figure B3.8.1). This pattern suggests that improvements in basic service delivery can be independent of a country’s political system.a Autocracies are, however, becoming more adept at monitoring the internet to censor criticism entirely or circumvent protests, to spread pro-paganda, or to learn about public grievances to improve government responsiveness while also intervening to pre-vent specific instances of collective action that challenge the government’s power.b Digital technologies therefore provide opportunities for autocracies to improve service delivery while maintaining control.
a. Corrales and Westhoff 2006; Rød and Weidmann 2015.b. King, Pan, and Roberts 2013; Morozov 2012; Pierskalla and Hollenbach 2013; Shapiro and Weidmann 2013; Rød and Weidmann 2015. See also HRW 2015.
Figure B3.8.1 Autocratic governments have promoted e-government while censoring the internet
Sources: WDR 2016 team, based on Polity IV 2015; UN 2014; Open Net Initiative 2013 data. Data at http://bit.do/WDR2016-FigB3_8_1.
Note: The Polity IV project defines government type based on characteristics such as competitiveness and openness of executive recruitment, constraints on the chief executive, and regulation and competitiveness of participation in the political process. The combined score varies from –10 for a pure autocracy to +10 for a pure democracy.
0
0.2
0.4
0.6
0.8
1.0
Onl
ine
serv
ice
inde
x
–10 –5 0 5 10Democracy
a. e-government provision, by government type
None
Suspected
Selective
Substantial
Autocracy
Filte
ring
leve
l
Democracy
b. Internet filtering, by government type
Autocracy Type of content filteredPolitical Social Conflict and security
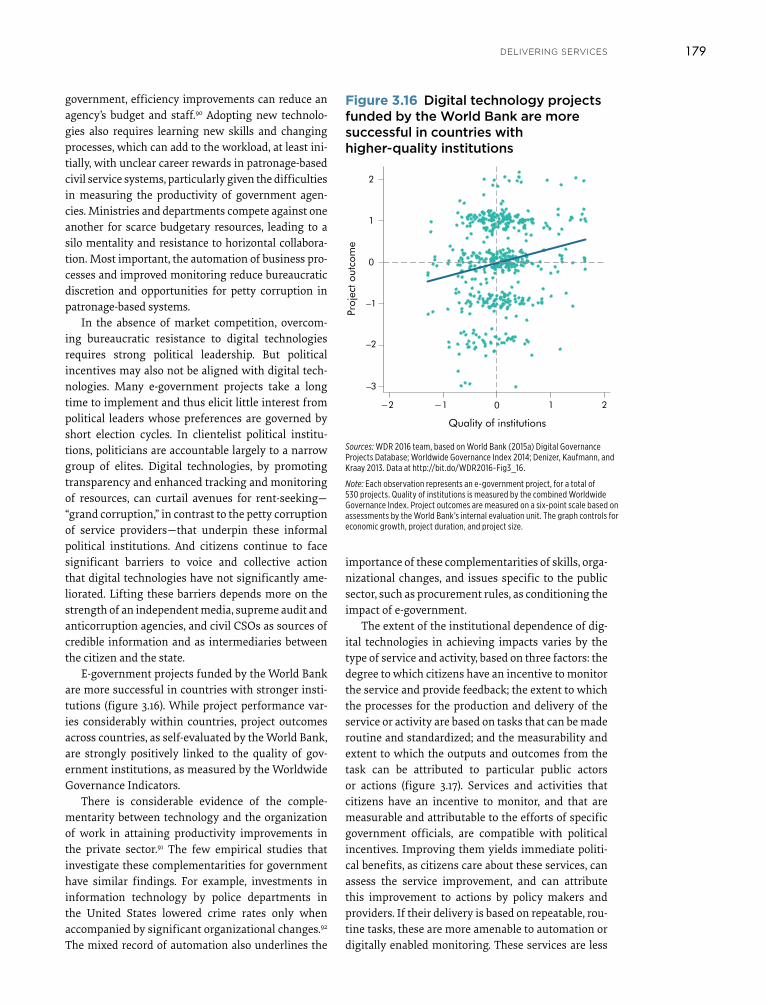
179delivering services
importance of these complementarities of skills, orga-nizational changes, and issues specific to the public sector, such as procurement rules, as conditioning the impact of e-government.
The extent of the institutional dependence of dig-ital technologies in achieving impacts varies by the type of service and activity, based on three factors: the degree to which citizens have an incentive to monitor the service and provide feedback; the extent to which the processes for the production and delivery of the service or activity are based on tasks that can be made routine and standardized; and the measurability and extent to which the outputs and outcomes from the task can be attributed to particular public actors or actions (figure 3.17). Services and activities that citizens have an incentive to monitor, and that are measurable and attributable to the efforts of specific government officials, are compatible with political incentives. Improving them yields immediate politi-cal benefits, as citizens care about these services, can assess the service improvement, and can attribute this improvement to actions by policy makers and providers. If their delivery is based on repeatable, rou-tine tasks, these are more amenable to automation or digitally enabled monitoring. These services are less
government, efficiency improvements can reduce an agency’s budget and staff.90 Adopting new technolo-gies also requires learning new skills and changing processes, which can add to the workload, at least ini-tially, with unclear career rewards in patronage-based civil service systems, particularly given the difficulties in measuring the productivity of government agen-cies. Ministries and departments compete against one another for scarce budgetary resources, leading to a silo mentality and resistance to horizontal collabora-tion. Most important, the automation of business pro-cesses and improved monitoring reduce bureaucratic discretion and opportunities for petty corruption in patronage-based systems.
In the absence of market competition, overcom-ing bureaucratic resistance to digital technologies requires strong political leadership. But political incentives may also not be aligned with digital tech-nologies. Many e-government projects take a long time to implement and thus elicit little interest from political leaders whose preferences are governed by short election cycles. In clientelist political institu-tions, politicians are accountable largely to a narrow group of elites. Digital technologies, by promoting transparency and enhanced tracking and monitoring of resources, can curtail avenues for rent-seeking— “grand corruption,” in contrast to the petty corruption of service providers—that underpin these informal political institutions. And citizens continue to face significant barriers to voice and collective action that digital technologies have not significantly ame-liorated. Lifting these barriers depends more on the strength of an independent media, supreme audit and anticorruption agencies, and civil CSOs as sources of credible information and as intermediaries between the citizen and the state.
E-government projects funded by the World Bank are more successful in countries with stronger insti-tutions (figure 3.16). While project performance var-ies considerably within countries, project outcomes across countries, as self-evaluated by the World Bank, are strongly positively linked to the quality of gov-ernment institutions, as measured by the Worldwide Governance Indicators.
There is considerable evidence of the comple-mentarity between technology and the organization of work in attaining productivity improvements in the private sector.91 The few empirical studies that investigate these complementarities for government have similar findings. For example, investments in information technology by police departments in the United States lowered crime rates only when accompanied by significant organizational changes.92
The mixed record of automation also underlines the
Figure 3.16 Digital technology projects funded by the World Bank are more successful in countries with higher-quality institutions
Sources: WDR 2016 team, based on World Bank (2015a) Digital Governance Projects Database; Worldwide Governance Index 2014; Denizer, Kaufmann, and Kraay 2013. Data at http://bit.do/WDR2016-Fig3_16.
Note: Each observation represents an e-government project, for a total of 530 projects. Quality of institutions is measured by the combined Worldwide Governance Index. Project outcomes are measured on a six-point scale based on assessments by the World Bank’s internal evaluation unit. The graph controls for economic growth, project duration, and project size.
Proj
ect o
utco
me
−2 −1 0
2
1
0
–1
–2
–3
1 2
Quality of institutions
180 WORLD DEVELOPMENT REPORT 2016
utility services like household water and electricity. The tasks to deliver some of these services, like cash transfers or filing taxes, are largely rule-based and clerical, or follow a standardized set of procedures, and ensuring the timely processing of work orders is enough to deliver the service. These features help explain the successful uses of digital technologies for welfare payments, water provision, property and busi-ness registration discussed earlier, including through citizen feedback on service quality. It also explains the success of various m-health initiatives. Automating these tasks does require breaking down departmental silos and changing administrative processes, but the quick, easily visible, and easily attributable service improvements to citizens can yield political benefits that even clientelist politicians might have an interest in supporting, though the political economy consid-erations vary by activity. The mixed impact of e-filing systems for example, reflects how these reforms can often conflict with elite interests and are likely more dependent on institutional complements.
By contrast, teaching, policing, and management are tasks for which no “user manual” can be written, since providers are confronted daily with unique circumstances and must exercise significant judg-ment on how to respond.93 As a result, these tasks are particularly susceptible to problems of asymmetric
conditional on the strength of the initial institutions and relatively amenable to improvements through digital technology.
By contrast, services that citizens do not have an incentive to monitor and that are less measurable and attributable do not yield political benefits to politicians. If the delivery of these services is based on tasks that are highly discretionary, policy makers have less influence over the providers responsible for these services. These services and activities are much more dependent on the quality of existing institutions; improvements through the application of digital technologies are only incremental. This variation helps explain the differential impact of dig-ital technologies across the elements of government capability and citizen empowerment summarized in the table 3.1 and 3.2 scorecards, and why digital technologies can substitute for poor institutions for certain activities and can only complement existing institutions for others.
Citizens and businesses have an incentive to monitor private goods or services that they use very frequently. These include the variety of registration and licensing services offered in one-stop centers; filing taxes; welfare payments; family-oriented health services and self-care such as neonatal health and patients’ adherence to treatment schedules; and
Figure 3.17 Classifying public services and activities as to their amenability to improvement through digital technology
Sources: WDR 2016 team, based on Batley and Mcloughlin 2015; Pritchett and Woolcock 2002; Wilson 1989; World Bank 2003.
Do citizens have the incentive to
monitor?
Is the delivery based on
routine tasks? Examples
Can outcomes be easily measuredand attributed?
YES
YES
NO
YES
NO
YES
NO
NO
Cash transfers, registration, filing taxes
Family-oriented health services and self-care
Utility services (electricity, water)
Curative health care
Constructing roads
Preventive health care, financial management
Procurement of complex goods
Teaching, policing, management
YES
NO
1 2 3
YES
NO
YES
NO LESS amenable to improvement through digital technology
MOREamenable to improvement through digital technology
181delivering services
institutions, technology can substitute for weak ini-tial institutions for certain services, and in the process also help improve those institutions. That has been evident in the example of MajiVoice in Kenya, where automation quickly transformed a patronage-based water utility to a performance-oriented one, and in the examples of institutional transformation trig-gered by digital identification. Moreover, the consid-erable heterogeneity of institutions within countries, varying by sector and locale, creates many openings for innovations that are specific to a given context.94
How should this institutional heterogeneity be classified to help guide policies? Under clientelism, policies are more likely to be adopted if they generate immediate and highly visible service improvements to citizens without reducing the rents of vested inter-ests. In patronage-based bureaucracies, reforms are more likely to succeed if they do not require signifi-cant changes in administrative processes or much collaboration across agencies, or threaten the bureau-cracy with staffing and budgetary reductions. Under pro-poor political institutions, there can be greater political ownership in reforming bureaucracies to strengthen government capability, and in transpar-ency and accountability initiatives. Performance- oriented bureaucracies have the incentive to engage with ambitious initiatives, including the long- duration and less visible administrative automation that often elicits little enthusiasm from politicians.
More generally, the variation in institutional dependency by the nature of the service and activ-ity opens reform possibilities and can be a guide for policies in different country contexts, as discussed in chapter 5.
Notes 1. The 2004 World Development Report, Making Ser-
vices Work for Poor People, underlined that service delivery failures are largely about failures of account-ability and weak government implementation capacity, not about poor policies or lack of resources. It showed how relationships of accountability—between citizens and policy makers, between policy makers and service providers, and between citizens and providers—determine outcomes. Unaccount-able politicians target policies and public spending to a narrow set of elites rather than providing public goods to benefit the general population. Managers and providers are unresponsive to policy makers and to citizens, often using their positions to extract rents. And poor citizens are unable to organize col-lectively to pressure policy makers and providers to address service delivery failures. See also Pritchett, Woolcock, and Andrews 2010.
information. As discussed, it is difficult for digital technologies to make a difference beyond addressing basic problems of provider absenteeism. Citizens also often lack the incentive or capacity to monitor these services, either because they are public goods (for example, security), or are less visible (classroom teach-ing or government administration). These difficulties in measurability, and therefore “attributability,” also make it hard for citizens to hold providers and pol-iticians accountable for performance through elec-tions—beyond deterring electoral fraud and voting out corrupt politicians. They also make it difficult for citizen collective action to be effective in the absence of a strong civil society or willing governments to partner with. These are services and activities where institutions matter much more for outcomes. Digital technologies cannot replace weak institutions.
Between these two extremes are the mixed cases where digital technologies can improve some aspects of the service or activity. Roads and other public infra-structure, financial management, and government procurement are activities with low incentives for cit-izens to monitor because the service is a public good, or not visible to citizens; however, the measurability and attributability of outcomes may be high, and the delivery process may have some elements that can be automated (such as construction). E-procurement of complex goods, such as e-government systems, cannot entirely remove discretion in the evaluation of different bids, but it does establish audit trails and performance indicators. Curative and preventive health care are private and public goods, respectively, and so differ in the citizens’ incentive to monitor (although vaccinating children is a preventive mea-sure that parents are likely to have an incentive to monitor). But the highly discretionary nature of clinical services and the difficulties in measuring the outcomes of treatment render curative health care more difficult to improve through the application of technology than preventive health campaigns that follow more relatively standardized procedures (such as control of communicable diseases).
The future of public services This varying interaction between institutions and digital technology provides entry points for reform in different country contexts to improve public ser-vice delivery. This institutional perspective does not imply that digitally enabled reforms must wait for a country’s institutions to improve to have impact. Digital technologies can also strengthen institutions. In countries with clientelist and patronage-based
182 WORLD DEVELOPMENT REPORT 2016
12. Ayres, Raseman, and Shih 2009. 13. World Bank 2015c. 14. World Bank 2015c. 15. Muralidharan, Niehaus, and Sukhtankar 2014. 16. See http://global.census.okfn.org/. 17. Chopra 2014; Sunstein 2013; Goldstein and Dyson
2013. 18. Bayern 2015. 19. These perceptions are based on the World Bank
Enterprise Survey panel dataset (2008/09 and 2012/13) from the European and Central Asian countries.
20. Kochanova, Hasnain, and Larson, forthcoming. 21. World Bank 2015b; WDI. 22. Deloitte 2012; Yilmaz and Coolidge 2013. 23. World Bank 2014a. 24. Doing Business (World Bank). 25. Lewis-Faupel and others 2014. 26. Krishna 2015. 27. Heeks 2003. 28. Sjoberg, Mellon, and Peixoto 2014. 29. World Bank 2015d. 30. Peixoto and Fox 2015. 31. Presentation given at the World Bank on ASAN
Xidmet centers by the government of Azerbaijan; Majeed 2014.
32. Based on data received from LAPOR. 33. Based on discussions with government officials. 34. Cantijoch, Galandini, and Gobson 2014. 35. Bhatti, Kusek, and Verheijen 2015. 36. WDR 2016 team based on data received from the
government of Punjab. 37. Astrom and others 2013. 38. Chaudhury and others 2006. 39. Dhaliwal and Hanna 2014; Muralidharan and others
2014. 40. Duflo, Hanna, and Ryan 2012; Cilliers and others
2013; Callen and others 2014; Aker and Ksoll 2015; Dhaliwal and Hanna 2014; Adelman and others 2015.
41. WDR 2016 team based on data from the government of Punjab.
42. Oxford Policy Management 2015. 43. Bloom and others 2013; Aral, Brynjolfsson, and Wu
2012. 44. World Bank 2014b. 45. Kraemer and King 2006; Baldwin, Gauld, and Gold-
finch 2012. 46. For example, Bill Clinton, former president of the
United States, reportedly said that “in the new century, liberty will spread by cell phone and cable modem” (see http://www.techlawjournal.com /trade/20000309.htm).
47. Effective service delivery requires sound mecha-nisms for holding policy makers and bureaucracies accountable. Democracy is one, but not the only, political system for establishing strong relation-ships of accountability.
2. Based on the Online Service Index (OSI), published by the United Nations Department of Economic and Social Affairs. The OSI assesses the range and functionality of government-to-citizen (G2C) and government-to-business (G2B) services offered on the national website of each of the UN’s 193 member states, from simple one-way provision of information, to two-way interaction, to integrated “one-stop” portals. This functionality is based on the standard three-stage classification of e-services in the literature. Informational services are basic web-sites where citizens can obtain information on gov-ernment ministries and agencies, access archives, and download forms to apply for public services. Transactional services are chiefly two-way online communications for governments to share informa-tion and solicit feedback, and often on government websites that process financial transactions, such as electronic tax filing. Connected services are citizen-centric, whole-of-government services. Institutional reform and advanced technologies enable citizens to automatically receive benefits based on life-cycle or economic characteristics. They also allow agencies to easily share data to facilitate service delivery. And they encourage accountability through monitor-ing and feedback mechanisms. Depending on the intended beneficiary, these services can be classified as government-to-government (G2G), G2C, or G2B (UN 2014).
3. For this Report, the World Bank has developed two indexes to measure e-government. The Core Systems index measures the automation and inte-gration of core G2G financial and human resource management systems, as well as revenue-related G2B and G2C systems, in 198 countries, drawing on a global dataset of e-government systems devel-oped by the World Bank. The Digital Identification Systems index measures the presence and scope of digital identification systems in government that can serve as a foundational platform technology for myriad G2G, G2C, and G2B services, also drawing on a global dataset of these systems developed by the World Bank. These datasets were prepared by a World Bank team comprising Cem Dener, Sophiko Skhirtladze, Irene H. Zhang, and Doruk Yarin Kiroglu.
4. Reddick and Turner 2012; Gauld, Goldfinch, and Horsburgh 2010.
5. UN 2014. 6. Tomlinson and others 2013. 7. Agarwal and Labrique 2014. 8. World Bank 2012. 9. Kradt-Todd and others 2015. 10. Corbacho, Cibils, and Lora 2013. 11. Perez-Truglia and Troiano 2015; Bø, Slemrod, and
Thoresen 2014. For a review of the literature, see Luttmer and Singhal 2014.
183delivering services
86. This is the Huduma citizen complaints portal based on the Ushahidi platform, not to be confused with the Huduma service centers recently established by the government of Kenya.
87. Berdou and Lopes 2015. 88. Schlozman, Verba, and Brady 2010. 89. World Bank 2003. 90. Fountain 2001. 91. Bresnahan, Brynjolfsson, and Hitt 2002; Brynjolfs-
son and Hitt 2000. 92. Garicano and Heaton 2010. 93. Lipsky 1980. 94. Banerjee and Duflo 2014.
ReferencesAcemoglu, Daron, Tarek Hasan, and Ahmed Tahoun.
2014. “The Power of the Street: Evidence from Egypt’s Arab Spring.” NBER Working Paper 20665, National Bureau of Economic Research, Cambridge, MA.
Adelman, Melissa, Moussa Blimpo, David K. Evans, Atabanam Simbou, and Noah Yarrow. 2015. “Can Information Technology Improve School Effective-ness in Haiti? Evidence from a Field Experiment.” Unpublished paper, World Bank, Washington, DC.
Agarwal, Smisha, and Alain Labrique. 2014. “Newborn Health on the Line: The Potential mHealth Applica-tions.” Journal of the American Medical Association 312 (3): 229–30.
Aker, Jenny C., Rachid Boumnijel, Amanda McClelland, and Niall Tierney. 2014. “Payment Mechanisms and Anti-Poverty Programs: Evidence from a Mobile Money Cash Transfer Experiment in Niger.” Working Paper 268, Center for Global Development, Washing-ton, DC.
Aker, Jenny C., Paul Collier, and Pedro Vicente. 2013. “Is Information Power? Using Mobile Phones and Free Newspapers during an Election in Mozambique.” Working Paper 328, Center for Global Development, Washington, DC. http://papers.ssrn.com/sol3/papers .cfm?abstract_id=2364162.
Aker, Jenny C., and Christopher Ksoll. 2015. “Call Me Edu-cated: Evidence from a Mobile Monitoring Experi-ment in Niger.” Working Paper 406, Center for Global Development, Washington, DC. http://www.cgdev .org/publication/cal l -me-educated-evidence-mobile-monitoring-experiment-niger-working-paper-406.
Alvarez, Michael R., Thad E. Hall, and Alexander H. Trechsel. 2009. “Internet Voting in Comparative Perspective: The Case of Estonia.” Political Science and Politics 42 (3): 497–505.
Anderson, Christopher J. 2007. “The End of Economic Voting? Contingency Dilemmas and the Limits of Democratic Accountability.” Annual Review of Political Science 10 (1): 271–96.
48. Based on data from Bishop and Hoeffler 2014. Six indicators relate to the freeness of the electoral process before election day: the legal framework, electoral management bodies, electoral rights, voter register, ballot access, and campaign process. Four indicators relate to the fairness of voting and events on or immediately after election day: media access, voting process, role of officials, and counting of votes. Each indicator has several criteria that must be met for it to be coded as “1” for the given election. If there is a sufficient body of data to conclude that the conditions are not met, the indicator is coded as “0.” An election is considered free when at least four of the six relevant indicators are coded as “1.” An election is considered “fair” when at least two of the four relevant indicators are coded as “1.”
49. Fujiwara 2015. 50. Callen and Long 2015. 51. Aker, Collier, and Vicente 2013. 52. Fung, Russon Gilman, and Shkabatur 2010. 53. For a review of the literature, see Anderson 2007. 54. This “liberation technology” literature is consider-
able. See, for example, Diamond and Plattner 2012. 55. Prat and Stromberg 2005. 56. Gentzkow 2006. 57. Gemenis and Rosema 2014. 58. Falck, Gold, and Heblich 2014. 59. Bond and others 2012. 60. Hindman 2008. 61. Farrell 2012; Sunstein 2009. 62. Gallup World Poll, http://www.gallup.com/services
/170945/world-poll.aspx. 63. Fung, Russon Gilman, and Shkabatur 2013. 64. Ferraz and Finan 2008. 65. Larreguy, Marshall, and Snyder Jr. 2014. 66. Keefer and Khemani 2003. 67. Keefer and Khemani 2011. 68. Banerjee and others 2011. 69. Humphreys and Weinstein 2012. 70. Bayern 2015. 71. Alvarez, Hall, and Trechsel 2009. 72. Spada and others 2015. 73. Diamond and Plattner 2012; Little 2015; Shirky 2008. 74. Acemoglu, Hasan, and Tahoun 2014. 75. Valenzuela 2013. 76. Bennett and Segerberg 2011. 77. Hollenbach and Pierskalla 2014. 78. Pierskalla and Hollenbach 2013. 79. Banerjee and others 2010; Björkman and Svensson
2009; Lieberman, Posner, and Tsai 2014; Olken 2007. 80. Fung, Graham, and Weil 2007. 81. Fox 2014; Grandvoinnet, Aslam, and Raha 2015. 82. Peixoto and Fox 2015. 83. Fung, Russon Gilman, and Shkabatur 2010. 84. Peixoto and Fox 2015. 85. Bayern 2015.
184 WORLD DEVELOPMENT REPORT 2016
WPS/2014-14, Centre for the Study of African Econo-mies, Oxford, U.K. http://www.csae.ox.ac.uk/datasets /free-fair-elections/.
Björkman, Martina, and Jakob Svensson. 2009. “Power to the People: Evidence from a Randomized Experiment on Community-Based Monitoring in Uganda.” Quar-terly Journal of Economics 124 (2): 735–69.
Bloom, Nicholas, Erik Brynjolfsson, Lucia Foster, Ron Jar-min, Ita Saporta-Eksten, and John Van Reenan. 2013. “Management in America.” Discussion Paper 13-01, Center for Economic Studies, Washington, DC.
Bø, Erland E., Joel Slemrod, and Thor O. Thoresen. 2014. “Taxes on the Internet: Deterrence Effects of Public Disclosure.” Discussion Paper 770, Statistics Norway Research Department.
Bond, Robert M., Christopher J. Fariss, Jason J. Jones, Adam Kramer, Cameron Marlow, Jaime E. Settle, and James H. Fowler. 2012. “A 61-Million-Person Experi-ment in Social Influence and Political Mobilization.” Nature 489: 295–98.
Bresnahan, Timothy, Erik Brynjolfsson, and Lorin M. Hitt. 2002. “Information Technology, Workplace Organization, and the Demand for Skilled Labor: Firm-Level Evidence.” Quarterly Journal of Economics 117 (1): 339–76.
Bridge Academies. 2013. “The Bridge Effect: Comparison of Bridge Pupils to Peers at Nearby Schools.” EGRA-EGMA Evaluation Programme, Fall 2013 Results, Bridge International Academies, Mombassa, Kenya. http://www.bridgeinternationalacademies.com/wp-content/uploads/2013/01/Bridge-International-A cademies_White-Paper_The-Bridge-Effect_Nov-2014_Website.pdf.
Brynjolfsson, Erik, and Lorin M. Hitt. 2000. “Beyond Computation: Information Technology, Organiza-tional Transformation and Business Performance.” Journal of Economic Perspectives 14 (4): 23–48.
Budzier, Alexander, and Bent Flyvbjerg. 2012. “Over-spend? Late? Failure? What the Data Say about IT Project Risk in the Public Sector.” In Commonwealth Governance Handbook 2012/13: Democracy, Development and Public Administration, edited by Commonwealth Secretariat, 145–57. London: Commonwealth Secretariat.
Bussell, Jennifer. 2012. Corruption and Reform in India: Public Services in the Digital Age. Cambridge, MA: Cam-bridge University Press.
Callen, Michael, Saad Gulzar, Ali Hasanain, and Yasir Khan. 2014. “The Political Economy of Public Employee Absence: Experimental Evidence from Pakistan.” Working paper, Harvard University, Cam-bridge, MA.
Callen, Michael, and James D. Long. 2015. “Institutional Corruption and Election Fraud: Evidence from a Field Experiment in Afghanistan.” American Economic Review 105 (1): 354–81.
Aral, Sinan, Erik Brynjolfsson, and Lynn Wu. 2012. “Three-Way Complementarities: Performance Pay, HR Analytics and Information Technology.” Manage-ment Science 58 (5): 913–31.
Astrom, Joachim, Hille Hinsberg, Magnus Jonsson, and Martin Karlsson. 2013. “Citizen Centric E-Partici-pation: A Trilateral Collaboration for Democratic Innovation.” PRAXIS Center for Policy Studies, Tallin, Estonia.
Ayres, Ian, Sophie Raseman, and Alice Shih. 2009. “Evidence from Two Large Field Experiments That Peer Comparison Feedback Can Reduce Residential Energy Usage.” NBER Working Paper 15386, National Bureau of Economic Research, Cambridge, MA.
Baldwin, Norman J., Robin Gauld, and Shaun Goldfinch. 2012. “What Public Servants Really Think of E-Gov-ernment.” Public Management Review 14 (1): 105–27.
Banerjee, Abhijit, Rukmini Banerji, Esther Duflo, Rachel Glennerster, and Stuti Khemani. 2010. “Pitfalls of Par-ticipatory Programs: Evidence from a Randomized Evaluation in Education in India.” American Economic Journal: Economic Policy 2 (1): 1–30.
Banerjee, Abhijit, and Esther Duflo. 2014. “Under the Thumb of History? Political Institutions and the Scope for Action.” NBER Working Paper 19848, National Bureau of Economic Research, Cambridge, MA.
Banerjee, Abhijit, Selvan Kumar, Rohini Pande, and Felix Su. 2011. “Do Informed Voters Make Better Choices? Experimental Evidence from Urban India.” Unpub-lished manuscript, Harvard University, Cambridge, MA. http://www.povertyactionlab.org/node/2764.
Batley, Richard, and Claire Mcloughlin. 2015. “The Pol-itics of Public Services: A Service Characteristics Approach.” World Development 74: 275–85.
Bayern, Jessica. 2015. “Investigating the Impact of Open Data: Case Studies of Kenya, Moldova, Philippines, and Uganda.” Background paper for the World Devel-opment Report 2016, World Bank, Washington, DC.
Bennett, W. Lance, and Alexandra Segerberg. 2011. “Dig-ital Media and the Personalization of Collective Action: Social Technology and the Organization of Protests against the Global Economic Crisis.” Informa-tion, Communication & Society 14 (6): 770–99.
Berdou, E., and C. A. Lopes. 2015. “The Case of UNICEF’s U-Report (Uganda).” World Bank, Washington, DC.
Best, Michael. 2013. Cables, Commissions and Cybercafés: ICTs in Postconflict Liberia. Washington, DC: World Bank.
Bhatnagar, Subhash. 2009. Unlocking E-Government Poten-tial: Concepts, Cases and Practical Insights. New Delhi, India: SAGE Publications.
Bhatti, Zubair, Jody Kusek, and Tony Verheijen. 2015. “Logged On: Smart Government Solutions from South Asia.” World Bank, Washington, DC.
Bishop, Sylvia, and Anke Hoeffler. 2014. “Free and Fair Elections: A New Database.” Working Paper
185delivering services
Falck, Oliver, Robert Gold, and Stephan Heblich. 2014. “E-lections: Voting Behavior and the Internet.” Amer-ican Economic Review 104 (7): 2238–65.
Farrell, Henry. 2012. “The Consequences of the Internet for Politics.” Annual Review of Political Science 15 (June): 35–52. doi: 10.1146/annurev-polisci-030810-110815.
Ferraz, Claudio, and Frederico Finan. 2008. “Exposing Corrupt Politicians: The Effects of Brazil’s Publicly Released Audits on Electoral Outcomes.” Quarterly Journal of Economics (May 2008): 703–45. http://eml .berkeley.edu/~ffinan/Finan_Audit.pdf.
Fountain, Jane E. 2001. Building the Virtual State: Informa-tion Technology and Institutional Change. Washington, DC: Brookings Institution Press.
Fox, Jonathan. 2014. “Social Accountability: What Does the Evidence Really Say?” Working paper, Global Partnership for Social Accountability, Washington, DC.
Fujiwara, Thomas. 2015. “Voting Technology, Political Responsiveness, and Infant Health: Evidence from Brazil.” Econometrica 83 (2): 423–64.
Fung, Archon, Hollie Russon Gilman, and Jennifer Shka-batur. 2010. Impact Case Studies from Middle Income and Developing Countries. London: Transparency and Accountability Initiative, Open Society Foundation. http://www.transparency-initiative.org/wp-content /uploads/2011/05/impact_case_studies_final1.pdf.
————. 2013. “Six Models for the Internet + Politics.” International Studies Review 15 (1): 30–47. doi: 10.1111 /misr.12028.
Fung, Archon, Mary Graham, and David Weil. 2007. Full Disclosure: The Perils and Promise of Transparency. Cam-bridge, MA: Cambridge University Press.
Garicano, Luis, and Paul Heaton. 2010. “Information Technology, Organization, and Productivity in the Public Sector: Evidence from Police Departments.” Journal of Labor Economics 28 (1): 167–201.
Gauld, Robin, and Shaun Goldfinch. 2006. Dangerous Enthusiasms: E-Government, Computer Failure, and Infor-mation System Development. Dunedin, New Zealand: Otago University Press.
Gauld, Robin, Shaun Goldfinch, and Simon Horsburgh. 2010. “Do They Want It? Do They Use It? The ‘Demand Side’ of E-Government in Australia and New Zea-land.” Government Information Quarterly 27 (2): 177–86. doi: 10.1016/j.giq.2009.12.002.
Gemenis, Kostas, and Martin Rosema. 2014. “Voting Advice Applications and Electoral Turnout.” Electoral Studies 36 (December 2014): 281–89.
Gentzkow, Matthew. 2006. “Television and Voter Turn-out.” Quarterly Journal of Economics 121 (3): 931–72. doi: 10.1162/qjec.121.3.931.
Goldstein, Brett, and Lauren Dyson. 2013. Beyond Trans-parency: Open Data and the Future of Civic Innovation. San Francisco: Code for America Press.
Grandvoinnet, Helene, Ghazia Aslam, and Shomikho Raha. 2015. Opening the Black Box: Contextual Drivers
Cantijoch, Marta, Silvia Galandini, and Rachel Gobson. 2014. “Civic Websites and Community Engagement: A Mixed Methods Study of Citizen Empowerment Initiatives.” APSA Annual Meeting paper. http://ssrn .com/abstract=2454315.
Chaudhury, Nazmul, Jeffery Hammer, Michael Kremer, Karthik Muralidharan, and F. Halsey Rogers. 2006. “Missing in Action: Teacher and Health Worker Absence in Developing Countries.” Journal of Economic Perspectives 20 (1): 91–116. doi: 10.1257/089533006776526058.
Chopra, Aneesh. 2014. Innovative State: How New Technol-ogies Can Transform Government. New York: Atlantic Monthly Press.
Cilliers, Jacobus, Ibrahim Kasirye, Clare Leaver, Pieter Serneels, and Andrew Zeitlin. 2013. “Improving Teacher Attendance Using a Locally Managed Mon-itoring Scheme: Evidence from Ugandan Primary Schools.” Policy Note 14/0186, International Growth Centre, London.
Corbacho, A., V. Fretes Cibils, and E. Lora. 2013. More Than Revenue: Taxation as a Development Tool. Washington, DC: Inter-American Development Bank.
Corrales, Javier, and Frank Westhoff. 2006. “Information Technology Adoption and Political Regimes.” Interna-tional Studies Quarterly 50: 911–33. http://onlinelibrary .wiley.com/doi/10.1111/j.1468-2478.2006.00431.x/pdf.
Deloitte. 2012. “eTransform Africa: Modernising Gov-ernment through ICTs.” Deloitte Consulting. http://siteresources.worldbank.org/EXTINFORMATIONANDCOMMUNICATIONANDTECHNOLOGIES/Resources/282822-1346223280837/ModernizingGovernment_Fullreport.pdf.
Denizer, Cevdet, Daniel Kaufmann, and Aart Kraay. 2013. “Good Countries or Good Projects? Macro and Micro Correlates of World Bank Project Performance.” Jour-nal of Development Economics 105 (November): 288–302. http://www.sciencedirect.com/science/article/pii/S0304387813000874.
Dhaliwal, Iqbal, and Rema Hanna. 2014. “Deal with the Devil: The Success and Limitations of Bureaucratic Reform in India.” NBER Working Paper 20482, National Bureau of Economic Research, Cambridge, MA.
Diamond, Larry, and Marc F. Plattner. 2012. Liberation Technology: Social Media and the Struggle for Democracy. Baltimore, MD: John Hopkins University Press.
Duflo, Esther, Rema Hanna, and Stephen P. Ryan. 2012. “Incentives Work: Getting Teachers to Come to School.” American Economic Review 102 (4): 1241–78.
Dunleavy, Patrick, and Leandro Carrera. 2013. Growing the Productivity of Government Services. Cheltenham, U.K.: Edward Elgar.
EC (European Commission). 2014. Eurostat (database). European Commission, Luxembourg, http://ec.europa .eu/eurostat/data/database.
186 WORLD DEVELOPMENT REPORT 2016
Sector Capability?” Background paper for the World Development Report 2016, World Bank, Washington, DC.
Kradt-Todd, G., Erez Yoeli, Syon Bhanot, and David Rand. 2015. “Promoting Cooperation in the Field.” Current Opinion in Behavioral Sciences 3 (June): 96–101. doi: 10.1016/j.cobeha.2015.02.006.
Kraemer, Kenneth L., and John Leslie King. 2006. “Infor-mation Technology and Administrative Reform: Will E-Government Be Different?” International Journal of Electronic Government Research 2 (1): 1–20.
Krishna, Gunjan. 2015. “Improving Service Delivery through the Use of Digital Technologies: A Case Study of Karnataka e-Procurement.” Background paper for the World Development Report 2016, World Bank, Washington, DC.
Larreguy, Horacio, John Marshall, and James M. Snyder Jr. 2014. “Revealing Malfeasence: How Local Media Facilitates Sanctioning of Mayors in Mexico.” NBER Working Paper 20697, National Bureau of Economic Research, Cambridge, MA.
Lemieux, V. 2015. “One Step Forward, Two Steps Back? Does E-Government Make Governments in Develop-ing Countries More Transparent and Accountable?” Background paper for the World Development Report 2016, World Bank, Washington, DC.
Lewis-Faupel, Sean, Yusef Neggers, Benjamin A. Olken, and Rohini Pande. 2014. “Can Electronic Procure-ment Improve Infrastructure Provision? Evidence from Public Works in India and Indonesia.” NBER Working Paper 20344, National Bureau of Economic Research, Cambridge, MA.
Lieberman, Evan, Daniel Posner, and Lily Tsai. 2014. “Does Information Lead to More Active Citizenship? Evidence from an Education Intervention in Rural Kenya.” World Development 60: 69–83.
Lipsky, Michael. 1980. Street-Level Bureaucracy: Dilemmas of the Individual in Public Service. New York: Russell Sage Foundation.
Little, Andrew. 2015. “Communication Technology and Protest.” Journal of Politics 78 (1). http://www.jstor.org /stable/10.1086/683187.
Luttmer, Erzo, and Monica Singhal. 2014. “Tax Morale.” Journal of Economic Perspectives 28 (4): 149–68. doi: 10.1257/jep.28.4.149.
Majeed, Rushda. 2014. “A Second Life for One-Stop Shops: Citizen Service Centers in Minas Gerais, Bra-zil, 2003–2013.” Innovations for Successful Societies, Princeton University, Princeton, NJ.
Morozov, Evgeny. 2012. The Net Delusion: The Dark Side of Internet Freedom. PublicAffairs.
Muralidharan, Karthik, Jishnu Das, Alaka Holla, and Aakash Mohpal. 2014. “The Fiscal Cost of Weak Governance: Evidence from Teacher Absenteeism in India.” NBER Working Paper 20299, National Bureau of Economic Research, Cambridge, MA.
of Social Accountability Effectiveness. Washington, DC: World Bank.
Heeks, Richard. 2003. “Most eGovernment-for-Devel-opment Projects Fail: How Can Risks Be Reduced?” iGovernment Working Paper 14, Institute for Devel-opment Policy and Management, Manchester, U.K. http://unpan1.un.org/intradoc/groups/public/docu ments/NISPAcee/UNPAN015488.pdf.
————. 2006. “Understanding and Measuring E-Govern-ment: International Benchmarking Studies.” Unpub-lished paper, University of Manchester, Manchester, U.K.
————. 2008. “Success and Failure Rates of eGovernment in Developing/Transitional Countries.” http://www .egov4dev.org/success/sfrates.shtml.
Heyneman, Stephen P., and Jonathan M. B. Stern. 2014. “Low Cost Private Schools for the Poor: What Public Policy Is Appropriate?” International Journal of Educa-tional Development 35 (March): 3–15.
Hindman, Matthew. 2008. The Myth of Digital Democracy. Princeton, NJ: Princeton University Press.
Hollenbach, Florian, and Jan Pierskalla. 2014. “Voicing Discontent: Communication Technology and Pro-test.” APSA Annual Meeting paper.
HRW (Human Rights Watch). 2015. “Human Rights Watch Submission.” Background note submitted to the World Development Report 2016 team, Human Rights Watch, Washington, DC. https://www.hrw.org/sites /default/files/supporting_resources/hrw_submission _re_wdr_2016_internet_for_development.pdf.
Humphreys, Macarten, and Jeremy Weinstein. 2012. “Policing Politicians: Citizen Empowerment and Political Accountability in Uganda: Preliminary Analysis.” Working paper, Columbia University, New York.
International Budget Partnership. 2014. “Open Budget Index.” http://internationalbudget.org/opening-budgets/open-budget-initiative/open-budget-survey/.
Keefer, Philip, and Stuti Khemani. 2003. “Democracy, Public Expenditures and the Poor.” World Bank, Washington, DC.
————. 2011. “Do Informed Citizens Receive More . . . or Pay More? The Impact of Radio on the Government Distribution of Public Health Benefits.” Policy Research Working Paper 5952, World Bank, Washington, DC.https://openknowledge.worldbank.org/bitstream/handle/10986/3236/WPS5952.pdf?sequence=1.
Kelly, Tim, and David Souter. 2014. The Role of Information and Communication Technologies in Post-Conflict Recon-struction. Washington, DC: World Bank. http://www .infodev.org/infodev-files/final_report_10_feb.pdf.
King, Gary, Jennifer Pan, and Margaret E. Roberts. 2013. “How Censorship in China Allows Government Crit-icism but Silences Collective Expression.” American Political Science Review 107 (2): 1–18.
Kochanova, Anna, Zahid Hasnain, and Bradley R. Larson. Forthcoming. “Does E-Government Improve Public
187delivering services
Rød, Espen Geelmuyden, and Nils B. Weidmann. 2015. “Empowering Activists or Autocrats? The Internet in Authoritarian Regimes.” Journal of Peace Research 53 (3): 1–14.
Rodriguez, Camila, and Sebastian Monroy-Taborda. Forthcoming. Targeted Public Transit Benefits in Bogotá. Background note for the World Development Report 2016, World Bank, Washington, DC.
Ross, Terrance. 2014. “Is It Ever Okay to Make Teachers Read Scripted Lessons?” The Atlantic. http://www.the atlantic.com/education/archive/2014/10/is-it-okay-to -make-teachers-read-scripted-lessons/381265/.
Schlozman, Kay Lehman, Sidney Verba, and Henry E. Brady. 2010. “Weapon of the Strong? Participatory Inequality and the Internet.” Perspectives on Politics 8 (2): 487–509.
Shapiro, Jacob N., and Nils B. Weidmann. 2013. “Is the Phone Mightier Than the Sword? Cellphones and Insurgent Violence in Iraq.” International Organization 2: 247–74.
Shirky, Clay. 2008. Here Comes Everybody: The Power of Orga-nizing without Organizations. London: Penguin Group.
Sjoberg, Fredrik, Jonathan Mellon, and Tiago Peixoto. 2014. “The Effect of Government Responsiveness on Future Political Participation.” Unpublished paper, World Bank, Washington, DC.
Spada, Paolo, Jonathan Mellon, Tiago Peixoto, and Fre-drik Sjoberg. 2015. “Effects of the Internet on Par-ticipation: Study of a Policy Referendum in Brazil.” Policy Research Working Paper 7204, World Bank, Washington, DC.
Standish Group. 2014. “Chaos Report.” http://www .standishgroup.com/.
Sunstein, Cass R. 2009. Republic 2.0. Princeton, NJ: Prince-ton University Press.
————. 2013. Simpler: The Future of Government. New York: Simon & Schuster.
Tomlinson, Mark, Mary Jane Rotheram-Borus, Leslie Swartz, and Alexander C. Tsai. 2013. “Scaling Up mHealth: Where Is the Evidence?” PLOS Medicine 10 (2): e1001382. doi: 10.1371/journal.pmed.1001382.
Toyama, Kentaro. 2015. Geek Heresy: Rescuing Social Change from the Cult of Technology. New York: PublicAffairs.
UN (United Nations). 2014. “E-Government Survey 2014: E-Government for the Future We Want.” UN, New York.
Valenzuela, Sebastián. 2013. “Unpacking the Use of Social Media for Protest Behavior: The Roles of Informa-tion, Opinion Expression, and Activism.” American Behavioral Scientist 20 (10): 1–23.
Vassil, Kristjan. 2015. “Estonian E-Government Ecosys-tem: Foundation, Applications, Outcomes.” Back-ground paper for the World Development Report 2016, World Bank, Washington, DC.
Wilson, James Q. 1989. Bureaucracy: What Government Agencies Do and Why They Do It. New York: Basic Books.
World Bank. Various years. Doing Business (database). World Bank, Washington, DC, http://www.doing business.org/.
Muralidharan, Karthik, Paul Niehaus, and Sandip Sukh-tankar. 2014. “Building State Capacity: Evidence from Biometric Smartcards in India.” NBER Working Paper 19999, National Bureau of Economic Research, Cambridge, MA.
Olken, Benjamin. 2007. “Monitoring Corruption: Evi-dence from a Field Experiment in Indonesia.” Journal of Political Economy 115 (2): 200–49. http://economics .mit.edu/files/2913.
OMB (U.S. Office of Management and Budget). 2010. 25-Point Implementation Plan to Reform Federal Informa-tion Technology Management. OMB, Washington, DC.
Open Net Initiative. 2013. https://opennet.net/.Oxford Policy Management. 2015. “EQUIP-Tanzania
Impact Evaluation.” Briefing Note 2, Oxford Policy Management.
Peixoto, Tiago, and Jonathan Fox. 2015. “When Does ICT-Enabled Citizen Voice Lead to Government Respon-siveness?” Background paper for the World Develop-ment Report 2016, World Bank, Washington, DC.
Perceptions of Electoral Integrity. 2015. https://dataverse .harvard.edu/dataverse/PEI.
Perez-Truglia, Ricardo, and Ugo Troiano. 2015. “Tax Debt Enforcement: Theory and Evidence from a Field Experiment in the United States.” Meeting Paper 134, Society for Economic Dynamics.
PIAAC (Programme for the International Assessment of Adult Competencies). 2014. OECD, Paris, http://www.oecd.org/site/piaac/.
Pierskalla, Jan H., and Florian M. Hollenbach. 2013. “Technology and Collective Action: The Effect of Cell Phone Coverage on Political Violence in Africa.” Amer-ican Political Science Review 107 (2): 207–24.
Polity IV. 2015. http://www.systemicpeace.org/polity project.html.
Prat, Andrea, and David Stromberg. 2005. “Commercial Television and Voter Information.” Discussion Paper 4989, Centre for Economic Policy Research, London.
Pritchett, Lant, and Michael Woolcock. 2002. “Solutions When the Solution is the Problem: Arraying the Dis-array in Development.” Center for Global Develop-ment, Washington, DC.
Pritchett, Lant, Michael Woolcock, and Matt Andrews. 2010. “Capability Traps? The Mechanisms of Per-sistent Implementation Failure.” Center for Global Development, Washington, DC.
Rangan, V. Kasturi, and Katherine Lee. 2010. “Bridge International Academies: A School in a Box.” Harvard Business School, Cambridge, MA.
Reddick, Christopher, and Michael Turner. 2012. “Chan-nel Choice and Public Service Delivery in Canada: Comparing E-Government to Traditional Service Delivery.” Government Information Quarterly 29 (1): 1–11. doi: 10.1016/j.giq.2011.03.005.
Research ICT Africa. 2014. Household surveys. Cape-town, South Africa. http://www.researchictafrica.net /home.php.
188 WORLD DEVELOPMENT REPORT 2016
World Bank. 2015a. Digital Governance Projects (data-base). World Bank, Washington, DC, http://data .worldbank.org/data-catalog/dg-projects-database.
————. 2015b. Global E-Government Systems (database). World Bank, Washington, DC, http://data.worldbank .org/data-catalog/pfm-systems-eservices-dataset.
————. 2015c. ID4D (Identification for Development database). World Bank, Washington, DC, http://data .worldbank.org/data-catalog/id4d-dataset.
————. 2015d. “MajiVoice: A New Accountability Tool to Improve Public Services.” World Bank, Washington, DC.
Wrong, Michela. 2013. “Geeks for Peace.” New York Times, February 28. http://latitude.blogs.nytimes .com/2013/02/28/geeks-for-peace/?_r=0.
Yilmaz, Fatih, and Jacqueline Coolidge. 2013. “Can E-Filing Reduce Tax Compliance Costs in Developing Countries?” Policy Research Working Paper 6647, World Bank, Washington, DC.
————. Various years. Skills Towards Employability and Productivity (STEP) household surveys (database). World Bank, Washington, DC, http://microdata .worldbank.org/index.php/catalog/step/about.
————. 2003. World Development Report 2004: Making Services Work for Poor People. Washington, DC: World Bank.
————. 2012. “eTransform Africa: The Transformational Use of Information and Communication Technolo-gies in Africa.” World Bank, Washington, DC.
————. 2014a. “Impact Evaluation of E-Filing and In-Depth Study of Risk-Based Audits in Tajikistan.” World Bank, Washington, DC.
————. 2014b. “Pay Flexibility and Government Per-formance: A Multicountry Study.” Working Paper 88486, World Bank, Washington, DC. http://docu ments.worldbank.org/curated/en/2014/06/19630016 /pay-flexibility-government-performance-multi country-study.
