chapter 3 demand and supply. slide 3-2 introduction newly-minted ph.d. economists have faced a...
TRANSCRIPT

Chapter 3
Demand and Supply

Slide 3-2
Introduction
Newly-minted Ph.D. economists have faced a difficult job market for academic
positions in recent years. This is because two factors have
simultaneously increased the supply of economics instructors and decreased
the demand for their services.

Slide 3-3
Learning Objectives
Explain the law of demand
Discuss the difference between money prices and relative prices
Distinguish between a change in demand and a change in quantity demanded
Slide 3-4
Learning Objectives
Explain the law of supply
Distinguish between changes in supply and changes in quantity supplied
Understand how supply and demand interact to determine equilibrium price and quantity

Slide 3-5
The Law of Demand
The Demand Schedule
Shifts in Demand
Chapter Outline

Slide 3-6
Chapter Outline
The Law of Supply
The Supply Schedule
Shifts in Supply
Putting Demand and Supply Together

Slide 3-7
Did You Know That...
Even though overall prices trend steadily upwards, some prices hold steady or decline?
The average price of a desktop personal computer has fallen by almost 50 percent?
Demand and supply can explain most of relative price changes?

Slide 3-8
Markets
Markets
– Arrangements that individuals have for exchanging with one another
– Represent the interaction of buyers and sellers

Slide 3-9
Markets
Markets
– Markets for gasoline
– Markets for labor
– Stock market
– Market for Super Bowl tickets
– Compact disk market

Slide 3-10
Markets
Markets
– Markets set the prices we pay and receive

Slide 3-11
The Law of Demand
Demand
– Quantities of specific goods or services that individuals, taken singly or as a group, will purchase at various possible prices, other things being constant

Slide 3-12
The Law of Demand
Law of Demand
– Quantity demanded is inversely related to price, all things equal

Slide 3-13
The Law of Demand
What are we holding constant?
– Income
– Price of other goods
– Many other factors

Slide 3-14
The Law of Demand
Relative prices versus money prices
– Relative Price• The price of a commodity in terms of another
commodity
– Money Price• Price we observe today in today’s dollars
(absolute, nominal price)

Slide 3-15
Money Price versus Relative Price
Money Price Relative Price
Price Last Year Price This Year Price Last Year Price This Year
DVDs $20 $28
Videocassettes $10 $16
$20
$10= 2.0
$10
$20= 0.5
$28
$16= 1.75
$16= 0.57
$28
Table 3-1

Slide 3-16
Example: Price per Constant-Quality Unit
Many products, for which you pay one price, contain many features.
The right to return an item for a refund may be one feature that is included in the price.
Some retailers now are finding ways to unbundle these various features, by offering consumers the option of paying extra if they wish to use them.
Slide 3-17
The Demand Schedule
The demand schedule is a table relating prices to quantity demanded.
We must consider:
– The time dimension
– Constant-quality units

Slide 3-18
The Individual Demand Schedule
Figure 3-1, Panel (a)
Slide 3-19
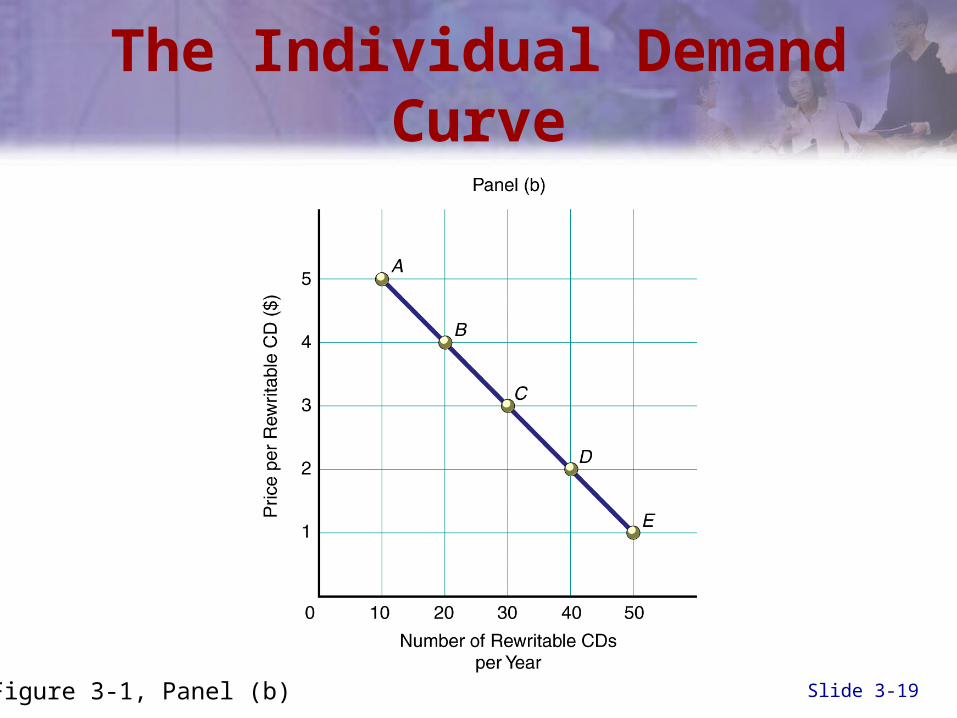
The Individual Demand Curve
Figure 3-1, Panel (b)

Slide 3-20
The Horizontal Summationof Two Demand Schedules
Figure 3-2, Panel (a)

Slide 3-21
The Horizontal Summationof Two Demand Schedules
Figure 3-2, Panels (b), (c), (d)

Slide 3-22
The Market DemandSchedule for Rewritable CD’s
Figure 3-3, Panel (a)
Slide 3-23
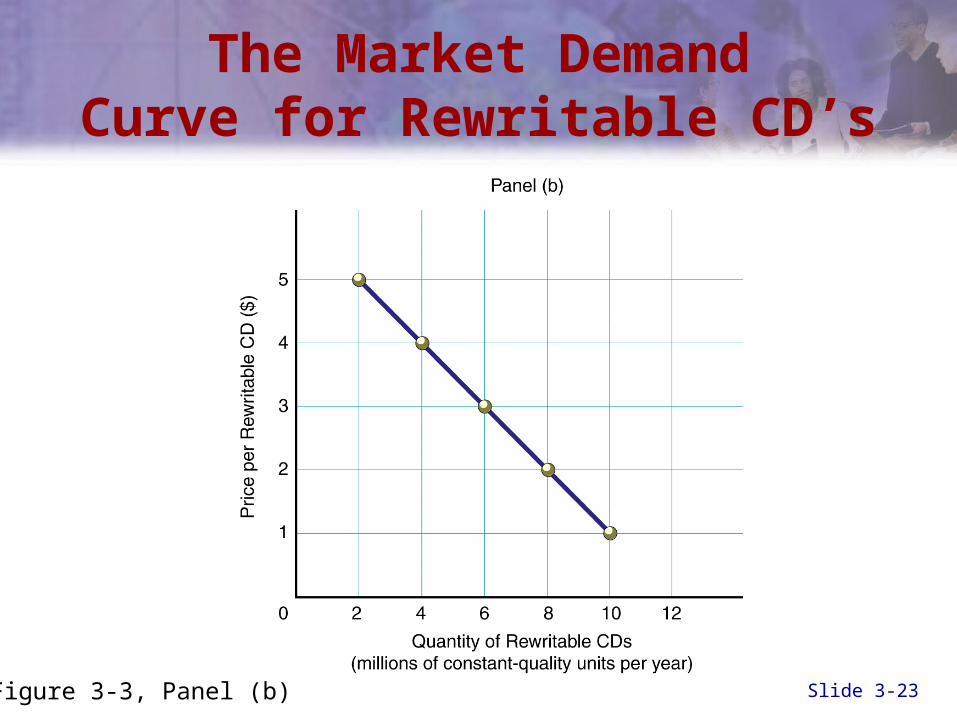
The Market DemandCurve for Rewritable CD’s
Figure 3-3, Panel (b)

Slide 3-24
Policy Example: Preventing Traffic Jams
Expressways in Japan are subject to tolls.
Increased toll rates in recent years have resulted in lower traffic volume.

Slide 3-25
Shifts in Demand
Scenario
– The federal government gives every student registered in college a rewritable CD drive to use with a personal computer.

Slide 3-26
A Shift in the Demand Curve
D1
Quantity of Rewritable CDs Demanded(millions of constant-quality units per year)
Pric
e pe
r R
ewrit
able
CD
($)
2 4 6 80
1
2
3
4
5
10 12 14
Suppose the federal government gives every student a rewritable CD drive.
D2
Increase in Demand
Figure 3-4

Slide 3-27
A Shift in the Demand Curve
D1
Quantity of Rewritable CDs Demanded(millions of constant-quality units per year)
Pric
e pe
r R
ewrit
able
CD
($)
2 4 6 80
1
2
3
4
5
10 12 14
D2
D3
Suppose universities prohibit the use of personal computers.
Decrease in Demand
Figure 3-4

Slide 3-28
A Shift in the Demand Curve
D1
Quantity of Rewritable CDs Demanded(millions of constant-quality units per year)
Pric
e pe
r R
ewrit
able
CD
($)
2 4 6 80
1
2
3
4
5
10 12 14
D2
When demand increases the quantity demanded will be greater at each price
a
c
b
d
Figure 3-4
Slide 3-29
Shifts in Demand
Determinants of demand
– Income
– Tastes and preferences
– The price of related goods• Complements• Substitutes

Slide 3-30
Shifts in Demand
Determinants of demand
– Expectations• Future prices• Income• Product availability
– Market size (number of buyers)
Slide 3-31
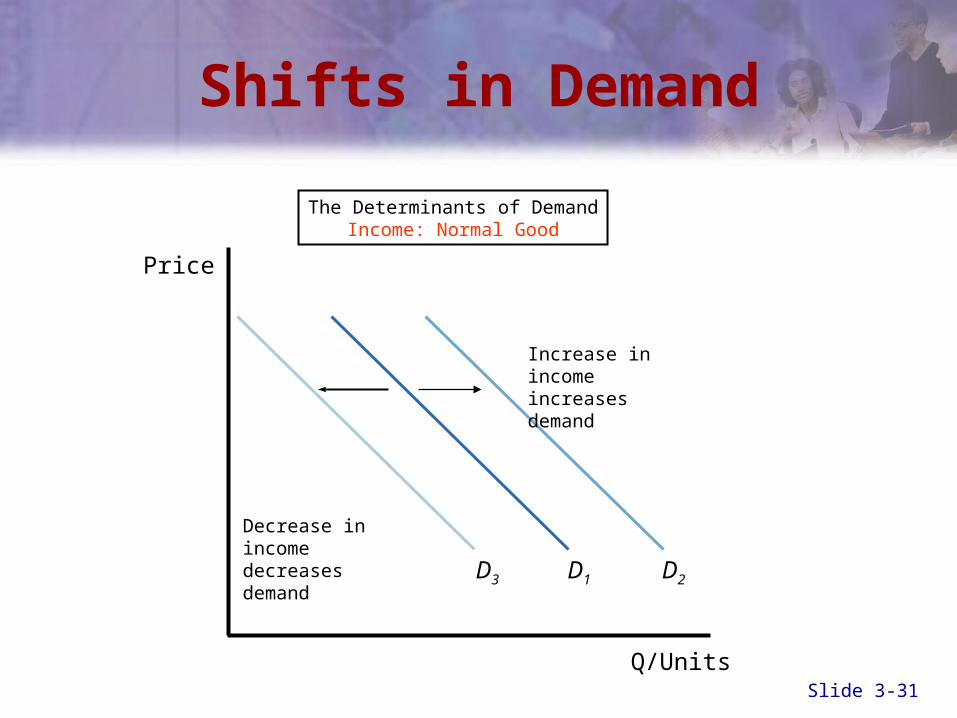
Shifts in Demand
The Determinants of DemandIncome: Normal Good
D1
Q/Units
D2D3
Price
Decrease in incomedecreases demand
Increase in incomeincreases demand

Slide 3-32
Shifts in Demand
The Determinants of DemandIncome: Inferior Good
D1
Q/Units
Decrease in incomeincreases demand
Increase in incomedecreases demand
Price
D2D3

Slide 3-33
Shifts in Demand
The Determinants of DemandIncome: Tastes and Preferences
D1
Q/Units
Price
Sport Utility Vehicle• Increase in demand
D2
Smoking• Decrease in demand
D3

Slide 3-34
Shifts in Demand
The Determinants of DemandPrice of Related Goods: Substitutes
D1
Q/Butter
Butter and Margarine• Price of both = $2/lb.• Price of margarine
increases to $3/lb.
• Demand for butter increases
D2
Price
Slide 3-35
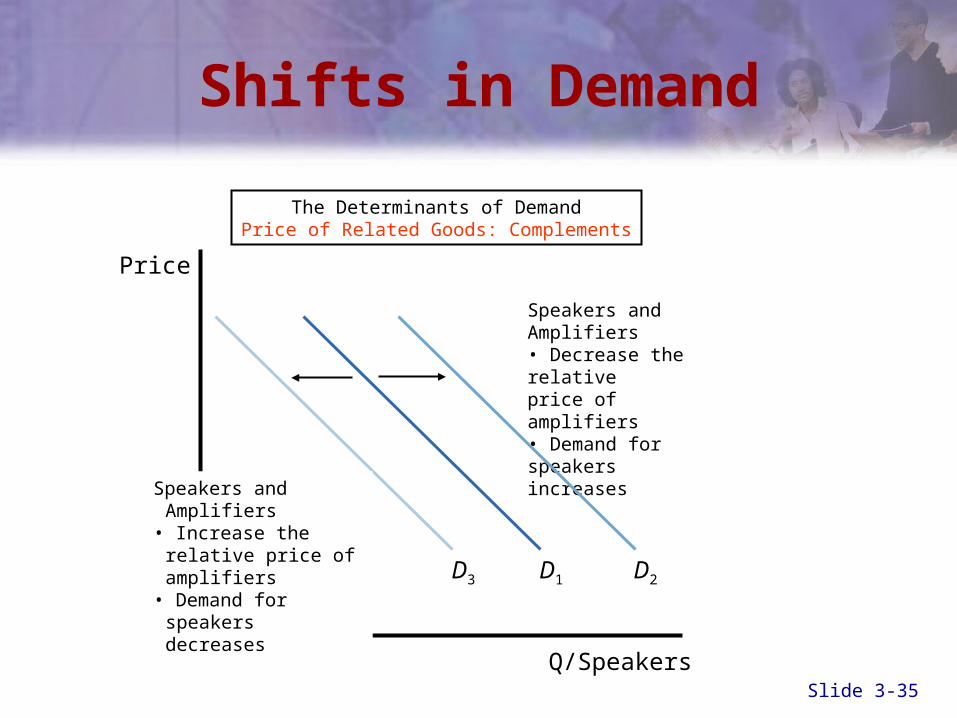
Shifts in Demand
The Determinants of DemandPrice of Related Goods: Complements
D1
Q/Speakers
Speakers and Amplifiers• Decrease the relative
price of amplifiers• Demand for speakers
increases
D2D3
Speakers and Amplifiers• Increase the relative
price of amplifiers• Demand for speakers
decreases
Price

Slide 3-36
Shifts in Demand
The Determinants of DemandExpectations
D1
Q/Units
A higher income or expectations of a higher future price will increase demand
D2D3
A lower income or expectations of a lower future price will decrease demand
Price

Slide 3-37
Shifts in Demand
The Determinants of DemandPopulation
D1
Q/Units
Increase in the population increases demand
D2D3
Decrease in population decreases demand
Price

Slide 3-38
Shifts in Demand
Changes in demand versus changes in quantity demanded
– A change in one or more of the non-price determinants (income, tastes, etc.) will lead to a change in demand.
– This is a shift of the whole curve.

Slide 3-39
Shifts in Demand
Changes in demand versus changes in quantity demanded
– A change in a good’s own price leads to a change in quantity demanded.
– This is a movement along the same curve.

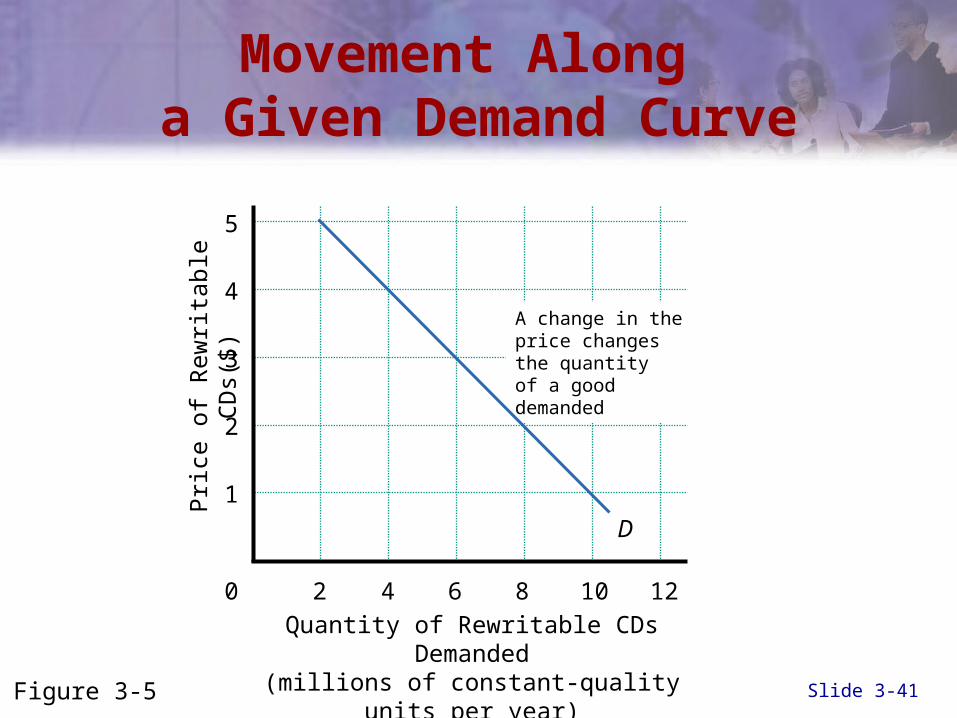
Slide 3-40
Movement Along a Given Demand Curve
Quantity of Rewritable CDs Demanded(millions of constant-quality units per year)
Pric
e of
Rew
ritab
le C
Ds(
$)
2 4 6 80
1
2
3
4
5
10 12
Figure 3-5
Slide 3-41
A change in the price changes the quantity of a good demanded
Movement Along a Given Demand Curve
Quantity of Rewritable CDs Demanded(millions of constant-quality units per year)
Pric
e of
Rew
ritab
le C
Ds(
$)
2 4 6 80
1
2
3
4
5
10 12
D
Figure 3-5

Slide 3-42
D
A change in the price changes the quantity
of a good demanded
Movement Along a Given Demand Curve
Quantity of Rewritable CDs Demanded(millions of constant-quality units per year)
Pric
e of
Rew
ritab
le C
Ds(
$)
2 4 6 80
1
2
3
4
5
10 12
Figure 3-5

Slide 3-43
Movement Along a Given Demand Curve
Quantity of Rewritable CDs Demanded(millions of constant-quality units per year)
Pric
e of
Rew
ritab
le C
Ds(
$)
2 4 6 80
1
2
3
4
5
10 12
D
Figure 3-5
A change in the price changes the quantity
of a good demanded

Slide 3-44
Example:Higher Honey Prices
Honey prices more than doubled between 2000 and 2003.
Many food manufacturers switched to other flavorings as a substitute.
This shows that an increase in the price of honey led to an increase in the demand for a substitute good.

Slide 3-45
The Law of Supply
Supply
– The amount of a product or service that firms are willing to sell at alternative prices

Slide 3-46
The Law of Supply
Law of Supply
– The price of a product or service and the quantity supplied are directly related
Slide 3-47
The Supply Schedule
The supply schedule is a table relating prices to quantity supplied.

Slide 3-48
The Individual Producer’s Supply Schedule
Figure 3-6, Panel (a)
Slide 3-49
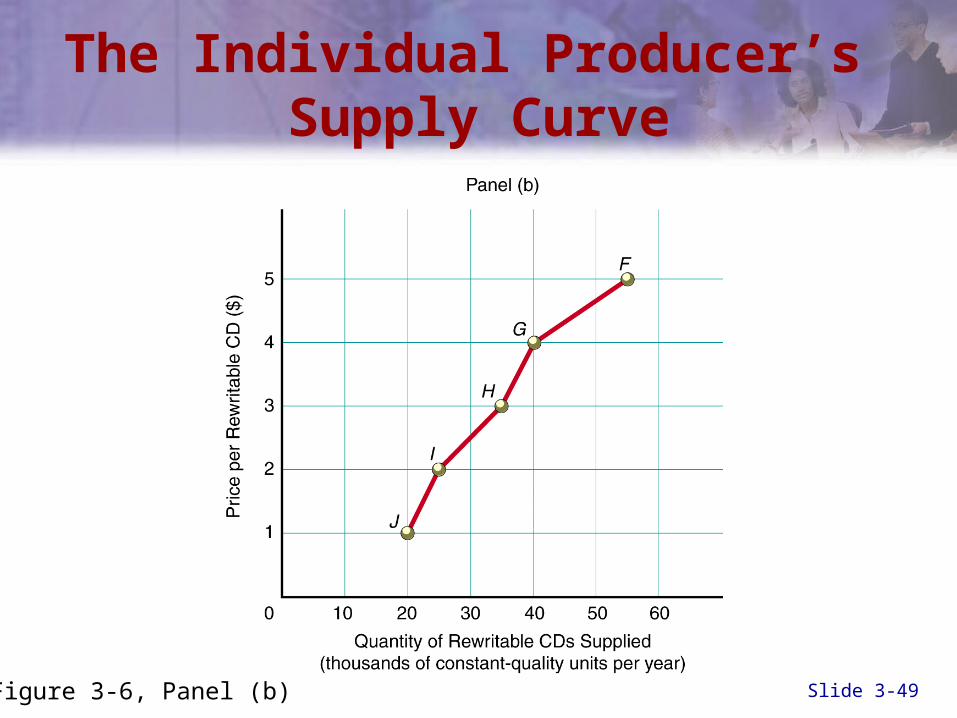
The Individual Producer’s Supply Curve
Figure 3-6, Panel (b)

Slide 3-50
Horizontal Summationof Supply Curves
Figure 3-7, Panel (a)

Slide 3-51
Horizontal Summationof Supply Curves
Figure 3-7, Panels (b), (c), (d)

Slide 3-52
The Market Supply Schedulefor Rewritable CDs
Figure 3-8, Panel (a)

Slide 3-53
The Market Supply Curvefor Rewritable CDs
Figure 3-8, Panel (b)

Slide 3-54
Shifts in Supply
Scenario
– A new method of manufacturing rewritable CDs reduces the cost of production by 50 percent.

Slide 3-55
A Shift in the Supply Curve
If some other factor than price changes, the only way we can show its effect is by moving the entire supply curve
Quantity of Rewritable CDs Demanded(millions of constant-quality units per year)
Pric
e pe
r R
ewrit
able
CD
($)
2 4 6 80
1
2
3
4
5
10 12 14
S1
Figure 3-9

Slide 3-56
A Shift in the Supply Curve
If costs decrease, supply increases
Quantity of Rewritable CDs Demanded(millions of constant-quality units per year)
Pric
e pe
r R
ewrit
able
CD
($)
2 4 6 80
1
2
3
4
5
10 12 14
S2
S1
Figure 3-9

Slide 3-57
A Shift in the Supply Curve
If costs increase, supply decreases
Quantity of Rewritable CDs Demanded(millions of constant-quality units per year)
Pric
e pe
r R
ewrit
able
CD
($)
2 4 6 80
1
2
3
4
5
10 12 14
S3
S2
S1
Figure 3-9

Slide 3-58
A Shift in the Supply Curve
Quantity of Rewritable CDs Demanded(millions of constant-quality units per year)
Pric
e pe
r R
ewrit
able
CD
($)
2 4 6 80
1
2
3
4
5
10 12 14
S1
When supply increases the quantity supplied will be greater at each price
Figure 3-9

Slide 3-59
A Shift in the Supply Curve
S1
Quantity of Rewritable CDs Demanded(millions of constant-quality units per year)
Pric
e pe
r R
ewrit
able
CD
($)
2 4 6 80
1
2
3
4
5
10 12 14
S2
a
cWhen supply increases the quantity supplied will be greater at each price
Figure 3-9

Slide 3-60
A Shift in the Supply Curve
S1
Quantity of Rewritable CDs Demanded(millions of constant-quality units per year)
Pric
e pe
r R
ewrit
able
CD
($)
2 4 6 80
1
2
3
4
5
10 12 14
a
b
d
c
S2
When supply increases the quantity supplied will be greater at each price
Figure 3-9

Slide 3-61
A Shift in the Supply Curve
Quantity of Rewritable CDs Demanded(millions of constant-quality units per year)
Pric
e pe
r R
ewrit
able
CD
($)
2 4 6 80
1
2
3
4
5
10 12 14
S1
a
c
S3
b
dWhen supply decreases the quantity supplied will be less at each price
Figure 3-9

Slide 3-62
Policy Example:The Supply of New Housing
Environmental regulations in California add to the costs of new housing construction.
These higher costs serve to reduce the supply of new housing.

Slide 3-63
Shifts in Supply
Determinants of supply
– Cost of inputs
– Technology and productivity
– Taxes and subsidies
– Price expectations
– Number of firms in industry

Slide 3-64
Shifts in Supply
The Determinants of SupplyCost of Inputs
S1
Q/Units
Decrease in cost increases supply
S2Increase in costdecreases supply
S3
Price

Slide 3-65
Shifts in Supply
The Determinants of SupplyTechnology and Productivity
S1
Q/Units
Improvements in technology or increases in productivity increase supply
S2
Decreases in productivity decrease supply
S3
Price
Slide 3-66
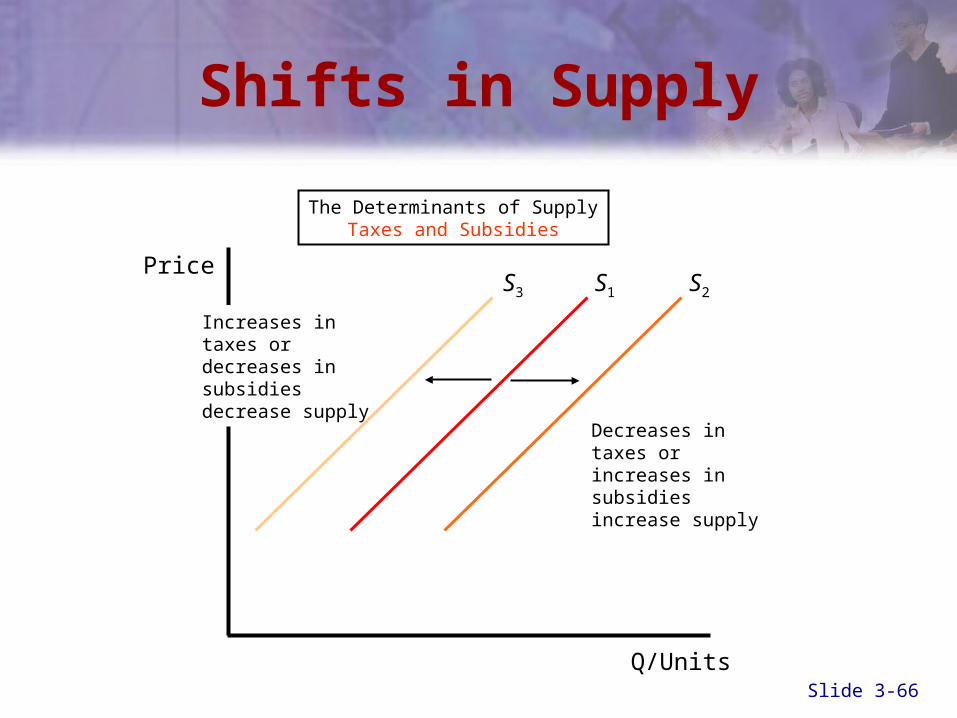
Shifts in Supply
The Determinants of SupplyTaxes and Subsidies
S1
Q/Units
Decreases in taxes or increases in subsidies increase supply
S2
Increases in taxes or decreases in subsidies decrease supply
S3
Price

Slide 3-67
Shifts in Supply
The Determinants of SupplyPrice Expectations
S1
Q/Units
Expectations of lower future prices increase supply
S2Expectations of higher future prices decrease supply
S3
Price

Slide 3-68
Shifts in Supply
The Determinants of SupplyNumber of Firms in Industry
S1
Q/Units
Increase in the number of firms increases supply
S2Decrease in the number of firms decreases supply
S3
Price

Slide 3-69
Shifts in Supply
Changes in supply versus changes in quantity supplied
– A change in one or more of the non-price determinants will lead to a change in supply.
– This is a shift of the whole curve.

Slide 3-70
Shifts in Supply
Changes in supply versus changes in quantity supplied
– A change in a good’s own price leads to a change in quantity supplied.
– This is a movement along the same curve.

Slide 3-71
Putting Demandand Supply Together
Figure 3-10, Panel (a)
Slide 3-72
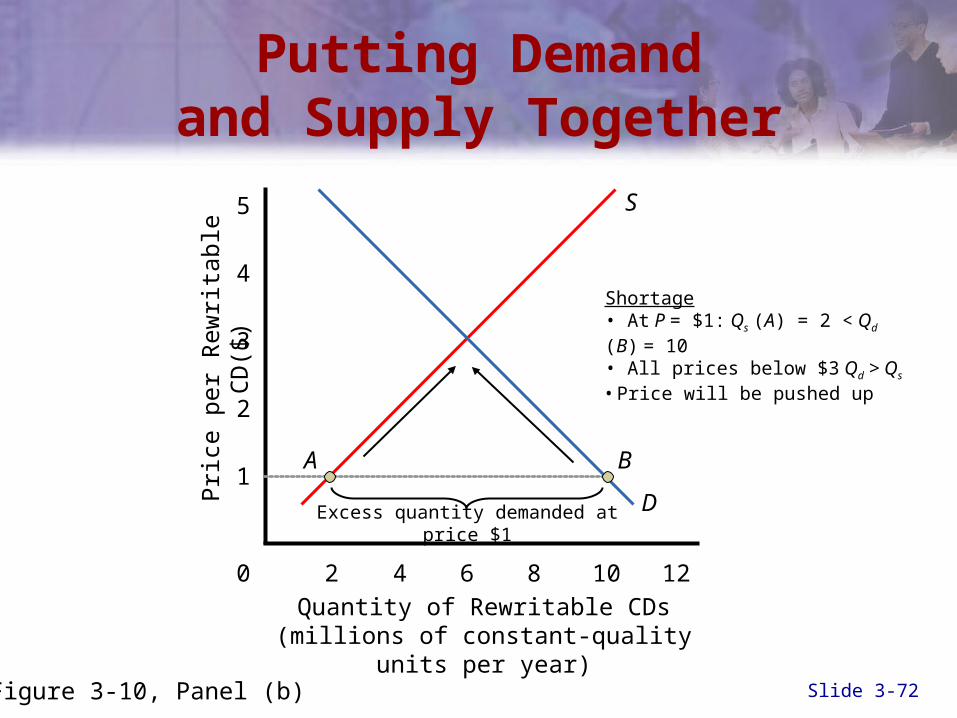
Putting Demandand Supply Together
Quantity of Rewritable CDs(millions of constant-quality units per year)
Pric
e pe
r R
ewrit
able
CD
($)
2 4 6 80
1
2
3
4
5
10 12
S
D
A B
Excess quantity demanded at price $1
Shortage• At P = $1: Qs (A) = 2 < Qd (B) = 10• All prices below $3 Qd > Qs
• Price will be pushed up
Figure 3-10, Panel (b)

Slide 3-73
Putting Demandand Supply Together
Quantity of Rewritable CDs(millions of constant-quality units per year)
Pric
e pe
r R
ewrit
able
CD
($)
2 4 6 80
1
2
3
4
5
10 12
S
D
D
Excess quantity supplied at price $5
Surplus• At P = $5: Qd (D) = 2 < Qs (C) = 10• All prices above $3 Qd < Qs
• Price will be pushed down
Figure 3-10, Panel (b)

Slide 3-74
Putting Demandand Supply Together
Quantity of Rewritable CDs(millions of constant-quality units per year)
Pric
e pe
r R
ewrit
able
CD
($)
2 4 6 80
1
2
3
4
5
10 12
S
D
D
Excess quantity supplied at price $5
A B
Excess quantity demanded at price $1
EquilibriumMarket clearing, or equilibrium price
E
Figure 3-10, Panel (b)

Slide 3-75
Putting Demandand Supply Together
Equilibrium
– The situation when quantity supplied equals quantity demanded at a particular price

Slide 3-76
Putting Demandand Supply Together
Shortages
– The situation when quantity demanded is greater than quantity supplied
– Exists at any price below the equilibrium price
– Is not the same as scarcity

Slide 3-77
Putting Demandand Supply Together
Surpluses
– The situation when quantity supplied is greater than quantity demanded
– Exists at any price above the equilibrium price

Slide 3-78Figure 3-11
Should Shortages in the Ticket Market Be Solved by Scalpers?
Quantity of Super Bowl Tickets
Pric
e pe
r T
icke
t
Q1 Q2
P1
P2
S
DExcess quantity
demanded (shortage at
price P1)

Slide 3-79
Example:Rail Transport Prices and Logjams
A recent increase in the amount of grains ready for market led to a shortage of freight space on trains used for shipping.
In response, freight rates rose.
Both the quantity of grain to be shipped declined a bit, and the amount of rail cars available rose, eliminating the shortage.

Slide 3-80
More students have pursued academic careers in economics, increasing the supply of instructors.
The demand for all college professors has declined, as private colleges have lost endowment income and state universities have experienced funding cutbacks.
The simultaneous increase in supply and decrease in demand has lowered salaries for economics instructors.
Issues and Applications: Your Economics Instructor’s Salary
May Be Lagging

Slide 3-81
Issues and Applications: Your Economics Instructor’s Salary
May Be Lagging
Figure 3-12
Slide 3-82
Summary Discussion of Learning Objectives
The law of demand says that prices and quantity demanded are inversely related.
Relative prices must be distinguished from money, since people respond to changes in relative prices.

Slide 3-83
Summary Discussionof Learning Objectives
A change in quantity demanded versus a change in demand– A change in quantity demanded is a
movement along the same demand curve
– A change in demand is a shift of the whole demand curve
The law of supply states that price and quantity supplied are directly related.

Slide 3-84
Summary Discussion of Learning Objectives
A change in quantity supplied versus a change in supply
– A change in quantity supplied is a movement along the same supply curve
– A change in supply is a shift of the whole supply curve
Slide 3-85
Summary Discussion of Learning Objectives
Determining market price and equilibrium quantity– The demand and supply curves intersect
at the equilibrium point.
– Shortages exist when the price of a good is below the market price.
– Surpluses exist if the price of the good is greater than the market price.

End of Chapter 3Demand and Supply