chapter 3: home videogame platformsrobinlee/papers/handbookvgames.pdfslice of the entire industry {...
TRANSCRIPT

Chapter 3: Home Videogame Platforms
Robin S. Lee∗
March 2011
Abstract
This chapter provides an overview of the home videogame industry and discusses re-cent economic research on modeling the strategic interactions of involved firms andconsumers. I primarily focus on empirical methods to estimate demand and supply forboth videogame hardware and software, but also highlight other topics well suited forfurther exploration including richer models of platform competition and the impact ofexclusive vertical arrangements on industry structure and welfare.
1 Introduction
What began with a box called Pong that bounced a white dot back-and-forth between
two “paddles” on a television screen has now blossomed into a $60B industry worldwide,
generating $20B annually in the United States alone.1 Today, videogames are a serious
business, with nearly three-quarters of US households owning an electronic device specifically
used for gaming, and many predicting that figure to increase in the coming years.2 Given
the widespread adoption of a new generation of videogame systems introduced in 2006 and
the ever growing popularity of online and on-the-go gaming, videogames are also no longer
strictly the stuff of child’s play: surveys indicate 69% of US heads of households engage
in computer and videogames, with the average age of a player being 34 years old.3 As
∗Stern School of Business, New York University. Contact: [email protected]. All errors are my own.1 DFC Intelligence, 2009. 2010 Essential Facts, Entertainment Software Association2Ibid.3Ibid.
1

newer devices continue to emerge with even more advanced and immersive technologies, it
is likely that videogames will continue to play an ever increasing role in culture, media, and
entertainment.
Owing no small part to this success, the videogame industry has been the subject of a
growing number of studies and papers. This chapter focuses on research within a particular
slice of the entire industry – the home videogame console market – which on its own is a
fertile subject for economic research, both in theory and empirics. As a canonical hardware-
software market rife with network effects (c.f., Katz and Shapiro (1985); Farrell and Saloner
(1986)), videogames are an ideal setting to apply theoretical models of platform competition
and “two-sided markets”; and as a vertical market dominated on different sides by a small
number of oligopolistic firms, videogames provide an opportunity to study issues related
to bilateral oligopoly and vertical contracting. Furthermore, with the development of new
empirical methods and tools, data from the videogame market can be used to estimate
sophisticated models of dynamic consumer demand, durable goods pricing, and product
investment and creation. By focusing solely on videogames, economic research can inform
our analysis of other related markets in technology, media, or even more broadly defined
“platform”-intermediated markets.
This chapter is organized as follows. I first provide a brief overview of the industrial
organization of videogames, and emphasize the key features which distinguish it from other
similar hardware-software markets. Second, I survey economic research on videogames, fo-
cusing primarily on models of consumer and firm (both hardware and software) strategic
behavior; I also highlight potential avenues for future research, particularly with respect
to platform competition. Finally, I conclude by discussing how these economic models can
help us better understand vertical and organizational issues within the industry, such as the
impact of exclusive contracting and integration between hardware platforms and software
developers on industry structure and welfare.
2

2 The Industrial Organization of Home Videogames
Hardware Today firms in a variety of industries produce hardware devices which vary
widely in size, portability, and functionality for the purpose of electronic gaming. However,
as has been the case for most of the four-decade history of the home videogame industry,
these devices are primarily stationary “boxes” which require a monitor or television set for
use. Referred to as consoles or platforms, these devices are standardized computers tailored
for gaming and produced by a single firm. Approximately 53% of households in the US are
estimated to own a videogame console or handheld system.4
For the past decade, the three main console manufacturers or platform providers have
been Nintendo, Sony, and Microsoft. Nintendo, originally a Japanese playing card com-
pany founded in the late 19th century, is the most experienced veteran of the three: it has
manufactured videogame consoles since the late 1970’s, and is the only firm whose primary
(and only) business is videogames. Its Nintendo Entertainment System (NES), released first
in Japan in 1983 and two years later in the US, was the first major videogame platform
to achieve global success. Nintendo has since released several consoles, including the most
recent “Wii” in 2006; the Wii was one of the first to incorporate a novel motion-sensing
interface and credited for expanding the appeal of home videogaming to a broader audience.
The other two console manufacturers entered many years after Nintendo’s NES system
dominated the market. Sony released its first videogame console – the Playstation – in
1995.5 One of the first consoles to use games produced on CDs as opposed to more expensive
cartridges, the Playstation would sell over 100M units in its lifetime and establish Sony as
the dominant console manufacturer at the turn of the 21st century. The Playstation has had
two successors: the PS2, released in 2000, became the best selling console in history with
over 140M units sold;6 and the PS3, released in 2006, is perhaps most famous for being one
of the most expensive videogame consoles ever produced. Finally, Microsoft, as the newest
42010 Media Industry Fact Sheet, Nielsen Media Research.5Sony also released a general purpose computer system called the MSX in 1983 that could be used for
gaming.6http://www.scei.co.jp/corporate/release/100118e.html.
3

of the three console manufacturers, entered the home videogame market in 2001 with the
Xbox console; it later followed it up with the Xbox360 in 2005. 41% of US households are
estimated to own at least one of the three newest consoles.7
In general, hardware specifications for a given console remain fixed over its lifetime to
ensure compatibility with any games produced for that console; only by releasing a new
console could a firm traditionally introduce new hardware with more powerful processing
power and graphical capabilities. A new set of consoles has historically been launched
approximately every five years – thus heralding a new “generation” within the industry;
however, due to the large sunk-cost associated with development of new consoles, the desire
of hardware manufacturers to recoup initial investments, and the shift towards upgrading
existing consoles via add-on accessories, the length between new generations is likely to
increase in the future.8
Although this chapter focuses on home videogame consoles, there is still a large market
for dedicated portable gaming devices, currently dominated by Sony and Nintendo, and
gaming on multi-function devices, such as smartphones and media players (e.g, Apple’s iPod
and iPhone). In addition, although personal computers (PCs) have always been able to
play games, their significance as traditional videogame platforms is small: less than 5% of
videogame software revenues today derive from PC game sales (though this may change in
the future given the rise of online gaming via virtual worlds or social networks).9
Finally, just as other devices in other industries have been adding videogaming capabil-
ities, videogame consoles too have been adding greater functionality: e.g., today’s consoles
also function as fully independent media hubs with the ability to download and stream
movies, music, television, and other forms of digital content over the Internet. Videogame
consoles, thus, sit squarely amidst the convergence battle between personal computers and
other consumer electronic devices.
72010 Media Industry Fact Sheet, Nielsen Media Research.8“Natal vs Sony Motion Controller: is the console cycle over?” guardian.co.uk, February 26, 2010.9ESA 2010 Essential Facts.
4

Software and Games In addition to console manufacturers, the videogame industry also
comprises firms involved in the production of software or games.10 These firms can be
roughly categorized into two types: developers or development studios, who undertake the
programming and creative execution of a game; and publishers, who handle advertising, mar-
keting, and distribution efforts. This distinction is not necessarily sharp: most publishers are
integrated into software development, often owning at least one studio; and although inde-
pendent software developers exist, they often have close relationships with a single software
publisher for financing in exchange for distribution and publishing rights. Such relationships
may appear to be similar to integration insofar they are often exclusive, and have become
standard for independent developers as the costs of creating games have dramatically in-
creased over time.11
Console manufacturers also historically have been and continue to be integrated into
software development and publishing. Any title produced by a console manufacture’s own
studios or distributed by its own publisher is referred to as a first-party title, and is exclusive
to that hardware platform. All other games are third-party titles and are developed and
published by other firms.
Much like videogame hardware, videogame software is predominantly produced by a
handful of large firms: the top 10 publishers, which also includes the main three console
manufacturers, produce over 70% of all games sold, with the largest (Electronic Arts) com-
manding a 20% market share. Furthermore, individual games have been increasingly ex-
hibiting high degrees of sales concentration with the emergence of “killer applications” and
“hit games.” During the “sixth generation” of the industry between 2000 and 2005, nearly
1600 unique software titles were released for the three main consoles; however, the top 25
titles on each system comprised 25% of total software sales, and the top 100 titles over 50%.
Since then, a handful of titles have sold millions of copies with some games even generating
10Originally, the first videogame consoles were essentially integrated hardware and software devices pro-vided by a single firm; not until after 1976, with the release of the Fairchild System F and the Atari VCS,were other firms able to produce software for videogame consoles via the use of interchangeable cartridges.
11Average costs reached $6M during the late 1990’s (Coughlan, 2001), and today can range between $20- 30M for the PS3 and Xbox360 (“The Next Generation of Gaming Consoles,” CNBC.com, June 12, 2009).
5

over $1B in sales on their own.12
Finally, unlike hardware, the lifetime of a particular game is fairly short: typically half of
a game’s lifetime sales occur within the first 3 months of release, and very rarely do games
continue to sell well more than half a year from release.
Network Effects and Pricing Since consoles have little if any stand-alone value, con-
sumers typically purchase them only if there are desirable software titles available. At the
same time, software publishers release titles for consoles that either have or are expected
to have a large installed base of users. These network effects exhibited between both sides
of the market are manifest in most hardware-software industries, and are partly a reason
for the complex form of platform pricing exhibited by videogame platforms: most platform
providers subsidize the sale of hardware to consumers, selling them close to or below cost,
while charging publishers and developers a royalty for every game sold (Hagiu, 2006; Evans,
Hagiu, and Schmalensee, 2006). This “razor blade” model was initially used by Atari with
the release of its VCS console in 1977 – Atari originally sold its hardware at a very slight
margin, but its own videogame cartridges at a 200% markup (Kent, 2001) – and Nintendo
was the first to charge software royalties with its NES system nearly a decade later.13 As a
result, most platform profits have been and continue to be primarily derived not from hard-
ware sales, but rather from software sales and royalties.14 Note this stands in contrast to
the traditional pricing model in PCs, where the operating system (e.g., Microsoft Windows)
is typically sold to the consumer at a positive markup, yet no royalties or charges are levied
on third-party software developers.
For the past two generations of videogame consoles, initial losses incurred by platform
providers due to this pricing scheme have been substantial: e.g., the original Xbox had
estimated production costs of at least $375 yet sold for an introductory price of $249; in the
12E.g., “Call of Duty: Modern Warfare 2 tops $1 billion in sales,” Los Angeles Times, January 14, 2010.133DO was a console manufacturer who tried a different pricing scheme by significantly marking up its
hardware console, but charging no software royalties. 3DO survived for 3 years before filing for bankruptcyin 2003 (Brandenburger, 1995).
14See Hagiu, “Software Platforms,” chapter 3 in this handbook for more discussion.
6

first four years of existence, Microsoft was estimated to have lost $4B on the Xbox division
alone.15 However, as costs for console production typically fall over time faster than the retail
price, a console manufacturer’s profits on hardware typically increases in the later years of
a generation: e.g., Sony in 2010 announced it finally was making a profit on its PS3 console
3.5 years after it launched;16 a similar path to profitability was followed by Sony’s PS2 after
its release. There are, however, some exceptions: e.g., Nintendo’s current generation Wii
console was profitable from day one and was never sold below cost.17
Porting, Multi-homing, and Exclusivity Typically within a generation, games devel-
oped for one console are not compatible with others; in order to be played on another console,
the game must explicitly be “ported” by a software developer and another version of the
game created.18 Due to the additional development and programming time and expense to
develop additional versions of the game, the porting costs of supporting an additional console
can be as high as millions of dollars for the current generation of systems.19
During the early years of the videogame industry (pre-1983), any firm who wished to
produce a videogame could develop and release a game for any console which utilized car-
tridges or interchangeable media. However, many console manufacturers recouped console
development costs from the sale of their own games, and saw the sale of rival third-party
games as a threat; some console manufacturers even sued rival software developers to (un-
successfully) keep them off their systems (Kent, 2001). The inability to restrict the supply
of third-party software led to a subsequent glut of games released in the early 1980s, many
of low quality; in turn, this partially caused the videogame market crash of 1983 in which
demand for videogame hardware and software suddenly dried up. Whereas there used to be
15 ”Will Xbox drain Microsoft?,” CNET News, March 6, 2001. ”Microsoft’s Midlife Crisis,” Forbes,September 13, 2005.
16”Sony Eyes Return to Profit,” Wall Street Journal, May 14, 2010.17”Nintendo takes on PlayStation, Xbox,” Reuters, September 14, 2006.18A notable exception is “backwards compatibility,” which refers to the ability of a new console to use
software developed for the previous version of that particular console. E.g., the first version of the PS3 couldplay PS2 games, and the PS2 could play PS1 games; the Xbox360 can play Xbox games.
19Industry sources; Eisenmann and Wong (2005) cite $1M as the porting cost for an additional console forthe sixth generation of platforms.
7
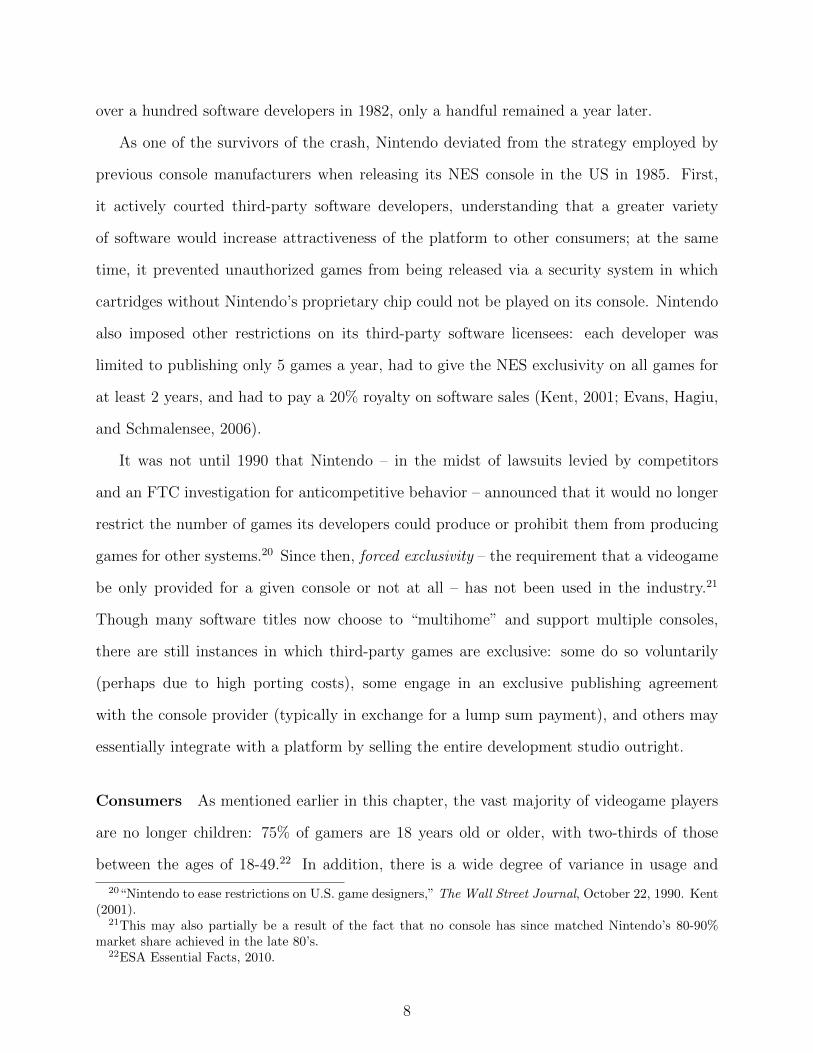
over a hundred software developers in 1982, only a handful remained a year later.
As one of the survivors of the crash, Nintendo deviated from the strategy employed by
previous console manufacturers when releasing its NES console in the US in 1985. First,
it actively courted third-party software developers, understanding that a greater variety
of software would increase attractiveness of the platform to other consumers; at the same
time, it prevented unauthorized games from being released via a security system in which
cartridges without Nintendo’s proprietary chip could not be played on its console. Nintendo
also imposed other restrictions on its third-party software licensees: each developer was
limited to publishing only 5 games a year, had to give the NES exclusivity on all games for
at least 2 years, and had to pay a 20% royalty on software sales (Kent, 2001; Evans, Hagiu,
and Schmalensee, 2006).
It was not until 1990 that Nintendo – in the midst of lawsuits levied by competitors
and an FTC investigation for anticompetitive behavior – announced that it would no longer
restrict the number of games its developers could produce or prohibit them from producing
games for other systems.20 Since then, forced exclusivity – the requirement that a videogame
be only provided for a given console or not at all – has not been used in the industry.21
Though many software titles now choose to “multihome” and support multiple consoles,
there are still instances in which third-party games are exclusive: some do so voluntarily
(perhaps due to high porting costs), some engage in an exclusive publishing agreement
with the console provider (typically in exchange for a lump sum payment), and others may
essentially integrate with a platform by selling the entire development studio outright.
Consumers As mentioned earlier in this chapter, the vast majority of videogame players
are no longer children: 75% of gamers are 18 years old or older, with two-thirds of those
between the ages of 18-49.22 In addition, there is a wide degree of variance in usage and
20“Nintendo to ease restrictions on U.S. game designers,” The Wall Street Journal, October 22, 1990. Kent(2001).
21This may also partially be a result of the fact that no console has since matched Nintendo’s 80-90%market share achieved in the late 80’s.
22ESA Essential Facts, 2010.
8
purchasing behavior across consumers: in 2007, Nielsen estimated the heaviest using 20%
of videogame players accounted for nearly 75% of total videogame console usage (by hours
played), averaging 345 minutes per day. Furthermore, although on average 6-9 games were
sold per console between 2000-2005, “heavy gamers” reported owning collections of over 50+
games,23 and on average purchased more than 1 game per month.24
3 Economics of the Videogame Industry
Although there exist active markets for PC and portable gaming, most research on videogames
has focused on the home videogame market. This is not without reason. First, the home
videogame industry is convenient to study since all relevant firms within a generation are
known, and there exist data containing a list of all software produced for nearly all of the
consoles released in the past three decades. Compare this to the PC industry, where there
are thousands of hardware manufacturers and product varieties, and even greater numbers
of software developers and products; obtaining detailed price and quantity information, e.g.,
on the universe of PC configurations, accessories, and software products would be infeasible.
Secondly, there are relatively few substitutes to a home videogame console, allowing for a
convenient market definition. Finally, as videogame consoles have been refreshed over time,
there is the potential for testing repeated market interactions across multiple generations.
This section provides a brief (and thus by no means comprehensive) review of recent
economic research on the home videogame industry, and emphasizes both the advances and
limitations of the literature in capturing important features and dynamics of the market. As
understanding the interactions between the three major types of players in the industry –
software firms, hardware firms, and consumers – provide the foundation for any subsequent
analysis (e.g., how industry structure or welfare changes following a policy intervention or
merger), it is unsurprising that the vast majority of papers have first focused on modeling
23“Video Game Culture: Leisure and Play Preferences of B.C. Teens,” Media Awareness Network, 2005.24“‘Digital Gaming in America Survey’ Results,” Gaming Age, August 12, 2002.
9

the strategic decisions of these agents. Only with these models and estimates in hand
have researchers have begun addressing more complicated questions including the role and
impact of vertical relationships in this industry. Across all of these fronts remain several
open questions, and I highlight those areas in which future study would prove useful.
3.1 Consumer Demand and Software Supply
As with many hardware-software industries, videogames exhibit network effects in that the
value of purchasing a videogame console as a consumer increases in the number of other
consumers who also decide to purchase that console. Although there is a direct effect in
that people may prefer owning the same videogame console as their friends or neighbors, the
primary means by which this occurs is through an indirect effect: more consumers onboard
a particular console attracts more games to be produced for that console, which in turn
makes the console an even more desirable product.25,26 Such indirect network effects also
work in the other direction: software developers may benefit from other software developers
supporting the same console in that more games attracts more consumers, which further
increases the potential returns for developing a game for that console.27
Numerous studies have attempted to empirically document or measure the strength,
persistence, and asymmetry of these kinds of network effects in a variety of industries.
Many of these original empirical papers base their analysis on models in which consumers of
competing platforms preferred to purchase the device with a greater number of compatible
software titles. As long as consumers preferred a greater variety of software products –
typically modeled via CES preferences – and certain assumptions on the supply of software
held, then a simple log-linear relationship between consumer demand for hardware and the
25This follows since games are high fixed cost, low marginal cost products: the larger the potential marketfor a game (i.e., a console’s installed base), the more likely an additional game will be produced.
26On the other hand, direct network effects are generally stronger for individual software titles, particularlygiven the rise of online play.
27Whether the negative competition effect between two substitutable games dominates this positive net-work effect depends on the relative elasticities for adoption, which in turn typically depends on how early itis in a console’s lifecycle.
10

availability of software could be theoretically shown to arise in equilibrium (c.f. Chou and
Shy (1990); Church and Gandal (1992)). Empirical research based on these types of models
include studies on adoption of CD players (Gandal, Kende, and Rob, 2000), DVD players
(Dranove and Gandal, 2003), VCRs (Ohashi, 2003), and personal digital assistants (Nair,
Chintagunta, and Dube, 2004).
In the spirit of this literature, Shankar and Bayus (2003) and Clements and Ohashi
(2005) are two of the earliest papers to empirically estimate the existence and magnitude
of network effects in the videogame industry. Whereas Shankar and Bayus (2003) assume
software supply is exogenous and not directly affected by hardware demand, Clements and
Ohashi (2005) estimate two simultaneous equations representing the two-sided relationship
between a console’s installed base of users and its games. This approach, motivated by a
static model of consumer demand and software supply, is followed by other papers analyzing
the videogame industry (e.g., Corts and Lederman (2009); Prieger and Hu (2010)), and is
useful to describe briefly here.
The model assumes a consumer’s utility from purchasing console j at time t is given by:
uj,t = β0 + xjβx + βppj,t + ξj,t︸ ︷︷ ︸δj,t
+ωNj,t + εj,t
where xj are console j’s observable characteristics (e.g., speed, processing power), pj,t the
price, Nj,t the number of available software titles for console j, ξj,t an error unobservable to
the econometrician, and εj,t a standard logit error; a consumer purchases console j at time
t if it delivers the maximum utility among all alternatives (including an outside option). As
in Berry (1994), this can be converted into a linear regression via integrating out the logit
errors and using differences in log observed shares for each product to obtain the following
estimating equation:
ln(sj,t) − ln(s0,t) = δj,t + σ ln(sj,t|j 6=0) + ωNj,t (1)
11

where sj,t, s0,t, and sj,t|j 6=0 are the share of consumers who purchase platform j, the outside
good, and platform j conditional on purchasing a console at time t. Following prior literature,
assuming a spot market for single-product software firms, free entry, and CES preferences for
software, a reduced form equation relating the equilibrium number of software titles available
to a console’s installed base of users (IBj,t) can be derived:28
ln(Nj,t) = αj + γ ln(IBj,t) + ηj,t (2)
where ηj,t is a mean-zero error. Clements and Ohashi (2005) estimate these two equations
across multiple generations of videogame consoles between 1994-2002 using price and quan-
tity information provided by NPD Group, a market research firm (which also is the source
for most of the market level data used in the majority of videogame papers discussed in this
chapter). They employ console and year dummies in estimation, use the Japanese Yen and
US dollar exchange rate and console retail prices in Japan as an instrument for price, and
use the average age of software titles onboard each system as an instrument for the installed
base.
The main objects of interest are ω and γ in (1) and (2), which represent the responsiveness
of consumer demand to the number of software titles, and vice versa. In Clements and Ohashi
(2005) and similar studies, these coefficients are found to be significant and positive, which
are interpreted as evidence of indirect network effects.29 Furthermore, these studies often
show that such coefficients vary over time: e.g., Clements and Ohashi (2005) include age-
interaction effects with installed base in (2), and find that the responsiveness of software
to installed base decreases over lifetime of videogame console; similarly, Chintagunta, Nair,
and Sukumar (2009) use an alternative hazard rate econometric specification of technology
adoption and find that strength of network effects also varies over time, and that the number
28See also Dube, Hitsch, and Chintagunta (2010) for the derivation of a similar estimating equation.29Corts and Lederman (2009) also find evidence of “cross-platform” network effects from 1995-2005: i.e.,
given the ability of software to multihome, software supply for one console was shown to be responsive tothe installed bases across all platforms; as a result, users on one console could benefit from users on anotherincompatible console in that their presence would increase software supply for all consoles.
12
of software titles and prices have different effects on demand in later versus earlier time
periods. Both of these studies find price elasticities for a console diminish as consoles get
older.
It is worth stressing (as these papers have) that these estimates come from a static model,
and care must be used when interpreting estimated parameters. There are several reasons
a static model may not be ideal for analyzing this industry. Since consoles and games are
durable goods, consumers do not repurchase the same product which typically is implied
by a static model without inventory consideration; additionally, forward-looking consumers
may delay purchase in anticipation of lower prices or higher utility from consumption in
future periods (which may partially explain the strong seasonal spike in sales around the
holidays). Failing to account for both the durability of goods and the timing of purchases
can bias estimates of price and cross-price elasticities (c.f. Hendel and Nevo (2006)) as well
as other parameters – including the strength of network effects.
Most importantly, however, a static model does not allow consumers to anticipate future
software releases when deciding when to purchase a console; since consoles are durable, con-
sumers in reality base their hardware purchasing decisions on expectations over all software
on a platform, including those titles that have not yet been released. Hence, the right hand
side a consumer’s utility function for a console should reflect this. Thus, insofar that ω can
be estimated, it at best represents the extent to which current software variety reflects a
consumer’s expectation over the stock of current and future games. That estimated coeffi-
cients for these static models are shown to vary across time and even across consoles suggest
dynamic issues are at play, and the underlying relationship between consumer demand and
software availability may be significantly more complex.
Dynamics and Software/Consumer Heterogeneity In response to these concerns,
researchers have begun incorporating dynamics into their analysis of consumer demand for
videogames. For instance, Dube, Hitsch, and Chintagunta (2010) utilize a dynamic model
in which forward looking consumers time their purchases for consoles based on expectations
13

of future prices and software availability; using a two-step estimator, they are also able
to simultaneously estimate a console provider’s optimal dynamic pricing function. Using
estimates from their model, the authors study how indirect network effects can lead to
greater platform market concentration, and illustrate how, in spite of strong network effects,
multiple incompatible platforms can co-exist in equilibrium.
Nonetheless, this dynamic model of hardware demand still maintains the assumption
used in the previous empirical network effects literature that consumers respond to software
“variety,” which can be proxied by the number of available software titles, and that software
variety can still be expressed as a reduced form function of each platform’s installed base (e.g.,
as in (2)). This may have been a reasonable assumption for these papers which primarily
focused on the period up until and including the 32/64 bit generation of videogames (roughly
pre-2000). However, as mentioned previously, the past decade has seen the dominance of
hit games where a small subset of software titles captured the majority of software sales
onboard a console. Given the increasing variance in software quality and skewed distribution
of software sales, a model specifying consumer utility as a function only of the number of
software titles as opposed to the identity of individual games – although tractable and
analytically convenient – may be of limited value in analyzing the most recent generations
of the videogame industry as well as other “hit-driven” hardware-software markets.
Mirroring the necessity to control for software heterogeneity in videogames is the addi-
tional need to control carefully for consumer heterogeneity. As has been previously discussed,
the variance across consumers in the number of games purchased and hours spent playing
games has been well documented, and capturing this rich heterogeneity is important for
accurate estimates of product qualities and demand parameters. Although controlling for
consumer heterogeneity is also important in a static setting, doing so in a dynamic context
adds an additional complexity in that the characteristics of consumers comprising the in-
stalled base of a console evolves over time. E.g., since early adopters of videogame consoles
are predominantly consumers with high valuations for videogames, software released early
in a console’s lifetime face a different population of consumers than a game that is released
14
after a console is mature. Failing to correct for this consumer selection across time will bias
upwards estimates of early-released games’ qualities, and bias downwards estimates of games
released later. In turn, the magnitudes of these parameters underly incentives for almost
all strategic decisions on the part of firms: e.g., firms may engage in intertemporal price
discrimination (initially setting high prices before lowering them) in order to extract profits
out of high valuation or impatient consumers first.
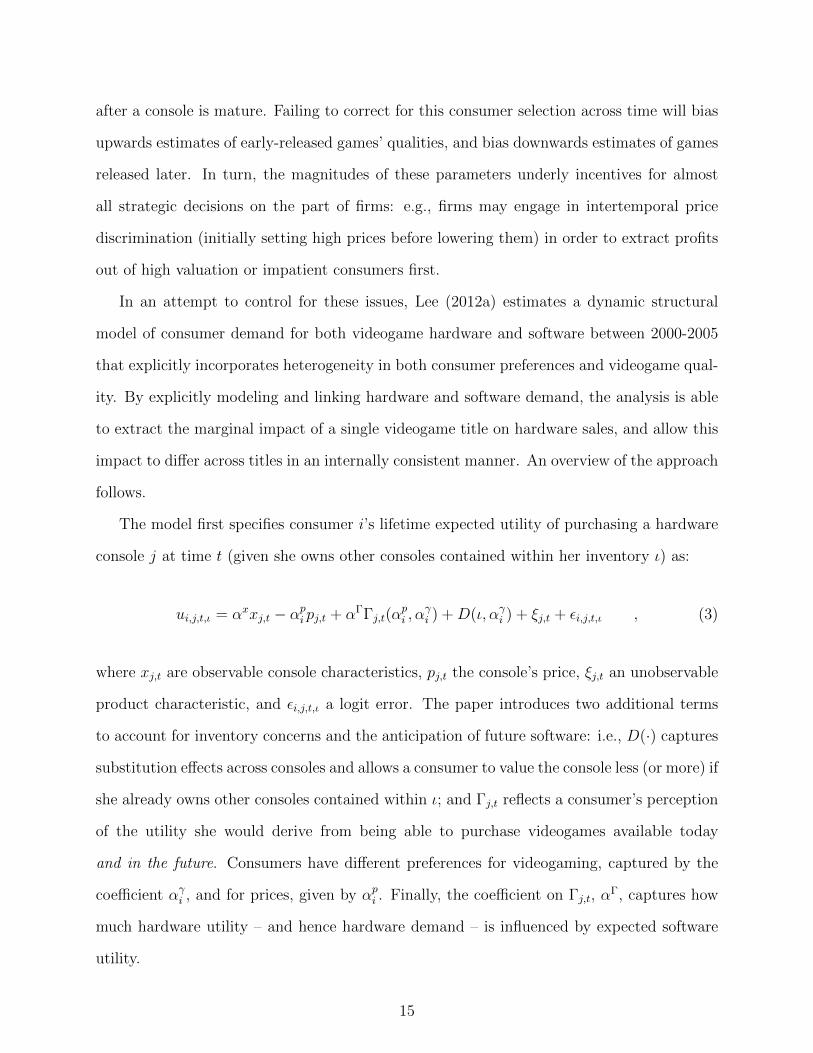
In an attempt to control for these issues, Lee (2012a) estimates a dynamic structural
model of consumer demand for both videogame hardware and software between 2000-2005
that explicitly incorporates heterogeneity in both consumer preferences and videogame qual-
ity. By explicitly modeling and linking hardware and software demand, the analysis is able
to extract the marginal impact of a single videogame title on hardware sales, and allow this
impact to differ across titles in an internally consistent manner. An overview of the approach
follows.
The model first specifies consumer i’s lifetime expected utility of purchasing a hardware
console j at time t (given she owns other consoles contained within her inventory ι) as:
ui,j,t,ι = αxxj,t − αpi pj,t + αΓΓj,t(αpi , α
γi ) +D(ι, αγi ) + ξj,t + εi,j,t,ι , (3)
where xj,t are observable console characteristics, pj,t the console’s price, ξj,t an unobservable
product characteristic, and εi,j,t,ι a logit error. The paper introduces two additional terms
to account for inventory concerns and the anticipation of future software: i.e., D(·) captures
substitution effects across consoles and allows a consumer to value the console less (or more) if
she already owns other consoles contained within ι; and Γj,t reflects a consumer’s perception
of the utility she would derive from being able to purchase videogames available today
and in the future. Consumers have different preferences for videogaming, captured by the
coefficient αγi , and for prices, given by αpi . Finally, the coefficient on Γj,t, αΓ, captures how
much hardware utility – and hence hardware demand – is influenced by expected software
utility.
15

Note that this specification of hardware demand does not use a static-period utility func-
tion, but rather lifetime expected utilities. Furthermore, the model incorporates dynamics
explicitly by assuming consumers solve a dynamic programming problem when determining
whether or not to purchase a videogame console in a given period: each consumer compares
her expected value from purchasing a given console to the expected value from purchasing
another console or none at all; furthermore, consumers can multihome and return the next
period to purchase any console they do not already own.
On the software side, the setup is similar: every consumer who owns a console is assumed
to solve a similar dynamic programming problem for each game she can play but does not
already own. This in turn allows for the derivation of the expected option value of being able
to purchase any particular title k onboard console j at time t, which is denoted EWi,j,k,t.
Finally, to link the hardware and software demand together, the model defines Γj,t as the
sum of option values for any software title k available on console j at time t (given by the
set Kj,t) plus an expectation over the (discounted) option values of being able to purchase
games to be released in the future, represented by Λj,t:
Γj,t(αpi , α
γi ; ι) =
∑k∈Kj,t
EWi,j,k,t
︸ ︷︷ ︸
(i) Current Software Utility
+ Λj,t(αpi , α
γi ; ι)︸ ︷︷ ︸
(ii) (Expected) Future Software Utility
, (4)
Lee (2012a) estimates the underlying structural parameters of the model, which include
product fixed effects for every console and game and consumer preferences over price and
software availability, utilizing techniques pioneered in Rust (1987), Berry (1994), and Berry,
Levinsohn, and Pakes (1995), and later synthesized in a dynamic demand environment by
Melnikov (2001) and Gowrisankaran and Rysman (2011).30 An important extension involves
30Estimation of the model follows by matching predicted market shares for each hardware and softwareproduct over time from the model with those observed in the data (obtained from the NPD Group), andminimizing a GMM criterion based on a set of conditional moments. The main identifying assumption is thatevery product’s one dimensional unobservable characteristic (for hardware, represented by ξ in (3)) evolvesaccording to an AR(1) process, and innovations in these unobservables are uncorrelated with a vector ofinstruments.
16

controlling for the selection of consumers onto consoles across time which requires the simul-
taneous estimation of both hardware and software demand.
Estimates indicate that although the vast majority of titles had a marginal impact on
hardware demand, the availability of certain software titles could shift hardware installed
bases by as much as 5%; furthermore, only a handful of such “hit” titles are shown to have
been able to shift hardware demand by more than 1% over the lifetime of any given console.
A model which assumed consumers valued all titles equally would thus lead to drastically
different predictions on the impact and magnitudes of software on hardware demand. Lee
(2012a) also demonstrates that by failing to account for dynamics, consumer heterogeneity,
and the ability for consumers to purchase multiple hardware devices, predicted consumer
elasticities with respect to price and software availability would be substantially biased.
As is often the case, however, several strong assumptions are required for this more com-
plicated analysis. First, for tractability, consumers perceive each software title onboard a
system as an independent product.31 Second, consumers have rational expectations over a
small set of state variables which are sufficient statistics for predicting future expected utili-
ties. Although the consistency of beliefs with realized outcomes may have been a reasonable
assumption for the period examined, there may be other instances for which it may not be
well suited: e.g., Adams and Yin (2010) study the eBay resale of the newest generation of
videogames consoles released in 2006, and find that prices for pre-sale consoles rapidly adjust
after they are released.32
Software Supply and Pricing Accompanying the development of more realistic models
for consumer demand have been richer models for software supply which treat software firms
as dynamic and strategic competitors. One strain of literature focused on the optimal pricing
of videogame software, itself a general durable goods market with forward looking consumers.
31Since videogames are durable goods, keeping track of each consumers’ inventory and subsequent choicesets for over 1500 games was computationally infeasible. However, both Nair (2007) and Lee (2012a) provideevidence which suggests independence may not be unreasonable for videogames.
32Whether or not consumer beliefs can be estimated or elicited without imposing an assumption such asrational expectations is an important area of research for dynamic demand estimation in general.
17

Nair (2007) combines a model of dynamic consumer demand for videogame software with a
model of dynamic pricing, and finds that the optimal pricing strategy for a software firm is
consistent with a model of “skimming”: charging high prices early to extract rents from high
value (or impatient) consumers before dropping prices over time to reach a broader market.
This corresponds to the pricing patterns observed in the data: the vast majority of games
on a console are released at a single price point (e.g., $59.99), and prices fall in subsequent
periods.33
Inevitably, studies on pricing can only be conducted on games which have been already
released for a particular platform; moving one step earlier in a software developer’s decision
process is the choice of which console to join. A first-party game has historically only been
released exclusively on the integrated platform; however, a third-party software developer
has a strategic choice: it can release a title on multiple platforms in order to reach a larger
audience but pay additional porting costs, or it can develop exclusively for one console and
forgo selling its game to consumers on other platforms.
Lee (2012b) models what can be considered software’s “demand” for a platform. As
in consumer demand, dynamics are important in this decision as well: since each software
publisher makes this choice months before a game’s release and since a game remains on
the market for at least several months, a software developer anticipates changes in future
installed bases of each console as well as the subsequent choices of other software developers
when comparing expected profits of different actions. Using both the consumer demand
estimates and similar assumptions used in Lee (2012a), the model computes a dynamic
rational expectations equilibrium in which every software title chooses the optimal set of
platforms to develop for while anticipating the future actions (and re-actions) of other agents.
A key input into the model, however, are porting costs for supporting different sets
of consoles. These are typically unobserved. Lee (2012b) estimates these costs for games
33Nair (2007) provides anecdotal evidence that managers follow rules-of-thumb pricing strategies in whichprices are revised downward if sales are low for a game, and keep prices high if sales are high. There is alsoevidence that consumers prefer newer games over older ones (e.g., Nair (2007) and Lee (2012a) both findsignificant decay effects in the quality of a game over time).
18

released between 2000-2005 under the revealed preference assumption that games released in
the data were released on the subset of platforms which maximized their expected discounted
profits.34 Via an inequalities estimator developed in Pakes, Porter, Ho, and Ishii (2006),
relative differences in porting costs can be estimated. Estimates show significant variance
in costs depending on the genre or type of game being ported, and that some consoles
are cheaper (e.g., Xbox) than others (e.g., PS2) to develop for. On average, costs for this
generation are approximately $1M per additional console, which are roughly in line with
industry estimates.
The final step back in the software production sequence involves the creation and develop-
ment of new games. This represents the least developed area of research on software supply,
and is the remaining key step in completely unpacking the mechanism which generates the
reduced form relationship shown to exist between installed base of a console and software
availability. On this front are issues related to an investment-quality tradeoff for game de-
velopment, a product positioning decision of what genre or type of game to produce, timing
games with release dates as with motion pictures (Einav (2007)), and the make-or-buy deci-
sion faced by a software publisher who can either engage in an arms-length contract with an
independent developer or integrate into software development. Although some papers have
studied whether integration with a console provider improves game quality,35 there remains
much to be done.
3.2 Platform Competition
Most of the analysis discussed so far has held fixed the actions of each platform, including
choices of royalty rates charged to third-party software providers, development or porting
costs, and integration or exclusive contracting decisions. Understanding these decisions
34The analysis ignores games that are contractually exclusive, which are discussed later in this chapter; itfurthermore assumes publishers maximize profits individually for each game.
35E.g., Gil and Warzynski (2009) study videogames released between 2000-2007 and find reduced formevidence that indicates once release timing and marketing strategies are controlled for, vertically integratedgames are not of higher quality than non-integrated games. However, regressions on the software fixed effectsrecovered in Lee (2012a) for a similar time period show first-party games are generally of higher quality.
19

from a theoretical perspective is complicated; the ability to analyze these strategic choices is
further confounded by the absence of detailed data on these objects of interest (i.e., royalties,
costs, and contracts). Even so, understanding how videogame platforms compete with one
another for consumers and software firms is not only perhaps the most important aspect of
this industry, but also the one that is the most relevant and generalizable to other hardware-
software markets and platform industries. Thus overcoming these challenges should be the
focus of future efforts.
Pricing The most developed area of research on platform strategy has been on the pricing
of hardware consoles: both Dube, Hitsch, and Chintagunta (2010) and Liu (2010) estimate
dynamic models of hardware pricing to consumers, and highlight the importance of indirect
network effects in explaining observed pricing patterns and rationalizing console “penetration
pricing” – that is, consoles are typically priced below marginal costs, but as marginal costs
fall faster than prices, margins tend to increase over time. Dube, Hitsch, and Chintagunta
(2010) further note that the presence of network effects are not sufficient on their own to
make penetration pricing optimal, and rather that these effects need be sufficiently strong.
Nonetheless, these analyses hold fixed prices charged by platforms to the “other side”
of the market in that the supply of software is only dependent on the installed base of
consumers onboard a console, and not the royalty rates levied by the console. Of course, in
reality these royalties are as much a strategic decision as the price charged to consumers,
and in many ways are just as important to a platform’s success. E.g., Sony charged a much
lower royalty than Nintendo when it introduced its Playstation console ($9 as opposed to
$18) which helped it attract a greater number of third-party software developers (Coughlan,
2001).
To determine the optimal royalty, it’s useful to understand why they need be positive at
all. The theoretical two-sided market literature (c.f. Armstrong (2006); Rochet and Tirole
(2006); Weyl (2010)) has focused on precisely this question in related networked industries,
and emphasized how changing the division of pricing between sides of a platform market can
20

affect platform demand and utilization; Hagiu (2006) focused on the videogame industry
in particular, and analyzed the relationship between a console’s optimal royalty rate and
optimal hardware price. As noted before, the videogame industry differs from most other
hardware-software markets such as the PC industry in that the majority of platform profits
derive not from the end user or consumer, but rather from the software developers in the
form of royalty payments. However, providing a single explanation of why this occurs within
the videogame industry proves difficult, as many theory models indicate which side can
multihome, how much one side responds and values the participation of the other, and the
heterogeneity in such preferences can drastically influence the optimal division of prices.36
Thus, there may be many forces at work; Hagiu (2009) provides another explanation, in
which the more that consumers prefer a variety of software products, the greater a platform’s
profits derive from software in equilibrium.
There are difficulties testing these alternative explanations in the data. First, although
obtaining measurements of elasticities of consumers with respect to software (and vice versa)
is possible, estimating how software supply would change in response to a change in royalty
rates is difficult; not only is data on royalty rates difficult to come by, but typically they do
not change for a particular console during its lifetime and hence there is little identifying
variation.37 Secondly, given that certain hit software titles dominate the market and games
are supplied increasingly by publishers with market power, it is an open question whether
the theoretical results still apply when one side of the market no longer are price-takers but
rather strategic oligopolists.
Porting Costs and Compatibility Another decision on the part of console manufac-
turers that has not widely been studied is the ability of a platform provider to affect the
costs of developing or “porting” to its console. The theoretical literature has studied the
role of switching costs in influencing market share and power in general networked industries
36See also Evans, Hagiu, and Schmalensee (2006) for discussion.37Appealing to cross-platform variation in royalty rates would require considerable faith that other console
specific factors affecting software supply can be adequately controlled for.
21

(c.f. Farrell and Klemperer (2007)), and these issues are central in the videogame market
as well. E.g., anecdotal evidence suggests that one of the main reasons for Sony’s success in
entering the videogame market was that it was easier and cheaper to develop for the Sony
Playstation than rival consoles at the time: in addition to having lower royalty rates, Sony
actively provided development tools and software libraries to third party developers, and it
utilized CDs as opposed to more costly cartridges (the format used by Nintendo consoles at
the time). Incidentally, Microsoft also leveraged lower development costs as a selling point
of its first console: as essentially a modified Microsoft Windows PC with an Intel CPU, the
Xbox was extremely easy for existing PC developers to adjust to and develop games for
(Takahashi, 2002).
Relatedly, platform providers can also decide whether or not to make games compatible
across consoles, as opposed to forcing developers to make different versions. Although cross-
platform compatibility across competing consoles has not been witnessed (instead, requiring
software developers to port and create multiple versions of a game), a platform provider
could allow for backwards compatibility – i.e., a new console being able to play games
released for the previous generation console. One widely cited advantage of Sony’s PS2
over its competitors at the time was its compatibility with original Playstation games; this
gave it an accessible library of over a thousand games upon release, easily surpassing the
number of playable titles on any of its competitors.38 Interestingly, the PS3 initially could
play PS2 games, but newer versions of the console eliminated this ability; this suggests that
the benefits to backwards compatibility are most substantial early in a console’s life before
current-generation games are widely available, and later may not be worth the cost.39
Exclusivity & Integration Although there is some degree of hardware differentiation
across consoles, the primary means by which consoles compete with one another for con-
sumers (in addition to price) is through the availability of exclusive games.40 Before Sony
38Nintendo and Microsoft followed suit with their seventh generation consoles.39The original PS3 console included the PS2 graphic chip, which was eliminated in subsequent versions.40Clearly, any game that multihomes and is available on multiple systems yields no comparative advantage
across consoles.
22
entered the videogame business in 1993 with its Playstation console, it purchased a major
software developer in addition to securing agreements for several exclusive titles (Kent, 2001).
Similarly, before launching the Xbox in 2001, Microsoft bought several software developers to
produce exclusive games; many attribute the (relative) success of Microsoft’s Xbox console
to its exclusive game Halo, acquired in 2000. In both instances, having high-quality games
available with the release of a console that were not available on competitors contributed to
greater sales.
A platform typically obtains an exclusive game in one of two ways: via internal devel-
opment by a integrated developer, or via payment to a third party developer. In recent
years as development costs for games have been increasing and porting costs have fallen as
a percentage of total costs, most third-party titles have chosen to multihome and support
multiple consoles in order to maximize their number of potential buyers. Thus, even though
exclusive arrangements still occur for third-party titles, they are now increasingly used for
only a temporary period of time (e.g., six months), and console providers have become even
more reliant on their own first-party titles to differentiate themselves.
In general, understanding how platforms obtain exclusive content – either via integra-
tion or exclusive contracting – requires a model of bilateral contracting with externalities
between console manufacturers and software developers (c.f. Segal (1999); Segal and Whin-
ston (2003)). E.g., the price Sony would need to pay a software developer for exclusivity
depends crucially on how much Sony would benefit, as well as how much Sony would lose
if Microsoft obtained exclusivity over the title instead. Unfortunately, the applicability of
theory to settings with multiple agents on both sides of the market is limited (there are at
least three major console manufacturers and multiple software publishers and developers),
and is even further confounded by the presence of dynamics.41 Although static models of
41For instance, the gains to exclusivity depend on the age of the console (among other things), andplatforms may choose to divest integrated developers later. E.g., Microsoft acquired the developer Bungieprior to launch of original Xbox in 2000; in 2007, it was spun off as Microsoft reasoned Bungie would bemore profitable if it could publish for other consoles (“Microsoft, ’Halo’ maker Bungie split,” The SeattleTimes, October 6, 2007).
23

bargaining for exclusivity have been analyzed,42 a general model that can be taken to the
data and inform our ability to predict which games or developers would be exclusive, and
the determinants of the negotiated price, would be extremely useful.43
Other Concerns Ultimately, one of the biggest hurdles in bringing the theory to the data
may very well be identifying the incentives each major platform provider faces. Both Sony
and Microsoft have multiple other platform businesses which are affected by decisions made
within their videogame divisions. For example, Sony faced a much higher marginal cost
than its competitors as a result of including its proprietary Blu-ray player in its PS3 console;
such a decision was a response to its desire to win the standards battle for a next-gen DVD
format over consumer electronics rival Toshiba. In addition, Microsoft viewed the Xbox as
partly a means of protecting and expanding its Windows and PC software business during
an era of digital convergence (Takahashi, 2002). In both cases, each company sustained large
initial losses in their videogame divisions ($4B in the first 4 years of the Xbox for Microsoft,
$3.3B for Sony in the first 2 years of its PS3),44 but focusing on these numbers alone would
understate the total benefits each company received.45 Furthermore, there is again a dynamic
aspect: had Microsoft not entered in 2000 with a viable platform, it would have had a more
difficult time releasing its Xbox360 device in 2005. Determining the appropriate scope across
industries and time horizon each company faces when making strategic decisions is an open
challenge.
42E.g., Hagiu and Lee (2011) apply the framework of Bernheim and Whinston (1998) to analyze exclusivecontracting in platform industries; see also Stennek (2007).
43See Lee and Fong (2012).44“Microsoft’s Midlife Crisis,” Forbes, September 13, 2005; “PlayStation Poorhouse,” Forbes, June 23,
2008.45Further confounding matters are each console manufacturer’s online gaming businesses; Microsoft’s
online service generates over $1B a year (“Microsoft’s Online Xbox Sales Probably Topped $1 Billion,”Bloomberg, July 7, 2010), and all 3 current-generation platforms have downloadable gaming stores as well.
24

3.3 Vertical Issues
Exclusive Software for Consoles The forced exclusivity contracts employed by Nin-
tendo in the 1980’s – whereby developers could only develop exclusively for Nintendo or not
at all – were dropped under legal and regulatory pressure in 1990. Since then, many have
argued that these were anticompetitive not only in videogames (e.g., Shapiro (1999)), but
in other industries (e.g., U.S. v. Visa) as well. Nonetheless, exclusive games persist. A
natural question, thus, is whether the continued presence of exclusive first-party games de-
veloped internally by platforms, or the use of lump-sum payments by platforms in exchange
for exclusivity from third-party software developers, can be anticompetitive.
Theory has shown the effects of such exclusive vertical relationships can be ambiguous.
Such relationships can be used to deter entry or foreclose rivals (Mathewson and Winter
(1987), Rasmusen, Ramseyer, and Wiley (1991), Bernheim and Whinston (1998)), which
may be exacerbated by the presence of network externalities (e.g., Armstrong and Wright
(2007)).46 Furthermore, exclusivity can limit consumer choice and hence welfare by prevent-
ing consumers on competing platforms from accessing content, products, or services available
only elsewhere. On the other hand, exclusive arrangements may have pro-competitive ben-
efits, such as encouraging investment and effort provision by contracting partners (Marvel
(1982), Klein (1988), Besanko and Perry (1993), Segal and Whinston (2000)). In networked
industries, integration by a platform provider may be effective in solving the “chicken-and-
egg” coordination problem, one of the fundamental barriers to entry discussed in the two-
sided market literature. Furthermore, exclusivity may be an integral tool used by entrant
platforms to break into established markets: by preventing contracting partners from sup-
porting the incumbent, an entrant can gain a competitive advantage, spur adoption of its
own platform, and thereby spark greater platform competition.
Both Prieger and Hu (2010) and Lee (2012b) attempt to shed light on this question
in the context of the sixth generation of the videogame industry (2000-2005). Prieger and
46Whinston (2006), Rey and Tirole (2007), and Riordan (2008) overview the theoretical literature onvertical foreclosure and the competitive effects of exclusive vertical arrangements.
25

Hu (2010) use a demand model similar to Clements and Ohashi (2005) to show that the
marginal exclusive game does not affect console demand; consequently, the paper suggests
that a dominant platform cannot rely on exclusive titles to dominate the market. However, as
already discussed in this chapter, controlling for heterogeneity in game quality is crucial, and
cannot be captured in a model where consumers only value the number of software products:
estimates from Lee (2012a) show that games that actually could drastically affect hardware
market shares were primarily integrated or exclusively provided to only one console. Thus,
insofar the few hit games onboard the largest platform of the time period studied could
have contributed to its dominant position, exclusive vertical arrangements may have led to
increased market concentration.
To explore this possibility, Lee (2012b) conducts a counterfactual environment in which
exclusive vertical arrangements were prohibited in the industry during the time period stud-
ied: i.e., all hardware providers both could not write exclusive software or write exclusive
contracts with software providers. Using the techniques described in the previous chapter
and demand estimates from Lee (2012a), Lee (2012b) simulates forward the market struc-
ture if all consumers and games (including those that previously had been integrated) could
freely choose which platforms to purchase or join, and solves for the dynamic equilibrium of
this game. The main finding, focusing on the platform adoption decisions of consumers and
software, is that banning exclusive arrangements between hardware platforms and software
publishers would have actually benefited Sony, the dominant “incumbent” platform (with
the one-year head start and larger installed base), and harmed the two smaller platforms
(Microsoft and Nintendo) during the time period studied.
The intuition for this result is straightforward: without exclusive arrangements, the
developers of high quality software would typically multihome and support all three consoles;
lower quality titles, constrained by the costs of porting, would likely develop first for the
incumbent due to its larger installed base, and only later, if at all, developed a version for
either entrant platform. As a result, neither entrant platform would have been able to offer
consumers any differentiation or benefit over the incumbent. With exclusivity, however,
26

entrants could create a competitive advantage, and was hence leveraged by them to gain
traction in this networked industry.47
The paper still notes that even though banning exclusive vertical arrangements may have
increased industry concentration, consumers may have benefited from access to a greater se-
lection of software titles onboard any given platform: consumer welfare would have increased
during the five-year period without exclusivity since consumers could access a greater num-
ber of software titles while needing to only purchase one console. Nonetheless, the analysis
abstracts away from many potential responses to such a counterfactual policy change: e.g.,
platform providers are assumed to offer the same non-discriminatory contracts to all firms,
investment and product qualities do not change, and prices, entry, and exit of all products are
held fixed. Indeed, the paper notes that if Sony’s prices increased as a result of its increased
market share (or if either Nintendo or Microsoft exited in that generation or the subsequent
one, or software supply was adversely affected by the efficiency benefits of integration and
exclusivity) the change to consumer welfare could easily have been significantly negative.
Thus, although it does appear that both Microsoft and Nintendo benefited from the
ability to engage in exclusive dealing in this period, the effects on consumer welfare are
ambiguous; furthermore, in order to paint a complete story of the effects of integration or
exclusivity, one might also wish to examine an environment in which only certain platforms
(e.g., the incumbent or dominant player) could not engage in exclusive contracting, but others
could. Such extensions would require developing additional tools to analyze the broader set
of strategic decisions facing software and hardware firms discussed previously.
47Note that had Sony’s exclusive titles been significantly higher quality than those onboard Microsoft’s orNintendo’s consoles, this result may have been different: i.e., even though the two entrant platforms wouldhave lost their exclusive titles, they would have gained access (albeit non-exclusively) to Sony’s hit exclusivetitles. Nevertheless, demand estimates clearly indicate this was not the case. The question of how Nintendoand Microsoft were able to get access to higher quality software in the first place is beyond the scope ofthe paper, as it requires addressing questions raised in the previous section regarding software supply andhardware-software negotiations.
27

4 Concluding Remarks
The home videogame market is but a portion of the entire videogame industry, yet has
proven to be a rich testing ground for models of strategic interaction and theories of platform
competition. The literature that has developed, though still nascent, has shown the potential
for tackling and addressing myriad issues simply by studying an industry which once was
considered just a curiosity and fad.
Looking forward, the continued growth of the videogame industry has the potential for
being both a curse and a boon for research. On one hand, as videogames become even
more pervasive and intertwined with other industries, it becomes – to a certain degree –
less suited for “clean” and tractable analysis. Indeed, one of the advantages of studying
the home videogame market was precisely the relative ease in which the relevant agents and
parties could be identified; going forward, this no longer may be the case. Furthermore,
as this chapter discussed, even retrospective analysis of the videogame market when all
the players were known required sophisticated modeling techniques to handle the industry’s
complexities, which include controlling for dynamic issues and accounting for consumer and
software heterogeneity. Accounting for even more complicated strategic interactions poses a
daunting challenge.
On the other hand, the success and proliferation of videogames will continue to spawn
broader questions and improve our understanding of general networked industries. At the
heart of digital convergence is the story of dominant platforms in once separated markets
suddenly finding themselves to be competitors: much as videogame consoles encroach upon
adjacent markets such as content distribution, so to have firms in other markets – e.g., smart-
phone manufacturers, social networking platforms – ventured into the gaming business. How
this cross-industry platform competition will play out and adapt to changing environments
remains a fascinating topic for exploration.
28

References
Adams, C., and P.-L. Yin (2010): “Reallocation of Video Game Consoles on eBay,”Unpublished.
Armstrong, M. (2006): “Competition in Two-Sided Markets,” RAND Journal of Eco-nomics, 37(3), 668–691.
Armstrong, M., and J. Wright (2007): “Two-Sided Markets, Competitive Bottlenecks,and Exclusive Contracts,” Economic Theory, 32(2), 353–380, mimeo.
Bernheim, B. D., and M. D. Whinston (1998): “Exclusive Dealing,” Journal of PoliticalEconomy, 106(1), 64–103.
Berry, S. (1994): “Estimating Discrete-Choice Models of Product Differentiation,” RANDJournal of Economics, 25(2), 242–262.
Berry, S., J. Levinsohn, and A. Pakes (1995): “Automobile Prices in Market Equilib-rium,” Econometrica, 63(4), 841–890.
Besanko, D., and M. K. Perry (1993): “Equilibrium Incentives for Exclusive Dealingin a Differentiated Products Oligopoly,” RAND Journal of Economics, 24, 646–667.
Brandenburger, A. (1995): “Power Play (C): 3DO in 32-bit Video Games,” HarvardBusiness School Case 795-104.
Chintagunta, P., H. Nair, and R. Sukumar (2009): “Measuring Marketing-Mix Effectsin the Video-Game Console Market,” Journal of Applied Econometrics, 24(3), 421–445.
Chou, C., and O. Shy (1990): “Network Effects without Network Externalities,” Inter-national Journal of Industrial Organization, 8, 259–270.
Church, J., and N. Gandal (1992): “Network Effects, Software Provision, and Stan-dardization,” Journal of Industrial Economics, 40(1), 85–103.
Clements, M. T., and H. Ohashi (2005): “Indirect Network Effects and the ProductCycle: U.S. Video Games, 1994 - 2002,” Journal of Industrial Economics, 53(4), 515–542.
Corts, K. S., and M. Lederman (2009): “Software Exclusivity and the Scope of IndirectNetwork Effects in the US Home Video Game Market,” International Journal of IndustrialOrganization, 27(2), 121–136.
Coughlan, P. J. (2001): “Note on Home Video Game Technology and Industry Structure,”Harvard Business School Case 9-700-107.
Dranove, D., and N. Gandal (2003): “The DVD vs. DIVX Standard War: EmpiricalEvidence of Network Effects and Preannouncement Effects,” Journal of Economics andManagement Strategy, 12, 363–386.
Dube, J.-P., G. J. Hitsch, and P. Chintagunta (2010): “Tipping and Concentrationin Markets with Indirect Network Effects,” Marketing Science, 29(2), 216–249.
29

Einav, L. (2007): “Seasonality in the U.S. Motion Picture Industry,” RAND Journal ofEconomics, 38(1), 127–145.
Eisenmann, T., and J. Wong (2005): “Electronic Arts in Online Gaming,” HarvardBusiness School Case 9-804-140.
Evans, D. S., A. Hagiu, and R. Schmalensee (2006): Invisible Engines: How SoftwarePlatforms Drive Innovation and Transform Industries. MIT Press, Cambridge, MA.
Farrell, J., and P. Klemperer (2007): “Coordination and Lock-In: Competition withSwitching Costs and Network Effects,” in Handbook of Industrial Organization, ed. byM. Armstrong, and R. Porter, vol. 3. North-Holland Press, Amsterdam.
Farrell, J., and G. Saloner (1986): “Installed Base and Compatibility: Innovation,Product Preannouncements, and Predation,” American Economic Review, 76, 940–955.
Gandal, N., M. Kende, and R. Rob (2000): “The Dynamics of Technological Adoptionin Hardware/Software Systems: the Case of Compact Disc Players,” RAND Journal ofEconomics, 31, 43–61.
Gil, R., and F. Warzynski (2009): “Vertical Integration, Exclusivity and Game SalesPerformance in the U.S. Video Game Industry,” mimeo.
Gowrisankaran, G., and M. Rysman (2011): “Dynamics of Consumer De-mand for New Durable Goods,” http://www.u.arizona.edu/~gowrisan/pdf_papers/
dynamicdemand.pdf.
Hagiu, A. (2006): “Pricing and Commitment by Two-Sided Platforms,” RAND Journal ofEconomics, 37(3), 720–737.
(2009): “Two-Sided Platforms: Product Variety and Pricing Structures,” Journalof Economics and Management Strategy, 18(4), 1011–1043.
Hagiu, A., and R. S. Lee (2011): “Exclusivity and Control,” Journal of Economics andManagement Strategy, 20(3), 679–708.
Hendel, I., and A. Nevo (2006): “Measuring the Implications of Sales and ConsumerInventory Behavior,” Econometrica, 74(6), 1637–1673.
Katz, M., and C. Shapiro (1985): “Network Externalities, Competition, and Compati-bility,” American Economic Review, 75, 424–440.
Kent, S. L. (2001): The Ultimate History of Video Games. Three Rivers Press, New York,NY.
Klein, B. (1988): “Vertical Integration as Organizational Ownership: The Fisher Body–General Motors Relationship Revisited,” Journal of Law, Economics and Organization, 4,199–213.
30

Lee, R. S. (2012a): “Dynamic Demand Estimation in Platform and Two-Sided Markets:The Welfare Cost of Software Incompatibility,” http://pages.stern.nyu.edu/~rslee/
papers/DynDemand.pdf.
(2012b): “Vertical Integration and Exclusivity in Platform and Two-Sided Mar-kets,” http://pages.stern.nyu.edu/~rslee/papers/VIExclusivity.pdf.
Lee, R. S., and K. Fong (2012): “Markov Perfect Network Formation,” Unpublished.
Liu, H. (2010): “Dynamics of Pricing in the Video Game Console Market: Skimming orPenetration?,” Journal of Marketing Research, 47(3), 428–443.
Marvel, H. P. (1982): “Exclusive Dealing,” Journal of Law and Economics, 25, 1–25.
Mathewson, G. F., and R. A. Winter (1987): “The Competitive Effects of VerticalAgreements,” American Economic Review, 77, 1057–1062.
Melnikov, O. (2001): “Demand for Differentiated Products: The case of the U.S. Com-puter Printer Market,” Unpublished.
Nair, H. (2007): “Intertemporal Price Discrimination with Forward-looking Consumers:Application to the US Market for Console Video-Games,” Quantitative Marketing andEconomics, 5(3), 239–292.
Nair, H., P. Chintagunta, and J.-P. Dube (2004): “Empirical Analysis of IndirectNetwork Effects in the Market for Personal Digital Assistants,” Quantitative Marketingand Economics, 2(1), 23–58.
Ohashi, H. (2003): “The Role of Network Effects in the U.S. VCR Market: 1978–1986,”Journal of Economics and Management Strategy, 12, 447–496.
Pakes, A., J. Porter, K. Ho, and J. Ishii (2006): “Moment Inequalities and TheirApplication,” mimeo, Harvard University.
Prieger, J. E., and W.-M. Hu (2010): “Applications Barriers to Entry and ExclusiveVertical Contracts in Platform Markets,” Economic Inquiry, forthcoming.
Rasmusen, E. B., J. M. Ramseyer, and J. S. Wiley (1991): “Naked Exclusion,”American Economic Review, 81(5), 1137–1145.
Rey, P., and J. Tirole (2007): “A Primer on Foreclosure,” in Handbook of Industrial Or-ganization, ed. by M. Armstrong, and R. Porter, vol. 3. North-Holland Press, Amsterdam.
Riordan, M. H. (2008): “Competitive Effects of Vertical Integration,” in Handbook ofAntitrust Economics, ed. by P. Buccirossi. MIT Press, Cambridge, MA.
Rochet, J.-C., and J. Tirole (2006): “Two-Sided Markets: A Progress Report,” RANDJournal of Economics, 37(3), 645–667.
Rust, J. (1987): “Optimal replacement of GMC bus engines: An empirical model of HaroldZurcher,” Econometrica, 55, 999–1033.
31

Segal, I. (1999): “Contracting with Externalities,” Quarterly Journal of Economics, 64(2),337–388.
Segal, I., and M. D. Whinston (2000): “Exclusive Contracts and Protection of Invest-ments,” RAND Journal of Economics, 31, 603–633.
(2003): “Robust Predictions for Bilateral Contracting with Externalities,” Econo-metrica, 71(3), 757–791.
Shankar, V., and B. L. Bayus (2003): “Network Effects and Competition: An EmpiricalAnalysis of the Home Video Game Market,” Strategic Management Journal, 24(4), 375–384.
Shapiro, C. (1999): “Exclusivity in Network Industries,” George Mason Law Review, 7,673–683.
Stennek, J. (2007): “Exclusive Quality - Why Exclusive Distribution May Benefit the TVViewers,” IFN WP 691.
Takahashi, D. (2002): Opening the Xbox. Prima Publishing, Roseville, CA.
Weyl, E. G. (2010): “A Price Theory of Multi-Sided Platforms,” American EconomicReview, 10(4).
Whinston, M. D. (2006): Lectures on Antitrust Economics. MIT Press, Cambridge, MA.
32