chapter 3 materials and methods t -...
TRANSCRIPT

44
CHAPTER 3
MATERIALS AND METHODS
The present investigation on physico-chemical and molecular attributes of
different rice cultivars for genetic diversity analysis and detection of adulteration has
been carried out in Biotechnology Research Laboratory, Department of Food
Engineering and Technology, Sant Longowal Institute of Engineering and Technology
(SLIET), Longowal, India. The details of procedures and analytical methods have been
described in following sections:
3.1 Procurement of Paddy
The presented investigation has been carried out on eight different rice cultivars.
The samples in the form of paddy have been procured from Punjab Agricultural
University (PAU), Ludhiana (India) and Indian Agricultural Research Institute (IARI),
Regional Center, Karnal (India) as mentioned in Table 3.1. Out of these rice cultivars, P
44 and PR 118 are non-basmati and non-aromatic, PS 5 is non-basmati but aromatic,
PB 1121, PB 1460, PB 1401 and PB 2 are evolved basmati varieties, whereas Bas 370 is
traditional basmati rice variety.
3.2 Maintenance of Paddy
The broken, fragmented and distorted seeds were removed manually. The
samples were then air-dried under sunlight at day temperature of 25±5 °C. The seeds
were finally sealed in double polythene bags and stored under refrigerated condition at
45
4±1 °C till experimentation. Before performing any experiment, the required quantity of
sample has been drawn out from the refrigerator and brought to the room temperature.
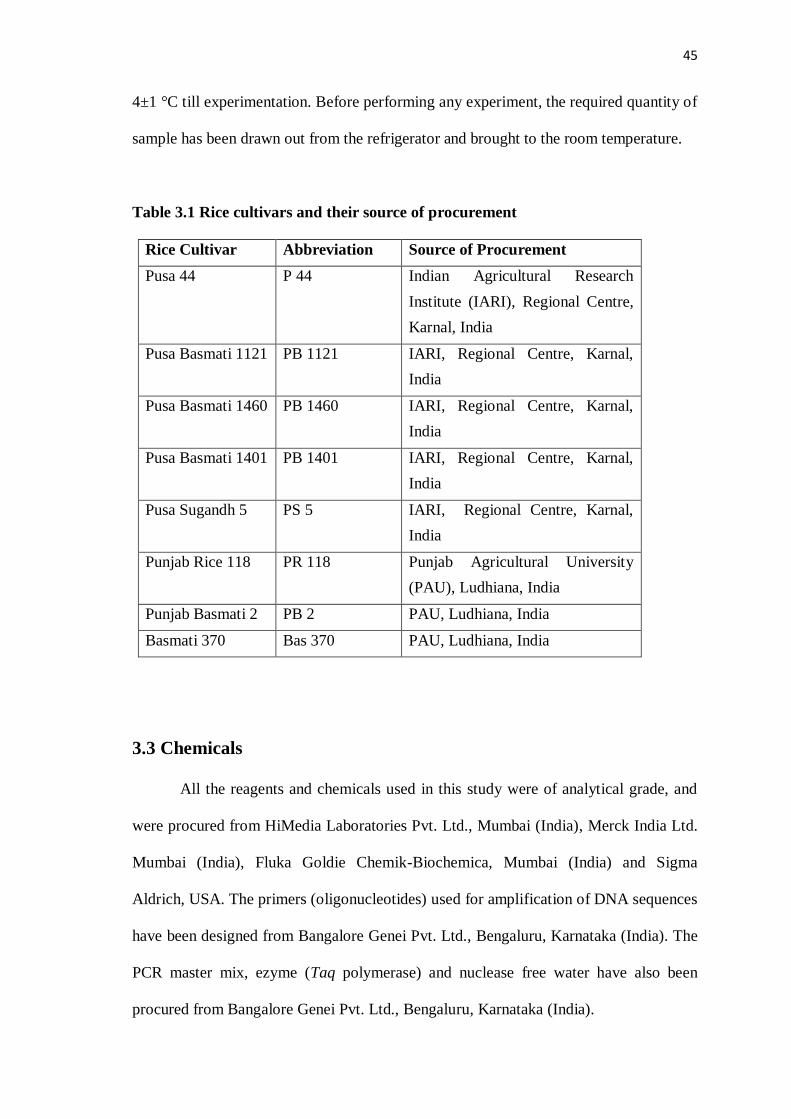
Table 3.1 Rice cultivars and their source of procurement
Rice Cultivar Abbreviation Source of Procurement
Pusa 44
P 44 Indian Agricultural Research
Institute (IARI), Regional Centre,
Karnal, India
Pusa Basmati 1121
PB 1121 IARI, Regional Centre, Karnal,
India
Pusa Basmati 1460
PB 1460 IARI, Regional Centre, Karnal,
India
Pusa Basmati 1401
PB 1401 IARI, Regional Centre, Karnal,
India
Pusa Sugandh 5
PS 5 IARI, Regional Centre, Karnal,
India
Punjab Rice 118
PR 118 Punjab Agricultural University
(PAU), Ludhiana, India
Punjab Basmati 2 PB 2 PAU, Ludhiana, India
Basmati 370 Bas 370 PAU, Ludhiana, India
3.3 Chemicals
All the reagents and chemicals used in this study were of analytical grade, and
were procured from HiMedia Laboratories Pvt. Ltd., Mumbai (India), Merck India Ltd.
Mumbai (India), Fluka Goldie Chemik-Biochemica, Mumbai (India) and Sigma
Aldrich, USA. The primers (oligonucleotides) used for amplification of DNA sequences
have been designed from Bangalore Genei Pvt. Ltd., Bengaluru, Karnataka (India). The
PCR master mix, ezyme (Taq polymerase) and nuclease free water have also been
procured from Bangalore Genei Pvt. Ltd., Bengaluru, Karnataka (India).
46
3.4 Sample Preparation
The samples have been prepared by dividing the raw material into three different
parts, i.e. paddy, milled rice grains and rice flour for multivariate characterization
(Figure 3.1).
The paddy has been dehusked by Paddy Dehusker (McGill type, Oswa
Industries Pvt. Ltd, Ambala Cantt., India) to get brown rice, further milled with rice
miller (McGill type, Oswa Industries Pvt. Ltd, Ambala Cantt., India) and polished to get
milled rice grains.
3.5 Characterization of Paddy
Different methods have been adopted for characterization of physical and
engineering properties of paddy, which are discussed as follows:
3.5.1 Physical Parameters
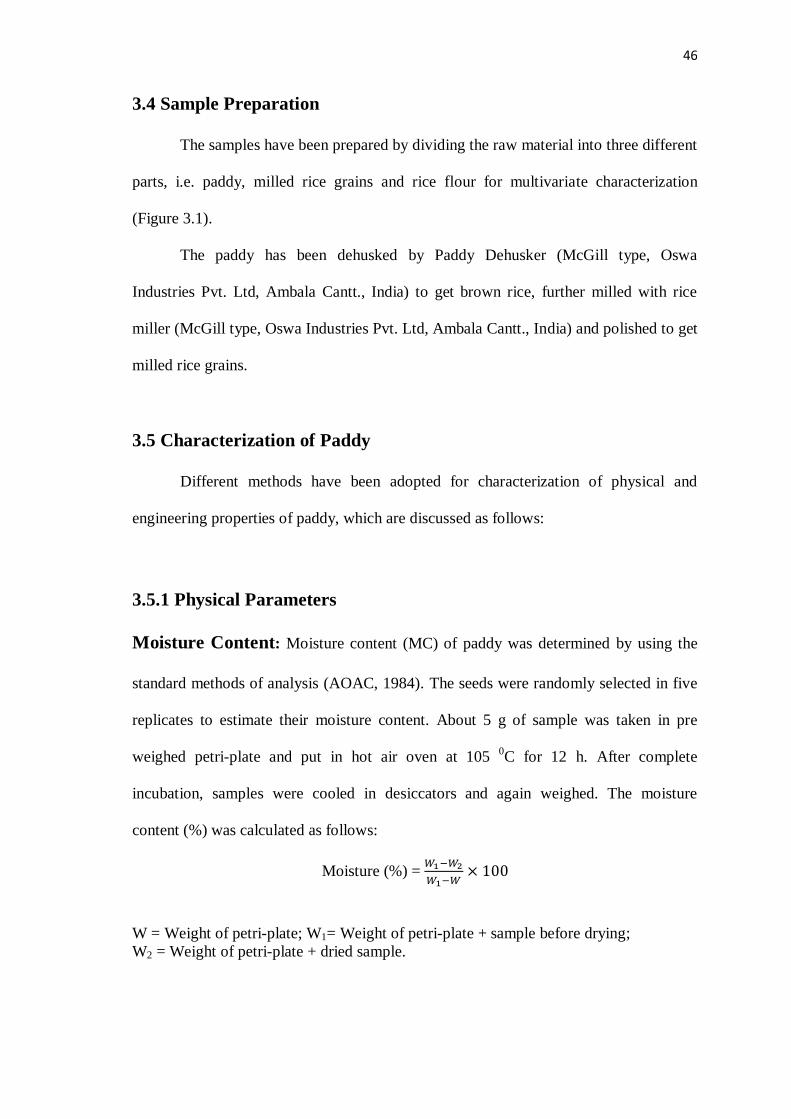
Moisture Content: Moisture content (MC) of paddy was determined by using the
standard methods of analysis (AOAC, 1984). The seeds were randomly selected in five
replicates to estimate their moisture content. About 5 g of sample was taken in pre
weighed petri-plate and put in hot air oven at 105 0C for 12 h. After complete
incubation, samples were cooled in desiccators and again weighed. The moisture
content (%) was calculated as follows:
Moisture (%) =
W = Weight of petri-plate; W1= Weight of petri-plate + sample before drying;
W2 = Weight of petri-plate + dried sample.

47
Figure 3.1 Schematic plan for preparation of different rice samples
Paddy
Cleaning of Seeds
Dehusking of Seeds Paddy Dehusker
Brown Rice
Milling of Brown Rice Rice Miller
Milled Rice Grains
Polishing of Milled Rice Grains
Rice Polisher
Polished Rice Grains
Rice Flour Laboratory Grinder

48
Head Rice Recovery: The paddy was hulled using a Paddy Dehusker (laboratory
model) for dehusking and milled with a rice miller (McGill type). The data for husk (%)
and milling (%) was recorded. After milling, the head rice (HR) recovery was
determined according to the methods of Khush et al. (1979) and Adair (1952).
The percentage of hulls, head rice and degree of milling of paddy has been calculated as
follows:
Hull (%) =
Head rice (%) =
Degree of milling (%) =
Paddy Dimensions: Length, breadth and thickness of paddy, brown rice and milled
rice kernels were measured by using vernier caliper. The measurements were repeated
10 times in each sample and thus an average of 10 grains were recorded. Ratio of length
and breadth gave L/B ratio of paddy and milled rice (Yadav et al., 2007).
Grain Weight: The grain weight (100 gw) was determined by means of a digital
electronic balance. To evaluate the thousand grain mass, 100 seeds were randomly
selected for 5 times by taking different lot of cultivars every time and then weighed.

49
The obtained weight was further multiplied by 10 to get grain weight of 1000 grains
(Nalladulai et al., 2002).
Bulk Density, Density and Porosity: Bulk density (BD) was determined by
gently pouring the seeds in 100 mL graduated cylinder and then weighing it. Density
(Den.) was measured by toluene displacement method in which a known weight of
paddy sample has been submerged into known volume of toluene and then the density
has been calculated by recording the value of change in volume (Bhattacharya et al.,
1972). Porosity (%) was calculated by using the following equation
Porosity (%) =
3.5.2 Engineering Properties
The designing and optimization of various rice processing machines is greatly
influenced by major physical and engineering properties of the paddy. In this study, at
12% moisture content, different engineering properties of paddy have been investigated,
which are as follows:
Equivalent Diameter: The equivalent diameter (Dp) or geometric mean diameter
considering a prolate spheroid shape for a rough rice grain, was calculated by the
following equation (Mohsenin, 1986).
Dp=

50
Sphericity: The sphericity (φ) is defined as the shape of a solid object relative to that
of a sphere of the same volume and was calculated by the method of Mohsenin (1986).
Φ= (LWT) 1/3
L
Grain Volume and Surface Area: Grain volume (V) and grain surface area (S)
were calculated by the following equations (Jain and Bal, 1997).
V=0.25
S=
where B =
Aspect Ratio: The aspect ratio (Ra) is used in classification of grain shape and it was
calculated by the equation given by Varnamkhasti et al. (2007).
Ra=
Angle of Repose: Paddy seeds have been dumped through a circular opening of
funnel from a fixed height on a level horizontal surface till the grains were not started to
slide from the top of the cone formed. The angle of repose is the angle between the
horizontal surface and inclination of heap (Sahay and Singh, 2001).
=tan-1

51
Coefficient of Friction: The static coefficient of friction against wooden surface
was determined using a cylinder of diameter 70 mm and depth 50 mm filled with grains.
With the cylinder resting on the surface, the surface was raised gradually until the filled
cylinder just started to slide down (Alizadeh et al., 2006). The coefficient of friction has
been calculated by the following equation:
µ= tan
Where µ is the coefficient of friction and is the angle of tilt in degrees.
3.6 Characterization of Milled Rice Grains
3.6.1 Grain Dimensions
Length and breadth of milled rice grains were measured by using vernier caliper.
The measurements were repeated 10 times and thus an average of 10 grains were
recorded. Ratio of length and breadth gave L/B ratio of milled rice (Yadav et al., 2007).
3.6.2 Shape and Size
The shape and size of milled grains were determined by classification method of
FAO/WHO (1995) as depicted in Table 3.2 and 3.3.
Table 3.2 Size classification of milled rice grains
Scale Size category Length (mm)
1 Very Long More than 7.50
3 Long 6.61-7.50
5 Medium or intermediate 5.51-6.60
7 Short Less than 5.51

52
Table 3.3 Shape classification of milled rice grains
Scale Size category Length (mm)
1 Slender Over 3.0
5 Medium 2.1-3.0
9 Bold Less than 2.0
3.6.3 Grain Weight
The 100 grain weight (100 gw) was determined by means of a digital electronic
balance. To evaluate grain mass, 100 milled grains were randomly selected for 5 times
by taking different lot of cultivars every time and then weighed.
3.6.4 Bulk Density, Density and Porosity
Bulk density was determined by gently pouring the grains in 100 mL graduated
cylinder and then weighing it. Density was measured by toluene displacement method.
Porosity (%) was calculated by using the following equation (Bhattacharya et al., 1972)
Porosity (%) =
3.7 Characterization of Coking and in vitro Digestion Properties
The different cooking parameters (cooking time, elongation ratio, water uptake,
solid loss and aroma) were determined by taking 5 g head rice of different cultivars and
dipped in two fold volume of water (1:2) for 30 min in 100 mL beakers before cooking.

53
3.7.1 Cooking Time
Milled grains were cooked in boiling water bath and cooking time (CT) was
determined by removing few kernels at different time intervals during cooking and
pressing between two glass plates till no white core was left (Juliano and Betchel, 1985).
3.7.2 Cooked Kernel Length and Elongation Ratio
The cooked rice grains were placed on bloating paper. The cooked grains, which
were intact at both the ends, have been selected. The randomly picked ten cooked
kernels were placed lengthwise to determine cooked kernel length (CKL) by millimeter
scale of graph paper.
Elongation Ratio (ER) of cooked kernels was determined by dividing the length
of cooked kernel to length of uncooked kernel (Juliano and Betchel, 1985).
3.7.3 Water Uptake
The extra water present in the beaker containing cooked rice kernels was drained
off and then the grains were pressed in filter paper sheets to absorb the superficial water
present on cooked rice. The cooked samples were weighed accurately and water uptake
was determined. Thus, the water absorption (g/g) was determined on the basis of gain in
water after cooking (Juliano and Betchel, 1985).
3.7.4 Solid Loss in Gruel
The total amount of solid leached out during cooking of rice grains has been
determined. The rice grains have been cooked in sufficient quantity of water and loss of
cooking liquid in the form of gruel was determined by drying an aliquot of cooking

54
water in a petri dish at 100 ºC in a hot air oven until completely dry
(Yadav et al., 2007).
3.7.5 Aroma
Aroma of rice was determined by the method developed at International Rice
Research Institute (1971). The milled rice grains (1 g) were cooked in test tubes
covered with aluminum foil in boiling water bath for 10 min and then cooled. The
aroma was detected by smelling the rice grains from tubes by taking Bas 370 as a
standard. The grains were then classified as aromatic (strongly/moderately) and non-
aromatic.
3.7.6 In vitro Digestion of Cooked Rice Grains
In vitro digestion of cooked rice grains was estimated according to method of
Hettiarachchy et al. (1997) with slight modifications. The whole cooked rice samples
(20 g) were blended with 20 mL of distilled water in a 3 oz blender jar. The slurry (5 g)
was weighed into a 100 mL Erlenmeyer flask and 10 mL of distilled water was added
followed by 10 mL of phosphate buffer (0.5 M, pH 6.9) and 2 mL of 30 mM CaCl2; the
flask was shaken for few seconds to mix. A 5 mL sample was removed into a test tube,
and 100 units of α-amylase solution in 1 mM CaCl2 were added. The flask was covered
and placed in a shaking water bath at 37º C. Then about 5 mL of sample was removed at
intervals of 15, 30 and 60 min. The samples were placed in boiling water bath for 10
min to inactivate the enzyme. After cooling to room temperature, the samples were
centrifuged for 15 min at 20,000 g. The supernatant was analyzed for maltose and the
results were expressed as mg maltose equivalents per gram sample.
55
3.8 Sensory Evaluation of Cooked Rice Grains
The taste preference of consumer varies from person to person. Sensory
evaluation is considered as the direct way of assessing rice eating quality and the test is
based on the use ofthe human senses. Therefore, in the present investigation sensory
evaluation of the cooked rice grains was carried out by 5 panelists.
The instructions were given to rinse the mouth after each sample taste. They
were requested to express their feelings about the samples by scoring the
following attributes: appearance, texture, taste, aroma and overall acceptability.
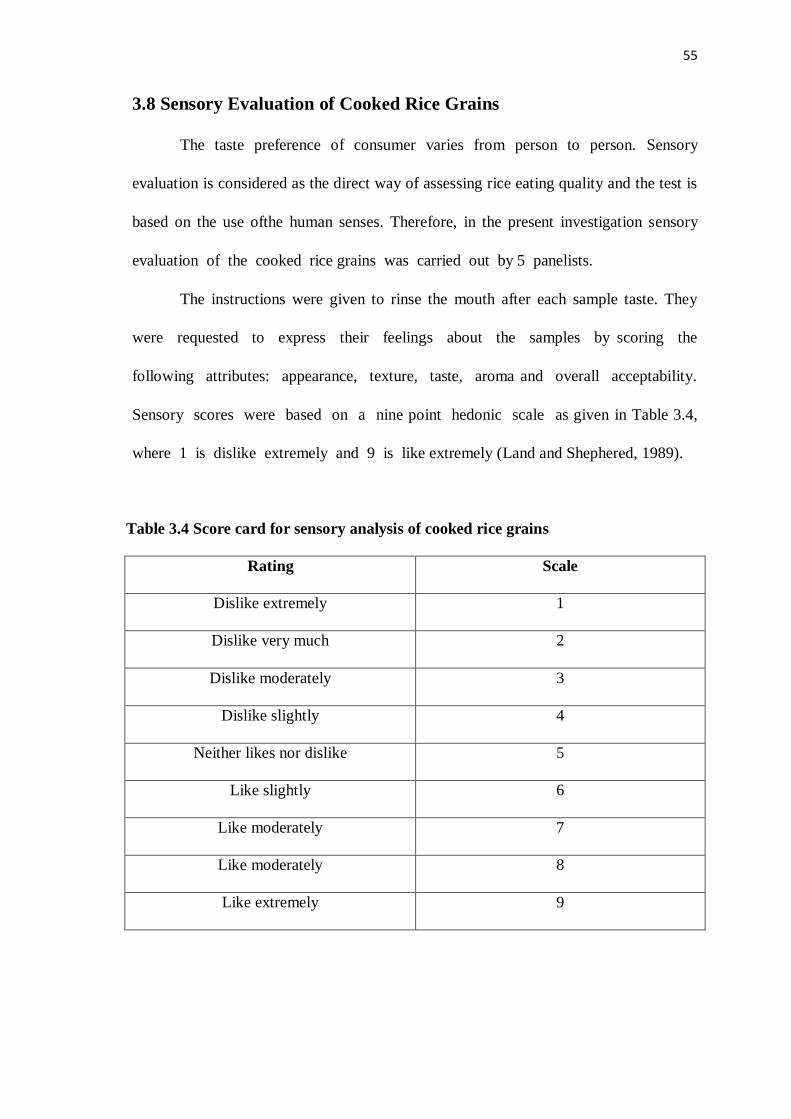
Sensory scores were based on a nine point hedonic scale as given in Table 3.4,
where 1 is dislike extremely and 9 is like extremely (Land and Shephered, 1989).
Table 3.4 Score card for sensory analysis of cooked rice grains
Rating Scale
Dislike extremely 1
Dislike very much 2
Dislike moderately 3
Dislike slightly 4
Neither likes nor dislike 5
Like slightly 6
Like moderately 7
Like moderately 8
Like extremely 9

56
3.9 Texture Analysis of Cooked Grains
After cooking, the cooked grains were held for 20 min for cooling. Then, the
upper layer of grains was removed and the grains from middle layer were picked for
texture determination (Champagne et al. 1998). The texture profile analysis (TPA) of
cooked grains was determined in terms of hardness, adhesiveness and cohesiveness by
Texture Analyzer (TA-XT2i model, Stable Micro Systems, North America). Hardness,
cohesiveness and adhesiveness values were measured from the areas covered under the
different peaks.
Hardness is defined as the maximum peak force during the first compression
cycle; adhesiveness is defined as the negative force area for the first bite and represents
the work required to overcome the attractive forces between the surface of a food and
the surface of other materials with which the food comes into contact, whereas
cohesiveness is defined as the ratio of the positive force area during the second
compression to that during the first compression.
The cooked grains were randomly selected based on intact ends and placed on
the base plate of instrument in a single horizontal layer. A compression plate was set at
5 mm above the base. A two-cycle compression was used with a pre test; test and post
test speed was 1 mm/sec. A compression platen of 75 mm diameter with load cell of 5
kg was used for texture determination of cooked rice samples.
3.10 Characterization of Flour of Milled Rice Grains
Milled kernels were grinded to flour in lab scale grinder and passed through 80
mesh to get uniform particle size for further experiments.

57
3.10.1 Moisture Content
Moisture, ash and fat contents were determined using the standard methods of
analysis (AOAC, 1984). The sample (5 g) was taken in pre-weighed petri plates and
placed in oven at 105 oC for overnight and weighed again (Formula for calculation has
already been given in Section 3.5.1.1).
3.10.2 Ash Content
The ash content in each rice flour sample was estimated by putting samples in a
muffle furnace at a temperature 550 ± 5 oC, till white grey residue is obtained by
following the method as described in AACC (2000) method No. 08-01.
3.10.3 Fat Content
The crude fat content was determined in each rice flour sample by using
petroleum ether as a solvent in a Soxhlet apparatus according to the procedure given in
AACC (2000) method No. 30-10.
3.10.4 Protein Content
The nitrogen content in rice flour samples was estimated by following the
Kjeldahl’s method according to the procedure described in AACC (2000) method No.
46-10.
The protein percentage has been calculated by multiplying the percentage of
nitrogen with a factor 5.95.

58
3.10.5 Starch Content
The starch content in different rice samples was measured according to the
method described by Thimmaiah (2009). The sample (1 g) was taken in test tube and
hot ethanol (80%) was added to remove the sugars. The sample mixture was centrifuged
and then the residue was repeatedly washed with ethanol. After drying the contents,
water (5 mL) and perchloric acid (52%, 6.5 mL) was added, and was incubated at 0 oC
for 20 min. The sample mixture was centrifuged and residue was repeatedly washed
with perchloric acid. Supernatant was collected and made volume up to 100 mL. An
aliquot (0.1 mL) was taken and made up to volume 1 mL with distilled water. Then 4
mL of anthrone was added and placed in water bath for 8 min. The absorbance was
taken at 630 nm. The total starch content in the sample was calculated from the standard
curve (Figure 3.2) of glucose (Thimmaiah, 2009).
3.10.6 Amylose content
The amylose content (AC) of rice flour was determined by the modified method
of Juliano (1971). The rice powder (0.1 g) was put into a 100 mL volumetric flask and 1
mL of 95% ethanol along with 9 mL of 1N sodium hydroxide was added.
The samples were heated on a boiling water bath to gelatinize the starch. After
cooling for 1 h, distilled water is added and contents were mixed well. The starch
solution (5 mL) was put in a 100 mL volumetric flask with a pipette. Then 1N acetic
acid (1 mL), 2 mL of iodine solution (0.2 gm iodine and 2.0 gm potassium iodide in 100
mL of aqueous solution) was added and volume was made up with distilled water.
Contents were shaken well and let stand for 20 min. Absorbance of the solution was
measured at 620 nm. Amylose content has been determined from standard curve of

59
amylose (Figure 3.3) by using a conversion factor and the results are expressed on a dry
weight basis.
Figure 3.2 Standard curve of glucose
Figure 3.3 Standard curve of amylose
0
0.2
0.4
0.6
0.8
1
1.2
1.4
1.6
0 0.2 0.4 0.6 0.8 1 1.2
Ab
so
rba
nc
e (
630 n
m)
Concentration (mg/mL)
0
0.1
0.2
0.3
0.4
0.5
0.6
0 0.2 0.4 0.6 0.8 1 1.2
Ab
so
rba
nc
e (
620 n
m)
Concentration (mg/mL)

60
3.10.7 Alkali Digestion Test
This test was done by the method of Bhattacharya and Sowbhagya (1972) using
1.4% potassium hydroxide solution (KOH). Duplicate sets of ten whole milled kernels
without cracks are selected and placed in petri plates and 1.4% KOH solution (10 mL)
was added. The samples were arranged to provide enough space between kernels to
allow for spreading. The plates were covered and incubated for overnight at 30 °C in an
oven. Starchy endosperm has been rated visually based on a 7 point numerical
spreading scale (Table 3.5).
Table 3.5 Numerical scale for scoring alkali digestion value
Score Spreading Alkali Digestion
1 Kernel not affected Low
2 Kernel swollen Low
3 Kernel swollen;
collar complete or narrow
Low or intermediate
4 Kernel swollen;
collar complete and wide
Intermediate
5 Kernel split or segregated;
collar complete and wide
Intermediate
6 Kernel dispersed;
merging with collar
High
7 Kernel completely dispersed and
intermingled
High
3.10.8 Gel Consistency Test
The gel consistency (GC) test has been performed according to method given by
Cagampang et al. (1973). The rice flour powder (0.1 g) was weighed in duplicate into
the culture tubes. Then, 0.2 mL of ethyl alcohol (95%) containing thymol blue (0.025%)
61
was added. Alcohol prevents clumping of the powder during alkali gelatinization, while
thymol blue imparts color to the alkali paste to make the gel front easier to read.
Contents were mixed properly using a Vortex mixer after adding 2.0 mL of KOH
(0.2N). The test tubes were covered with glass marbles (to prevent steam loss, and to
reflux the samples). The samples have been heated in a vigorously boiling water bath
for 8 min to reach the sample at 2/3 the height of the tube. The test tubes were removed
from the water bath and let stand at room temperature for 5 min. The tubes were cooled
in an ice-water bath for 20 min and laid horizontally on a laboratory table lined with
millimeter graphing paper. The total length of the gel has been measured in millimeters
from the bottom of the tube to the gel front.
3.10.9 Iodine Absorbance Spectra and Blue Value
Iodine absorption spectra and blue values of rice flour were measured according
to the method of Yu et al. (2012). 1 mL of ethanol (95%) and 9 mL of sodium
hydroxide (1N) was added to 0.1 g rice flour of each cultivar. The contents were heated
on a boiling water bath with interminent shaking process. Then the sample mixtures
were incubated and cooled for 1 h at room temperature. The incubation has been
followed by the addition of distilled water to make up the final volume of 100 mL. After
volume make up, the pH of the solution has been set to 6.5. After adjusting the pH, 5
mL of the solution was added to the 1 mL of iodine solution (0.2 g iodine in 1.5 g
potassium iodide in 100 mL distilled water). Then the λmax were determined by
measuring the wavelength of maximum absorbance from 450 to 800 nm with a
spectrophotometer.
62
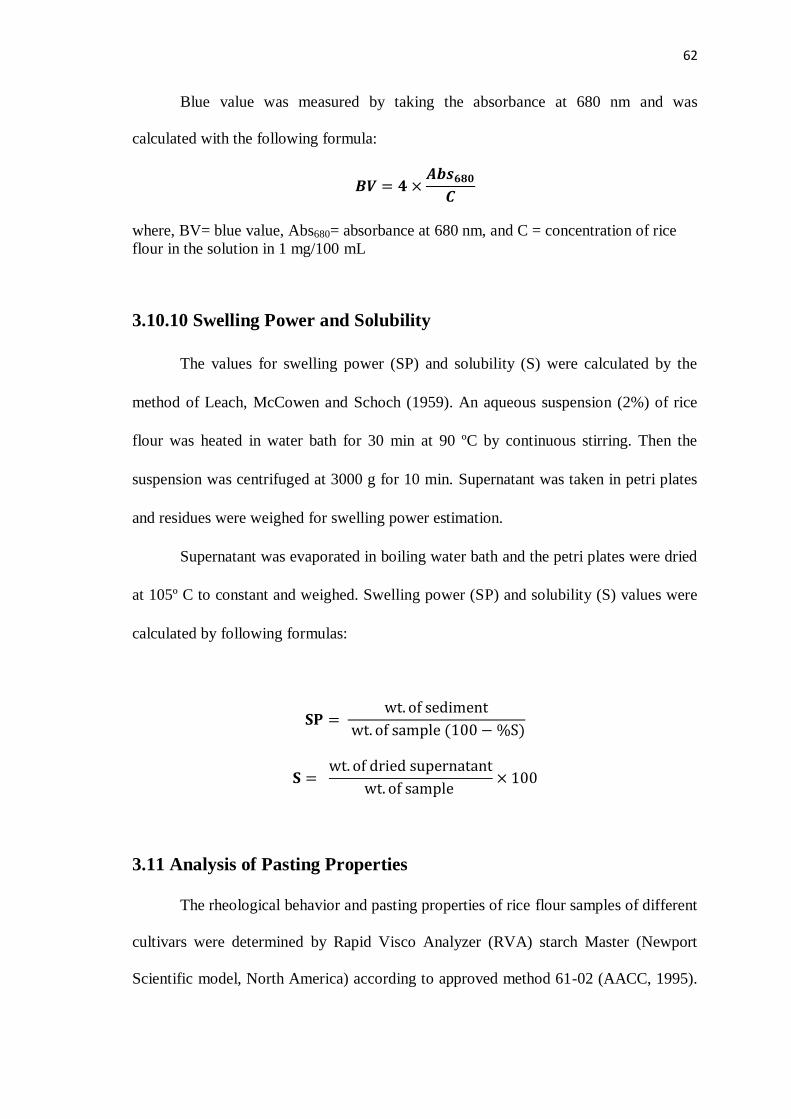
Blue value was measured by taking the absorbance at 680 nm and was
calculated with the following formula:
where, BV= blue value, Abs680= absorbance at 680 nm, and C = concentration of rice
flour in the solution in 1 mg/100 mL
3.10.10 Swelling Power and Solubility
The values for swelling power (SP) and solubility (S) were calculated by the
method of Leach, McCowen and Schoch (1959). An aqueous suspension (2%) of rice
flour was heated in water bath for 30 min at 90 ºC by continuous stirring. Then the
suspension was centrifuged at 3000 g for 10 min. Supernatant was taken in petri plates
and residues were weighed for swelling power estimation.
Supernatant was evaporated in boiling water bath and the petri plates were dried
at 105º C to constant and weighed. Swelling power (SP) and solubility (S) values were
calculated by following formulas:
3.11 Analysis of Pasting Properties
The rheological behavior and pasting properties of rice flour samples of different
cultivars were determined by Rapid Visco Analyzer (RVA) starch Master (Newport
Scientific model, North America) according to approved method 61-02 (AACC, 1995).

63
It determined the thermal properties of rice flour after a specific quantity (3.5 gm with
14% moisture) was added to 25 mL of water in an aluminum cup and the solution was
quickly mixed. The measured properties by RVA were pasting temperature (PT), peak
viscosity (PV), i.e. first peak viscosity after gelatinization, hot peak viscosity paste
viscosity (HPV), i.e. at the end of a 95 °C holding period, final viscosity (FV), i.e. paste
viscosity at the end of the test, break down viscosity (BD) is derived by subtracting hot
paste viscosity from peak viscosity and set back viscosity (SB) was derived by
subtracting peak viscosity from cool paste viscosity. The viscosity parameters has been
recorded in centipoise (cP), where 1 cp = 8.33 × 10⁻²
RVU.
3.12 Determination of Thermal Properties
Thermal properties of rice flour in different cultivas were analyzed using
Differential Scanning Calorimetery (DSC 4000, Perkin Elmer, USA) equipped with a
thermal analysis data station. Rice flour (3.5 mg) was weighed in an aluminum pan and
distilled water was added with the help of a micro syringe to achieve a sample-water
suspension containing 70% water. Samples were hermetically sealed and allowed to
stand for 1 h at room temperature before heating in the DSC. The DSC analyzer was
calibrated and empty aluminum pan was used as reference.
Sample pans were heated at a rate of 10 ˚C/ min from 25 to 100 ˚C. The
different parameters related to thermal properties, i.e. Onset temperature (To), peak
temperature (Tp), conclusion temperature (Tc) and enthalpy of gelatinization (ΔHgel)
were calculated automatically by an instrument.
Because the peaks were symmetrical, the gelatinization range (R) was computed
as (Tc–To) as described by Vasanthan and Bhatty (1996).

64
3.13 Characterization Based on Total Seed Protein
The total seed protein has been extracted by taking 0.5 g paddy (dehusked) of
each cultivar and was ground into fine powder using pestle and mortal. After grinding, 1
mL Tris urea buffer (0.05M Tris-HCl, 2% SDS, 5M Urea, 1% β- mercaptoethanol with
pH 8.0) was added. The bromophenol blue (0.05%) has been also added to use as a
tracking dye. The crude homogenate was centrifuged at room temperature at 15000 rpm
for 10 min. The extracted protein samples were collected as supernatant and pellets
were discarded. The supernatant has been further stored at -20 °C till use (Galani et al.,
2011).
The concentration of the extracted protein samples was determined using
NanoDrop1000 at the 280 nm. Protein profiling of extracted samples was analyzed
through sodium dodecyl sulphate - Polyacyrlamide gel electrophoresis (SDS PAGE)
using 12% polyacrylamide gel (Laemmli, 1970). Electrophoresis was carried out at 80
V for 3 h and the gel was then fixed in solution (10% acetic acid and 40% ethanol) for
15 min with constant shaking. The gel was stained with 0.2% (w/v) Coomassie Brilliant
Blue R250 overnight on an electrical shaker. Destaining of gels was carried out for a
couple of hours followed by gel preservation, scanning and photography. Gel
photographing and documentation were carried out using Biorad gel documentation
system.
With regard to variation in protein banding pattern, each variety was scored for
the presence or absence of bands. The presence of bands has been scored as 1 and as 0
for their absence across the genotypes. The binary data generated from analysis and
scoring of electrophoretic bands has been used to construct a dendogram by the
unweighed pair group method (UPGMA) and also to found the genetic similarity among
different rice cultivars, which has been discussed in later section.

65
3.14 Statistical Analysis
All the experiments were repeated thrice and the data has been collected for
statistical analysis. An analysis of variance (ANOVA) was used to analyze the data, and
the significant differences between the quality parameters of different rice cultivars
were compared by Duncan’s multiple range test using Statistica 7 software (StatSoft,
Inc., Tulsa, OK, USA) at 5% level of significance.
The significant positive and negative coorelation among different physico-
chemical attributes of rice cultivars has been calculated by Pearson product moment
correlation coefficient was calculated by using Sigma Stat software window version 3.5
at 5% level of significance (Systat Software, Inc., USA).
Principal component analysis (PCA) was performed with correlation matrix
using SPSS software version 16 to define the patterns of variation between all the
explanatory variables. Principal component that explained a total variance greater than
60% was selected and the varimax rotation method was applied with eigen value more
than 1.
Data obtained from physico-chemical, cooking, textural and pasting quality
attributes of rice grains and flour was subjected to cluster analysis using the data
analysis software Statistica 7 (StatSoft, Inc. USA). The three dimensional (3D) graphs
have also been designed with the help of Statistica 7 software. Mean values from
replicates and standard deviations (P<0.05) were calculated by using Microsoft Office
Excel 2003.

66
3.15 Molecular Characterization of Rice Cultivars
Molecular characterization of different rice cultivars has been done by the
amplification of 50 SSR markers covering all the 12 rice chromosomes.
3.15.1 Extraction of DNA
The genomic DNA was extracted from paddy by following the protocol described
by Ahmadikhah (2009) and Rajendrakumar et al. (2011) with slight modifications:
a) Raw seeds of different cultivars was soaked in 600 µl extraction buffer (100 mM
Tris-HCl, pH 8.0, 25 mM EDTA, pH 8.0, 1.25 M NaCl, 2% CTAB and 3% PVP)
and incubated in dry bath for 30-45 min at 65 °C in a sterile 1.5 mL
microcentrifuge tube.
b) Samples were grinded with a sterile micro pestle till the tissue disintegrates.
c) Then, 600 µL of chloroform/isoamyl alcohol (24:1) was added; the contents are
mixed gently for 2-3 min and centrifuged at 12000 g for 10 min at room
temperature.
d) The supernatant was transferred to a fresh sterile 1.5 mL microcentrifuge tube.
e) DNA has been precipitated using an equal volume of ice-cold isopropanol. The
DNA was pelleted by centrifugation at 12000 g for 10 min at room temperature.
f) After centrifugation, the supernatant is discarded and the DNA pellet is washed
twice with 70% ethanol.
g) The pellet was dried, and re-suspended in sterile dH2O containing 20 µg/mL
RNase A.
h) The pellet is air dried for 1 h and dissolved in 50 µL of sterile TE buffer (10 mM
Tris HCl, pH 8.0 and 1mM EDTA, pH 8.0).
67
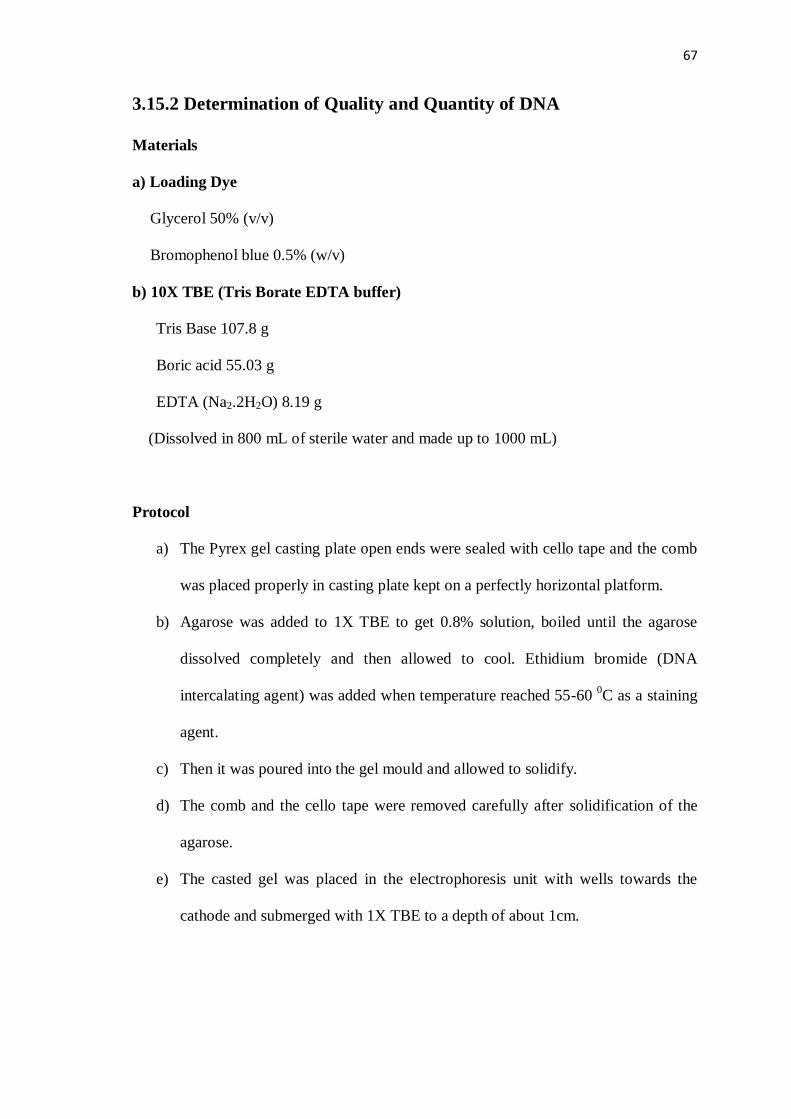
3.15.2 Determination of Quality and Quantity of DNA
Materials
a) Loading Dye
Glycerol 50% (v/v)
Bromophenol blue 0.5% (w/v)
b) 10X TBE (Tris Borate EDTA buffer)
Tris Base 107.8 g
Boric acid 55.03 g
EDTA (Na2.2H2O) 8.19 g
(Dissolved in 800 mL of sterile water and made up to 1000 mL)
Protocol
a) The Pyrex gel casting plate open ends were sealed with cello tape and the comb
was placed properly in casting plate kept on a perfectly horizontal platform.
b) Agarose was added to 1X TBE to get 0.8% solution, boiled until the agarose
dissolved completely and then allowed to cool. Ethidium bromide (DNA
intercalating agent) was added when temperature reached 55-60 0C as a staining
agent.
c) Then it was poured into the gel mould and allowed to solidify.
d) The comb and the cello tape were removed carefully after solidification of the
agarose.
e) The casted gel was placed in the electrophoresis unit with wells towards the
cathode and submerged with 1X TBE to a depth of about 1cm.

68
Loading the DNA Samples
1) 5 µL of DNA sample dissolved in TE was pipette onto a parafilm and mixed well
with 3 µL of 6X loading dye.
2) The gel was run at 80 V for 1-1.5 h and bands were visualized and documented
using a gel documentation system (Model Alpha Imager 1200, Alpha Innotech
Corp., USA).
Quantification of DNA: DNA was quantified by using UV-Vis
Spectrophotometer. The genomic DNA (1 µL) was diluted to 1 mL deionized water.
The absorbance was measured at 260 nm. An optical density (OD) of 1.0 corresponds to
50 ng / µL for double stranded DNA. Based on the quantification data; DNA dilutions
were made in 1X TE buffer to a final concentration of 50 ng/µL and stored in -20 °C for
further use.
3.15.3 Selection of SSR Markers
A total of 50 SSR markers covering all the 12 rice chromosomes have been used for
molecular characterization of rice cultivars. The selection of markers has been done on
the basis of their polymorphism level available in literature. The other aspect considered
during the selection of markers was their chromosal position linked to cooking and
eating quality trait of rice cultivars. The details and sequence of different primers have
been derived from published sequence data (www.gramene.org).
The sequence and details of the primer pairs used for the presnt investigation
have been given in Table 3.6.

69
3.15.4 Amplification of Isolated DNA
The isolated and quantified DNA of different rice cultivars has been amplified
by using different SSR markers by thermo cycler.
The cocktail (25 µl) for Polymerase Chain Reaction (PCR) was prepared as
follows:
DNA samples (2 µl), 1X PCR Buffer (1 µl), 1.5 mM MgCl2 (0.5 µl), 0.2 mM of each
dNTPs (2 µl), 10 pmol of each primer (0.5 µl each), 1 U of Taq polymerase (1 µl) and
sterile ddH2O (17.5 µl).
The reaction mixture was put in PCR tubes and given a momentary spin for
through mixing of the cocktail components. Then, PCR tubes were loaded in a thermal
cycler.
The reaction in thermal cycler was programmed as follows:
Profile 1: 95 ˚C for 5 min Initial denaturation
Profile 2: 94 ˚C for 1 min Denaturation
Profile 3: 55 ˚C-60 ˚C for 1 min Annealing
Profile 4: 72 ˚C for 1 min Extension
Profile 5: 72 ˚C for 5 min Final extension
Profile 6: 4 ˚C Hold the samples
Profiles 2, 3 and 4 were programmed to run for 35 cycles

70
3.15.5 Quantification of PCR Product
After PCR amplification, the PCR products were separated on 3% agarose gel (detail
method has already been given in section 3.15.2) and amplified DNA bands were
visualized under Gel Documentation System for scoring and data analysis
3.15.6 Scoring of Amplified Alleles
The clear and unambiguous bands of SSR markers were scored. Markers were scored
for the presence or absence of the corresponding band among the genotypes. The score
1 and 0 indicates the presence and absence of the bands, respectively. In case allele
profiling, a data matrix comprising of ‘1’ and ‘0’ has been formed depending on the
presence or absence of allele. The generated data matrix has been subjected for further
analysis and construction of dendograms for cluster analysis.
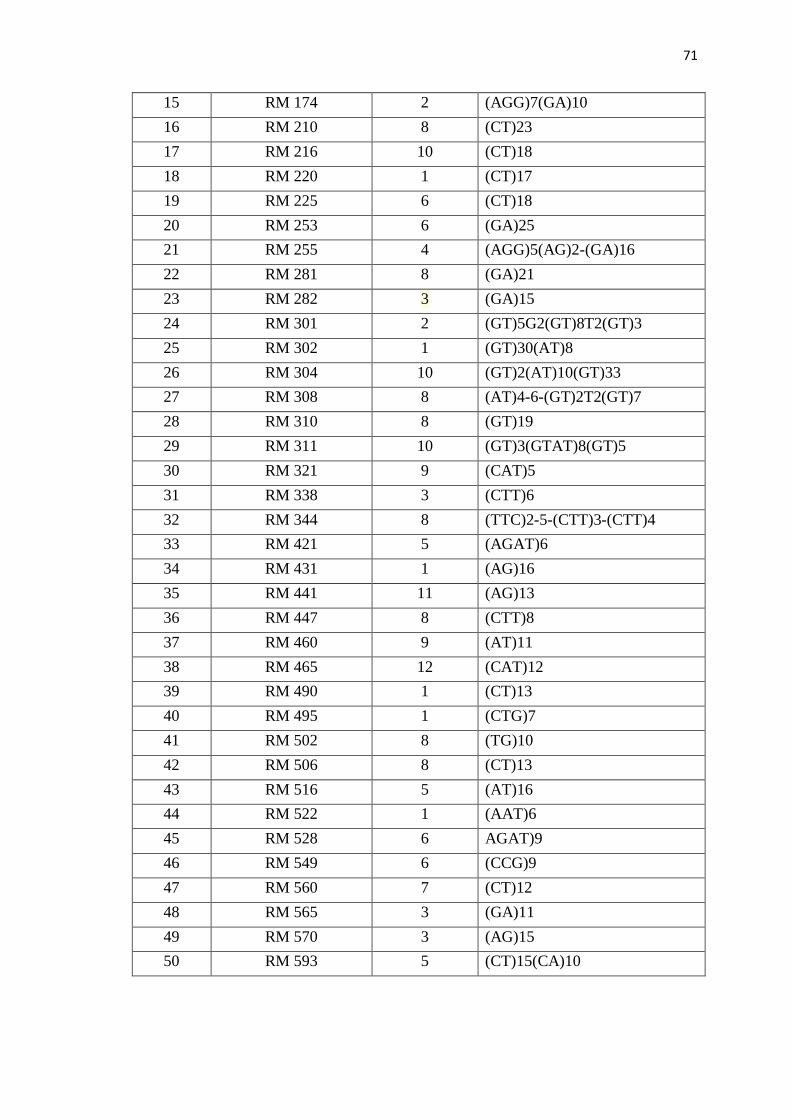
Table 3.6 List of SSR markers used for molecular characterization of rice cultivars
S. No Name of Marker Chromosome
Number
Repeat Motifs
1 RM 16 3 (TCG)5(GA)16
2 RM 18 7 (GA)4AA(GA)(AG)
3 RM 19 12 (ATC)10
4 RM 38 8 (GA)16
5 RM 44 8 (GA)16
6 RM 81 3 (TCT)10
7 RM 84 1 (TCT)10
8 RM 121 6 (CT)7
9 RM 124 4 (TC)10
10 RM 128 1 (GAA)9
11 RM 133 6 (CT)8
12 RM 137 8 (CT)7
13 RM 162 6 (AC)20
14 RM 166 2 (T)12
71
15 RM 174 2 (AGG)7(GA)10
16 RM 210 8 (CT)23
17 RM 216 10 (CT)18
18 RM 220 1 (CT)17
19 RM 225 6 (CT)18
20 RM 253 6 (GA)25
21 RM 255 4 (AGG)5(AG)2-(GA)16
22 RM 281 8 (GA)21
23 RM 282 3 (GA)15
24 RM 301 2 (GT)5G2(GT)8T2(GT)3
25 RM 302 1 (GT)30(AT)8
26 RM 304 10 (GT)2(AT)10(GT)33
27 RM 308 8 (AT)4-6-(GT)2T2(GT)7
28 RM 310 8 (GT)19
29 RM 311 10 (GT)3(GTAT)8(GT)5
30 RM 321 9 (CAT)5
31 RM 338 3 (CTT)6
32 RM 344 8 (TTC)2-5-(CTT)3-(CTT)4
33 RM 421 5 (AGAT)6
34 RM 431 1 (AG)16
35 RM 441 11 (AG)13
36 RM 447 8 (CTT)8
37 RM 460 9 (AT)11
38 RM 465 12 (CAT)12
39 RM 490 1 (CT)13
40 RM 495 1 (CTG)7
41 RM 502 8 (TG)10
42 RM 506 8 (CT)13
43 RM 516 5 (AT)16
44 RM 522 1 (AAT)6
45 RM 528 6 AGAT)9
46 RM 549 6 (CCG)9
47 RM 560 7 (CT)12
48 RM 565 3 (GA)11
49 RM 570 3 (AG)15
50 RM 593 5 (CT)15(CA)10

72
3.15.7 Polymorphism Information Content
Polymorphism information content (PIC) or expected hererozygosity scores for
each SSR marker was calculated based on the formula
PIC = 1-ΣPi2
Where Pi is the allele frequency for the ith
allele (Nei, 1973)
3.15.8 Similarity Matrix and Cluster Analysis
A distance matrix of rice cultivars was calculated for physico-chemical and
molecular characterization followed by cluster analysis using UPGMA clustering
method. A similarity matrix was calculated with the Simqual subprogram using Dice
coefficient, followed by cluster analysis with the SAHN subprogram using the UPGMA
clustering method as implemented in NTSYS-pc software version 2 (Applied
Biostatistics, Setauket, New York, USA) to construct a dendogram showing relationship
among the genotypes.
The correlation between the similarity and distance matrix obtained from
physico-chemical and molecular data has been found by Mantel’s test by using the
mixcomp function of NTSYS-pc software.
3.16 Detection of Adulteration
For detection of adulteration, paddy seeds of different rice cultivars were mixed
in three ways, i.e. non-basmati with non-basmati, non-basmati with basmati and basmati
with basmati. The adulteration has been detected by physico-chemical as well as by
molecular approach.
`

73
3.16.1 Physico-chemical Approach
The milled rice grains of two different cultivars (according to section 3.16) have
been mixed in a ratio of 3:1. Then the samples have been taken in three lots randomly
for detection of adulteration among rice cultivars using physico-chemical attributes, i.e.
kernel length, amylose content, alkali spreading value, gel consistency, cooked kernel
length and elongation ratio. The pure and adulterated samples have been tested
separately for above physico-chemical traits and the obtained results were compared for
further analysis.
3.16.2 Molecular Approach
For confirming the effectiveness, distinctness and stability of SSR markers,
dehusked paddy of different varieties have been mixed randomly as mentioned in
Section 3.16. Then the DNA has been isolated from randomly selected seeds. Isolated
DNA was further amplified by using variety specific SSR marker in a thermal cycler
with the basic PCR profile. The adulteration has been detected on the basis of allelic
frequency of bands and their molecular weight by comparing the results with standard
ones.
3.17 Designing of Database
The database (RicePCMC
) has been developed by using Visual Basic 6.0 and MS-
Access that is an efficient language database, respectively. Visual Basic is an ideal
programming language for developing sophisticated application for Microsoft windows.
Features such as easier comprehension, user-friendliness, faster application
development and many other aspects such as introduction to ActiveX technology and
internet features make Visual Basic an interesting tool to work with.

74
Different applications like event driven, object oriented design and extensible
has been used to create different forms related to different parameters of various rice
cultivars. MS-Access has been used to design various tables in a design view (Figure
3.4).
Different tables and graphics related to various attributes of different rice
cultivars have been made and saved individually for further use. The various utilities of
MS access have been used as per requirement of the database.
Figure 3.4 Designing of tables in database
3.17.1 Database Structure and Description
The database has been designed on the basis of experimental work carried on
physic-chemical and molecular aspects of basmati and non-basmati rice cultivars.
Different forms/ windows have been created (Figure 3.5) to access the database more
effectively.

75
Figure 3.5 Different components of database
START
Login Form
Processing Form
Welcome Form
Homepage Comparison Form Abbreviations Protocols
EXIT

76
Login and Processing Form: A login form has been created with username and
password to run the program (Figure 3.6). It controls access to the administration
screens, allowing only registered users to login. A processing form has been created
which showed processing of database before its functional operations (Figure 3.7).
Figure 3.6 Log in window of database
Figure 3.7 Processing of database window
77
Homepage: There are two main forms in the homepage of database. The home page
window shows the information about the database on right hand side, whereas the left
side consists of different links related to various physico-chemical and molecular
attributes of different rice cultivas. Two search engines used for selection of rice
cultivar and their attributes have been also place on the top of left corner.
The database organizes the information about different rice varieties into different
links which are as follows:
Information about variety
Physical characteristics of paddy seeds
Physico-chemical properties of milled rice grains
Cooking and textural Properties of rice grains
Pasting attributes of rice grains
Molecular characterization of rice cultivars which includes list of SSR markers
used and Gel documentation images
Detection of adulteration
Cluster Analysis
Statistical Analysis
Two query boxes have been displayed on the top under the quick section search
tab to allow the user to search rice variety with specific parameters or to get information
on characteristics of a specific rice variety (Figure 3.8). The application program for
identifying the desired rice variety will require user’s inputs. Based on user’s input, the
system will provide the values of selected parameter for specific variety.

78
Figure 3.8 Homepage window of database
79
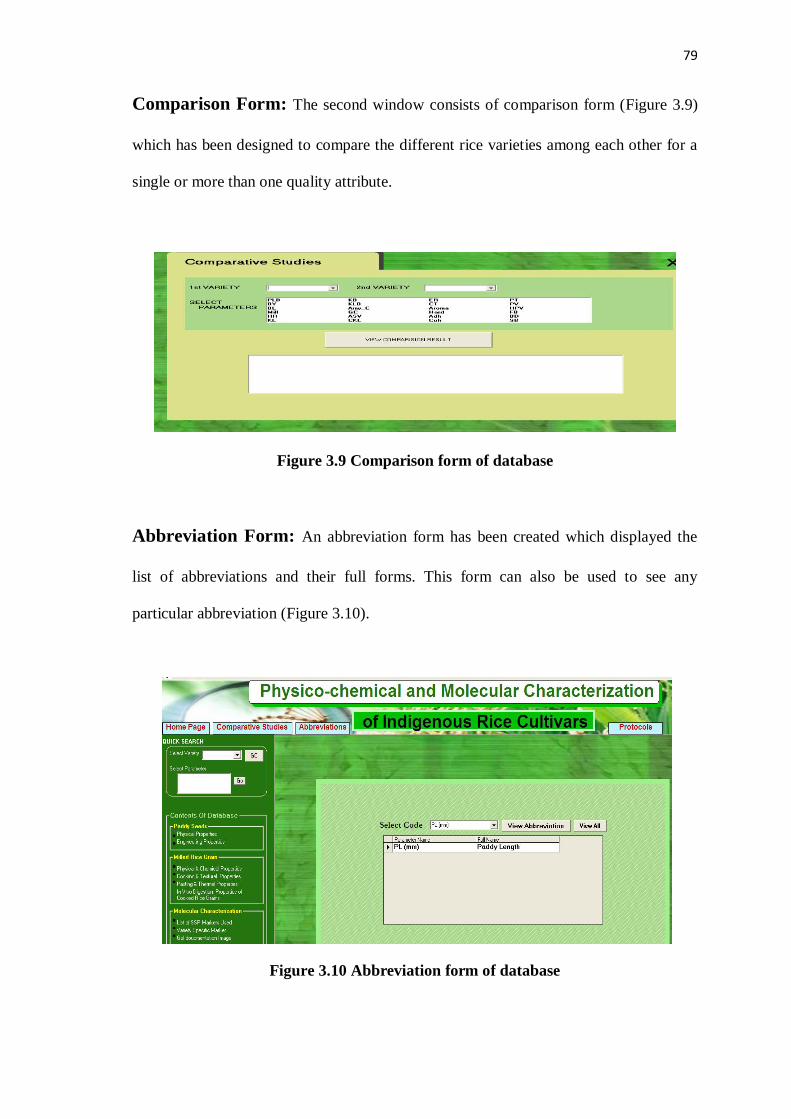
Comparison Form: The second window consists of comparison form (Figure 3.9)
which has been designed to compare the different rice varieties among each other for a
single or more than one quality attribute.
Figure 3.9 Comparison form of database
Abbreviation Form: An abbreviation form has been created which displayed the
list of abbreviations and their full forms. This form can also be used to see any
particular abbreviation (Figure 3.10).
Figure 3.10 Abbreviation form of database

80
Protocols: A form of protocols have been created, which has been further divided
four different sections, i.e. physical and engineering properties of paddy, physico-
chemical properties of milled rice grains, textural and pasting properties whereas last
section contained protocols related to molecular characterization (Figure 3.11).
Figure 3.11 Different sections of protocol form
Double click on any section displayed the PDF file containing the detailed protocol
related to particular experiment.