chapter 3 production and purification of tyrosinase...
TRANSCRIPT
55
CHAPTER 3
PRODUCTION AND PURIFICATION OF TYROSINASE
3.1. PREFACE
Tyrosinases are a group of copper containing metalloproteins and are normally
referred as polyphenol oxidases, which belongs to a major class of oxidoreductase
enzymes. It is a bifunctional enzyme and catalyzes two reactions in the presence of
molecular oxygen, exhibiting monophenolase or cresolase activity and diphenolase or
catecholase activity. It plays a significant catalytic properties led the tyrosinase for
several applications. Catalytic properties of enzymes are generally varied from the
sources of their origin aiming at particular applications.
Biological sources including plants, animals and microorganisms are
predominant sources for the synthesis of tyrosinase. Mushroom tyrosinase is
commercial source of tyrosinase available in the world market. Although submerged
and solid state processes were explored for the production of tyrosinase at large scale,
the submerged bioprocess is leading. Several methods mainly including
immobilization, mutations and recombinant DNA techniques have been explored for
the enhanced production of enzymes at higher scale. However, Response Surface
Methodology (RSM) with suitable statistical design is very attractive and most
preferred one for the enhanced production of enzymes. The purification of enzyme is an
important criterion before subjecting for any major applications. Ammonium sulpahte
precipitation, dialysis, gel filtration and column chromatography are the basic methods
normally employed for the purification of enzymes.
This chapter covers the production of tyrosinase by an efficient isolate of
Streptomyces tuirus DBZ39. A submerged bioprocess was optimized with major
physicochemical and nutritional conditions. Response Surface Methodology with
Central Composite Design (CCD) was employed to optimized critical process variables
for the enhanced production of tyrosinase. The enzyme was purified by ammonium
sulpahte precipitation, dialysis, gel filtration and column chromatography.
56
3.2. REVIEW OF LITERATURE
3.2.1. Tyrosinase and bioprocess
Tyrosinase: The browning of fruits and vegetables has been interest of research for
years (Almeida and Nogueira, 1995). The process of browning involves the enzyme-
catalyzed synthesis of a dark pigment named melanin (Friedman, 1997). The enzyme
that plays a crucial role in the formation of melanin is tyrosinase. In addition to plants
and animals, a wide range of microorganisms such as bacteria, fungi, yeast and
actinomycetes, have proven to be proficient sources for tyrosinase.
Tyrosinase is an important multicopper containing enzyme having EC No.
1.14.18.1 and belongs to oxidoreductase family (Lerch, 1983). It is mainly referred as
monophenol monooxygenase, dihydroxyphenylalanine: oxygen oxidoreductase,
polyphenol oxidase; catechol oxidase and oxygen oxidoreductase. Tyrosinases are
nearly ubiquitously distributed in nature. It is found in both prokaryotes and eukaryotic
microbes, invertebrates, plants and mammals. The most extensively investigated
tyrosinases are from mushroom (Sung et al., 2003). It has been suggested that there is
no common tyrosinase protein structure occurring across all species. However, all
tyrosinases have a common binuclear type 3 copper centres with in their active site.
Here two copper atoms are each coordinated with three histidine residues (Klabunde et
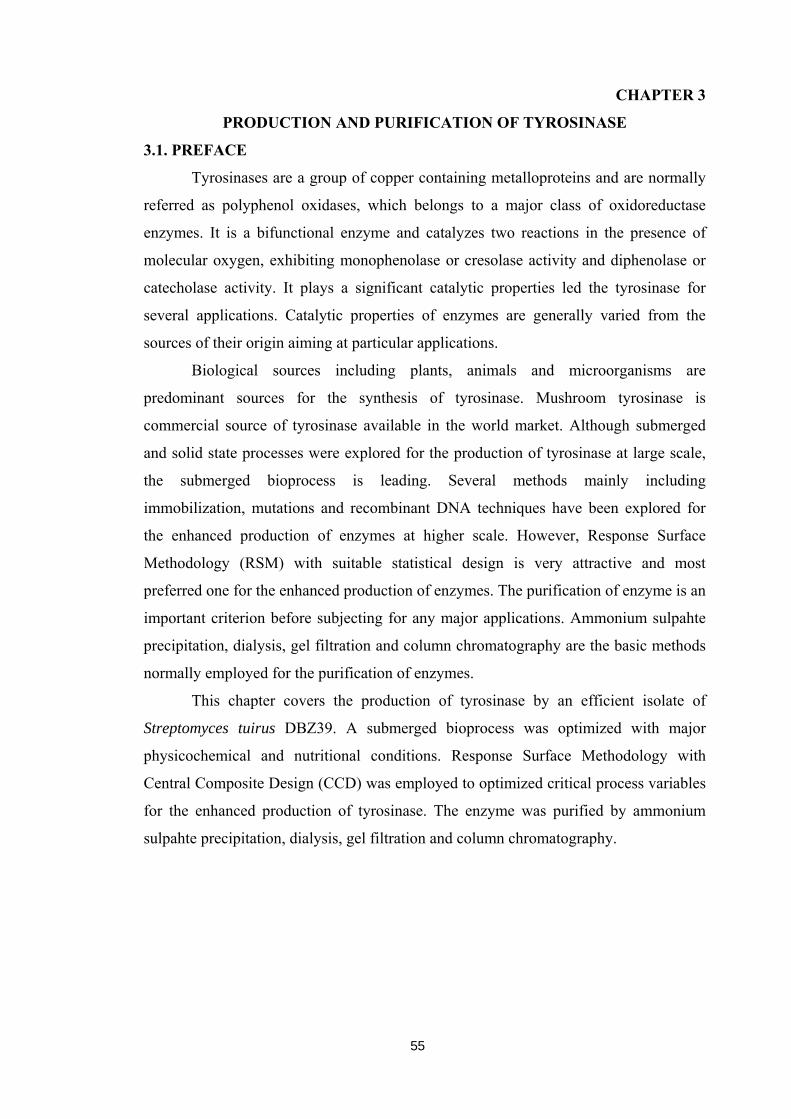
al., 1998). The crystallographic structural feature (Matoba et al., 2006) of the
Streptomyces tyrosinase is as shown under.
57
A indicates caddie protein (blue), B and C indicates copper clusters (red) and
histidine residue (orange) and D indicates supra molecular structure of Streptomyces
tyrosinase.
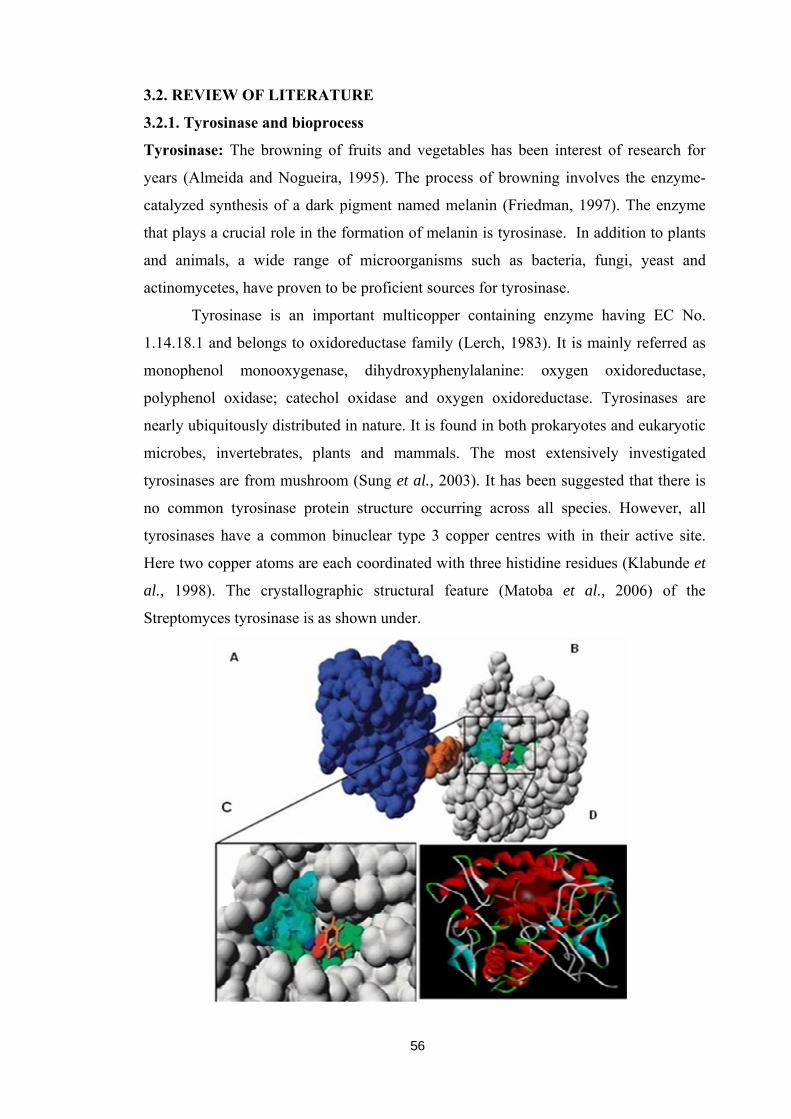
Tyrosinases are bifunctional enzymes, it catalyzes two types of reactions in the
presence of molecular oxygen; the ortho-hydroxylation of monophenols to its
corresponding o-diphenol (monophenolase, cresolase activity) and the oxidation of
diphenols to its correspondent ortho-quinones (diphenolase, catecholase activity).
Quinones are highly susceptible to non-enzymatic reactions, which may lead to the
formation of mixed melanins and heterogeneous polymers (Lerch, 1983). The catalytic
mechanisms behind oxidation of a substrate typically involve formation of a reactive
intermediate by the reaction of a reduced Cu+ centre with molecular oxygen, which
may also be incorporated to the substrate (Mayer, 1987). The catalytic mechanism of
tyrosinase leading to the formation of eumelanins and pheomelanins illustrated by
Lerch (1983) is as follows.

58
Bioprocess: A bioprocess is any process that uses complete living cells or their
components to obtain desired products. It is a technique of biological conversion of
complex substrates into simple compounds by various microorganisms such as bacteria,
fungi and actinomycetes (Balakrishnan and Pandey, 1996). The development of
suitable and standard bioprocesses has lead to industrial level production of bioactive
compounds (Demain, 1999). Different types of bioprocesses have been designed and
standardized by various researchers suitably based on the type of substrate, organism
and the desired end product. Solid and submerged states of bioprocesses are
conventionally referred as fermentations, are normally followed for the large scale
production of bioactive compounds. Submerged bioprocess utilizes free flowing liquid
substrates, such as molasses and broths. The bioactive compounds are secreted into the
fermentation broth. The substrates are utilized quite rapidly; hence, need to be
constantly replaced/supplemented with nutrients. This fermentation technique is best
suited for microorganisms such as bacteria that require high moisture content.
An additional advantage of this technique is that purification of products is easier.
Normally Submerged fermentation is primarily used in the extraction of secondary
metabolites that need to be used in liquid form (Subramaniyam and Vimala, 2012).
The process development is the key step in any basic fermentation criteria.
Process development refers to the up-gradation of the factors that influence the
metabolite. It involves optimizing the production parameters and suitably enabling the
organism into a potent producer of the required metabolite in its best possible quality
and concentration. The organisms vary in their abilities to produce the required enzyme
and also their competitive reciprocation to the production environment. To understand
these process variables, knowledge of enzyme kinetics is essential and indeed even
more basic consideration will be the choice of an appropriate environment for an
appropriate enzyme. This choice must take into consideration such factors as
specificity, initial and final pH, activator and inhibitor requirements, availability, cost,
toxicity and ease to control the process (Barrett, 1975). Also, it is important that the
maximum activity is retained during the process development of enzyme production.
Two key elements in an enzyme reaction are the substrate and the enzyme, both
contained in a suitable medium providing the necessary environment obvious for an
effective reaction. Nevertheless, production environment, medium engineering and
biocatalyst engineering are likely to be used as major attributing parameters,
increasingly in a useful fashion for optimizing the production of enzymes.
59
Consequently numerous investigations have been carried out to better
understand and define conditions, which would lead to higher enzyme production
efficiency. The extent of enzyme production is dependent upon a variety of factors
including the makeup of the fermentation medium, particularly composition of
the medium and how it was prepared, its physical and environmental conditions
(Gupta, 2002). Enzyme production by microorganisms is modulated by a number of
nutritional factors. The metabolism for the organisms is important, because the carbon
and nitrogen sources supply the components needed of the synthesis of proteins,
nucleic acids, cell wall material and also the reserve food materials. The fermentation
medium must meet the industrial requirement of the fermenting organisms (Frost and
Moss, 1987). It basically contains sources of carbon, nitrogen and metal ions
(Volesky and Luong, 1985). The basic approach to medium optimization involves
change of only one medium component at a time. Optimization strategies have proven
to be the key factors in developing media that fully to achieve high
productivity, consistent and economical fermentation process (Maiorella et al., 1984).
The availability of nitrogen and carbon sources also influences the production of
secondary metabolites (Aharonowitz, 1980). All organisms require energy and the
carbon source for their growth. As a source of cellular material, carbon form major part
of the dry weight of actinomycetes. The range of carbon compounds that can be utilized
is vast. The production of secondary metabolites is increased by the presence of a non-
preferred carbon source or by phosphate starvation (Aharonowitz, 1980). Type source
and nature of carbon are among the most important factors for any fermentation process
and should be given significant consideration. The medium constituent, which has most
influence on enzyme production by actinomycetes next to carbon, is the nitrogen
source. Nitrogen is among the essential, non-metallic component required by
actinomycetes for the structural and functional purpose of the cell. Enzyme production
by actinomycetes depends on limited nitrogen supply and a definite nitrogen source.
The proportions of these have marked influence in enzyme production in
actinomycetes. Nitrogen metabolism by microorganisms has been recently reviewed by
Payne (1980). Yeast extract as a nitrogen source was found to be most suitable for
incliner production. Media used in cultivation of microorganisms must contain all
elements in a form suitable for the synthesis of cell substances and also for the
production of metabolic products. Thus, type source and nature of carbon, nitrogen,
mineral salts are among the most important factors for any fermentation process.
60
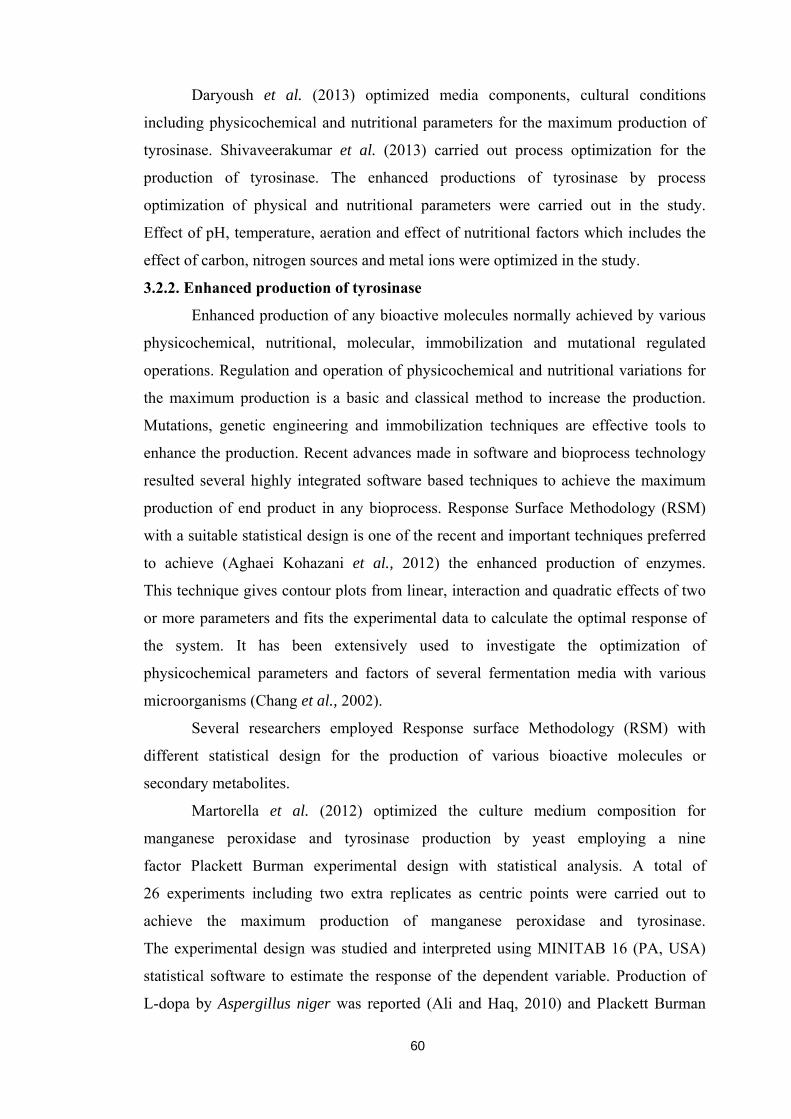
Daryoush et al. (2013) optimized media components, cultural conditions
including physicochemical and nutritional parameters for the maximum production of
tyrosinase. Shivaveerakumar et al. (2013) carried out process optimization for the
production of tyrosinase. The enhanced productions of tyrosinase by process
optimization of physical and nutritional parameters were carried out in the study.
Effect of pH, temperature, aeration and effect of nutritional factors which includes the
effect of carbon, nitrogen sources and metal ions were optimized in the study.
3.2.2. Enhanced production of tyrosinase
Enhanced production of any bioactive molecules normally achieved by various
physicochemical, nutritional, molecular, immobilization and mutational regulated
operations. Regulation and operation of physicochemical and nutritional variations for
the maximum production is a basic and classical method to increase the production.
Mutations, genetic engineering and immobilization techniques are effective tools to
enhance the production. Recent advances made in software and bioprocess technology
resulted several highly integrated software based techniques to achieve the maximum
production of end product in any bioprocess. Response Surface Methodology (RSM)
with a suitable statistical design is one of the recent and important techniques preferred
to achieve (Aghaei Kohazani et al., 2012) the enhanced production of enzymes.
This technique gives contour plots from linear, interaction and quadratic effects of two
or more parameters and fits the experimental data to calculate the optimal response of
the system. It has been extensively used to investigate the optimization of
physicochemical parameters and factors of several fermentation media with various
microorganisms (Chang et al., 2002).
Several researchers employed Response surface Methodology (RSM) with
different statistical design for the production of various bioactive molecules or
secondary metabolites.
Martorella et al. (2012) optimized the culture medium composition for
manganese peroxidase and tyrosinase production by yeast employing a nine
factor Plackett Burman experimental design with statistical analysis. A total of
26 experiments including two extra replicates as centric points were carried out to
achieve the maximum production of manganese peroxidase and tyrosinase.
The experimental design was studied and interpreted using MINITAB 16 (PA, USA)
statistical software to estimate the response of the dependent variable. Production of
L-dopa by Aspergillus niger was reported (Ali and Haq, 2010) and Plackett Burman
61
design was employed to understand the parameter significance analysis aiming at
maximum production. The optimal tyrosinase activity was recorded to be 64.55 U/mg.
Statistical optimization of culture conditions employing RSM for the synthesis of
lipase from Enterobacter aerogenes was reported by Annapurna Kumari et al. (2009).
The influence of temperature, oil concentration, inoculum size, pH and incubation time
were examined and optimization of combined physicochemical variables resulted
1.4 fold (27.25 U/ ml) increase in lipase activity.
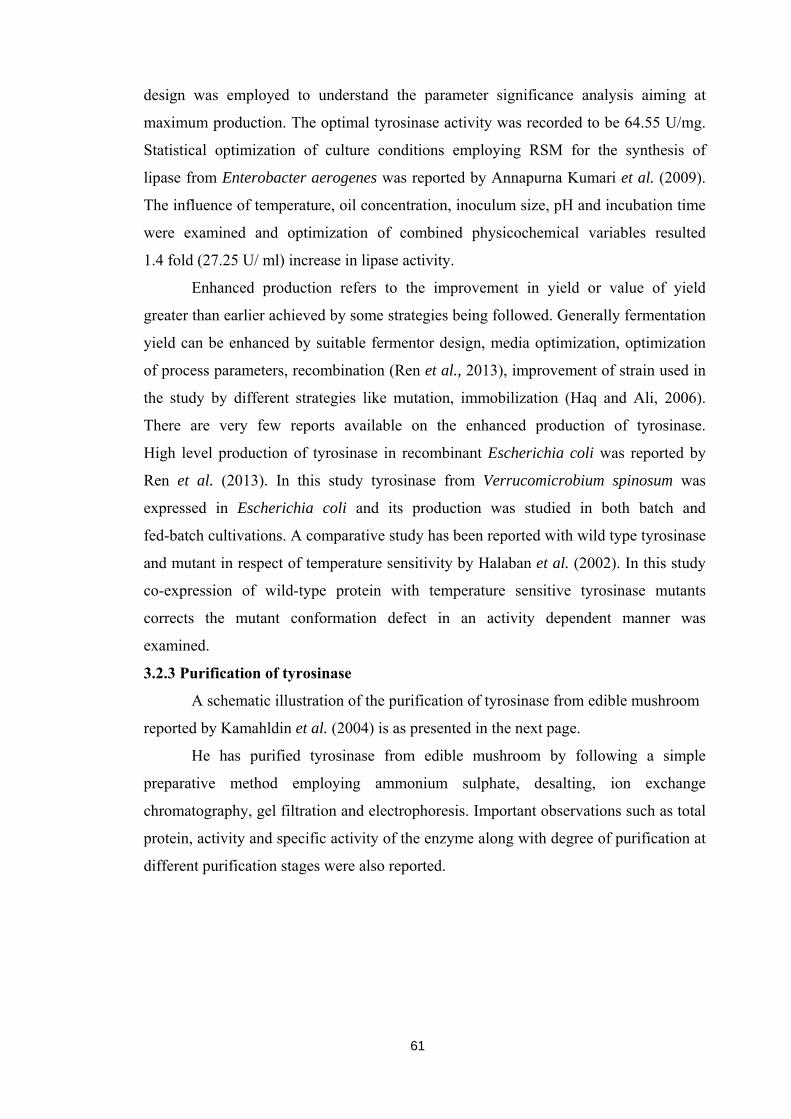
Enhanced production refers to the improvement in yield or value of yield
greater than earlier achieved by some strategies being followed. Generally fermentation
yield can be enhanced by suitable fermentor design, media optimization, optimization
of process parameters, recombination (Ren et al., 2013), improvement of strain used in
the study by different strategies like mutation, immobilization (Haq and Ali, 2006).
There are very few reports available on the enhanced production of tyrosinase.
High level production of tyrosinase in recombinant Escherichia coli was reported by
Ren et al. (2013). In this study tyrosinase from Verrucomicrobium spinosum was
expressed in Escherichia coli and its production was studied in both batch and
fed-batch cultivations. A comparative study has been reported with wild type tyrosinase
and mutant in respect of temperature sensitivity by Halaban et al. (2002). In this study
co-expression of wild-type protein with temperature sensitive tyrosinase mutants
corrects the mutant conformation defect in an activity dependent manner was
examined.
3.2.3 Purification of tyrosinase
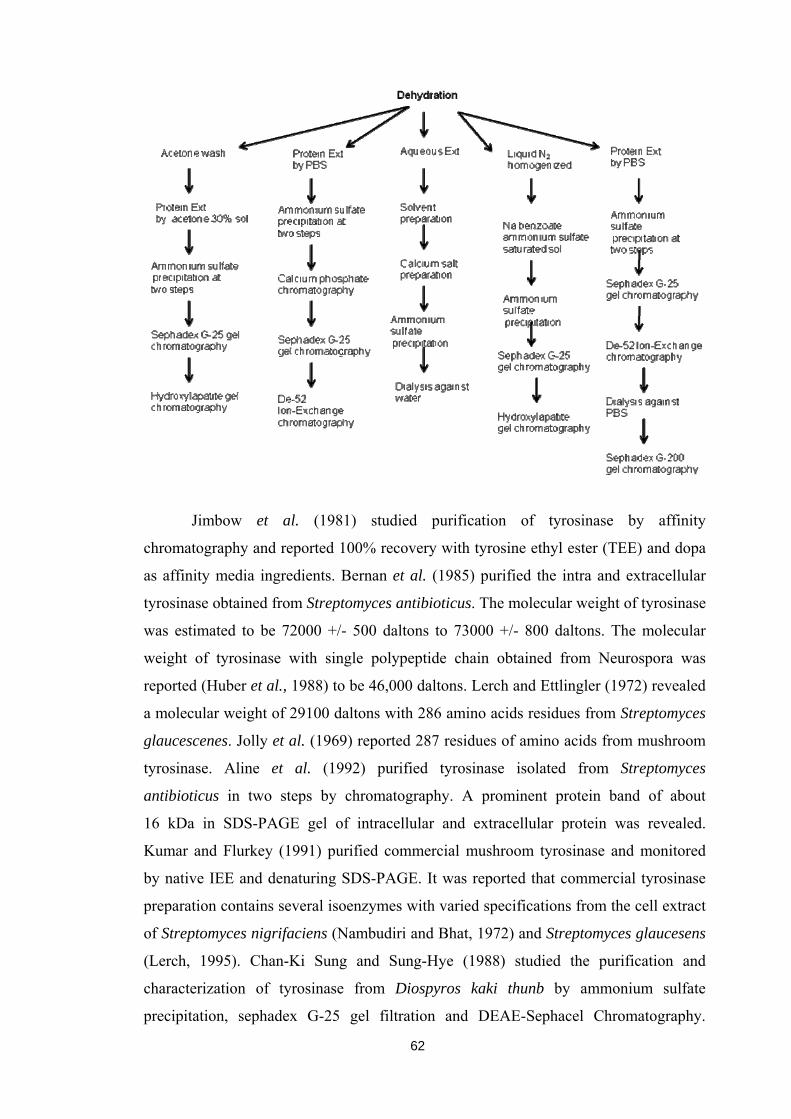
A schematic illustration of the purification of tyrosinase from edible mushroom
reported by Kamahldin et al. (2004) is as presented in the next page.
He has purified tyrosinase from edible mushroom by following a simple
preparative method employing ammonium sulphate, desalting, ion exchange
chromatography, gel filtration and electrophoresis. Important observations such as total
protein, activity and specific activity of the enzyme along with degree of purification at
different purification stages were also reported.
62
Jimbow et al. (1981) studied purification of tyrosinase by affinity
chromatography and reported 100% recovery with tyrosine ethyl ester (TEE) and dopa
as affinity media ingredients. Bernan et al. (1985) purified the intra and extracellular
tyrosinase obtained from Streptomyces antibioticus. The molecular weight of tyrosinase
was estimated to be 72000 +/- 500 daltons to 73000 +/- 800 daltons. The molecular
weight of tyrosinase with single polypeptide chain obtained from Neurospora was
reported (Huber et al., 1988) to be 46,000 daltons. Lerch and Ettlingler (1972) revealed
a molecular weight of 29100 daltons with 286 amino acids residues from Streptomyces
glaucescenes. Jolly et al. (1969) reported 287 residues of amino acids from mushroom
tyrosinase. Aline et al. (1992) purified tyrosinase isolated from Streptomyces
antibioticus in two steps by chromatography. A prominent protein band of about
16 kDa in SDS-PAGE gel of intracellular and extracellular protein was revealed.
Kumar and Flurkey (1991) purified commercial mushroom tyrosinase and monitored
by native IEE and denaturing SDS-PAGE. It was reported that commercial tyrosinase
preparation contains several isoenzymes with varied specifications from the cell extract
of Streptomyces nigrifaciens (Nambudiri and Bhat, 1972) and Streptomyces glaucesens
(Lerch, 1995). Chan-Ki Sung and Sung-Hye (1988) studied the purification and
characterization of tyrosinase from Diospyros kaki thunb by ammonium sulfate
precipitation, sephadex G-25 gel filtration and DEAE-Sephacel Chromatography.

63
It was observed that the molecular weight of tyrosinase was approximately 25,000
daltons with 227 amino acids residues. Masaaki and Kohei (2000) isolated and purified
organic solvent resistant tyrosinase of Streptomyces sp. REN-21 isolated from the soil
of Sakyo-Ku, Kyoto. The tyrosinase was purified by column chromatography and the
molecular weight was reported to be 32000 daltons as a single polypeptide. Dolakshi et
al. (2009) purified the extracellular tyrosinase of Streptomyces albus by aqueous two-
phase system based on polyethylene glycol PEG 8000 (w/w), potassium phosphate
buffer (pH 7.0) followed by ammonium sulphate precipitation and ultrafiltration.
Thereafter, the crude enzyme was loaded on a SEC Sephacryl S-100 column and
ultrafiltration was carried out to obtain 1.17 mg of purified tyrosinase. Claudia and
Gabriela (2011) reviewed recently the production and application of Streptomyces
tyrosinase.
The first bacterial tyrosinases have been purified from cell extracts of
Streptomyces nigrifaciens (Nambudiri and Bhat, 1972) and Streptomyces glaucescens
(Lerch and Ettlinger, 1972). Unlike most eukaryotic tyrosinases, the active form of the
S. glaucescens protein is a monomer, without tendency of concentration dependent
aggregation as shown by analytical ultracentrifugation. The enzyme has a molecular
mass of 29,100 Da in SDS-PAGE. The extracellular tyrosinase of S. glaucescens was
isolated 10 years later from the culture supernatant (Crameri et al., 1984). Bernan et al.
(1985) purified the intra and extracellular tyrosinase of Streptomyces antibioticus.
The extracellular tyrosinase of Streptomyces michiganensis has been isolated from a
fermentation broth (Philip et al., 1991). The purified enzyme exhibited two bands
corresponding to 32,000 and 34,500 Da in SDS-PAGE, however, only one band at
pH 9.0 was confirmed after isoelectric focusing. The enzyme from Streptomyces
castaneoglobisporus has been efficiently over expressed in Escherichia coli and
his-tagged protein purified on a Ni (II)-bound affinity column (Kohashi et al., 2004).
64
3.3. EXPERIMENTAL METHODS
3.3.1. Optimization of submerged bioprocess for the production of tyrosinase
A submerged bioprocess was carried out to optimize various physicochemical
and nutritional variables for the maximum production of tyrosinase.
3.3.1.1. Submerged bioprocess for the production of tyrosinase
A submerged bioprocess (Iyer and Singhal, 2010) was carried out for the
production of extracellular tyrosinase by Streptomyces tuirus DBZ39 in 100 ml tyrosine
broth at laboratory scale. Tyrosine broth was sterilized at 121 0C for 15 min. 1 ml
suspension of five days old test isolate with spore count 1x10⁸ spores/ml was inoculated
into sterilized broth and kept for incubation at 35 0C for 120 h in a shaker incubator at
180 rpm. An enzyme assay, as mentioned earlier under the process of screening was
carried out at every 24 h.
3.3.1.2. Optimization of physicochemical variables
Important physicochemical parameters such as pH, temperature and agitation
speed were optimized for the maximum production of tyrosinase in tyrosine broth
under submerged bioprocess as mentioned earlier. A principle of operating one variable
at a time keeping others constant (Liu and Tzeng, 1998) was followed to record the
optimum conditions. A range of, pH from 7.0 to 9.0 with an increment of 0.5,
temperature from 30 to 50 0C with an increment of 5 0C and agitation speed from
150 to 250 rpm with an increment of 25 rpm were optimized.
3.3.1.3. Optimization of nutritional variables
Major nutritional variables including carbon (Starch, glucose, sucrose, fructose,
cellulose and beef extract, from 0.2 to 1.0 %) and nitrogen (ammonium nitrate, casein,
gelatin, arginine, peptone and tyrosine from 0.2 to 1.0%) sources were optimized by
one variable at-a-time approach and keeping others constant, as mentioned earlier.
Further, various minerals such as, CuSO4, MgSO4, FeSO4, MnSO4, KH2PO4 and
K2HPO4, at the concentration from 0.01 to 0.05% were also optimized. The amount of
tyrosinase produced in the medium was determined at every 24 h by following the
procedure as mentioned earlier.
3.3.2. Response surface methodology for the enhanced production of tyrosinase
Enhanced production of tyrosinase, after the manual process of optimization,
was carried out by following automated statistical optimization under submerged
system using Response Surface Methodology (RSM) with Central Composite Design
(CCD).
65
3.3.2.1. Response Surface Methodology with Central Composite Design
Submerged system fermentation was carried out to understand the influence of
critical process variables namely tyrosine, beef extract, gelatin and copper sulphate.
Central Composite Design (CCD) was followed (Annapurna et al., 2009) to resolve the
optimum combination of all the critical process variables. The CCD of 30 runs was set
using the Design Expert Software, USA (Version 7.0). All the experiments were carried
out in duplicate and average of tyrosinase produced at 96 h was considered as the
dependent variables or responses (Y). The predicted response was calculated from the
second degree polynomial equation, which included all the terms. Y= β0+∑ βiXi+∑
βiiXi2+∑ βijXiXj; where Y stands for the response variable, β0 is the intercept
coefficient; βi represents the coefficient of the linear effect, βii the coefficient of
quadratic effect and βij the ijth interaction coefficient effect. XiXj are input variables
which influence the response variable Y, βi is the ith linear coefficient. The statistical
and numerical analysis of the model was performed with the analysis of variance
(ANOVA). The statistical significance of the model was analyzed by the Fisher’s
F-test, its associated probability P(F), correlation coefficient R and determination
coefficient R2, which explains the quality of polynomial model. For each variable, the
quadratic models were represented as contour plots (three-dimensional) and response
surface curves were created and the model was validated.
3.3.2.2. Analysis of variance (ANOVA)
The statistical and numerical analysis of the model was performed by means of
the analysis of variance. The statistical significance of the model was analyzed by
Fisher’s F-test, its associated probability p(F), correlation coefficient R and
determination coefficient R2 which explains the quality of polynomial model.
The quadratic models were represented as contour plots (3D) and response surface
curves were generated for each variable.
3.3.3. Criteria for the purification of tyrosinase
Different criteria, mentioned in brief as follows, were employed based on
standard techniques for the purification of tyrosinase from the fermented broth at 4 0C.
3.3.3.1. Ammonium sulphate precipitation
About 500 ml of culture filtrate was centrifuged at 10,000 rpm for 10 min at
4 0C. Finely powdered ammonium sulphate was added to the clear supernatant.
The tyrosinase activity was associated with the fraction precipitated at 60 - 90%
saturation. This was carried out with continuous stirring in an ice bath and it was kept
66
at 4 0C for overnight. The precipitate was collected by centrifugation at 10,000 rpm for
10 min. The supernatant was decanted; the precipitate was dissolved in minimum
volume of 10 mM Tris-HCl buffer pH 7.0. Protein estimation was done with Folin-
Phenol reagent using BSA (200 µg/ml) as a standard (Lowry et al., 1951).
3.3.3.2. Dialysis
Activation of membrane (cellulose membrane) was performed as follows.
100 ml distilled water was kept for boiling. Dialysis membrane was placed in water for
10 min. Then 2% sodium carbonate was added and further kept for boiling for 10 min.
Finally the membrane was transferred to fresh water. The precipitate obtained after
ammonium sulphate treatment was dialyzed against 50 mM Tris HCl buffer, pH 7.0
with occasional changes of buffer. Protein estimation was done with Folin-Phenol
reagent using BSA (200 µg/ml) as a standard (Lowry et al., 1951).
3.3.3.3. Ion exchange chromatography
The dialyzed ammonium sulphate fraction was applied to a column of DEAE
cellulose. 2 g of DEAE cellulose was suspended in 10 mM Tris-HCl-NaCl, pH-7.0 and
kept at 4 0C overnight. The column was equilibrated with 0.05 M Tris-HCl, pH 7.0
Swollen DEAE cellulose was loaded into a chromatographic column and allowed to
settle. The sample was loaded to top of the column. The unbound protein was eluted
and the bound protein eluted with linear gradient of NaCl. Each fraction was analyzed
for enzyme activity and protein. The tyrosinase activity was assayed by the molecular
extinction coefficient of dopachrome method as described earlier. Protein estimation
was done with Folin-Phenol reagent using BSA (200 µg/ml) as a standard (Lowry et
al., 1951).
3.3.3.4. Gel filtration chromatography
The concentrated enzyme solution was applied to a Sephadex G-200 column
(39x9 cm), the sample was subjected to gel filtration chromatography using
SEPHADEX G-75 (SIGMA ALDRICH). 2 g of SEPHADEX was suspended in 0.05M
Tri-HCl, pH 7.0 and kept at 4 0C overnight. Before loading, the column was well
equilibrated with 0.05 M Tris-HCl, pH 7.0. Swollen sephadex was loaded into a
chromatographic column and allowed to settle. The 3 ml of the sample was loaded to
top of the column. The enzyme was eluted using 0.05 M Tris HCl, pH 7.0. Flow rate
was adjusted to 0.5 ml/min. Different fraction were collected and each fraction was
assayed for protein by taking absorbance at 280 nm. Protein estimation was done with
Folin-Phenol reagent using BSA (200 µg/ml) as a standard (Lowry et al., 1951).
67
3.3.3.5. Electrophoresis
SDS-PAGE was performed according to the modified method of Laemmli
(1970), with a separating acrylamide gel of 10% and stacking gel 5% containing 0.1%
SDS. The gel was stained with coomassie brilliant blue R-250 and destained. Catalase
(240 kDa), Bovine Serum Albumin (67 kDa) and Ovalbumin (43 kDa) were used as
standard proteins for determination of the molecular weight of tyrosinase.
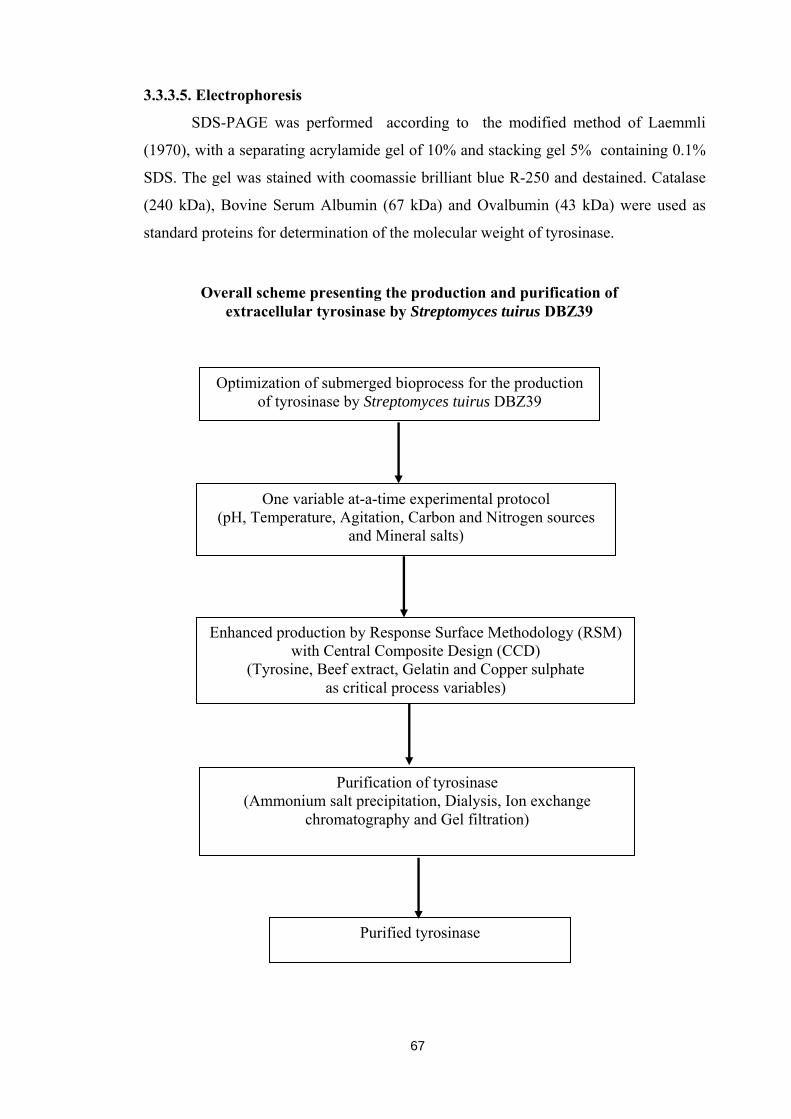
Overall scheme presenting the production and purification of extracellular tyrosinase by Streptomyces tuirus DBZ39
Optimization of submerged bioprocess for the production of tyrosinase by Streptomyces tuirus DBZ39
One variable at-a-time experimental protocol (pH, Temperature, Agitation, Carbon and Nitrogen sources
and Mineral salts)
Enhanced production by Response Surface Methodology (RSM) with Central Composite Design (CCD)
(Tyrosine, Beef extract, Gelatin and Copper sulphate as critical process variables)
Purification of tyrosinase (Ammonium salt precipitation, Dialysis, Ion exchange
chromatography and Gel filtration)
Purified tyrosinase
68
3.4. RESULTS AND DISCUSSION
3.4.1. Production of tyrosinase
Efforts were made in the present study for the maximum production of
tyrosinase by an efficient isolate Streptomyces tuirus DBZ39 in tyrosine medium, at
laboratory scale under submerged system. Important physicochemical and nutritional
variables were optimized at different levels and concentrations to achieve the maximum
production of tyrosinase, operating one variable at a time and keeping others constant.
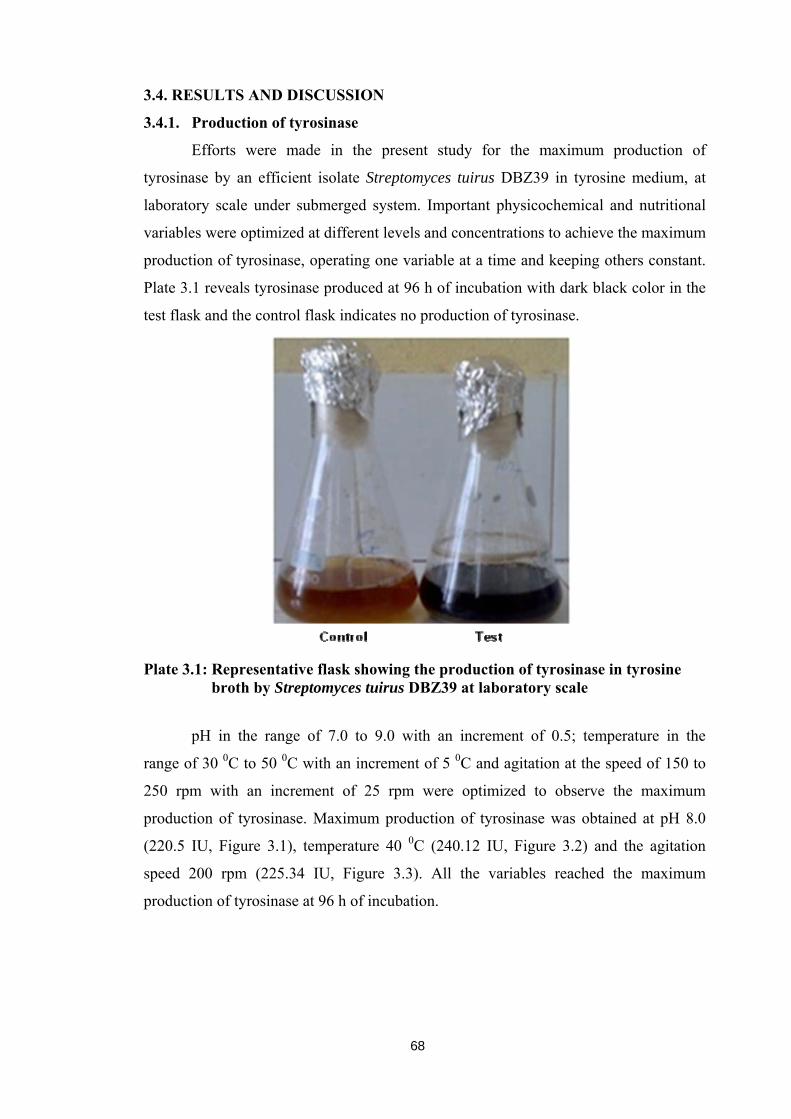
Plate 3.1 reveals tyrosinase produced at 96 h of incubation with dark black color in the
test flask and the control flask indicates no production of tyrosinase.
Plate 3.1: Representative flask showing the production of tyrosinase in tyrosine broth by Streptomyces tuirus DBZ39 at laboratory scale
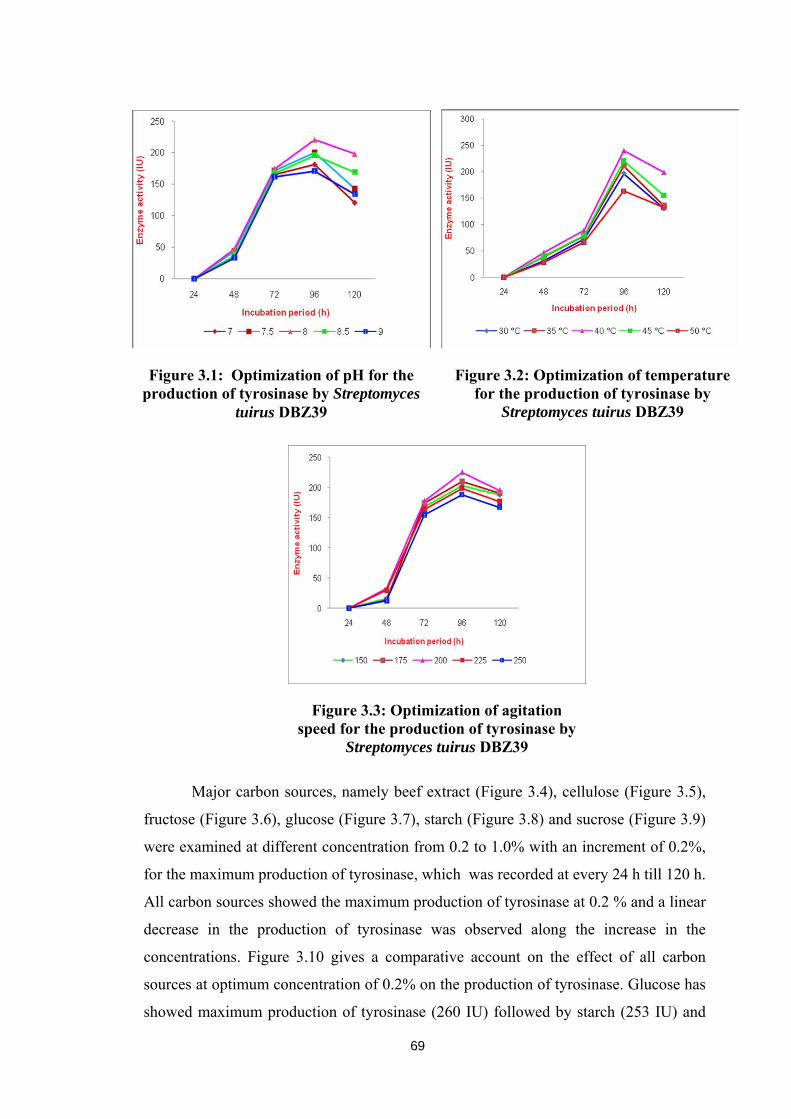
pH in the range of 7.0 to 9.0 with an increment of 0.5; temperature in the
range of 30 0C to 50 0C with an increment of 5 0C and agitation at the speed of 150 to
250 rpm with an increment of 25 rpm were optimized to observe the maximum
production of tyrosinase. Maximum production of tyrosinase was obtained at pH 8.0
(220.5 IU, Figure 3.1), temperature 40 0C (240.12 IU, Figure 3.2) and the agitation
speed 200 rpm (225.34 IU, Figure 3.3). All the variables reached the maximum
production of tyrosinase at 96 h of incubation.
69
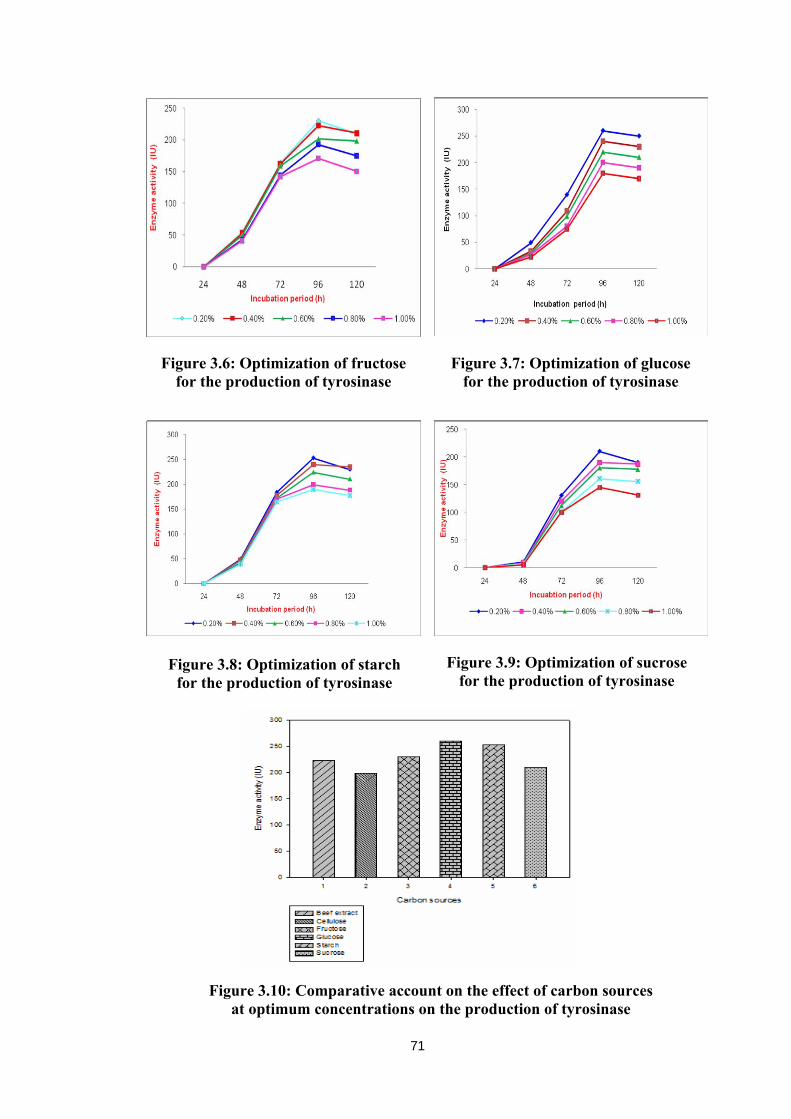
Major carbon sources, namely beef extract (Figure 3.4), cellulose (Figure 3.5),
fructose (Figure 3.6), glucose (Figure 3.7), starch (Figure 3.8) and sucrose (Figure 3.9)
were examined at different concentration from 0.2 to 1.0% with an increment of 0.2%,
for the maximum production of tyrosinase, which was recorded at every 24 h till 120 h.
All carbon sources showed the maximum production of tyrosinase at 0.2 % and a linear
decrease in the production of tyrosinase was observed along the increase in the
concentrations. Figure 3.10 gives a comparative account on the effect of all carbon
sources at optimum concentration of 0.2% on the production of tyrosinase. Glucose has
showed maximum production of tyrosinase (260 IU) followed by starch (253 IU) and
Figure 3.1: Optimization of pH for the production of tyrosinase by Streptomyces
tuirus DBZ39
Figure 3.2: Optimization of temperature for the production of tyrosinase by
Streptomyces tuirus DBZ39
Figure 3.3: Optimization of agitation speed for the production of tyrosinase by
Streptomyces tuirus DBZ39

70
fructose (230 IU). The least production of tyrosinase (198.0 IU) was recorded with
cellulose as carbon sources. However, beef extract and sucrose showed the moderate
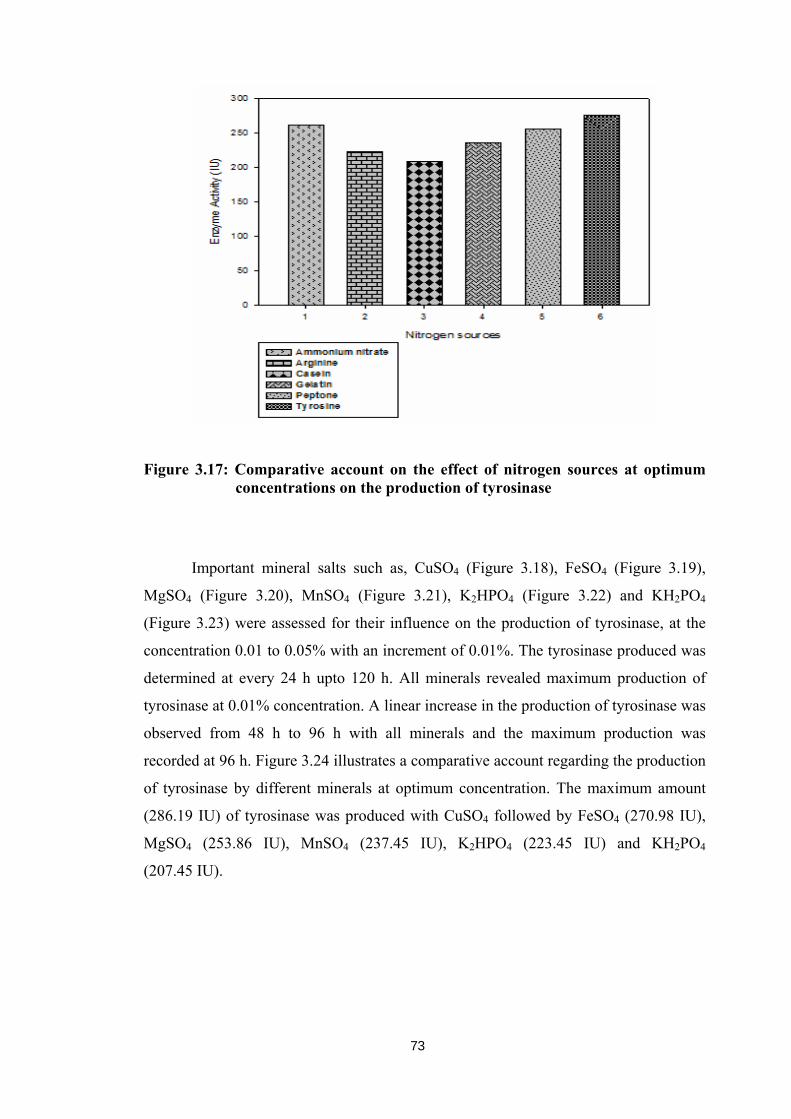
production of tyrosinase with 223 and 210 IU respectively. Important nitrogen sources,
namely ammonium nitrate (Figure 3.11), arginine (Figure 3.12), casein (Figure 3.13),
gelatin (Figure 3.14), peptone (Figure 3.15) and tyrosine (Figure 3.16) were assessed at
different concentrations from 0.2 to 1.0% with an increment of 0.2% for the highest
production of tyrosinase. The production of tyrosinase was recorded at every 24 h upto
120 h. The maximum production of tyrosinase was obtained at 0.2% with all the
nitrogen sources. Figure 3.17 depicts the comparative account on the effect of nitrogen
sources at optimum concentration of 0.2% for the production of tyrosinase. Tyrosine
showed maximum production of tyrosinase (275.1 IU) followed by peptone (255.1 IU)
and ammonium nitrate (262.1 IU). The least production of tyrosinase (209.1 IU) was
recorded with casein as nitrogen source. However, arginine and gelatin showed the
moderate production of tyrosinase with 222.78 and 236.11 IU respectively.
Figure 3.4: Optimization of beef extract for the production of tyrosinase
Figure 3.5: Optimization of cellulose for the production of tyrosinase
71
Figure 3.6: Optimization of fructose for the production of tyrosinase
Figure 3.7: Optimization of glucose for the production of tyrosinase
Figure 3.8: Optimization of starch for the production of tyrosinase
Figure 3.9: Optimization of sucrose for the production of tyrosinase
Figure 3.10: Comparative account on the effect of carbon sources at optimum concentrations on the production of tyrosinase

72
Figure 3.11: Optimization of ammonium nitrate for the production of tyrosinase
Figure 3.12: Optimization of arginine for the production of tyrosinase
Figure 3.13: Optimization of casein for the production of tyrosinase
Figure 3.14: Optimization of gelatin for the production of tyrosinase
Figure 3.15: Optimization of peptone for the production of tyrosinase
Figure 3.16: Optimization of tyrosine for the production of tyrosinase
73
Figure 3.17: Comparative account on the effect of nitrogen sources at optimum concentrations on the production of tyrosinase
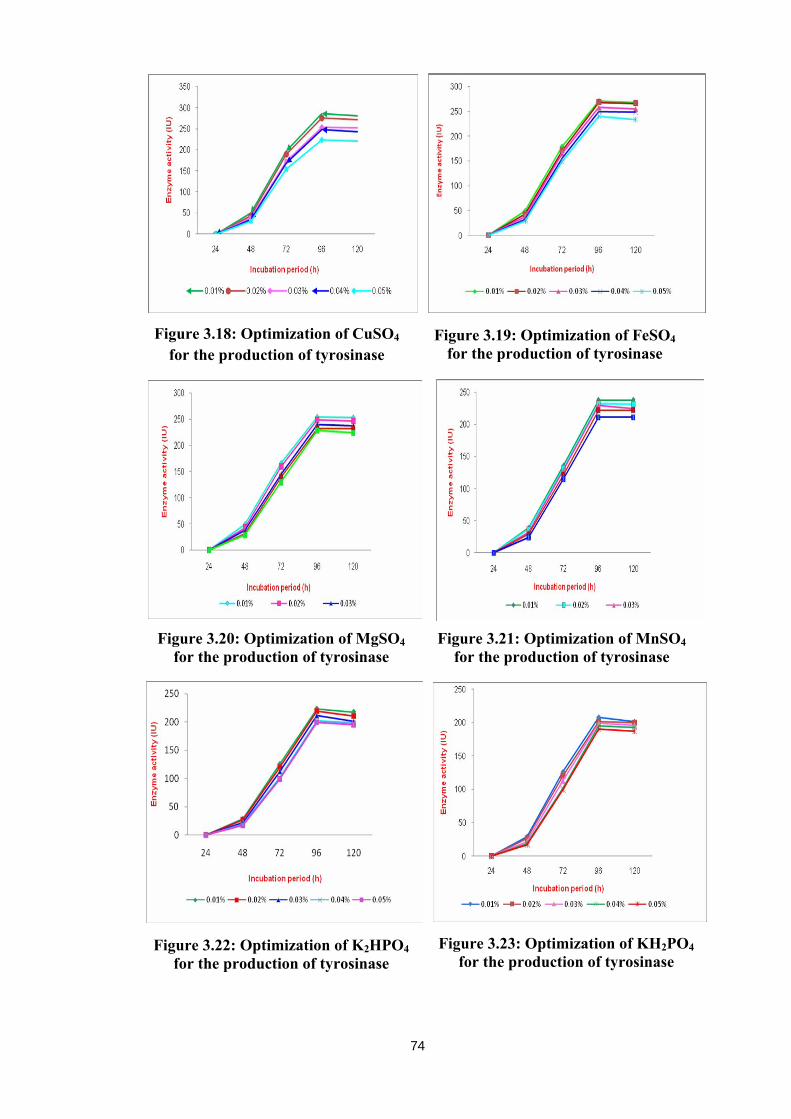
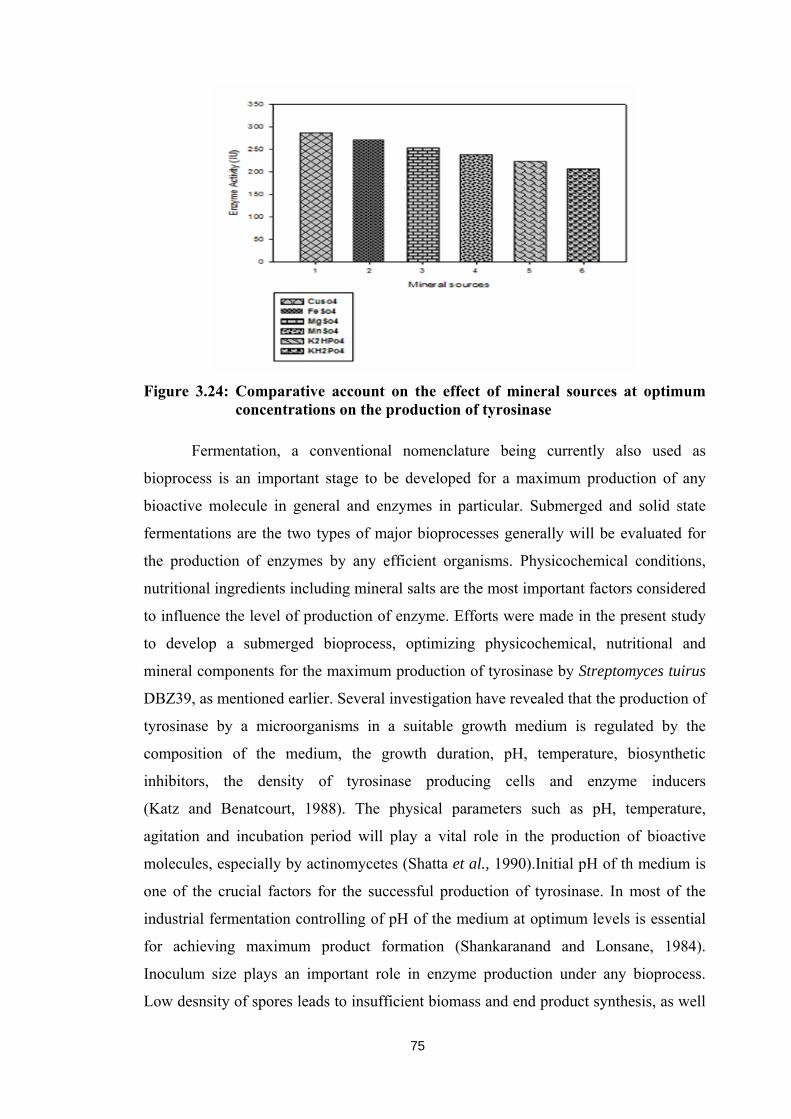
Important mineral salts such as, CuSO4 (Figure 3.18), FeSO4 (Figure 3.19),
MgSO4 (Figure 3.20), MnSO4 (Figure 3.21), K2HPO4 (Figure 3.22) and KH2PO4
(Figure 3.23) were assessed for their influence on the production of tyrosinase, at the
concentration 0.01 to 0.05% with an increment of 0.01%. The tyrosinase produced was
determined at every 24 h upto 120 h. All minerals revealed maximum production of
tyrosinase at 0.01% concentration. A linear increase in the production of tyrosinase was
observed from 48 h to 96 h with all minerals and the maximum production was
recorded at 96 h. Figure 3.24 illustrates a comparative account regarding the production
of tyrosinase by different minerals at optimum concentration. The maximum amount
(286.19 IU) of tyrosinase was produced with CuSO4 followed by FeSO4 (270.98 IU),
MgSO4 (253.86 IU), MnSO4 (237.45 IU), K2HPO4 (223.45 IU) and KH2PO4
(207.45 IU).
74
Figure 3.18: Optimization of CuSO4 for the production of tyrosinase
Figure 3.19: Optimization of FeSO4 for the production of tyrosinase
Figure 3.20: Optimization of MgSO4 for the production of tyrosinase
Figure 3.21: Optimization of MnSO4 for the production of tyrosinase
Figure 3.22: Optimization of K2HPO4 for the production of tyrosinase
Figure 3.23: Optimization of KH2PO4 for the production of tyrosinase
75
Figure 3.24: Comparative account on the effect of mineral sources at optimum concentrations on the production of tyrosinase
Fermentation, a conventional nomenclature being currently also used as
bioprocess is an important stage to be developed for a maximum production of any
bioactive molecule in general and enzymes in particular. Submerged and solid state
fermentations are the two types of major bioprocesses generally will be evaluated for
the production of enzymes by any efficient organisms. Physicochemical conditions,
nutritional ingredients including mineral salts are the most important factors considered
to influence the level of production of enzyme. Efforts were made in the present study
to develop a submerged bioprocess, optimizing physicochemical, nutritional and
mineral components for the maximum production of tyrosinase by Streptomyces tuirus
DBZ39, as mentioned earlier. Several investigation have revealed that the production of
tyrosinase by a microorganisms in a suitable growth medium is regulated by the
composition of the medium, the growth duration, pH, temperature, biosynthetic
inhibitors, the density of tyrosinase producing cells and enzyme inducers
(Katz and Benatcourt, 1988). The physical parameters such as pH, temperature,
agitation and incubation period will play a vital role in the production of bioactive
molecules, especially by actinomycetes (Shatta et al., 1990).Initial pH of th medium is
one of the crucial factors for the successful production of tyrosinase. In most of the
industrial fermentation controlling of pH of the medium at optimum levels is essential
for achieving maximum product formation (Shankaranand and Lonsane, 1984).
Inoculum size plays an important role in enzyme production under any bioprocess.
Low desnsity of spores leads to insufficient biomass and end product synthesis, as well
76
as permits the growth of undesirable contaminants and too high densities of spores may
cause a quick and too much biomass production thereby leading to fast nutrient
depletion and ultimately reduction in the end product quality. An increase in inoculum
generally improves the growth and growth activities of the organism upto a certain
level and with further increase, there could be a reduction in microbial activity due to
nutrient limitations. Due to lower inoculum size, a longer time is required for the
organism to grow upto optimum number to utilize the substrate and form the desired
product (Kashyap, 2002). Temperature is also an important factor that governs the
process of fermentation as well as the recovery of desired product. Transformation of
substrate into product is under the influence of temperature for biochemical coversion
of nutritional reactants to products. Influence of higher range of temperature on
actinomycetes for the maximum production of enzymes is well established. Agitation is
also an important physical factor required for adequate mixing, mass and heat transfer,
as it prevents formation of gradients of these factors in the bioreactor. As such efforts
have been made in the present investigation to understand the influence of all these
factors on the maximum production of tyrosinase. pH 8.0, temperature 40 0C and
agitation speed 200 rpm were found to be optimum for the maximum production
(225.34 IU) of tyrosinase at 96 h of incubation by Streptomyces tuirus DBZ39.
These observations are in confirmation with the findings of several researchers
(Shivaveerakumar et al., 2013; Katz and Benatcourt, 1988).
In expanding the industrial exploitation of microbes, it is likely that more attention
will be directed towards nutritional parameters. The nutritional parameters are the ones that
significantly affect the enzyme production. In the interests of profitability, it is essential to
supply necessary nutrients to ensure optimal growth of an organism, or to maximize
product yield at minimum cost. This can only be achieved by an understanding of what
microorganisms require as nutrients and in some instances, what they don’t (Aharonowitz,
1980). All organisms require energy and the carbon source for their growth. As a source of
cellular material, carbon form major part of the dry weight of actinomycetes. The range of
carbon compounds that can be utilized is vast. The versatility of the microbial world is
illustrated by the fact that all biological synthesized carbon components are biodegradable.
The source and availability of nitrogen and carbon sources also influence the production of
secondary metabolites (Aharonowitz, 1980). The main product of the fermentation process
will often determine the choice of carbon source, particularly if the product results from the
direct dissimilation of it. Most industrial microbes utilize the commonest form of energy in

77
the form of carbon sources such as carbohydrate, lipids and proteins. The rate at which the
carbon source is metabolized often influences the formation of biomass or production of
primary or secondary metabolites (Stanbury et al., 1995). Among all carbon sources,
glucose (0.2%) was found to be most influencing giving maximum production (260 IU) of
tyrosinase at 96 h of incubation. Next to carbon, nitrogen is the source which has most
influence on enzyme production. Nitrogen is among the essential and non metallic
components required by actinomycetes for the structural and functional purpose of the cell.
The requirement of nitrogen source mainly depends on the strain and the substrate
employed during the bioprocess (Pintado et al., 1988). Various nitrogen sources were
examined for the maximum production of tyrosinase in the present investigation. Tyrosine
(0.2%) was proved to be most influencing for the maximum production (275.1 IU) of
tyrosinase. Mineral salts or trace elements have profound effect on the growth and
physiological activities of microorganisms. These much be added as distinct components to
the medium, as they are essential for cell mass formation and also acts as cofactor for
several biosynthetic enzymes. Various mineral salts were examined in the present study to
achieve the maximum production of tyrosinase. Copper sulphate (0.01%) has given the
maximum production (286.19 IU) of tyrosinase at 96 h of incubation.
Several researchers optimized various physicochemical, nutritional and mineral
salts for the production of tyrosinases by bacteria (Liu et al., 2002; Greta et al., 2012)
and fungi (Halaouli et al., 2005; Krishnaveni et al., 2009). However, very few
researchers optimized these conditions for the production of tyrosinase by
Streptomyces (Huber et al., 1985; Claudia and Gabriela, 2011; Shivaveerkumar et al.,
2013; Patil et al., 2012). Recently, Shivaveerkumar et al. (2013) and Patil et al. (2012)
have reported 285 IU and 289 U/mL activities of tyrosinase by different Streptomyces
sp. respectively. In the present investigation, highest production of tyrosinase (286.19
IU) by Streptomyces tuirus DBZ39, at all optimized conditions was reported.
3.4.2. Enhanced production of tyrosinase
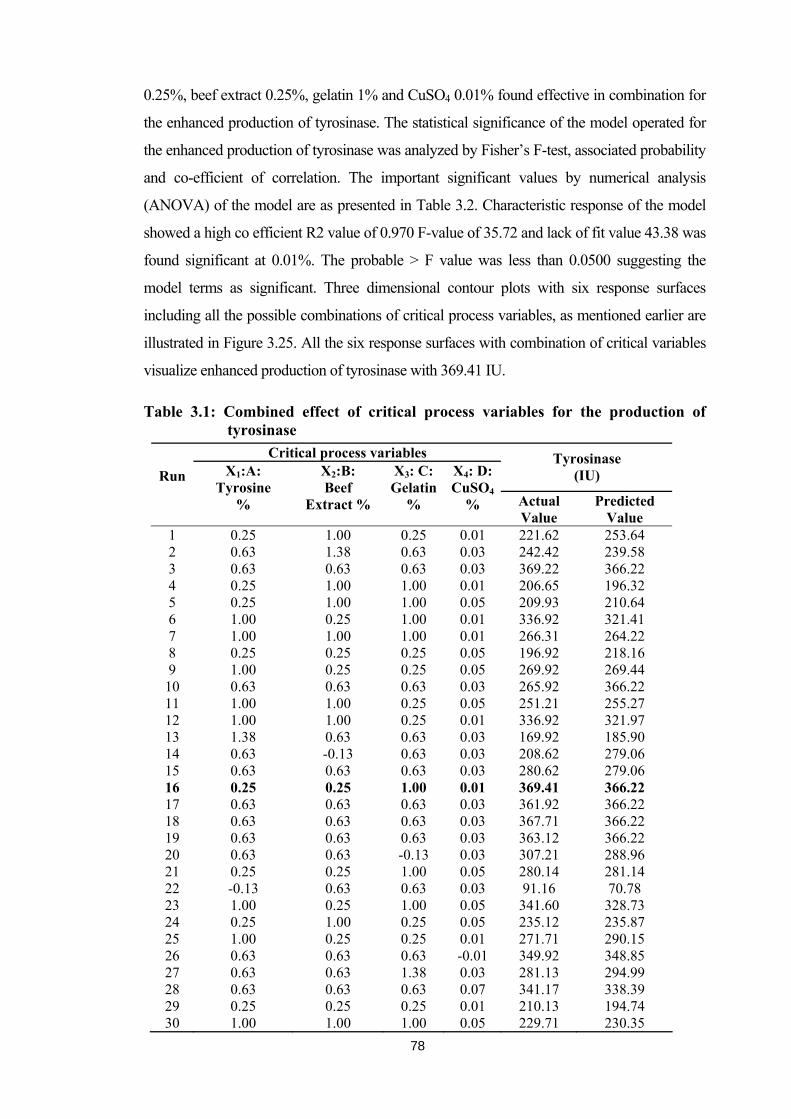
An attempt was made to achieve the enhanced production of tyrosinase, after the
optimization of all important physicochemical and nutritional variables. Combined effect of
critical process variables namely tyrosine, beef extract, gelatin and CuSO4 as X1:A, X2:B,
X3:C and X1:D respectively were evaluated (Table 3.1) by employing Response Surface
Methodology (RSM) with Central Composite Design (CCD). In all, 30 runs were operated
and 16th run showed highest production of tyrosinase with 369.41 IU as actual value against
predicted value of 366.22 IU. Critical process variables at the concentration of tyrosine
78
0.25%, beef extract 0.25%, gelatin 1% and CuSO4 0.01% found effective in combination for
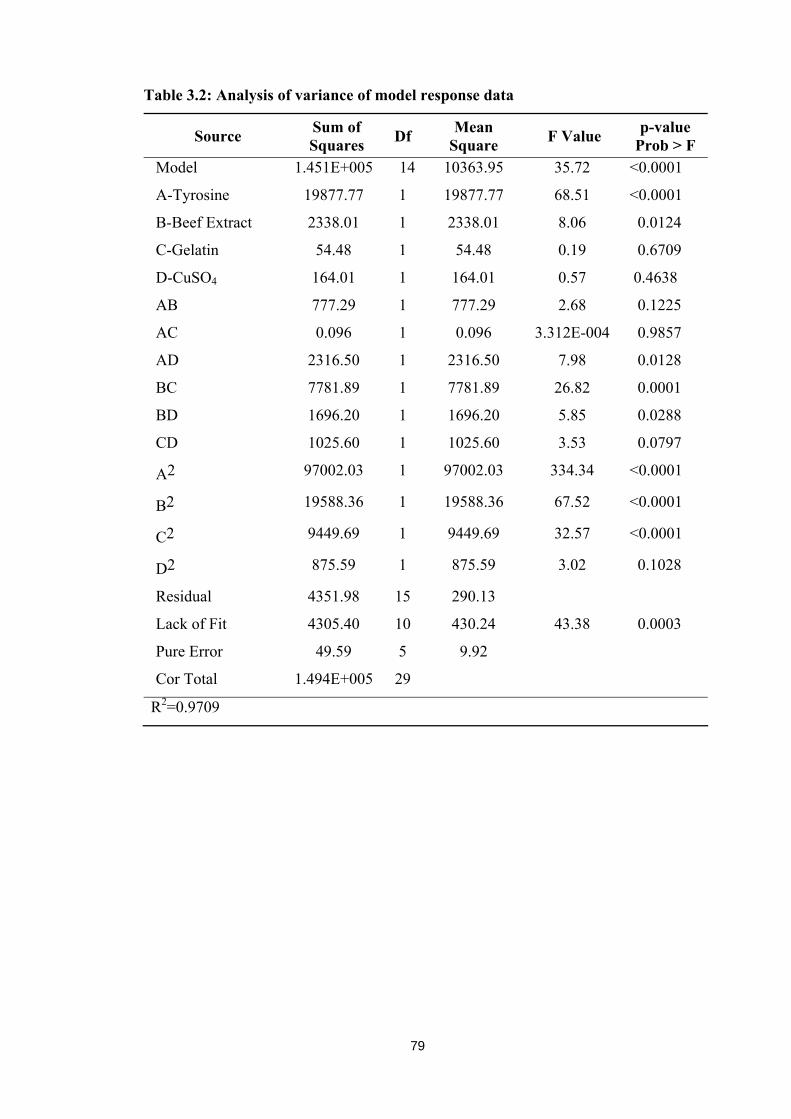
the enhanced production of tyrosinase. The statistical significance of the model operated for
the enhanced production of tyrosinase was analyzed by Fisher’s F-test, associated probability
and co-efficient of correlation. The important significant values by numerical analysis
(ANOVA) of the model are as presented in Table 3.2. Characteristic response of the model
showed a high co efficient R2 value of 0.970 F-value of 35.72 and lack of fit value 43.38 was
found significant at 0.01%. The probable > F value was less than 0.0500 suggesting the
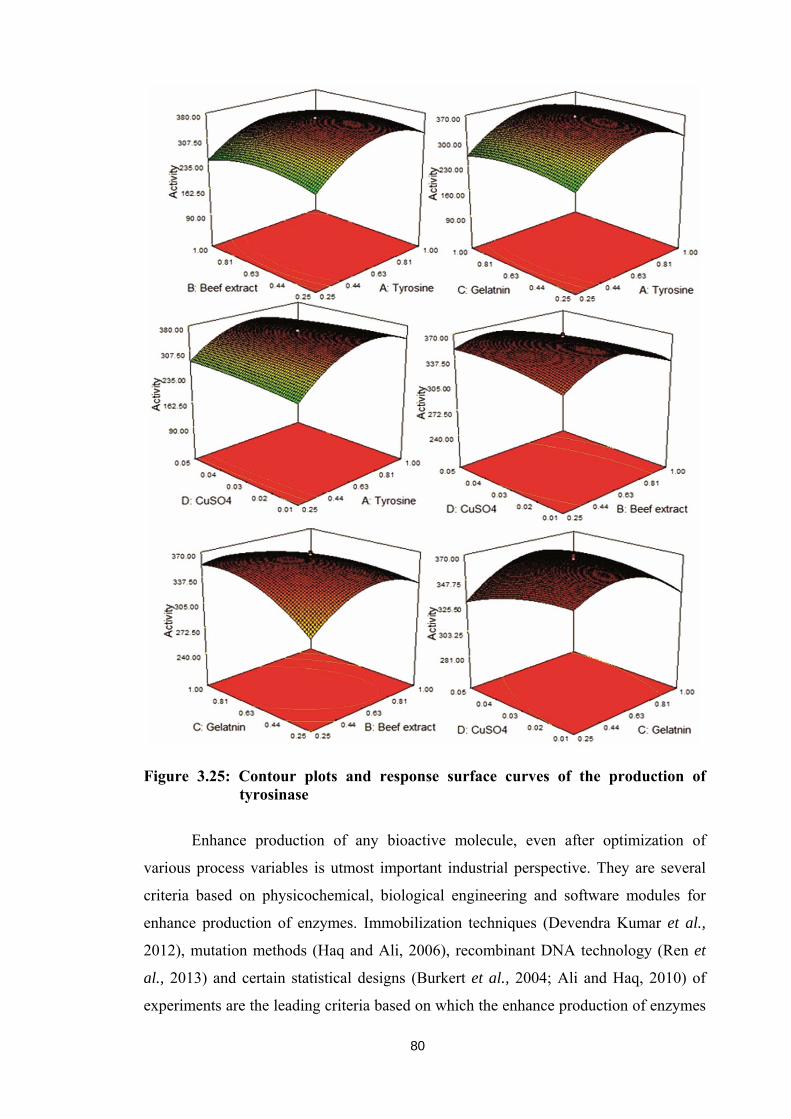
model terms as significant. Three dimensional contour plots with six response surfaces
including all the possible combinations of critical process variables, as mentioned earlier are
illustrated in Figure 3.25. All the six response surfaces with combination of critical variables
visualize enhanced production of tyrosinase with 369.41 IU. Table 3.1: Combined effect of critical process variables for the production of tyrosinase
Critical process variables Tyrosinase (IU) Run
X1:A:
Tyrosine %
X2:B: Beef
Extract %
X3: C: Gelatin
%
X4: D: CuSO4
% Actual Value
Predicted Value
1 0.25 1.00 0.25 0.01 221.62 253.64 2 0.63 1.38 0.63 0.03 242.42 239.58 3 0.63 0.63 0.63 0.03 369.22 366.22 4 0.25 1.00 1.00 0.01 206.65 196.32 5 0.25 1.00 1.00 0.05 209.93 210.64 6 1.00 0.25 1.00 0.01 336.92 321.41 7 1.00 1.00 1.00 0.01 266.31 264.22 8 0.25 0.25 0.25 0.05 196.92 218.16 9 1.00 0.25 0.25 0.05 269.92 269.44
10 0.63 0.63 0.63 0.03 265.92 366.22 11 1.00 1.00 0.25 0.05 251.21 255.27 12 1.00 1.00 0.25 0.01 336.92 321.97 13 1.38 0.63 0.63 0.03 169.92 185.90 14 0.63 -0.13 0.63 0.03 208.62 279.06 15 0.63 0.63 0.63 0.03 280.62 279.06 16 0.25 0.25 1.00 0.01 369.41 366.22 17 0.63 0.63 0.63 0.03 361.92 366.22 18 0.63 0.63 0.63 0.03 367.71 366.22 19 0.63 0.63 0.63 0.03 363.12 366.22 20 0.63 0.63 -0.13 0.03 307.21 288.96 21 0.25 0.25 1.00 0.05 280.14 281.14 22 -0.13 0.63 0.63 0.03 91.16 70.78 23 1.00 0.25 1.00 0.05 341.60 328.73 24 0.25 1.00 0.25 0.05 235.12 235.87 25 1.00 0.25 0.25 0.01 271.71 290.15 26 0.63 0.63 0.63 -0.01 349.92 348.85 27 0.63 0.63 1.38 0.03 281.13 294.99 28 0.63 0.63 0.63 0.07 341.17 338.39 29 0.25 0.25 0.25 0.01 210.13 194.74 30 1.00 1.00 1.00 0.05 229.71 230.35
79
Table 3.2: Analysis of variance of model response data
Source Sum of Squares Df Mean
Square F Value p-value Prob > F
Model 1.451E+005 14 10363.95 35.72 <0.0001
A-Tyrosine 19877.77 1 19877.77 68.51 <0.0001
B-Beef Extract 2338.01 1 2338.01 8.06 0.0124
C-Gelatin 54.48 1 54.48 0.19 0.6709
D-CuSO4 164.01 1 164.01 0.57 0.4638
AB 777.29 1 777.29 2.68 0.1225
AC 0.096 1 0.096 3.312E-004 0.9857
AD 2316.50 1 2316.50 7.98 0.0128
BC 7781.89 1 7781.89 26.82 0.0001
BD 1696.20 1 1696.20 5.85 0.0288
CD 1025.60 1 1025.60 3.53 0.0797
A2 97002.03 1 97002.03 334.34 <0.0001
B2 19588.36 1 19588.36 67.52 <0.0001
C2 9449.69 1 9449.69 32.57 <0.0001
D2 875.59 1 875.59 3.02 0.1028
Residual 4351.98 15 290.13
Lack of Fit 4305.40 10 430.24 43.38 0.0003
Pure Error 49.59 5 9.92
Cor Total 1.494E+005 29
R2=0.9709
80
Figure 3.25: Contour plots and response surface curves of the production of tyrosinase
Enhance production of any bioactive molecule, even after optimization of
various process variables is utmost important industrial perspective. They are several
criteria based on physicochemical, biological engineering and software modules for
enhance production of enzymes. Immobilization techniques (Devendra Kumar et al.,
2012), mutation methods (Haq and Ali, 2006), recombinant DNA technology (Ren et
al., 2013) and certain statistical designs (Burkert et al., 2004; Ali and Haq, 2010) of
experiments are the leading criteria based on which the enhance production of enzymes
81
was achieved by several researchers. To the best of our knowledge, no reports are
available on the enhanced production of tyrosinase by actinomycetes in general and
Streptomyces in particular. Shivaveerkumar et al. (2013) have carried out
immobilization technique as an important means for the enhanced production of
tyrosinase with 310.5 IU by Streptomyces sp. DSV5. Response Surface Methodology is
important software based criteria with a particular experimental design being recently
attracted by various researchers (Annapurna et al., 2009; Chang et al., 2002; Chien et
al., 2006; Madhusudhan et al., 2014) for the production of different bioactive
molecules. In the present investigation response surface methodology with central
composite design was operated effectively to achieve successfully the enhance
production of tyrosinase with 369.41 IU. About 30% increase in the yield of tyrosinase
was achieved when compared to the earlier production at all optimized process
conditions. Tyrosine, gelatin, beef extract and copper sulphate were found to be critical
process variables, which lead in combination to give enhanced yield of tyrosinase.
In addition to the routine all physicochemical and nutritional variables, only few would
act as critical process variables. The critical process variables vary from one organism
to another because of their varied metabolic and physiological nature. Copper sulphate
found to be much more critical process variable for the production of tyrosinase, as
such tyrosinase constitutes copper as an important cluster.
3.4.3. Profile of purified tyrosinase
Table 3.3 illustrates profile of purified tyrosinase. The crude fraction of
tyrosinase gives 369.41 IU/mL activity with a protein content of 15.23 mg/mL and
specific activity of 24.25 IU/mg. The fraction collected after precipitation showed an
enzyme activity of 314.23 IU/mL with a protein content of 9.16 mg/mL and specific
activity of 34.30 IU/mg. Further, after dialysis or desalting the enzyme activity of the
fraction was 242.19 IU/mL a protein content of 1.67 mg/mL and specific activity of
145.02 IU/mg. The fraction collected after ion exchange chromatography and gel
filtration methods, showed enzyme activities of 106.12 IU/mL and 160.60 IU/mL
with a protein content of 0.52 mg/mL and 0.26 mg/mL and specific activity of
352.83 IU/mg and 617.71 IU/mg respectively. Fraction obtained at every stage of
purification exhibit an increase in the degree of purification or fold purification and
naturally a sharp decline in the % yield of enzyme. Ion exchange chromatography and
gel filtration have showed 14.54 and 25.47 fold purification of enzyme respectively.
82
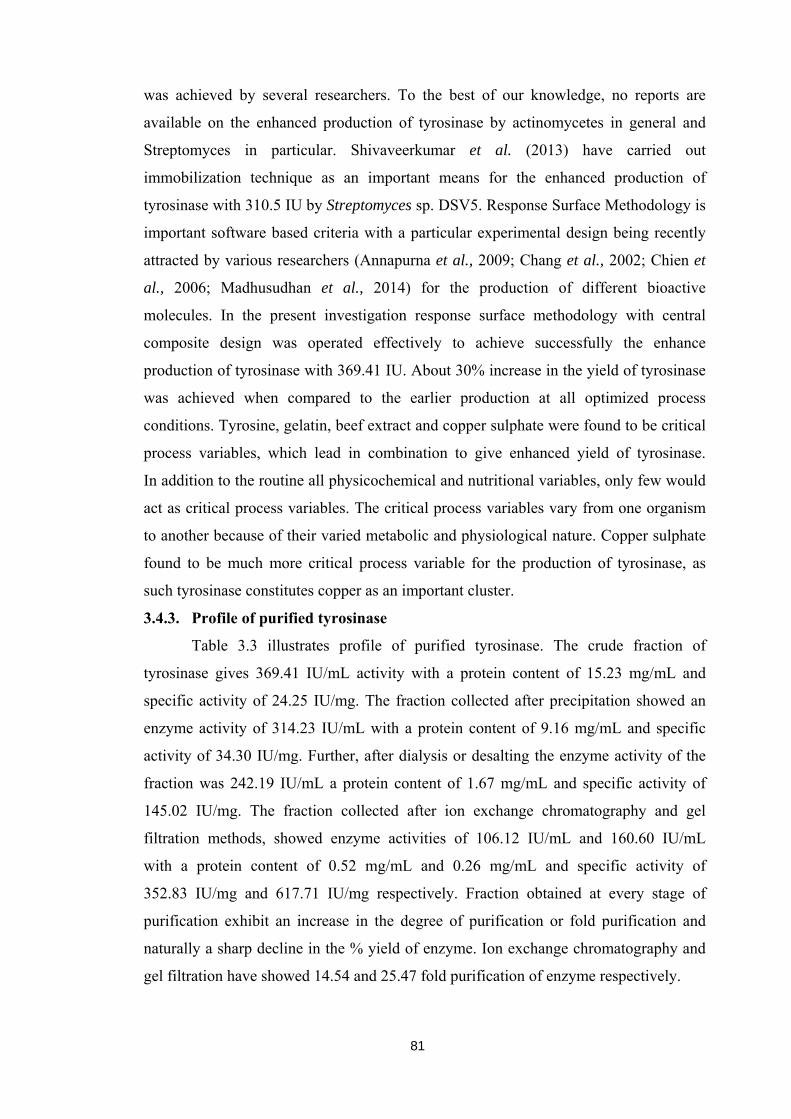
The fraction obtained after ion exchange chromatography containing protein
molecules and impurities were subjected for gel filtration chromatography on sephadex
G-100 column. The fraction 24 showed the highest peak indicating maximum activity
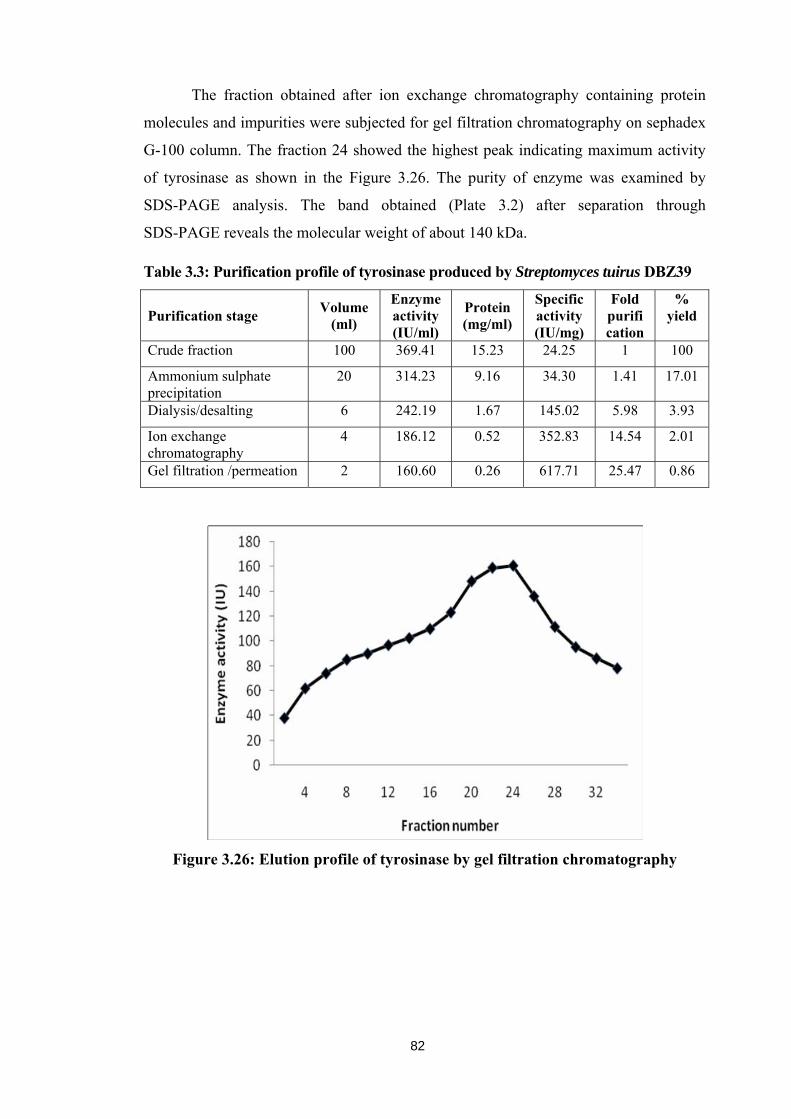
of tyrosinase as shown in the Figure 3.26. The purity of enzyme was examined by
SDS-PAGE analysis. The band obtained (Plate 3.2) after separation through
SDS-PAGE reveals the molecular weight of about 140 kDa.
Table 3.3: Purification profile of tyrosinase produced by Streptomyces tuirus DBZ39
Purification stage Volume (ml)
Enzyme activity (IU/ml)
Protein (mg/ml)
Specific activity (IU/mg)
Fold purifi cation
% yield
Crude fraction 100 369.41 15.23 24.25 1 100
Ammonium sulphate precipitation
20 314.23 9.16 34.30 1.41 17.01
Dialysis/desalting 6 242.19 1.67 145.02 5.98 3.93
Ion exchange chromatography
4 186.12 0.52 352.83 14.54 2.01
Gel filtration /permeation 2 160.60 0.26 617.71 25.47 0.86
Figure 3.26: Elution profile of tyrosinase by gel filtration chromatography
83
Plate 3.2: SDS-PAGE profile of purified tyrosinase
Purification means the act of cleaning by getting rid of impurities.
Product recovery during any bioprocess is difficult since the diluted and liable products
of interest are always mixed with macromolecules of similar properties. Based on the
production technique, downstream process can be designed. It is usually achieved by
filtration, centrifugation and precipitation and also by chromatographic techniques such
as ion exchange, gel permeation and affinity chromatography. To confirm purity of the
enzyme and to determine the molecular weight, electrophoresis is performed using
denaturing Poly Acrylamide Gel Electrophoresis (Rath et al., 2009). Enzymes are
nature’s catalysts and their ability to catalyze biochemical reactions under mild
conditions in a highly specific and efficient manner has lead to the inherent in their
exploitation as industrial catalysts. Nonetheless, industrial application is often
hampered by a lack of long-term operational stability and difficult recovery and re-use
of the enzyme. These drawbacks can often be overcome by immobilization of the
enzyme (Sheldon, 2007). In the present study, tyrosinase was purified by following
standard protocols.
A greater variation was recorded in the profile tyrosinase at different stages.
Ion exchange chromatography and gel filtration stages revealed a fine purification with
higher fold. However, fraction 24 of gel filtration showed 25.47 fold purification of

84
tyrosinase. The purity of tyrosinase was confirmed by SDS-PAGE and it denotes the
molecular weight of about 140 kDa. Purified tyrosinases from different sources were
reported by several researchers (Burnett, 1971; Masaaki and Kohei, 2000; Kamahldin
et al., 2004). It is clear from the available literature that degree of purification, protein
content, enzyme activity and specific are highly varied referred to be based on the
number of amino acid residues with varied number of copper clusters. However,
indepth studies are essential to understand further attributes of purified tyrosinase.
3.5. CONCLUSIONS
Important physicochemical conditions, nutritional variables and minerals salts
were optimized, manually one at a time and keeping others constant, under submerged
bioprocess for the maximum production of tyrosinase. Streptomyces tuirus DBZ39 has
produced 286.19 IU tyrosinase in tyrosine medium at all optimized process variables.
Tyrosine, beef extract, gelatin and copper sulphate were considered as critical process
variables for the enhanced production of tyrosinase employing Response Surface
Methodology with Central Composite Design. Streptomyces tuirus DBZ39 has
produced an enhanced amount of tyrosinase with actual value of 369.41 IU against
predicted value of 366.22 IU, at 16th run. Thus produced tyrosinase showed a molecular
weight of 140 kDa on its purification based SDS-PAGE.

85
CHAPTER 4
SYNTHESIS AND CHARACTERIZATION OF GOLD NANOPARTICLES
4.1. PREFACE
There is a tremendous excitement in microbial synthesis of metallic
nanoparticles. Nanoparticles are referred to particle whose dimensions are controlled in
the order of 100 nm or less and it is one billionth of a meter (10-9). These nanoparticles
are attracting significant attention because of their unique structures and exotic
properties, those can be systematically manipulated by adjusting the size, composition
and shape (Jain et al., 2006). The development of techniques for the controlled
synthesis of nanoparticles of well defined size and shape is a big challenge and
numerous chemical methods for the production of metal nanoparticles are not regarded
as being environmental friendly (Gamez et al., 2002). As a result, researchers in the
field of nanoparticles synthesis have turned to biological systems for inspiration.
Most of the biological sources are known to synthesize nanoparticles. Among
microorganisms, actinomycetes, due to their diverse metabolic and physiological
nature, are most attracted recently for the synthesis of extracellular metallic
nanoparticles.
Bioreduction of metal nanoparticles is regarded as an organism’s survival
mechanism against toxic metal ions (Murali Sastry et al., 2003). During the synthesis of
gold nanoparticles, Au+ ions are trapped on the surface of cells by electrostatic
interaction between Au+ and negatively charged carboxylate group present in NADH-
dependent reductase enzyme of the cell wall leading to the synthesis of gold nuclei at
nanoscale (Daniel et al., 2004). Several advanced physicochemical techniques namely
UV-vis absorption, Electron Microscopy, Energy Dispersive X-ray analysis, Fourier
Transmission Infrared analysis and X-ray Diffraction analysis are commonly being
used to confirm and characterize the nanoparticles.
Extracellular synthesis of gold nanoparticles by Streptomyces tuirus DBZ39 in
optimized process conditions and the characterization of gold nanoparticles by various
analytical techniques are presented in this chapter.