chapter 3 prospects of the sugarcane expansion in brazil...
TRANSCRIPT

Sugarcane ethanol 63
Chapter 3 Prospects of the sugarcane expansion in Brazil: impacts on direct and indirect land use changes
André Meloni Nassar, Bernardo F.T. Rudor!, Laura Barcellos Antoniazzi, Daniel Alves de Aguiar, Miriam Rumenos Piedade Bacchi and Marcos Adami
1. Introduction
Sugarcane has been an important crop since the initial colonization period of Brazil and is nowadays expanding considerably its cultivated area, particularly due to strong ethanol demand. Ethanol demand has been increasing in the internal market since 2003 - due to the expansion of the !ex-fuel car !eet - and is also facing good perspectives in the international market. From 2000 to 2007 the cultivated sugarcane area increased by about 3 million ha, reaching about 7.9 million ha based on information from IBGE (2008a). "e South-Central region was responsible for 95.7% of this total growth.
Sustainability of agricultural based biofuels has turned into a central question once the use of biofuels with the aim to reduce greenhouses gases’ (GHG) emissions increases. "e full life cycle analysis of the production process of every feedstock, based on carbon equivalent emissions, is the essential measure for assessing the sustainability of biofuels.
"e agricultural component of the biofuel production is, therefore, a key variable for determining the avoided carbon emissions. Agricultural products are, by its nature, large land users. Crops - annual and permanent - and cattle - for dairy and beef - occupy about 77 and 172 million ha, respectively, in Brazil (IBGE, 2008b). Land use changes due to the competition between crops and cattle may raise concerns in terms of GHG emissions and it becomes even more important when land with natural vegetation (mainly forests and Cerrado) is converted into cattle raising or agricultural production. "ere is no recognized and unquestionable methodology to measure the amount of deforestation caused by agricultural expansion. However, the amount of land allocated to pastures and crops in the frontier are indicators that both processes are correlated.
Given that sustainability of Brazilian ethanol is intrinsically associated to the sugarcane expansion’s e#ects on land use changes, this paper aims to analyze past and expected sugarcane expansion in Brazil and to understand the land use change process. Competition between food and biofuel increases the importance of this issue and has been adding also social and economic concerns about land use change caused by biofuels’ expansion. Di#erent opinions from many international organizations, national governments, NGOs and researchers are putting this debate in the centre of media and public opinion worldwide.

64 Sugarcane ethanol
Chapter 3
Considering that this debate has not yet been explored in depth in Brazil, this paper aims to support these discussions with technical and scienti!c arguments.
Land use change, as a consequence of the expansion of agricultural production as well as due to the competition for land among agricultural activities, is an issue under development in Brazil in terms of economic analysis and modeling. With exception of the analysis focused on land use changes related to deforestation in the Brazilian Amazon, which is well monitored by Brazilian government agencies and environmentalists non-pro!t organizations, there is not regular monitoring of the conversion of natural landscapes into agricultural uses. Furthermore, there is a lack of economic models that are able to explain and predict land allocation and land use change as a consequence of the dynamics of crops and pasture land. "is paper is a result of one of the initiatives under development in Brazil in order to clarify this issue.
However, the complexity associated to measure land use change in the context of assessing biofuel’s carbon life cycle is largely related to the extension of the concept. Two approaches are under scrutiny: direct land use change (LUC); and indirect land use change (ILUC). "e objectives of the present study are to measure and evaluate direct changes of land use caused by the sugarcane expansion over the last years as well as the consequences of future expected expansion. Land use changes are measured in terms of crops and pasture directly displaced by the sugarcane expansion. "e study also aims to discuss indirect land use change related to Brazilian sugarcane expansion. Information and data are presented in order to evaluate e#ect-cause relationships between sugarcane and other agricultural expansion areas.
"e measurement of land use changes as a consequence of agricultural production expansion, looking to the past and forecasting the future, is a very dynamic and complex process. "is paper searches for support on di#erent methodologies to understand this process: (1) when measuring the past land use change, primary data based on remote sensing images and environmental licensing reports as well as secondary data based on planted and harvested area are used; (2) with respect of projections of land allocated to sugarcane, a partial equilibrium model based on pro!tability and demand/supply responses to price variations is developed.
"e paper is organized as follows. Section two introduces the discussion of the dynamics of the sugarcane expansion in Brazil and shows that the expansion is highly concentrated in the South-Central region. Section three presents the di#erent methodologies used in this study to measure land use change due to past and future expansion of sugarcane. Section four is also divided in two perspectives, past and future expansion, and presents the results of the assessment of the sugarcane expansion and the consequent crop and pasture displacement. Conclusions and recommendations are presented in section !ve.

Sugarcane ethanol 65
Prospects of the sugarcane expansion in Brazil
2. The dynamics of sugarcane expansion in Brazil
Before discussing land use changes caused by the sugarcane expansion, it is important to know how the sugarcane crop is spatially distributed in Brazil. Almost all of the sugarcane in Brazil is produced in the South-Central and Northeast regions. !ese two regions are considered separately due to its di"erent harvest seasons: the #rst is from April to October and the second from November to March.
Based on data from the Canasat Project for the states of São Paulo, Minas Gerais, Paraná, Mato Grosso, Mato Grosso do Sul and Goiás and from the IBGE (Brazilian Institute of Geography and Statistics) for all other states, it is estimated that in 2008 the cultivated area in the South-Central region was 7.4 million ha (85.0%) and in the Northeast region was 1.3 million ha (14.7%).
Figure 1 presents the evolution of sugarcane area for three regions: South-Central (comprising its six most important states)2, Northeast and all the other states. According to the statistics of IBGE the Northeast region has a relative steady sugarcane area, presenting a mean annual growth rate of only 2%; while in the South-Central region the annual growth rate was 16% over the last four years being responsible for 95.4% of the total sugarcane area expansion in Brazil from 2005 to 2008. During this period the sugarcane area in Brazil expanded by an annual rate of 13% (2.6 million ha) going from 6.1 to 8.7 million ha (Figure 1).
São Paulo is the most important state for sugarcane, representing 55.7% of the total sugarcane area in Brazil in 2008. !e four states with the largest sugarcane area are São Paulo, Paraná, Minas Gerais and Goiás which are responsible for 75.2% of total sugarcane area in Brazil. Coincidently, these states plus Mato Grosso and Mato Grosso do Sul have experienced the greatest sugarcane expansion area over the last years. A new and promising region for sugarcane is located in the states of Maranhão, Piauí and Tocantins, in the Cerrado biome, commonly known in Brazil as the MAPITO region; however, in 2008 these states were responsible for only 0.25% of the cultivated sugarcane area in Brazil.
South-Central, including MAPITO region, is here called Expanded South-Central and is considered to be a relevant region for sugarcane expansion analysis. !e sugarcane area in the Expanded South-Central in 2008 was 7.5 million hectares (84% of total area) and represents 97% of the total sugarcane expansion. In all other Brazilian states not included in the Expanded South-Central and Northeast regions, which accounts for 3% of the total sugarcane area, a reduction of 13.7 thousand hectares was observed from 2005 to 2008.
2 Although South-Central region is commonly de#ned as the states in South, Southeast and Centre-West political regions, this paper refers to the South-Central as a region comprising São Paulo, Minas Gerais, Paraná, Goiás, Mato Grosso do Sul and Mato Grosso. !is de#nition is in line with the satellite images monitored by the Canasat Project, due to the fact they are the most important states in terms of sugarcane expansion.

66 Sugarcane ethanol
Chapter 3
!erefore, for this work the evaluation of the conversion of land use and occupation for sugarcane is restricted to a reduced South-Central region that comprises the states of São Paulo, Minas Gerais, Goiás, Paraná, Mato Grosso do Sul and Mato Grosso (or South-Central region minus the states of Rio de Janeiro, Espírito Santo, Santa Catarina and Rio Grande do Sul)3 in Sections 3.1 and 4.1 and these states plus Maranhão, Piauí, Tocantins and Bahia in Sections 3.2 and 4.2. As a means of illustration, a detailed visualization of the sugarcane distribution in the South-Central region is presented in Figure 2.
3. Methodology
!is papers divides the analysis of land use changes (LUC) caused by sugarcane expansion basically in observed LUC (past trend) and projected LUC (future trend). !ree di"erent methods were used to estimate past land use dynamics, and another one to project future trend. For observed LUC and sugarcane expansion, we used the information extracted from remote sensing images, secondary data by IBGE, and #eld research through environmental licensing studies. !e satellite image analysis was carried out for São Paulo, Minas Gerais, Paraná, Goiás, Mato Grosso and Mato Grosso do Sul. Using IBGE data, all these states plus Tocantins, Maranhão, Piauí and Bahia were analyzed due to their potentiality for future expansion of agricultural area in Brazil. For the #eld research, the analyzed states were São
3 !e states of Rio de Janeiro, Espírito Santo, Santa Catarina and Rio Grande do Sul are part of the South-Central region but represent only 3.2% of the cultivated sugarcane area in 2008 and have not shown relevant sugarcane expansion over the last years (Table 3).
Figure 1. Sugarcane area cultivated in Brazil according to production regions (2005 to 2008).Sources: (a) Canasat/INPE, comprising São Paulo, Minas Gerais, Paraná, Goiás, Mato Grosso and Mato Grosso do Sul; (b) PAM/IBGE (2005 and 2006) and LSPA/IBGE (2007 and 2008).
0
1,000
2,000
3,000
4,000
5,000
6,000
7,000
8,000
9,000
2005 2006 2007 2008
1,00
0 ha !
South-Central (a)! Northeast (b)! Other (b)!
Annual growth rate (2005 to 2008)South-Central 16% p.a.Northeast 2% p.a.Other 2% p.a.Brazil 13% p.a.

Sugarcane ethanol 67
Prospects of the sugarcane expansion in Brazil
Paulo, Minas Gerais, Mato Grosso, Mato Grosso do Sul, Goiás and Tocantins, capturing both past and near future trends. A deeper description of each method follows below.
It is important to clarify the available sources of data regarding sugarcane area in Brazil, since di!erent ones are used for di!erent purposes here. "e Brazilian Institute for Geography and Statistics (IBGE) is the Brazilian o#cial organization which provides data on crops area, production, yield, and several others variables. For estimation of planted and harvested sugarcane area, two IBGE databases can be used: one from the systematical survey on agricultural production (LSPA – Levantamento Sistemático da Produção Agrícola) and the other from the agricultural production by municipality (PAM – Produção Agrícola Municipal). While the former includes all area occupied with sugarcane – which consists of areas to be harvested and new areas, to be harvested only next year – the latter just includes harvested area in a certain year4. PAM data is available for all geographic scales, from 1990 to 2006 while LSPA data are forecasts from previous and current years subjected to change.
4 Sugarcane crop is harvested yearly for 5 or 6 consecutive years. In general, a$er that period the sugarcane %eld is renewed and generally rotated for soil improvement during one season with a crop from the Leguminosae family. Planted area (or total land occupied by sugarcane), therefore, is the area available for harvest of sugarcane plus the area of sugarcane that is being renewed.
Figure 2. Spatial distribution of sugarcane crop in 2007 in the South-Central region of Brazil. Source: INPE (www.dsr.inpe.br/canasat/).

68 Sugarcane ethanol
Chapter 3
Another source of data on sugarcane planted area is the National Food Supply Company (CONAB). CONAB data, which are presented in a crop assessment reports, are not used in this study.
Sugarcane planted area is also provided on the Canasat Project, coordinated by the National Institute for Space Research (INPE). Canasat Project monitors the most important producing states and estimates the planted area from remote sensing satellite images. A summary of data available in Brazil is presented in the Table 1.
3.1. Measuring the LUC using remote sensing images
Remote sensing satellite images from the Earth surface are an important source of information to evaluate the fast land use changes observed by the dynamic agricultural activity. Brazil, through its National Institute for Space Research (INPE), acquires remote sensing images from both Landsat and CBERS satellites since 1973 and 1999, respectively. In 2003, INPE started the Canasat Project together with UNICA (Sugarcane Industry Association), CEPEA (Center for Advanced Studies on Applied Economics) and CTC (Center of Sugarcane Technology) to map the cultivated sugarcane area in the South-Central region of Brazil using remote sensing images (www.dsr.inpe.br/canasat/).
!e mapping began in São Paulo State in 2003 and in 2005 it was extended to the states of Minas Gerais, Goiás, Mato Grosso do Sul and Mato Grosso where sugarcane production has been most intensi"ed over the last years. In order to obtain an accurate thematic map, multitemporal images were acquired at speci"c periods to correctly identify the sugarcane "elds and to clearly distinguishing them from other targets (Rudor# and Sugawara, 2007). !e mapping procedure was mainly performed through visual interpretation on the computer screen using the SPRING so$ware (www.dpi.inpe.br/spring/), which is a Geographic Information System (GIS) with digital image processing capabilities.
Table 1. Sugarcane area in Brazil (sources of data available).
Source Data gathering Period available Data presented Aggregation level
IBGE LSPA survey 1990-2006 planted area and harvested area
state (Brazil)
PAM survey 1990-2006 harvested area municipality (Brazil) CONAB crop assessment 2005, 2007-2008 planted area state (Brazil) INPE/Canasat satellite images 2003/2005 - 2008 planted area municipality (South-
Centre)

Sugarcane ethanol 69
Prospects of the sugarcane expansion in Brazil
Results from the thematic maps of the Canasat Project presented in Section 4.1 refer to the total cultivated sugarcane area which includes the !elds being renewed with the 18 months sugarcane plant, the !elds planted in new areas (expansion) and the !elds of sugarcane ratoons (Sugawara et al., 2008). Prior land use identi!cation for the expanded sugarcane plantations in each year was carried out using remote sensing images acquired before the land use change to sugarcane. "is evaluation was accomplished in São Paulo for the years of 2005 to 2008, and for the years of 2007 and 2008 for the States of Minas Gerais, Goiás, Paraná, Mato Grosso do Sul and Mato Grosso.
Four classes of land use and occupation were de!ned, as follows: Agriculture, for cultivated and bare soil !elds; Pasture, for natural and anthropogenic pasture land; Reforestation, for reforested areas with Pinus and Eucalyptus; and Forest, for riparian forests and other forests no matter the stage of succession. In São Paulo State the Citrus class was also considered due to its relevance in terms of land occupation and change to sugarcane. "ese !ve classes were responsible for almost all of the changes to sugarcane. Figure 3 illustrates each of these classes over some Landsat images acquired at two di#erent dates prior to the change and one date a$er the change to sugarcane. Figure 3a highlights a !eld classi!ed as Agriculture. On Date 1 (March of 2003), the !eld has the appearance of bare soil (medium-gray), and on Date 2 (May of 2003), it is covered with a winter crop - probably maize. On Date 3 (April of 2008), a well grown sugarcane !eld can be clearly identi!ed (light-gray with well de!ned pathways). An example for the Pasture class is illustrated in Figure 3b where it appears as a mixture of di#erent amounts of vegetation and soil (medium/light-gray). On Date 1, the vegetation amount is dominant (end of rain season) whereas on Date 2 the soil becomes dominant due to a reduction in the green vegetation amount in response to less available water to the plant (mid dry season). On Date 3, a sugarcane !eld can be observed in substitution to the pasture !eld. Figure 3c illustrates the Citrus class with its typical pattern on Date 1 and 2, and a sugarcane !eld on Date 3. Figure 3d presents a typical !eld for the Forest class (Dates 1 and 2) that was changed to sugarcane (Date 3). A !eld changed from the Reforestation class to sugarcane is illustrated in Figure 3e.
It is worth to mention that Figure 3 only illustrates, in a simpli!ed way, part of the whole procedure used to identify the di#erent land use classes that were displaced to sugarcane in each year over the analyzed period. In several occasions a greater number of images were necessary to clearly identify the classes that were changed to sugarcane. "e SPRING so$ware allows coupling images acquired at di#erent dates to alternate views of the same area facilitating the visual interpretation resulting in a better extraction of the correct information registered in the coloured multispectral satellite images.

70 Sugarcane ethanol
Chapter 3
3.2. Measuring the LUC using micro-regional secondary data
!e objective of this method is to analyze the o"cial secondary data about sugarcane and other agricultural land uses in order to verify how substitution among these uses have taken place over the last years, in di#erent areas all over Brazil. Knowing how sugarcane expansion has occurred and how other land uses have behaved is a $rst step to make considerations about LUC and ILUC caused by ethanol production.
!e analysis developed here was based on the Shi%-share model adapted for the purposes of this study. !e Shi%-share model looks at the mix of activities and whether they are shi%ing towards or away from the area being studied (Oliveira et al., 2008).
!e Shi%-share model decomposes the growth area of an agriculture activity in a region over a given period of time into two components: (1) growth e#ect, which is the part of the change attributed to the growth rate of the agriculture as a whole; and (2) an agriculture
Figure 3. Different land use classes over multispectral (bands 3, 4 and 5) black and white Landsat images acquired in March of 2003 (date 1), May of 2003 (date 2), and April of 2008 (date 3).

Sugarcane ethanol 71
Prospects of the sugarcane expansion in Brazil
mix e!ect (substitution e!ect), which is the change in each crop share of the total cultivated area. "e sum of the two e!ects equals to the actual change in total sugarcane area within a region over a time period.
We have used sugarcane and other crops harvested area data from IBGE, by ‘micro-region’, which is an aggregated number of some closely located municipalities with geographic similarities. "e main advantage of using data by ‘micro-region’ is that it is a su#cient small unit so that land substitution is captured in a more direct way, avoiding leakages. Furthermore, the same method using data by municipality has presented some problems, probably due to the fact that municipalities have correlated productive relations and sometimes municipality data are not very accurate.
We have considered 2002 as the baseline year when the last signi$cant sugarcane expansion began and 2006 as the last year of available data from PAM-IBGE. Since expanded sugarcane area, harvested in a certain year, was planted about 12 or 18 months before, the prior land use needs to be observed still another year before. For example, 2006 sugarcane data regards sugarcane harvested in 2006 and most likely planted in the beginning of 2005; therefore, land use prior to the 2005 sugarcane plantation should be observed in the data from 2004. "us we have compared sugarcane expansion from 2002 to 2006 to other land occupation from 2001 to 2005.
"e three land use categories are: (a) sugarcane; (b) other crops (annual and permanent crops, excluding sugarcane and second crops); and (c) pasture. Pasture land was estimated by using cattle stocking rate because data on pasture area are available only on the IBGE Agricultural Census of 1996 and 2006, while cattle herd data is available annually. "us, stocking rate for 1996 and 2006 were calculated and an annual average growth for this period was considered. Pasture area for the analyzed years – 2001 to 2005 – were obtained dividing herd by the stocking rate. Total agricultural area is the sum of these three categories, and should represent agricultural dynamics in general. "e data used for analysis was the di!erence between the $nal period and the baseline, thus positive numbers mean that there was an increase in the period while negative numbers mean that the area has decreased.
Following a logic tree of land use dynamics for the period, the ‘micro-regions’ were divided in six categories (Figure 4). We have only considered for analysis those ‘micro-regions’ where sugarcane area has increased, which means groups 2, 3 and 6. "us expansion of sugarcane was distributed proportionally through decreased areas of pasture land and crops. When it was not possible to allocate sugarcane expansion over these land uses, it was considered not allocated over previous productive areas, meaning whether already anthropized areas not used, such as idle areas, or natural landscapes. Using shi%-share terminology, sugarcane expansion over pasture and crops is considered substitution e!ect, while those over not productive areas are considered growth e!ect.

72 Sugarcane ethanol
Chapter 3
3.3. Case studies through environmental licensing reports (past and near future trend)
!is third method is an empirical study which aims to collect "eld data from sugarcane mills in six states where the crop is under strong expansion or is expected to be in near future: São Paulo, Minas Gerais, Mato Grosso, Mato Grosso do Sul, Goiás and Tocantins5.
Environmental Impact Assessments presented in "les of environmental licenses in governmental bodies can be a useful source of information about many environmental, social and economic impacts caused by any business venture. Environmental licensing is an important instrument present in the Brazilian Environmental Policy and all sugarcane mills are required to have this license to operate. Governmental agencies responsible for issuing environmental licenses - state bodies in this case – de"ne which type of study will be necessary for the entrepreneur to present. !e most complex type of study would be the Environmental Impact Study (EIA, in Portuguese acronym) and the respective Environmental Impact Report (RIMA, which is a synthesis of EIA in a non-technical language). !is study, made by the entrepreneur, contains a full characterization of the business venture, a diagnosis of the surrounding area (here including information on land use), and the impacts it will cause (natural vegetation suppression included). Even in the less complex studies, this kind of information is generally available.
5 State of Paraná was excluded due to research restrictions imposed by the environmental authority of the state government.
Figure 4. Land use dynamics’ categories used for micro-regional secondary data analysis.
1-Pastureandcrops
expansion
6-Sugarcaneover otheractivities
2-Agriculturalexpansion
- -+ +
3-Sugarcaneexpansion
4-Other activitiesexpansion
5-Decliningagriculture
+ -
Pasture landand crops
Pasture landand crops
- + +-
Pasture landand crops
Pasture landand crops
Sugarcane Sugarcane
Decreased (-)Increased (+)
Total used area(sugarcane + pasture + crops)

Sugarcane ethanol 73
Prospects of the sugarcane expansion in Brazil
!rough the environmental studies used to get this license, and through the governmental agencies’ database, one can obtain the exact location of mills and the economically feasible surrounding area where sugarcane is or will be cultivated. Knowing current land use in these areas by the time of the study, one can know land use prior to sugarcane plantations, as well as the type of original natural landscape when this is present.
Brazilian environmental licensing system is composed of three di"erent phases, each of them resulting in a di"erent license. !e environmental study required by the appropriate governmental agency has to be submitted and approved to obtain the Previous License (LP, in Portuguese). !e LP certi#es the environmental viability of the project at that speci#c location, and it means the entrepreneur can ask for the Installation License (LI). Just with the LI it is legal to start the construction of the mill plant, but to initiate operation and production, the Operation License (LO) is required. !e LP analysis generally takes long, because the agency must analyze deep studies, such as EIA-RIMAs, while to issue the other two licenses the approval periods are usually smaller.
By knowing which phase of the environmental licensing a mill project is ongoing or when the LO was issued, one can know when the mill will start or has started production. Furthermore, the environmental study speci#es the business plan, which includes expected date to start-up. Field research was conduced between May and June, 2008.
3.4. Projecting sugarcane expansion and changes in land use
!e approach used for projecting land allocation for sugarcane is based on a partial equilibrium model that is under development by the Institute for International Trade Negotiations (ICONE). !e model is based on demand response to price changes and supply response to market returns (pro#tability) changes. National and regional prices are calculated according to a basic assumption of microeconomics: they are achieved when supply and demand prices for each coincide, generating a market equilibrium.
!e model comprises 11 categories of products (sugarcane, soybean, maize, cotton, rice, dry beans, milk, beef, chicken, eggs and pork) and 6 regions: South (states of Rio Grande do Sul, Santa Catarina and Paraná), Southeast (states of São Paulo, Minas Gerais, Rio de Janeiro and Espírito Santo), Central-West Cerrados (states of Goiás, Mato Grosso do Sul and Mato Grosso under the Cerrados ecosystem), North-northeast Cerrados (states of Tocantins, Bahia, Piauí and Maranhão under the Cerrado ecosystem), Amazon Biome (states of Acre, Amazonas, Rondônia, Roraima, Amapá, Pará and Mato Grosso under the Amazon ecosystem) and Northeast Coast (states of Ceará, Rio Grande do Norte, Paraíba, Pernambuco, Alagoas and Sergipe). Estimated projections are performed on a yearly basis over a period of 10 years.

74 Sugarcane ethanol
Chapter 3
Given that the model is under development, a reduced version, comprising only the land allocation components, is used for projections presented here. Domestic demand and expected net trade are calculated exogenously, using world prices contained in the Fapri’s 2008 Outlook (Fapri, 2008). Production is calculated in order to meet demand and net trade needs.
Total national area allocated for grains and sugarcane is calculated according to yields trends. In the case of pasture, total national area is the sum of regional areas. For each region, land allocation equations were speci!ed according to the competition among crops and cattle. "e allocation of land on the six regions and between product’s categories is calculated on the model’s land use component. "e amount of land to be allocated for each activity is de!ned according to the required production to meet the domestic demand and net trade projections and yields trends. Allocated land is calculated by region, and crops and pasture compete according to the expected market returns per hectare. For each region and activity, speci!c competition equations were de!ned and elasticities were calculated. Land use change is measured comparing, in each region, the amount of land allocated for each activity. Absolute annual variation indicates activities that are incorporating land and the ones that are being displaced.
"e competition matrix used for the speci!cation of the land allocation regional models is described in Table 2. "e competition matrix was de!ned according to trends in harvested area observed from 1997 to 2008 and comparing market returns per hectare. Activities with higher market returns tend to have a lower number of competitors. Historical market returns also indicate activities that are land taker and land releaser. Cattle, for example, is a typical land releaser activity and, therefore, all crops compete with pasture.
It is important to mention that the regional area allocated to pastures is calculated independently of the herd projections. Projections on regional herd and pasture must be compared to evaluate whether they are compatible with stocking rate (number of animals per hectare) trends. Although this is a limitation, because the stocking rate is not endogenous on the model, the results presented in this study are in line with the past trends in stocking rate.
Regional data, however, is too aggregate for the objective of evaluating direct land use e#ect of sugarcane expansion. Regional projections are breakdown by micro-regional level, in order to obtain the same level of disaggregation used in the section 3.3. Products categories are aggregated in sugarcane, pastures and grains6. Projected land use for each category is disaggregated according to the evolution of market share of each micro-region in the region.
6 Grains, for the objective of the projections, comprise the following activities: soybean, maize, cotton, rice and dry beans.

Sugarcane ethanol 75
Prospects of the sugarcane expansion in Brazil
!e calculation of the substitution of crops and pastures by sugarcane is executed following a similar methodology of the Shi" share model presented in the section 3.2. Given that the projected period used was 2008 to 2018, sugarcane expansion is calculated as the absolute variation from 2018 to 2008 and crops and pastures expansion is calculated using a one year lag.
As well as the secondary data analysis for past expansion, the model is using harvested area rather than planted area. !erefore, the total area occupied with sugarcane is necessarily higher than the amount presented in the projections.
4. Results and discussions
!e results are discussed following the same structure of the methodology section: (a) Sub-section 4.1 presents the past expansion measured through remote sensing techniques; (b) Sub-section 4.2 brings the results based on secondary data; (c) Sub-section 4.3 is devoted
Table 2. Regional land competition matrix.
Product (dependant variable)
Cott
on
Suga
rcan
e
Soyb
ean
Mai
ze
Rice
Dry
bean
s
Catt
le/p
astu
re
Regi
on a
nd c
ompe
ting
prod
uct
Southsoybeanmaize
sugarcanemaize
sugarcanesoybean
soybeanmaizerice
all crops
Southeastsoybeanmaize
sugarcanemaize
sugarcanesoybean all crops
Center-west
Cerrados
soybeanmaize
soybeanmaize
cottonsugarcane
maize
cottonsugarcanesoybean
soybean all crops
Amazon biome
soybeanmaize
cottonmaize
cottonsoybean soybean all crops
Northeast coastal
maize maize all crops
North-northeast Cerrados
soybeanmaizerice
dry beans
cottonmaize
cottonsoybean soybean
soybeanmaizerice
all crops

76 Sugarcane ethanol
Chapter 3
to the case studies; (d) Sub-section 4.4 presents the projections on land use for sugarcane; and (e) Sub-section 4.5 discusses options for analyzing ILUC.
A summary of the results obtained from the three di!erent methodologies used in this study is presented in Table 3. Detailed results are discussed in the sub-sections.
4.1. LUC evaluation through remote sensing images
"is sub-section analysis the expanded sugarcane area harvested for the #rst time and is divided in three parts: (1) analysis comprising the years of 2007 and 2008 for the states of Minas Gerais, Goiás, Paraná Mato Grosso do Sul and Mato Grosso; (2) analysis comprising the period from 2005 to 2008 for the State of São Paulo; and (3) analysis comparing the years of 2007 and 2008 for the reduced South-Central region3 (or South-Central region minus the states of Rio de Janeiro, Espírito Santo, Santa Catarina and Rio Grande do Sul).
4.1.1. Analysis for the years of 2007 and 2008 in the states of Minas Gerais, Goiás, Paraná, Mato Grosso do Sul and Mato Grosso
Figure 5 shows the results for the Pasture, Agriculture, Reforestation and Forest classes which were displaced for the expansion of sugarcane crop harvested for the #rst time in 2007 and 2008. Most of the expansion of sugarcane area took place over the Agriculture and Pasture classes. "e Agriculture class registered the largest displaced area to sugarcane except for
Table 3. Land use classes converted to sugarcane: comparative results in the South-Central region (1000 ha).
Period/measurement method
2002-2006 (harvested area)1
2007-2008 (planted area)2
2008-2018 (harvested area)3
Sugarcane expansion 1,030 2,184 3,848Agriculture 122 (12%) 1,152 (53%) 1,455 (38%)Pasture 793 (77%) 991 (45%) 2,369 (62%)Other 114 (11%) 42 (2%) 24 (1%)
1 Source: secondary data from IBGE.2 Source: satellite images.3 Source: projection model.

Sugarcane ethanol 77
Prospects of the sugarcane expansion in Brazil
Figure 5. Area in hectares and percentages of the land use classes converted to sugarcane in 2007 and 2008 in the states of Minas Gerais, Goiás, Paraná, Mato Grosso do Sul and Mato Grosso.
forestagriculturepasture 20082007
Total expansion: 2007 120,3062008 141,190
Minas Gerais
Total expansion: 2007 85,5592008 143,155
Goiás
Total expansion: 2007 107,3502008 97,719
Paraná
Total expansion: 2007 46,4462008 87,434
Mato Grosso du Sul
Total expansion: 2007 25,5242008 30,735
Mato Grosso
7391%
1,1192%
1,8928%
8,44033%
18,39540%
35,03933%
25,70330%
25,65621%
48,28434%
34,51424%
42,33643%
48,46555%
38,90845%
17,76158%
55,15957%
108,07276%
91,95965%
71,88367%
59,44270%
93,88378%
26,82358%
15,13459%
10,55534%
2,3858%
8761%

78 Sugarcane ethanol
Chapter 3
Mato Grosso do Sul in 2008 when the Pasture and Agriculture classes took place over 55.4 and 44.5% of the sugarcane expansion, respectively.
For the analyzed states in this section it was veri!ed that the Agriculture class decreased its contribution of displaced area for sugarcane expansion from 69.3% in 2007 to 62.2% in 2008. Conversely the Pasture class increased its contribution from 29.4% in 2007 to 37% in 2008 suggesting a trend of increasing sugarcane expansion over the Pasture class.
In Minas Gerais, Goiás and Paraná more than 99% of the sugarcane expansion was observed over the classes of Agriculture and Pasture. In Mato Grosso do Sul, 2.41% (1,119 ha) of the area of sugarcane expansion took place over the Forest class in 2007; while in 2008 it was insigni!cant (61 ha). In the state of Mato Grosso the sugarcane expansion over the Forest class was 7.4% (1,892 ha) in 2007 and 7.8% (2,385 ha) in 2008.
4.1.2. Analysis for the period from 2005 to 2008 in the state of São Paulo
Figure 6 shows the results for Pasture, Agriculture, Reforestation, Forest and Citrus classes which were displaced for the expansion of the sugarcane crop harvested for the !rst time from 2005 to 2008 in São Paulo State. During the analyzed period a sugarcane expansion of 1,810 million ha was observed. Pasture (53%; 960,000 ha) and Agriculture (44.6%; 808,000 ha) were responsible for 97.7% (1,768 million ha) of the change. About 2% (36,900 ha) of sugarcane expansion took place over the Citrus class and 0.31% (5,500 ha) over the Reforestation and Forest classes together. Based on the data shown in Figure 6 it is not possible to conclude that the Pasture class tends to increase its contribution in displaced area for sugarcane expansion in relation to the Agriculture class. Nevertheless in 2008 the Pasture class contribution is the largest (56.1%) and the Agriculture class is the smallest (40.6%) in the four analyzed years.
4.1.3. Analysis for the years of 2007 and 2008 in the South-Central region
Figure 7 shows the results that refer to the classes of land use that were displaced for sugarcane expansion in the most relevant producing states of the South-Central region in 2007 and 2008. In both years, Pasture and Agriculture classes were together responsible for 98.1% of the total area displaced for sugarcane expansion (2,184 thousand ha). "e Pasture class was responsible for 45.4% (0.991 million ha) and the Agriculture class was responsible for 52.7% (1,152 thousand ha) of the displaced area for sugarcane (Table 3). About 1.3% of sugarcane expansion took place over the Citrus class (28,916 ha) and 0.58% (12,623 ha) over the Reforestation and Forest classes together (others in Figure 7). Figure 7 shows that the Agriculture class was more displaced than the Pasture class for sugarcane expansion; however,

Sugarcane ethanol 79
Prospects of the sugarcane expansion in Brazil
Figure 6. Area in hectares and percentages of the classes of land use that were displaced for sugarcane expansion in São Paulo State from 2005 to 2008.
citrusagriculturepasture
Total expansion: 2005 205,958 2006 305,603
2007 636,8142008 661,969
20082007
20062005
1,4291%
96,94047%
137,45645%
107,35252%
160,54053%
321,11951%
304,62548%
371,26256%
268,63341%
6,5232%
19,9193%
8,9971%
Figure 7. Area in hectares and percentages of the classes of land use displaced for the expansion of sugarcane in the most relevant sugarcane producing states in the South-Central region in 2007 and 2008.
8,9971%
6,8631%
19,9192%
5,7600%
otherscitrusagriculturepasture
20082007
434,33042%
571,81056%
579,82150%
556,70348%
Total expansion: 2007 1,022,000 2008 1,162,203

80 Sugarcane ethanol
Chapter 3
the Pasture class increased from 42.5 to 47.9% its relative contribution, while the Agriculture class decreased its relative contribution from 55.9 to 49.9% from 2007 to 2008.7
Finally we can conclude that the remote sensing images obtained systematically by the Landsat and CBERS satellites enabled an accurate identi!cation of land use classes de!ned in this work, which were displaced for the recent and most relevant sugarcane expansion observed in Brazil. "e visual interpretation of the remote sensing images on a computer screen is hard-working, but it allows an accurate classi!cation of the areas of interest producing a reliable thematic classi!cation through an objective and measurable procedure.
4.2. Micro-regional secondary data
"e dynamics of agricultural area and sugarcane in particular is presented in Table 4. Sugarcane expansion from 2002 to 2006 in the ten states analyzed reached 1,077 thousand ha, and more than half of this number occurred in São Paulo State. From this total expansion, 773 thousand ha displaced pasture land and 103 thousand ha displaced other crops, while only 125 thousand ha were not able to be allocated over previous productive areas. Total agricultural area growth – the sum of all crops, including sugarcane, and pastures – in the period was 3,376 thousand ha.
By looking at Table 4 it is possible to state that sugarcane expansion is relatively small comparing to total agricultural expansion in many states, particularly in Mato Grosso and Tocantins (about 1% of total agricultural expansion) and Paraná and Mato Grosso do Sul (about 16% of total agricultural expansion). Expansion of agriculture as a whole means new areas are converted to productive uses, which were former natural landscapes (forests, Cerrado savannah, natural pastureland, and so on) or idle areas. In those states where total agricultural area decreased over the analyzed period (Minas Gerais, Goiás, Maranhão and Piauí), there is no clear evidence that sugarcane expansion had taken place over non anthropized areas.
It is also important to state the signi!cant proportion of sugarcane expansion over pasture, which represents 72% of total sugarcane expansion. By state level, also 72% of sugarcane increased over pasture in São Paulo, while in Minas Gerais, Paraná and Goiás these numbers were 51, 63, and 90%, respectively. "is result is quite di#erent from the one presented in Section 4.1 and a possible reason to explain this distortion is presented in Section 4.3.
7 A recent study published by CONAB (2008), stated that the sugarcane expansion in the 2007 harvest in Brazil, totaling 653,722 ha, has occurred mainly over pastureland, 64.7%, followed by maize and soybean, 21.8%. New areas were responsible for 2.4% of area used for sugarcane expansion. "ese data were collected through 343 interviews with sugarcane mill managers.

Sugarcane ethanol 81
Prospects of the sugarcane expansion in Brazil
It is important to note that the shi!-share methodology is not su"ciently robust to explain the re-allocation of land in regions that are subjected to expansions in all categories of products. In those regions, new land has been incorporated into agricultural production, which might be attributed to the conversion of forest to agriculture or to the use of previous idle areas. However, the model is not able to identify this conversion since data on deforestation are not necessarily available for the same period of time and for the same geographical unit. Even if we could assume that 100 percent of the expanded area results in natural vegetation conversion, it would not be possible to isolate the contribution of the sugarcane for this process. One possible alternative to explain the not allocated area presented above would be to assume a partial indirect e#ect at a micro-regional level. $e indirect e#ect is partial because the amount of not allocated area of sugarcane would be allocated in the amount of new area proportionally of the share of sugarcane expansion to the total agriculture expansion. $e assumption that sugarcane is expanding in not anthropized area, however, is not corroborated by satellite images as discussed in the previous section.
4.3. Environmental licensing reports
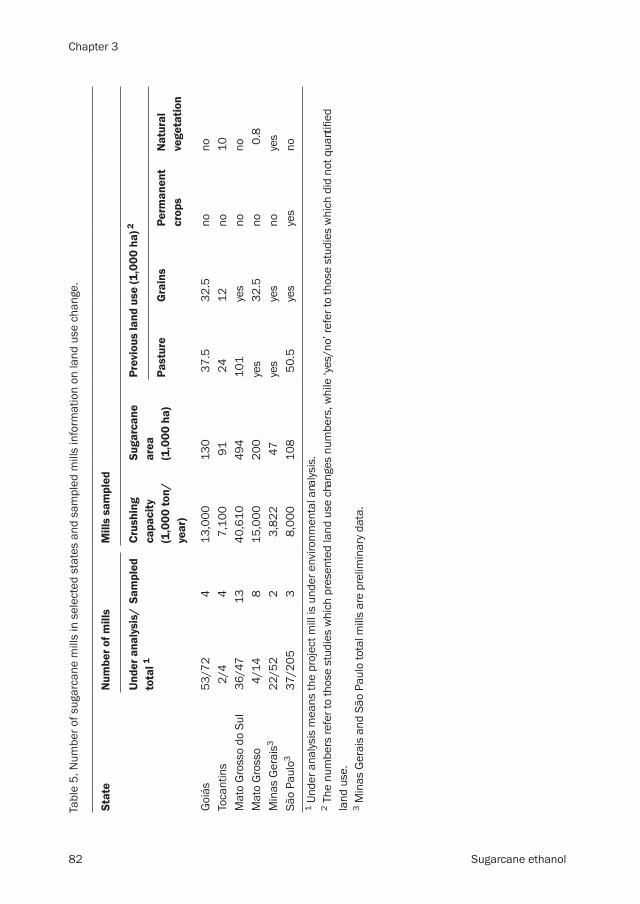
As a %rst result of this %eld research, it was possible to count and locate new mills projects in six di#erent states (Table 5). Goiás is the state that has more projects under analysis, which
Table 4. Area of crops and pasture displaced for sugarcane expansion by State, from 2002 to 2006 (1,000 hectares).
State Total agricultural expansion
Sugarcane expansion
Total growth Over pasture Over other crops
N.A.1
São Paulo 146 639 460 115 65Minas Gerais -1,251 160 157 2 1Paraná 535 92 58 2 32Goiás -775 63 56 0.1 6Mato Grosso do Sul 281 45 44 0.6 0.1Mato Grosso 4,945 31 18 3 10Bahia 124 27 19 5 3Maranhão -655 16 12 0 5Piauí -122 3 0.2 0 2Tocantins 148 1 0.5 0 0.6Total 3,376 1,077 773 103 125
1 N.A. means not allocated over previous productive area.
82 Sugarcane ethanol
Chapter 3
Tabl
e 5.
Num
ber o
f sug
arca
ne m
ills
in s
elec
ted
stat
es a
nd s
ampl
ed m
ills
info
rmat
ion
on la
nd u
se c
hang
e.
Stat
eNu
mbe
r of m
ills
Mill
s sa
mpl
ed
Unde
r ana
lysi
s/to
tal 1
Sam
pled
Crus
hing
ca
paci
ty(1
,000
ton/
year
)
Suga
rcan
e ar
ea(1
,000
ha)
Prev
ious
land
use
(1,0
00 h
a) 2
Past
ure
Grai
nsPe
rman
ent
crop
sNa
tura
l ve
geta
tion
Goiá
s53
/72
413
,000
130
37.5
32.5
nono
Toca
ntin
s2/
44
7,10
091
2412
no10
Mat
o Gr
osso
do
Sul
36/4
713
40,6
1049
410
1ye
sno
noM
ato
Gros
so
4/14
815
,000
200
yes
32.5
no0.
8M
inas
Ger
ais3
22/5
22
3,82
247
yes
yes
noye
sSã
o Pa
ulo3
37/2
053
8,00
010
850
.5ye
sye
sno
1 Un
der a
nalys
is m
eans
the
proj
ect m
ill is
und
er e
nviro
nmen
tal a
nalys
is.
2 Th
e nu
mbe
rs re
fer t
o th
ose
stud
ies
whic
h pr
esen
ted
land
use
cha
nges
num
bers
, whi
le ‘y
es/n
o’ re
fer t
o th
ose
stud
ies
whic
h di
d no
t qua
ntifi
ed
land
use
.3
Min
as G
erai
s an
d Sã
o Pa
ulo
tota
l mills
are
pre
limin
ary d
ata.

Sugarcane ethanol 83
Prospects of the sugarcane expansion in Brazil
means sugarcane is expanding signi!cantly there. "e projects under analysis correspond to more than 70% of total projects, while in São Paulo, traditional producer state, it represents about 18%.
Mato Grosso do Sul is another state where new mills are majority, and where sugarcane expansion is very recent. Although the state production represents less than 3% of sugarcane production in 2007, this share is expected to increase considerably over next years. "irty six new projects are under environmental analysis, while just eleven are already in operation, and from the thirteen new projects’ Environmental Studies analyzed no forest is expected to be suppressed. All new projects needs to present EIA-RIMA and public hearings take place in the local town, where the environmental agency team helps to divulgate and motivate community to participate.
Minas Gerais is currently the third biggest sugarcane producer right a#er Paraná State and has a signi!cant number of new mills that are being projected. "e regions concentrating the majority of new projects are mainly in the south and south-eastern – the later including a traditional cattle raising region denominated Triângulo Mineiro. In spite of the fact that sugar mills need environmental licenses, the state law doesn’t require EIA-RIMA, which means that simpler studies are made in order to get the license. "ese studies don’t include land use changes impacts and public hearings are not necessary.
In Mato Grosso State, expansion dynamics is di$erent. During the 80’s, some sugarcane mills were implemented in order to produce ethanol, as part of PROALCOOL Plan. A#er decline in governmental supports and the crisis in the sector, some mills have been closed down while others have started to produce sugar as well, and thus have kept business pro!table. Recently, two mills that used to be no longer in operation are requesting licenses to come back to business. Nevertheless, sugarcane production is relatively small in this state, and only two new mill projects are under analysis.
"e State of Tocantins is not under important sugarcane expansion now, but it is expected to be in near future if demand for land for this crop keeps increasing. "e state Environmental Agency estimates that a#er the implementation of North-South railway the regional transportation problem will be solved and about 50 sugar mills will be constructed. "us, the state government wants to get ready for this huge demand over environmental licensing and planning for this land use change.
São Paulo is the most important Brazilian state for sugarcane production and the most industrialized, urbanized and occupied state. Many of existing mills are requesting licenses to expand crushing capacity and some new mills projects are also under licenses analysis. Some studies analyze the impact of this recent sugarcane expansion over other crops in this state, resulting especially in reduction of pastures, citrus and maize areas (Coelho et al., 2007). Camargo et al. (2008) state that land rental for sugarcane has increased by an average

84 Sugarcane ethanol
Chapter 3
of 12.6% from 2001 to 2006 in São Paulo, contributing to diminish expansion in São Paulo, which in turn can boost sugarcane expansion in other states.
Two signi!cant facts regarded to land use change caused by sugarcane were veri!ed during this !eld research. First, many of the projects which were considering to use pasture to cultivate sugarcane mentioned the necessity of one or two years cultivating other crops, such as soybean prior to the planting of sugarcane, in order to improve the soil quality of the low productive pasture land (regarding structure and/or fertility). "is fact may partially explain the relative big proportion of sugarcane expansion over the Agriculture class detected in the remote sensing image analyses (Section 4.1). Since data presented in this paper are not able to verify this fact, deeper analysis are necessary to evaluate whether these crops were cultivated just to prepare the soil under pasture for sugarcane, meaning that the Agriculture class could possibly be overestimated (and therefore the Pasture class underestimated).
"e other signi!cant fact is the common use of crop rotation during sugarcane renovation process. A#er a number of harvests – generally !ve to six – sugarcane yield decreases and, therefore, the sugarcane !eld should be renovated. "is is usually performed with an ‘18 months’ sugarcane plant. In this case an annual food crop such as soybeans can be cultivated during the summer season. Potentially, this means that about 15 to 20% of the cultivated sugarcane area can be cultivated with an annual crop in order to improve soil quality, prevent soil erosion and contribute to food production. Although this practice is not used in all sugarcane !elds, it has been disseminating fast and it is likely to be used in the majority of areas all over Brazil.
4.4. Expected sugarcane expansion and implied land use changes
Projections developed for this study are indicating that harvested sugarcane area in Brazil will reach 11.7 million ha in 2018, departing from 7.8 million ha in 2008. Area allocated for crops (soybean, maize, cotton, rice and dry beans) is expected to grow from 37.8 million ha to 43.8 million ha. Pasture area will move to the opposite direction, being reduced from 165 to 162 million ha.
Projections on regional level are presented in the Figure 8. "e !gure shows that the South-Central region, comprising the regions South, Southeast and Center-west Cerrados, will continue to be the most relevant and dynamic. North-northeast region is also very important but, as described in the methodology section, it is not a dynamic region in terms of growth.
Table 6 summarizes the expected growth in the South-Central region. Results show that the expansion of grains and sugarcane are fully compensated by the reduction on pasture area. Projections also con!rm that cattle production is improving in terms of productivity given that the herd is increasing despite of the reduction on pasture area.

Sugarcane ethanol 85
Prospects of the sugarcane expansion in Brazil
Figu
re 8
. Pro
ject
ed e
volu
tion
of s
ugar
cane
, gra
ins
and
past
ure
area
in a
gric
ultu
ral r
egio
ns (1
,000
ha)
.
0
5,00
0!
10,0
00!
15,0
00!
20,0
00!
25,0
00!
30,0
00!
35,0
00!
08(e)
10(p)
12(p)
14(p)
16(p)
18(p)
Sout
h re
gion
05,
000!
10,0
00!
15,0
00!
20,0
00!
25,0
00!
30,0
00!
35,0
00!
40,0
00!
45,0
00!
08(e)
10(p)
12(p)
14(p)
16(p)
18(p)So
uthe
ast r
egio
n
0
10,0
00!
20,0
00!
30,0
00!
40,0
00!
50,0
00!
60,0
00!
08(e)
10(p)
12(p)
14(p)
16(p)
18(p)
Cent
ral-w
est C
erra
dos
!
05,
000!
10,0
00!
15,0
00!
20,0
00!
25,0
00!
30,0
00!
35,0
00!
40,0
00!
45,0
00!
08(e)
10(p)
12(p)
14(p)
16(p)
18(p)
Amaz
on b
iom
e
Past
ure
Grai
nsSu
garc
ane
02,
000!
4,00
0!6,
000!
8,00
0!10
,000
!12
,000
!14
,000
!16
,000
!18
,000
!
08(e)
10(p)
12(p)
14(p)
16(p)
18(p)
North
east
coa
stal
05,
000!
10,0
00!
15,0
00!
20,0
00!
25,0
00!
30,0
00!
35,0
00!
40,0
00!
08(e)
10(p)
12(p)
14(p)
16(p)
18(p)
North
-nor
thea
st C
erra
dos

86 Sugarcane ethanol
Chapter 3
Detailed analysis on sugarcane, crops and pasture expansion was developed for the South-Central region, in order to standardize the producing regions with the past land use change presented in the previous sections. Figure 9 shows the results obtained for São Paulo, Minas Gerais, Paraná, Goiás, Mato Grosso do Sul and Mato Grosso. Sugarcane expansion will follow trends in terms of land use change similar to the ones observed in the past.
!e absolute variation shows that expansion will be larger in São Paulo, with 1.9 million ha expansion. However, the relative variation shows that Minas Gerais (98 percent growth in comparison to 2008), Paraná (98 percent expansion), Goiás (118 percent expansion) and Mato Grosso do Sul (105 percent) are the states where sugarcane will present the most dynamic expansion.
Apart from Minas Gerais, pasture is losing area in all states, while crops area is decreasing only in São Paulo. Due to this strong reduction in pasture and simultaneous growth in sugarcane and crops, the results indicate that both categories are displacing pasture. Micro-regional data in states such as Paraná and Goiás allow us to conclude that crops area displaced by sugarcane is partially compensated over pastures areas. !e reduction on pastures area, as already shown in Table 6, is expected to be compensated by yields improvement. Even in states where cattle herd tend to fall, such as São Paulo and Paraná, pasture area reduction does not compromise beef and dairy production. In the Centre-West states, Goiás, Mato Grosso do Sul and Mato Grosso, pastures areas are declining and projected cattle herd is increasing, showing strong productivity gains.
It is also important to say that pasture area is expected to increase only in the Amazon Biome region. However, this expansion is taken place independently of the other regions, because cattle herd is increasing in the South-Central region, which is the sugarcane expansion region. Projections also con"rm results observed by satellite images: as soon as the sugarcane increases its expansion, more pasture is displaced in comparison to grains. Pasture land displacement is majority in Minas Gerais and Centre-West states. In Paraná sugarcane expansion will push grains production to pastures area. We probably will see the same
Table 6. South-Centre: expected land allocation for sugarcane, grains and pastures (1,000 ha and heads).
2008 2018 Net growth
Sugarcane (ha) 6,359 9,654 3,295Grains (ha) 26,332 29,529 3,198Pasture (ha) 92,328 86,215 -6,113Total (ha) 125,018 125,398 380Cattle herd (hd) 119,399 125,501 6,102

Sugarcane ethanol 87
Prospects of the sugarcane expansion in Brazil
process in São Paulo, although not only pasture but also grains are strongly releasing land for sugarcane.
Grains are releasing 1.6 million ha for sugarcane but, as can be observed in the Table 6, total area is expanding by 3.9 million ha, more than compensating the losses for sugarcane. Pasture area will be reduced by 6.1 million ha and sugarcane is contributing with 2.4 million ha of this total.
Figure 9. Projection of crops and pasture displacement due to sugarcane expansion, from 2008 to 2018 in selected Brazilian states (in ha).Note: N.A. means not allocated over previous productive area.
Mato GrossoMato Grosso do Sul
GoiásParaná
Minas GeraisSão Paulo
499,96987%
248,17799%
2,8421%
261,01470%
113,22330%
57,42110%
14,6113%
9,0512%
233,51640%331,232
58%
1,027,67553%
910,31247%
40,26929%
98,49871%
Total expansion:São Paulo 1,938,211Minas Gerais 572,000Paraná 573,799Goiás 374,237Mato Grosso do Sul 251,018Mato Grosso 138,767
N.A.cropspasture

88 Sugarcane ethanol
Chapter 3
4.5. Options for approaching indirect e!ect
Indirect Land Use Change analysis is still under development, both in terms of proper de!nitions and methods to measure it. Regarding to its de!nitions, Gnansounou et al. (2008) classify four di"erent sources of ILUC: spatial ILUC (displacement of prior production to other location); temporal ILUC (shi#ing land-use in the same location); use ILUC (shi#ing biomass use in the same location); and displaced activity/use ILUC (avoiding national land-use change by shi#ing previous activity to other country).
According to the authors, ILUC is market driven, global e"ect, spatial dependent and time dependent. $e !rst two items must be analyzed in a global scale, while the last two need down-scaling analysis. Considering local analysis, although there is no consensual method in specialized literature, it is possible to use available land use data to clarify some points.
Notwithstanding that the sources of ILUC can be formally de!ned from a theoretical perspective, the di%culties associated to isolate and to separate the contribution of each source to the indirect e"ect make empirical analysis much less promising than what it appears to be. $us, even though it is reasonable to state that the displacement of one activity as a result of the expansion of other activity may lead to an indirect land use change, as argued by Searchinger et al. (2008), such as deforestation, this incorporation of additional land may be happening despite of the expansion of biofuel’s feedstocks production. Additionally, when the expansion of biofuel’s feedstocks is taking place in conjunction with the expansion of agricultural products for food production, it is hard to prove e"ect-cause relations between biofuel’s expansion and deforestation. $is is exactly one of the fragilities of Searchinger’s paper.
It is beyond of the objectives of this paper to address ILUC in a worldwide perspective. However, due to the fact that sugarcane is expanding in Brazil, it is necessary to search for arguments and data supporting the idea that sugarcane expansion is leading to an increase in the land productivity, rather than promoting incorporation of new land for food production, as grains and pasture land are displaced. Both projections and observed data give indication that this process is taking place in Brazil. As presented in Tables 6 and 7, the strong increase in pasture productivity, measured by the stocking ratio, make the Brazilian case a strong example of how hard it is to empirically prove the ILUC e"ect associated to the expansion of sugarcane.
As discussed in previous sections, sugarcane expansion is taking place in anthropized areas. Although this paper has no evidences regarding deforestation in Brazil, it is well known that deforestation is observed in the agricultural frontier. Brazil has two most important frontiers: the Amazon Biome region, where the Amazon Forest is located, and the North-northeast Cerrados region (also called as MAPITO region), where the larger stock of savannah land is located. Both past data and projections have shown that sugarcane is not

Sugarcane ethanol 89
Prospects of the sugarcane expansion in Brazil
signi!cantly expanding in these regions. Moreover, the expansion of pastures and grains area in the Amazon Biome region, which one would argue that it is happening due to the indirect e"ect, are lower than the area displaced by sugarcane in the South-Central region. As presented in the Table 6, we project that pasture will lose 6 million ha for sugarcane and grains in the South-Central region for the period of 2008 to 2018. Projections for the Amazon Biome region indicate that pasture area will increase by 4 million ha for the same period (Figure 8). #ose numbers show that one unity of pasture land lost does not have to be fully compensated in the frontier because productivity of the cattle production is increasing. Results of this study, therefore, support the idea that both pasture land improvement and increasing stocking rate can more than compensate land released for sugarcane and even for other crops. Regional herd data presented in Table 7 reinforces even more this evidence.
In the states where sugarcane area increased from 2002 to 2006, other crops area have also increased (exception for São Paulo), which means there is no clear reason to state that sugarcane has displaced crops which in turn could occupy natural vegetation (Table 7). A similar rational can be made for pasture land, but now including yield improvement. #e
Table 7. Net growth of sugarcane, other crops, pasture land, total used area, and cattle herd from 2002 to 2006 in selected Brazilian states (1,000 ha and heads).
State Net growth 2002-06
Sugarcane (ha)
Other crops (ha)
Pasture land (ha)
Total used area (ha)
Cattle herd (heads)
São Paulo 622 -224 -882 -484 -909Minas Gerais 153 390 -625 -82 1,644Paraná 74 850 -636 287 -284Mato Grosso do Sul 41 734 -985 -210 558Goiás 34 576 -2,041 -1,431 545Bahia 27 492 143 661 912Mato Grosso 25 1,634 -1,437 222 3,881Maranhão 16 298 -463 -148 1,835Pará 3 115 2,502 2,620 5,311Piauí 3 206 -112 97 34Rondônia 1 124 -364 -239 3,444Tocantins 0.9 238 -595 -355 778Acre 0.7 13 109 123 635Total 1,000 5,446 -5,385 1,061 18,383
Source: PAM/IBGE, Agricultural Census/IBGE and PPM/IBGE.

90 Sugarcane ethanol
Chapter 3
states that have lost pasture land have also increased cattle herd (exception for São Paulo and Paraná), meaning there was an improvement in the cattle sector. !erefore, it is important to state that biofuels produced from biomass grown on unused arable land or resulting from yield improvements (as much of the pasture land displaced for sugarcane) have no indirect e"ects according to the Roundtable on Sustainable Biofuels (2008).
!us, yields improvements in crops can be considered as area’s release, meaning that the same amount of cereals, for example, is produced on a smaller area, leaving area available for other uses. Ceteris paribus, i.e. not considering other variables such as increase in demands, yield improvements alleviate area for other purposes. Sugarcane cultivated over these areas does not compete with land and has no indirect e"ects. For a total of about 1,390 thousand ha of agricultural area displaced for sugarcane veri#ed by satellite images in the six states analyzed, 572 thousands ha were released by crops yields improvements (Table 8).
Grains, cereals and oilseeds area displaced, besides yields improvements, necessarily have to be compensated in a non-sugarcane area, although food production would be compromised. However, crops re-allocation could also take place in pastures areas, being partially compensated by cattle yield improvements. Moreover, if the expansion of food
Table 8: Agricultural area displaced by sugarcane and agricultural area compensated by yield improvement from 2005 to 2008 (São Paulo) and 2007 to 2008 for the other States.
State Agricultural area displaced by sugarcane1
(1,000 ha)
Average annual yield growth2
Agricultural area compensated by yield improvement3
(1,000 ha)
Minas Gerais 186 4.4% 118Goiás 168 1.9% 46Paraná 127 4.8% 231Mato Grosso do Sul 66 5.8% 30Mato Grosso 33 9.5% 44São Paulo 808 3.4% 103Total 1,387 572
1 Source: Figures 5 and 6.2 Averages are calculated from CONAB data for soybeans, maize, rice, dry beans and cotton, for the period of 1991 to 2008 (www.conab.gov.br).3 The baseline agricultural area (2005 for São Paulo and 2007 for the remaining states) for the selected crops were discounted by the area ‘saved’ due to those yield growth.

Sugarcane ethanol 91
Prospects of the sugarcane expansion in Brazil
crops is larger than the amount of land displaced by sugarcane, indirect e!ect cannot be quanti"ed. #is is also the situation taking place in Brazil.
For global scale considerations for ILUC, however, the analysis is much more complex. In this case, it is even more di$cult to determine the proper scale pertinent, considering that many countries produce and trade di!erent products that can be related to ILUC analysis. Regarding to shi%ing biomass use, Brazilian sugar production has also increased from 2002 to 2006, from 22.5 to 29.6 million tons, according to UNICA (2008). Meats and all grains production have also increased signi"cantly in the period and in the last years. #erefore, there was no need to convert land in other countries due to increase in ethanol production in Brazil. Nevertheless, all ILUC considerations can be considered preliminary and subject to improvements since the topic has been developing fast recently.
5. Conclusions and recommendations
#is work was an e!ort to analyze land use changes due to sugarcane expansion in Brazil, contributing to the global debate about social and especially environmental bene"ts of ethanol. A careful look of the distribution of sugarcane shows that the crop is located and is expanding in regions that are devoted to agricultural production since a long time. Projections indicated that sugarcane expansion will continue to take place on these areas. #is means that there is no sugarcane expansion in the agricultural frontier, which is the place where agricultural production has been converting natural landscapes. #us, results are indicating that sugarcane is not directly pressing natural vegetation in any region in Brazil.
#e use of di!erent methods gives consistency to the analysis, since each one has its weakness and strengths. Remote sensing images can be considered the most reliable source of information, however they focused only in areas where sugarcane expansion took place, neglecting dynamics of other crops and pasture land. Secondary data from IBGE cover all signi"cant productive land uses, nevertheless the data is subject to accuracy problems, especially those relating to areas dedicated to pasture. Case studies through environmental licensing reports can o!er profound analysis to understand the dynamics of the mill, although they are limited in scope of coverage. #e land use model projects future trends of land substitution among crops, based on past trends, but it relies on many economic assumptions.
Both remote sensing and secondary data analysis have generated similar results regarding direct land use changes promoted by sugarcane expansion. Although results are di!erent in terms of crops and pasture land displacement, they both corroborate that sugarcane expansion has taken place with no direct e!ect on natural vegetation land. Furthermore, pasture is increasing its participation on the area displaced by sugarcane, and this pattern is expected to continue or even become more relevant in the future.

92 Sugarcane ethanol
Chapter 3
It is important to contextualize the LUC caused by sugarcane within the entire Brazilian debate regarding land use and occupation and other factors correlated, including agricultural and environmental public policies, international commodity markets and technology development. ILUC issues, in turn, are even more complex and correlated to many other factors. Sugarcane is concentrated in the most densely occupied state, São Paulo, which has been presented signals of saturation many years ago. In a lack of clear land use and occupation policy, sugarcane, as well as many other agricultural activities, has been expanding around close states according to local conditions, both agronomic and economic. !is movement presses land valorization and thus contributes to improvements on agricultural yields (crops and pasture), as it is happening in almost all regions in Brazil.
!is study concludes that the expansion of crops, except sugarcane, and pasture land is taking place despite of the sugarcane expansion. !is is important because it reinforces that, even recognizing that sugarcane expansion contributes to the displacement of other crops and pasture, there is no evidence that deforestation caused by indirect land use e"ect is a consequence of sugarcane expansion. Results on past data and projections show that increasing cattle herd stocking rate is able to o"set pasture land reduction in regions where competition for land is taking place. Increasing productivity on cattle production, therefore, also reinforces that the expansion of pasture land on the Amazon Biome is not directly promoted by the expansion of crops and sugarcane in the non-frontier regions.
It is strongly recommended that the analysis here presented continues on a regular base in order to guarantee that sugarcane activity continues to respect natural landscapes. As any other agricultural product, sugarcane also contributes to land use changes. However, as discussed here, these changes do not undermine sugarcane’s environmental bene#ts as a renewable agricultural-based biofuel.
References
Camargo, A.M.M.P., D.V. Caser, F.P. Camargo, M.P.A. Olivette, R.C.C. Sachs and S.A. Torquato, 2008. Dinâmica e tendência da cana-de-acucar sobre as demais atividades agropecuárias, Estado de São Paulo, 2001-2006. Informações Econômicas 38: 47-66.
Coelho, S.T., P.M. Guardabassi, B.A. Lora, M.B.C.A. Monteiro and R. Gorren, 2007. A Sustentabilidade da expansão da cultura canavieira. Centro de Referencia em Biomassa – CENBIO – USP. Cadernos Técnicos da Associação Nacional de Transportes Públicos, v. 6.
Companhia Nacional de Abastecimento (CONAB), 2008. Per#l do Setor de Açúcar e Álcool no Brasil. Brasília: CONAB.
Food and Agricultural Policy Research Institute (FAPRI), 2008. FAPRI 2008: U.S. and World Agricultural Outlook. FAPRI Sta" Report 08-FSR 1. Available at: www.fapri.org (accessed in October 4th, 2008).
Gnansounou, E., L. Panichelli, A. Dauriat and J.D. Villegas, 2008. Accounting for indirect land-use changes in GHG balances of biofuels: review of current approaches. École Polytechnique Fédérale de Lausanne, Working Paper 437.101, March 2008.

Sugarcane ethanol 93
Prospects of the sugarcane expansion in Brazil
Instituto Brasileiro de Geogra!a e Estatística (IBGE), 2008b. Censo Agropecuário de 2008. Available at: www.sidra.ibge.gov.br (accessed in July 10th, 2008).
Instituto Brasileiro de Geogra!a e Estatística, (IBGE), 2008a. Levantamento Sistemático da Produção Agrícola. Available at: www.sidra.ibge.gov.br (accessed in July 10th, 2008).
Oliveira, A.A., M.F.M. Gomes, J. Dos Santos, L. Ru!no, A.G. Da Silva Júnior, and S.T. Gomes, 2008. Estrutura e dinâmica da cafeicultura em Minas Gerais. Revista de Economia Agrícola 34: 121-142.
Roundtable on Sustainable Biofuels, 2008. Background paper (teleconference June 3rd, 2008) of the Expert advisory group and working group on GHG. Available at: http://cgse.ep".ch/page65660.html (accessed in August 2nd, 2008).
Rudor#, B.F.T and L.M. Sugawara, 2007. Mapeamento da cana-de-açúcar na Região Centro-Sul via imagens de satélites. Informe Agropecuário. Geotecnologias, Belo Horizonte, 241: 79-86.
Searchinger, T., R. Heimlich, R.A. Houghton, F. Dong, A., Elobeid, J. Fabiosa, S., Tokgoz, D., Hayes and T. Yu, 2008. Land clearing and the biofuels carbon debt. Sciencexpress. Feb., 2008.
Sugawara, L.M.S., B.F.T. Rudor#, R.M.S.P., Vieira, A.G. Afonso, T.L.I.N. Aulicino, M.A. Moreira, V. Duarte and W.F. Silva, 2008. Imagens de satélites na estimativa de área plantada com cana na safra 2005/2006 – Região Centro-Sul. São José dos Campos: INPE (15254-RPQ/815). 74 p.
União da Indústria de Cana-de-Açucar (ÚNICA), 2008. Estatísticas de produção de açúcar no Brasil. Available at: www.unica.com.br (accessed in July 29th, 2008).