chapter 36 tropical cyclones - fer3.com: navlist …fer3.com/arc/imgx/bowditch1995/chapt36.pdf ·...
TRANSCRIPT

s beenin.
CHAPTER 36
TROPICAL CYCLONES
CAUSES AND DESCRIPTION OF TROPICAL CYCLONES
3600. Introduction
A tropical cyclone is a cyclone originating in the trop-ics or subtropics. Although it generally resembles theextratropical cyclone of higher latitudes, there are impor-tant differences, the principal one being the concentrationof a large amount of energy into a relatively small area.Tropical cyclones are infrequent in comparison with middleand high latitude storms, but they have a record of destruc-tion far exceeding that of any other type of storm. Becauseof their fury, and because they are predominantly oceanic,they merit special attention by mariners.
A tropical storm has a deceptively small size, andbeautiful weather may be experienced only a few hundred
miles from the center. The rapidity with which the weathercan deteriorate with approach of the storm, and the violenceof the fully developed tropical cyclone, are difficult toimagine if they have not been experienced.
On his second voyage to the New World, Columbus en-countered a tropical storm. Although his vessels suffered nodamage, this experience proved valuable during his fourthvoyage when his ships were threatened by a fully developedhurricane. Columbus read the signs of an approaching stormfrom the appearance of a southeasterly swell, the directionof the high cirrus clouds, and the hazy appearance of the at-mosphere. He directed his vessels to shelter. Thecommander of another group, who did not heed the signs,lost most of his ships and more than 500 men perished.
Figure 3602. Areas in which tropical cyclones occur. The average number of tropical cyclones per 5° square haanalyzed for this figure. The main season for intense tropical storm activity is also shown for each major bas
505
506 TROPICAL CYCLONES
cthemes
s
s
erednte-
arrow ta for the
3601. Definitions
“Tropical cyclone” is the term for cyclones originatingin the tropics or subtropics. These cyclones are classified byform and intensity as they increase in size.
A tropical disturbance is a discrete system of appar-ently organized convection, generally 100 to 300 miles indiameter, having a nonfrontal migratory character, and hav-ing maintained its identity for 24 hours or more. It may ormay not be associated with a detectable disturbance of thewind field. It has no strong winds and no closed isobars i.e.,isobars that completely enclose the low.
At its next stage of development it becomes a tropicaldepression. A tropical depression has one or more closed iso-bars and some rotary circulation at the surface. The highestsustained (1-minute mean) surface wind speed is 33 knots.
The next stage is tropical storm. A tropical storm hasclosed isobars and a distinct rotary circulation. The highest sus-tained (1-minute mean) surface wind speed is 34 to 63 knots.
When fully developed, a hurricane or typhoon hasclosed isobars, a strong and very pronounced rotary circu-lation, and a sustained (1-minute mean) surface wind speedof 64 knots or higher.
3602. Areas Of Occurrence
Tropical cyclones occur almost entirely in six distinareas, four in the Northern Hemisphere and two in tSouthern Hemisphere as shown in Figure 3602. The naby which the tropical cyclone is commonly known variesomewhat with the locality.
1. North Atlantic. A tropical cyclone with winds of 64knots or greater is called a hurricane.
2. Eastern North Pacific. The name hurricane is usedas in the North Atlantic.
3. Western North Pacific. A fully developed stormwith winds of 64 knots or greater is called a ty-phoon or, locally in the Philippines, a baguio.
4. North Indian Ocean. A tropical cyclone with windof 34 knots or greater is called a cyclonic storm.
5. South Indian Ocean. A tropical cyclone with windof 34 knots or greater is called a cyclone.
6. Southwest Pacific and Australian Area. The name cy-clone is used as in the South Indian Ocean. A sevtropical cyclone originating in the Timor Sea anmoving southwest and then southeast across the irior of northwestern Australia is called a willy-willy.
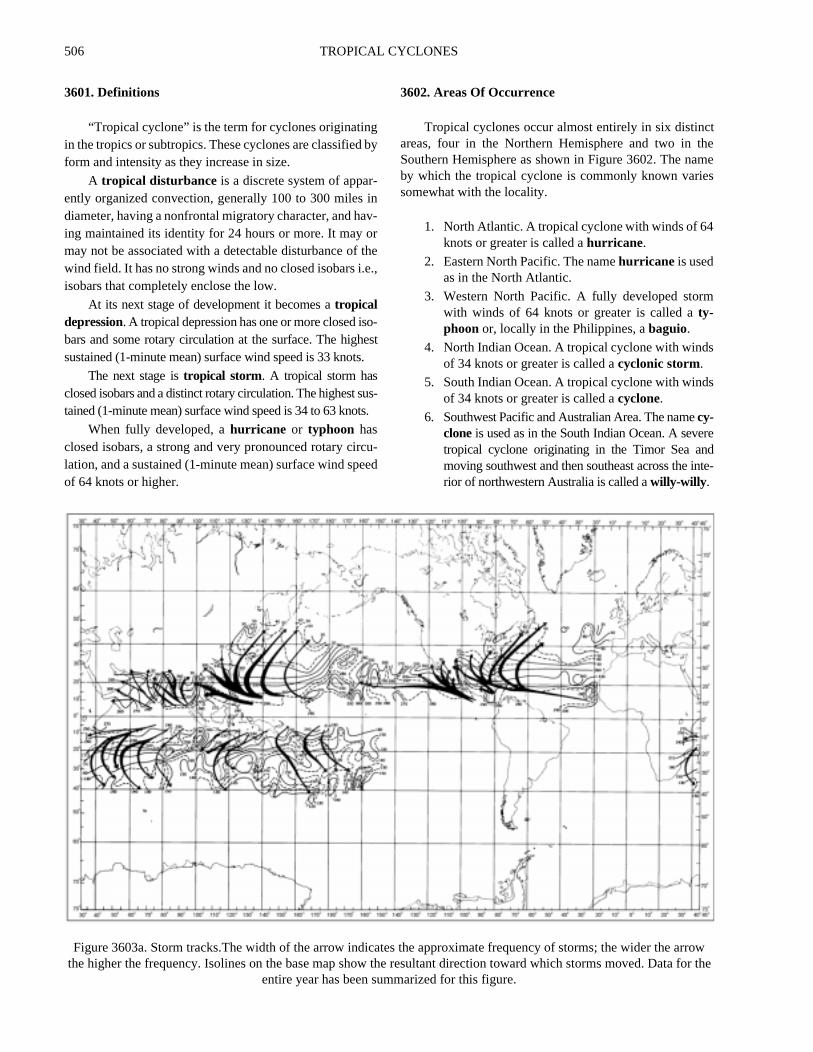
Figure 3603a. Storm tracks.The width of the arrow indicates the approximate frequency of storms; the wider thethe higher the frequency. Isolines on the base map show the resultant direction toward which storms moved. Da
entire year has been summarized for this figure.

TROPICAL CYCLONES 507
Tropical cyclones have not been observed in the SouthAtlantic or in the South Pacific east of 140°W.
3603. Origin, Season And Frequency
See Figures 3603a and 3603b. Origin, season, and fre-quency of occurrence of the tropical cyclones in the sixareas are as follows:
North Atlantic: Tropical cyclones can affect the entireNorth Atlantic Ocean in any month. However, they aremostly a threat south of about 35°N from June through No-vember; August, September, and October are the months ofhighest incidence. See Figure 3603b. About 9 or 10 tropicalcyclones (tropical storms and hurricanes) form each season;5 or 6 reach hurricane intensity (winds of 64 knots andhigher). A few hurricanes have generated winds estimatedas high as 200 knots. Early and late season storms usuallydevelop west of 50°W; during August and September, thisspawning ground extends to the Cape Verde Islands. Thesestorms usually move westward or west northwestward atspeeds of less than 15 knots in the lower latitudes. Aftermoving into the northern Caribbean or Greater Antilles re-gions, they usually either move toward the Gulf of Mexico
or recurve and accelerate in the North Atlantic. Some willrecurve after reaching the Gulf of Mexico, while others willcontinue westward to a landfall in Texas or Mexico.
Eastern North Pacific: The season is from Junethrough October, although a storm can form in any month.An average of 15 tropical cyclones form each year withabout 6 reaching hurricane strength. The most intensestorms are often the early- and late-season ones; these formclose to the coast and far south. Mid season storms formanywhere in a wide band from the Mexican-Central Amer-ican coast to the Hawaiian Islands. August and Septemberare the months of highest incidence. These storms differfrom their North Atlantic counterparts in that they are usu-ally smaller in size. However, they can be just as intense.
Western North Pacific: More tropical cyclones formin the tropical western North Pacific than anywhere else inthe world. More than 25 tropical storms develop each year,and about 18 become typhoons. These typhoons are thelargest and most intense tropical cyclones in the world.Each year an average of five generate maximum winds over130 knots; circulations covering more than 600 miles in di-ameter are not uncommon. Most of these storms form east
of the Philippines, and move across the Pacific toward thePhilippines, Japan, and China; a few storms form in theSouth China Sea. The season extends from April through
December. However, tropical cyclones are more commonin the off-season months in this area than anywhere else.The peak of the season is July through October, when near-
AREA AND STAGE JAN FEB MAR APR MAY JUN JUL AUG SEP OCT NOV DEC ANNUALNORTH ATLANTIC
TROPICAL STORMS * * * * 0.1 0.4 0.3 1.0 1.5 1.2 0.4 * 4.2HURRICANES * * * * * 0.3 0.4 1.5 2.7 1.3 0.3 * 5.2TROPICAL STORMS AND HURRICANES * * * * 0.2 0.7 0.8 2.5 4.3 2.5 0.7 0.1 9.4
JAN FEB MAR APR MAY JUN JUL AUG SEP OCT NOV DEC ANNUALEASTERN NORTH PACIFIC
TROPICAL STORMS * * * * * 1.5 2.8 2.3 2.3 1.2 0.3 * 9.3HURRICANES * * * * 0.3 0.6 0.9 2.0 1.8 1.0 * * 5.8TROPICAL STORMS AND HURRICANES * * * * 0.3 2.0 3.6 4.5 4.1 2.2 0.3 * 15.2
JAN FEB MAR APR MAY JUN JUL AUG SEP OCT NOV DEC ANNUALWESTERN NORTH PACIFIC
TROPICAL STORMS 0.2 0.3 0.3 0.2 0.4 0.5 1.2 1.8 1.5 1.0 0.8 0.6 7.5TYPHOONS 0.3 0.2 0.2 0.7 0.9 1.2 2.7 4.0 4.1 3.3 2.1 0.7 17.8TROPICAL STORMS AND TYPHOONS 0.4 0.4 0.5 0.9 1.3 1.8 3.9 5.8 5.6 4.3 2.9 1.3 25.3
JAN FEB MAR APR MAY JUN JUL AUG SEP OCT NOV DEC ANNUALSOUTHWEST PACIFIC AND AUSTRALIAN AREA
TROPICAL STORMS 2.7 2.8 2.4 1.3 0.3 0.2 * * * 0.1 0.4 1.5 10.9HURRICANES 0.7 1.1 1.3 0.3 * * 0.1 0.1 * * 0.3 0.5 3.8TROPICAL STORMS AND HURRICANES 3.4 4.1 3.7 1.7 0.3 0.2 0.1 0.1 * 0.1 0.7 2.0 14.8
JAN FEB MAR APR MAY JUN JUL AUG SEP OCT NOV DEC ANNUALSOUTHWEST INDIAN OCEAN
TROPICAL STORMS 2.0 2.2 1.7 0.6 0.2 * * * * 0.3 0.3 0.8 7.4HURRICANES 1.3 1.1 0.8 0.4 * * * * * * * 0.5 3.8TROPICAL STORMS AND HURRICANES 3.2 3.3 2.5 1.1 0.2 * * * * 0.3 0.4 1.4 11.2
JAN FEB MAR APR MAY JUN JUL AUG SEP OCT NOV DEC ANNUALNORTH INDIAN OCEAN
TROPICAL STORMS 0.1 * * 0.1 0.3 0.5 0.5 0.4 0.4 0.6 0.5 0.3 3.5
CYCLONES1 * * * 0.1 0.5 0.2 0.1 * 0.1 0.4 0.6 0.2 2.2
TROPICAL STORMS AND CYCLONES1 0.1 * 0.1 0.3 0.7 0.7 0.6 0.4 0.5 1.0 1.1 0.5 5.7
* Less than .05 1Winds ≥ 48 Kts.Monthly values cannot be combined because single storms overlapping two months were counted once in each month and once in the annual.
Figure 3603b. Monthly and annual average number of storms per year for each area.

508 TROPICAL CYCLONES
ly 70 percent of all typhoons develop. There is a noticeableseasonal shift in storm tracks in this region. From Julythrough September, storms move north of the Philippinesand recurve, while early- and late-season typhoons move ona more westerly track through the Philippines beforerecurving.
North Indian Ocean: Tropical cyclones develop inthe Bay of Bengal and Arabian Sea during the spring andfall. Tropical cyclones in this area form between latitudes8°N and 15°N, except from June through September, whenthe little activity that does occur is confined north of about15°N. These storms are usually short-lived and weak; how-ever, winds of 130 knots have been encountered. Theyoften develop as disturbances along the Intertropical Con-vergence Zone (ITCZ); this inhibits summertimedevelopment, since the ITCZ is usually over land duringthis monsoon season. However, it is sometimes displacedsouthward, and when this occurs, storms will form over themonsoon-flooded plains of Bengal. On the average, six cy-clonic storms form each year. These include two storms thatgenerate winds of 48 knots or greater. Another 10 tropicalcyclones never develop beyond tropical depressions. TheBay of Bengal is the area of highest incidence. However, itis not unusual for a storm to move across southern India andreintensify in the Arabian Sea. This is particularly true dur-ing October, the month of highest incidence during thetropical cyclone season. It is also during this period that tor-rential rains from these storms, dumped over already rain-
soaked areas, cause disastrous floods.
South Indian Ocean: Over the waters west of 100°E,to the east African coast, an average of 11 tropical cyclones(tropical storms and hurricanes) form each season, andabout 4 reach hurricane intensity. The season is from De-cember through March, although it is possible for a stormto form in any month. Tropical cyclones in this region usu-ally form south of 10°S. The latitude of recurvature usuallymigrates from about 20°S in January to around 15°S inApril. After crossing 30°S, these storms sometimes becomeintense extratropical lows.
Southwest Pacific and Australian Area: These trop-ical waters spawn an annual average of 15 tropical cyclones4 of which reach hurricane intensity. The season extendsfrom about December through April, although storms canform in any month. Activity is widespread in January andFebruary, and it is in these months that tropical cyclones aremost likely to affect Fiji, Samoa, and the other eastern is-lands. Tropical cyclones usually form in the waters from105°E to 160°W, between 5° and 20°S. Storms affectingnorthern and western Australia often develop in the Timoror Arafura Sea, while those that affect the east coast form inthe Coral Sea. These storms are often small, but can devel-op winds in excess of 130 knots. New Zealand is sometimesreached by decaying Coral Sea storms, and occasionally byan intense hurricane. In general, tropical cyclones in this re-gion move southwestward and then recurve southeastward.
ANATOMY OF TROPICAL CYCLONES
3604. Formation
Hurricane formation was once believed to result froman intensification of convective forces which produce thetowering cumulonimbus clouds of the doldrums. This viewof hurricane generation held that surface heating causedwarm moist air to ascend convectively to levels where con-densation produced cumulonimbus clouds, which, after aninexplicable drop in atmospheric pressure, coalesced andwere spun into a cyclonic motion by Coriolis force.
This hypothesis left much unexplained. Although somehurricanes develop from disturbances beginning in the dol-drums, very few reach maturity in that region. Also, the highincidence of seemingly ideal convective situations does notmatch the low incidence of Atlantic hurricanes. Finally, thehypothesis did not explain the drop in atmospheric pressure,so essential to development of hurricane-force winds.
There is still no exact understanding of the triggeringmechanism involved in hurricane generation, the balance ofconditions needed to generate hurricane circulation, and therelationships between large- and small-scale atmosphericprocesses. But scientists today, treating the hurricane sys-
tem as an atmospheric heat engine, present a morecomprehensive and convincing view.
They begin with a starter mechanism in which eitherinternal or external forces intensify the initial disturbance.The initial disturbance becomes a region into which low-level air from the surrounding area begins to flow, acceler-ating the convection already occurring inside thedisturbance. The vertical circulation becomes increasinglywell organized as water vapor in the ascending moist layeris condensed (releasing large amounts of heat energy todrive the wind system), and as the system is swept into acounterclockwise cyclonic spiral. But this incipient hurri-cane would soon fill up because of inflow at lower levels,unless the chimney in which converging air surges upwardis provided the exhaust mechanism of high-altitude winds.
These high-altitude winds pump ascending air out ofthe cyclonic system, into a high-altitude anticyclone, whichtransports the air well away from the disturbance, beforesinking occurs. Thus, a large scale vertical circulation is setup, in which low-level air is spiraled up the cyclonic twist-ing of the disturbance, and, after a trajectory over the sea,returned to lower altitudes some distance from the storm.

TROPICAL CYCLONES 509
n-ers.ds,
y-f airude,00
ilesgine.e,ekeh thethe30ingndre
riveots,
inairngal-d
ngrgy.ng
al-theus15
This pumping action-and the heat released by the ascendingair may account for the sudden drop of atmospheric pres-sure at the surface, which produces the steep pressuregradient along which winds reach hurricane proportions.
It is believed that the interaction of low-level and high-al-titude wind systems determines the intensity the hurricanewill attain. If less air is pumped out than converges at low lev-els, the system will fill and die out. If more is pumped out thanflows in, the circulation will be sustained and will intensify.
Scientists have found that any process which increasesthe rate of low-level inflow is favorable for hurricane devel-opment, provided the inflowing air carries sufficient heat andmoisture to fuel the hurricane’s power system. It has alsobeen shown that air above the developing disturbance, at al-titudes between 20,000 and 40,000 feet, increases 1° to 3° intemperature about 24 hours before the disturbance developsinto a hurricane. But it is not known whether low-level in-flow and high-level warming cause hurricanes. They couldvery well be measurable symptoms of another effect whichactually triggers the storm’s increase to hurricane intensity.
The view of hurricanes as atmospheric engines is nec-essarily a general one. The exact role of each contributor isnot completely understood. The engine seems to be both in-efficient and unreliable; a myriad of delicate conditionsmust be satisfied for the atmosphere to produce a hurricane.Their relative infrequency indicates that many potentialhurricanes dissipate before developing into storms.
3605. Portrait Of A Hurricane
In the early life of the hurricane, the spiral covers anarea averaging 100 miles in diameter with winds of 64knots and greater, and spreads gale-force winds over a 400-mile diameter. The cyclonic spiral is marked by heavycloud bands from which torrential rains fall, separated byareas of light rain or no rain at all. These spiral bands ascend
in decks of cumulus and cumulonimbus clouds to the covective limit of cloud formation, where condensing watvapor is swept off as ice-crystal wisps of cirrus cloudThunderstorm electrical activity is observed in these banboth as lightning and as tiny electrostatic discharges.
In the lower few thousand feet, air flows in through the cclone, and is drawn upward through ascending columns onear the center. The size and intensity decrease with altitthe cyclonic circulation being gradually replaced above 40,0feet by an anticyclonic circulation centered hundreds of maway, which is the exhaust system of the hurricane heat en
At lower levels, where the hurricane is more intenswinds on the rim of the storm follow a wide pattern, like thslower currents around the edge of a whirlpool; and, lithose currents, these winds accelerate as they approaccenter of the vortex. The outer band has light winds at rim of the storm, perhaps no more than 25 knots; within miles of the center, winds may have velocities exceed130 knots. The inner band is the region of maximum wivelocity, where the storm’s worst winds are felt, and wheascending air is chimneyed upward, releasing heat to dthe storm. In most hurricanes, these winds reach 85 knand more than 170 knots in severe storms.
In the hurricane, winds flow toward the low pressurethe warm, comparatively calm core. There, converging is whirled upward by convection, the mechanical thrustiof other converging air, and the pumping action of high-titude circulations. This spiral is marked by the thick clouwalls curling inward toward the storm center, releasiheavy precipitation and enormous quantities of heat eneAt the center, surrounded by a band in which this strovertical circulation is greatest, is the eye of the hurricane.
On the average, eye diameter is about 14 miles, though diameters of 25 miles are not unusual. From heated tower of maximum winds and cumulonimbclouds, winds diminish rapidly to something less than
Figure 3604. Pumping action of high-altitude winds.
510 TROPICAL CYCLONES
s in
heas
as-ndsthelow a
edaxi-80httertsin-
henotrri-easingles75this
per-cs.in-inate
than
miles per hour in the eye; at the opposite wall, winds in-crease again, but come from the opposite direction becauseof the cyclonic circulation of the storm. This sudden trans-formation of storm into comparative calm, and from calminto violence from another quarter is spectacular. The eye’sabrupt existence in the midst of opaque rain squalls and hur-ricane winds, the intermittent bursts of blue sky andsunlight through light clouds in the core of the cyclone, andthe galleried walls of cumulus and cumulonimbus cloudsare unforgettable.
Every hurricane is individual, and the more or less or-derly circulation described here omits the extremevariability and instability within the storm system. Pressureand temperature gradients fluctuate wildly across the stormas the hurricane maintains its erratic life. If it is an Auguststorm, its average life expectancy is 12 days; if a July or No-vember storm, it lives an average of 8 days.
3606. Life Of A Tropical Cyclone
Reports from ships in the vicinity of an easterly wave(a westward-moving trough of low pressure embedded indeep easterlies) may indicate that the atmospheric pres-sure in the region has fallen more than 5 millibars in thepast 24 hours. This is cause for alarm, because in the Trop-ics pressure varies little; the normal diurnal pressurechange is only about 3 millibars. Satellite pictures may in-dicate thickening middle and high clouds. Squalls arereported ahead of the easterly wave, and wind reports in-dicate a cyclonic circulation is forming. The formereasterly wave, now classified a tropical disturbance, ismoving westward at 10 knots under the canopy of a large
high-pressure system aloft. Sea surface temperaturethe vicinity are in the 28°-30°C range.
Within 48 hours winds increase to 25 knots near tcenter of definite circulation, and central pressure hdropped below 1000 millibars. The disturbance is now clsified as a tropical depression. Soon the circulation exteout to 100 miles and upward to 20,000 feet. Winds near center increase to gale force, central pressure falls be990 millibars, and towering cumulonimbus clouds shielddeveloping eye; a tropical storm has developed.
Satellite photographs now reveal a tightly organiztropical cyclone, and reconnaissance reports indicate mmum winds of 80 knots around a central pressure of 9millibars; a hurricane has developed. A ship to the rig(left in the Southern Hemisphere) of the hurricane’s cen(looking toward the direction of storm movement) repor30-foot seas. The hurricane is rapidly maturing as it contues westward.
A few days later the hurricane reaches its peak. Tsatellite photographs show a textbook picture, as 120-kwinds roar around a 940-millibar pressure center; hucane-force winds extend 50 miles in all directions, and sare reported up to 40 feet. There is no further deepennow, but the hurricane begins to expand. In 2 days, gaextend out to 200 miles, and hurricane winds out to miles. Then the hurricane slows and begins to recurve; turning marks the beginning of its final phase.
The hurricane accelerates, and, upon reaching temate latitudes, it begins to lose its tropical characteristiThe circulation continues to expand, but now cold air is truding (cold air, cold water, dry air aloft, and land, aid the decay of a tropical cyclone). The winds gradually ab
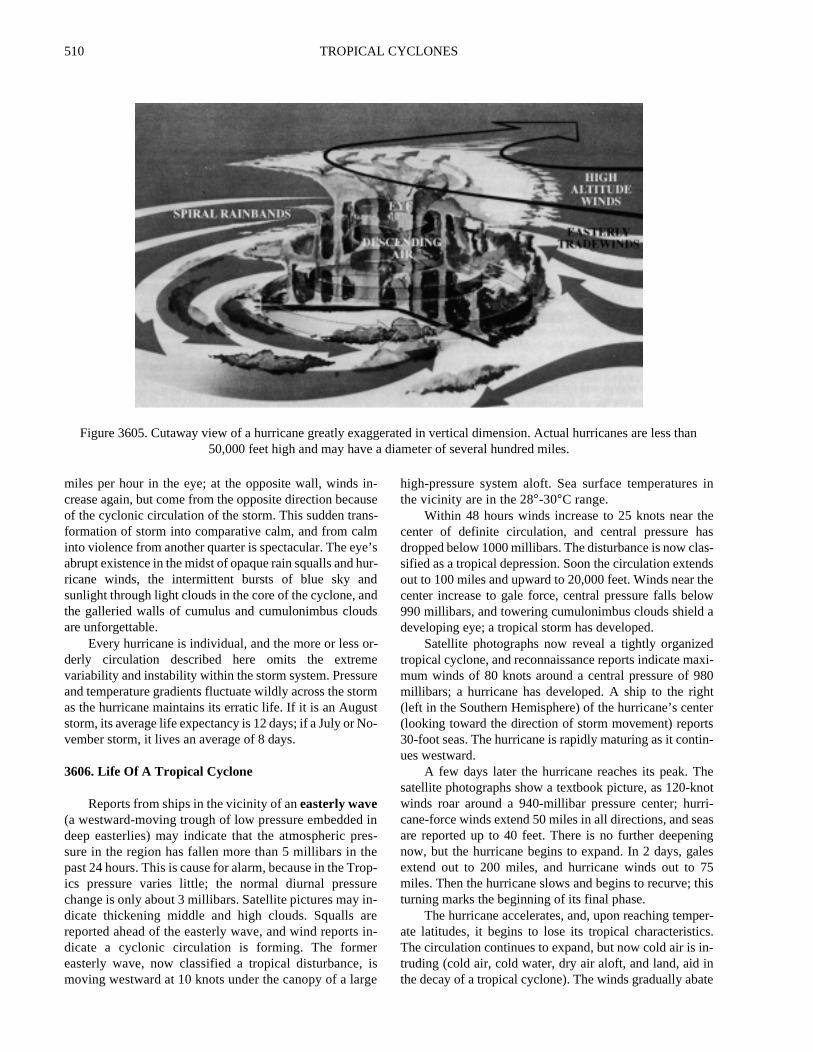
Figure 3605. Cutaway view of a hurricane greatly exaggerated in vertical dimension. Actual hurricanes are less50,000 feet high and may have a diameter of several hundred miles.

TROPICAL CYCLONES 511
ric a-
therherialted
as the concentrated storm disintegrates. The warm core sur-vives for a few more days before the transformation to alarge extratropical low-pressure system is complete.
Not all tropical cyclones follow this average pattern.Most falter in the early stages, some dissipate over land, andothers remain potent for several weeks.
FORECASTING AND PREDICTING TROPICAL CYCLONES
3607. Weather Broadcasts And Radiofacsimile
The marine weather broadcast and radiofacsimileweather maps are the most important tools for avoiding trop-ical cyclones. These broadcasts, covering all tropical areas,provide information about the tropical cyclone’s location,maximum winds and seas, and future conditions expected.
The U S. Navy, the National Oceanic and AtmospheAdministration, and the U.S. Air Force have developedhighly effective surveillance system for the tropical cyclone-prone areas of the world. Routine and special weareports (from land stations, ships at sea, aircraft; weatsatellite imagery; radar reports from land stations; specreports from ships at sea; and the specially instrumen
Figure 3606. Satellite photograph of a hurricane.
512 TROPICAL CYCLONES
weather reconnaissance aircraft of National Oceanic andAtmospheric Administration and the U.S. Air Force) enableaccurate detection, location, and tracking of tropical cy-clones. International cooperation is effective. Data buoys,both moored and drifting, provide another source ofinformation.
The tropical warning services have three principalfunctions:
1. The collection and analysis of the necessary obser-vational data.
2. The preparation of timely and accurate forecastsand warnings.
3. The rapid and efficient distribution of advisories,warnings, and all other pertinent information.
To provide timely and accurate information andwarnings regarding tropical cyclones, the oceans havebeen divided into overlapping geographical areas ofresponsibility.
For detailed information on the areas of responsibility ofthe countries participating in the international forecastingand warning program, and radio aids, refer to SelectedWorldwide Marine Weather Broadcasts, published jointly by
the Naval Meteorology and Oceanography Command andthe National Weather Service.
Although the areas of forecasting responsibility arefairly well defined for the Department of Defense, the inter-national and domestic civilian system provides manyoverlaps and is dependent upon qualitative factors. For ex-ample, when a tropical storm or hurricane is travelingwestward and crosses 35°W longitude, the continued issu-ance of forecasts and warnings to the general public,shipping interests, etc., becomes the responsibility of theNational Hurricane Center of the National Weather Serviceat Miami, Florida. When a tropical storm or hurricanecrosses 35°W longitude traveling from west to east, the Na-tional Hurricane Center ceases to issue formal publicadvisories, but will issue marine bulletins on any dangeroustropical cyclone in the North Atlantic, if it is of importanceor constitutes a threat to shipping and other interests. Theseadvisories are included in National Weather Service MarineBulletins broadcast to ships over radio station NAM Nor-folk, Virginia. Special advisories may be issued at any time.In the Atlantic Ocean, Department of Defense responsibili-ty rests with the Naval Atlantic Meteorology andOceanography Center in Norfolk, Virginia.
In the eastern Pacific east of longitude 140°W, respon-
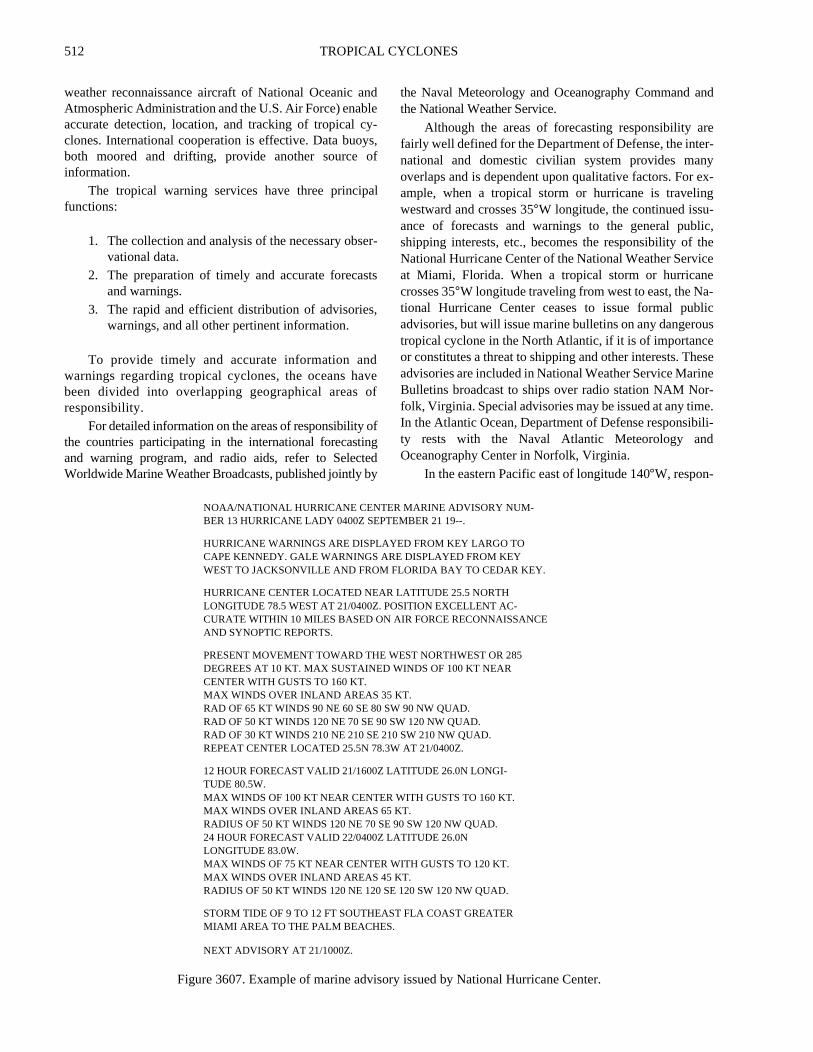
NOAA/NATIONAL HURRICANE CENTER MARINE ADVISORY NUM-BER 13 HURRICANE LADY 0400Z SEPTEMBER 21 19--.
HURRICANE WARNINGS ARE DISPLAYED FROM KEY LARGO TO CAPE KENNEDY. GALE WARNINGS ARE DISPLAYED FROM KEY WEST TO JACKSONVILLE AND FROM FLORIDA BAY TO CEDAR KEY.
HURRICANE CENTER LOCATED NEAR LATITUDE 25.5 NORTHLONGITUDE 78.5 WEST AT 21/0400Z. POSITION EXCELLENT AC-CURATE WITHIN 10 MILES BASED ON AIR FORCE RECONNAISSANCE AND SYNOPTIC REPORTS.
PRESENT MOVEMENT TOWARD THE WEST NORTHWEST OR 285 DEGREES AT 10 KT. MAX SUSTAINED WINDS OF 100 KT NEAR CENTER WITH GUSTS TO 160 KT.MAX WINDS OVER INLAND AREAS 35 KT.RAD OF 65 KT WINDS 90 NE 60 SE 80 SW 90 NW QUAD.RAD OF 50 KT WINDS 120 NE 70 SE 90 SW 120 NW QUAD.RAD OF 30 KT WINDS 210 NE 210 SE 210 SW 210 NW QUAD.REPEAT CENTER LOCATED 25.5N 78.3W AT 21/0400Z.
12 HOUR FORECAST VALID 21/1600Z LATITUDE 26.0N LONGI-TUDE 80.5W.MAX WINDS OF 100 KT NEAR CENTER WITH GUSTS TO 160 KT.MAX WINDS OVER INLAND AREAS 65 KT.RADIUS OF 50 KT WINDS 120 NE 70 SE 90 SW 120 NW QUAD.24 HOUR FORECAST VALID 22/0400Z LATITUDE 26.0N LONGITUDE 83.0W.MAX WINDS OF 75 KT NEAR CENTER WITH GUSTS TO 120 KT.MAX WINDS OVER INLAND AREAS 45 KT.RADIUS OF 50 KT WINDS 120 NE 120 SE 120 SW 120 NW QUAD.
STORM TIDE OF 9 TO 12 FT SOUTHEAST FLA COAST GREATER MIAMI AREA TO THE PALM BEACHES.
NEXT ADVISORY AT 21/1000Z.
Figure 3607. Example of marine advisory issued by National Hurricane Center.

TROPICAL CYCLONES 513
the.gsernIn
ich:edec-ty,for-ce
ncype-l ision.hed a
soal
).ely
andus.us.y dobe-s.
inhapsark
asse-y,ed.ugh
idlyradu-
sibility for the issuance of tropical storm and hurricaneadvisories and warnings for the general public, merchantshipping, and other interests rests with the National Weath-er Service Eastern Pacific Hurricane Center, San Francisco,California. The Department of Defense responsibility restswith the Naval Pacific Meteorology and OceanographyCenter, Pearl Harbor, Hawaii. Formal advisories and warn-ings are issued daily and are included in the marinebulletins broadcast by radio stations KFS, NMC, and NMQ.
In the central Pacific (between the meridian and longi-tude 140°W), the civilian responsibility rests with theNational Weather Service Central Pacific Hurricane Cen-ter, Honolulu, Hawaii. Department of Defenseresponsibility rests with the Naval Pacific Meteorology andOceanography Center in Pearl Harbor. Formal tropicalstorm and hurricane advisories and warnings are issued dai-ly and are included in the marine bulletins broadcast byradio station NMO and NRV.
Tropical cyclone information messages generally con-tain position of the storm, intensity, direction and speed ofmovement, and a description of the area of strong winds.Also included is a forecast of future movement and intensi-ty. When the storm is likely to affect any land area, detailson when and where it will be felt, and data on tides, rain,floods, and maximum winds are also included. Figure 3607provides an example of a marine advisory issued by the Na-tional Hurricane Center.
The Naval Pacific Meteorology and OceanographyCenter Center-West/Joint Typhoon Warning Center (NP-MOC-W/JTWC) in Guam is responsible for all U.S.tropical storm and typhoon advisories and warnings fromthe 180th meridian westward to the mainland of Asia. Asecondary area of responsibility extends westward to longi-tude 90°E. Whenever a tropical cyclone is observed in thewestern North Pacific area, serially numbered warnings,bearing an “immediate” precedence are broadcast fromNPMOC-W/JTWC at 0000, 0600, 1200, and 1800 GMT
The responsibility for issuing gale and storm warninfor the Indian Ocean, Arabian Sea, Bay of Bengal, WestPacific, and South Pacific rests with many countries. general, warnings of approaching tropical cyclones whmay be hazardous will include the following informationstorm type, central pressure given in millibars, wind speobserved within the storm, storm location, speed and dirtion of movement, the extent of the affected area, visibiliand the state of the sea, as well as any other pertinent inmation received. All storm warning messages commenwith the international call sign “TTT.”
These warnings are broadcast on specified radio frequebands immediately upon receipt of the information and at scific intervals thereafter. Generally, the broadcast intervaevery 6 to 8 hours, depending upon receipt of new informat
Bulletins and forecasts are excellent guides to tpresent and future behavior of the tropical cyclone, anplot should be kept of all positions.
AVOIDING TROPICAL CYCLONES
3608. Approach And Passage Of A Tropical Cyclone
An early indication of the approach of a tropical cy-clone is the presence of a long swell. In the absence of atropical cyclone, the crests of swell in the deep waters of theAtlantic pass at the rate of perhaps eight per minute. Swellgenerated by a hurricane is about twice as long, the crestspassing at the rate of perhaps four per minute. Swell may beobserved several days before arrival of the storm.
When the storm center is 500 to 1,000 miles away, thebarometer usually rises a little, and the skies are relativelyclear. Cumulus clouds, if present at all, are few in numberand their vertical development appears suppressed. The ba-rometer usually appears restless, pumping up and down afew hundredths of an inch.
As the tropical cyclone comes nearer, a cloud sequencebegins which resembles that associated with the approachof a warm front in middle latitudes. Snow-white, fibrous“mare’s tails” (cirrus) appear when the storm is about 300to 600 miles away. Usually these seem to converge, moreor less, in the direction from which the storm is approach-ing. This convergence is particularly apparent at about thetime of sunrise and sunset.
Shortly after the cirrus appears, but sometimes before,
the barometer starts a long, slow fall. At first the fall is gradual that it only appears to alter somewhat the normdaily cycle (two maxima and two minima in the TropicsAs the rate of fall increases, the daily pattern is completlost in the more or less steady fall.
The cirrus becomes more confused and tangled, then gradually gives way to a continuous veil of cirrostratBelow this veil, altostratus forms, and then stratocumulThese clouds gradually become more dense, and as theso, the weather becomes unsettled. A fine, mist-like rain gins to fall, interrupted from time to time by rain showerThe barometer has fallen perhaps a tenth of an inch.
As the fall becomes more rapid, the wind increasesgustiness, and its speed becomes greater, reaching per22 to 40 knots (Beaufort 6-8). On the horizon appears a dwall of heavy cumulonimbus, called the bar of the storm.This is the heavy bank of clouds comprising the main mof the cyclone. Portions of this heavy cloud become dtached from time to time, and drift across the skaccompanied by rain squalls and wind of increasing speBetween squalls, the cirrostratus can be seen throbreaks in the stratocumulus.
As the bar approaches, the barometer falls more rapand wind speed increases. The seas, which have been g
514 TROPICAL CYCLONES
ally mounting, become tempestuous. Squall lines, one afterthe other, sweep past in ever increasing number and intensity.
With the arrival of the bar, the day becomes very dark,squalls become virtually continuous, and the barometerfalls precipitously, with a rapid increase in wind speed. Thecenter may still be 100 to 200 miles away in a fully devel-oped tropical cyclone. As the center of the storm comescloser, the ever-stronger wind shrieks through the rigging,and about the superstructure of the vessel. As the center ap-proaches, rain falls in torrents. The wind fury increases. Theseas become mountainous. The tops of huge waves areblown off to mingle with the rain and fill the air with water.Visibility is virtually zero in blinding rain and spray. Eventhe largest and most seaworthy vessels become virtually un-manageable, and may sustain heavy damage. Less sturdyvessels may not survive. Navigation virtually stops as safe-ty of the vessel becomes the only consideration. Theawesome fury of this condition can only be experienced.Words are inadequate to describe it.
If the eye of the storm passes over the vessel, the windssuddenly drop to a breeze as the wall of the eye passes. Therain stops, and the skies clear sufficiently to permit the sunor stars to shine through holes in the comparatively thincloud cover. Visibility improves. Mountainous seas ap-proach from all sides in complete confusion. The barometerreaches its lowest point, which may be 1 1/2 or 2 inches be-low normal in fully developed tropical cyclones. As thewall on the opposite side of the eye arrives, the full fury ofthe wind strikes as suddenly as it ceased, but from the op-posite direction. The sequence of conditions that occurredduring approach of the storm is reversed, and passes morequickly, as the various parts of the storm are not as wide inthe rear of a storm as on its forward side.
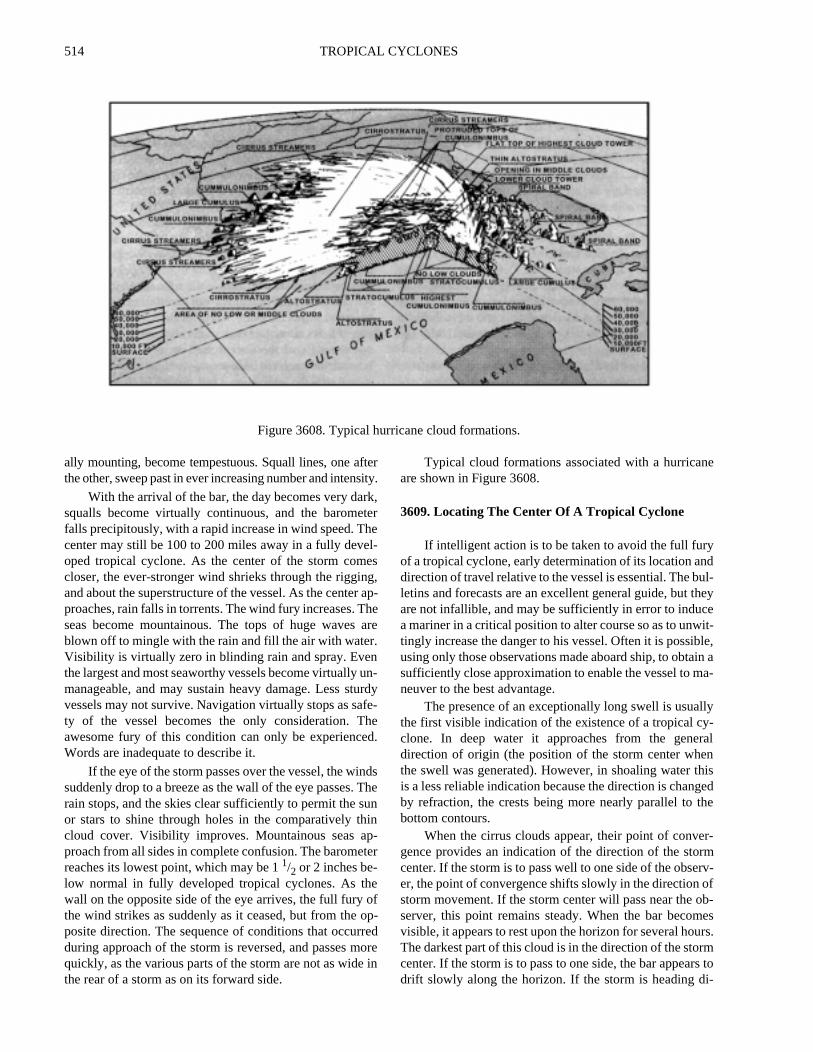
Typical cloud formations associated with a hurricaneare shown in Figure 3608.
3609. Locating The Center Of A Tropical Cyclone
If intelligent action is to be taken to avoid the full furyof a tropical cyclone, early determination of its location anddirection of travel relative to the vessel is essential. The bul-letins and forecasts are an excellent general guide, but theyare not infallible, and may be sufficiently in error to inducea mariner in a critical position to alter course so as to unwit-tingly increase the danger to his vessel. Often it is possible,using only those observations made aboard ship, to obtain asufficiently close approximation to enable the vessel to ma-neuver to the best advantage.
The presence of an exceptionally long swell is usuallythe first visible indication of the existence of a tropical cy-clone. In deep water it approaches from the generaldirection of origin (the position of the storm center whenthe swell was generated). However, in shoaling water thisis a less reliable indication because the direction is changedby refraction, the crests being more nearly parallel to thebottom contours.
When the cirrus clouds appear, their point of conver-gence provides an indication of the direction of the stormcenter. If the storm is to pass well to one side of the observ-er, the point of convergence shifts slowly in the direction ofstorm movement. If the storm center will pass near the ob-server, this point remains steady. When the bar becomesvisible, it appears to rest upon the horizon for several hours.The darkest part of this cloud is in the direction of the stormcenter. If the storm is to pass to one side, the bar appears todrift slowly along the horizon. If the storm is heading di-
Figure 3608. Typical hurricane cloud formations.

TROPICAL CYCLONES 515
rectly toward the observer, the position of the bar remainsfixed. Once within the area of the dense, low clouds, oneshould observe their direction of movement, which is al-most exactly along the isobars, with the center of the stormbeing 90° from the direction of cloud movement (left of di-rection of movement in the Northern Hemisphere, and rightin the Southern Hemisphere).
The winds are probably the best guide to the directionof the center of a tropical cyclone. The circulation is cy-clonic, but because of the steep pressure gradient near thecenter, the winds there blow with greater violence and aremore nearly circular than in extratropical cyclones.
According to Buys Ballot’s law, an observer whoseback is to the wind has the the low pressure on his left in theNorthern Hemisphere, and on his right in the Southern Hemi-sphere. If the wind followed circular isobars exactly, thecenter would be exactly 90° from behind when facing awayfrom the wind. However, the track of the wind is usually in-clined somewhat toward the center, so that the angle fromdead astern varies between perhaps 90° to 135°. The inclina-tion varies in different parts of the same storm. It is least in
front of the storm, and greatest in the rear, since the actualwind is the vector sum of the pressure gradient and the mo-tion of the storm along the track. A good average is perhaps110° in front, and 120-135° in the rear. These values applywhen the storm center is still several hundred miles away.Closer to the center, the wind blows more nearly along theisobars, the inclination being reduced by one or two points atthe wall of the eye. Since wind direction usually shifts tem-porarily during a squall, its direction at this time should notbe used for determining the position of the center. The ap-proximate relationship of wind to isobars and storm center inthe Northern Hemisphere is shown in Figure 3609a.
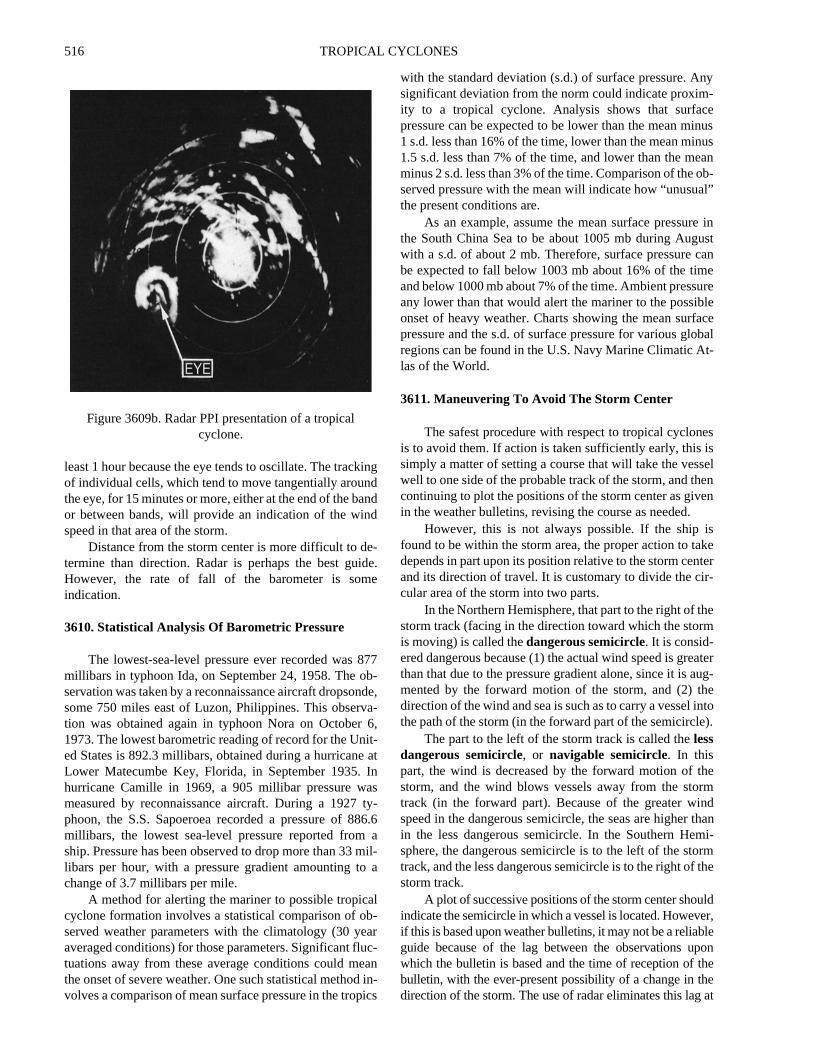
When the center is within radar range, it will probablybe visible on the scope. However, since the radar return ispredominantly from the rain, results can be deceptive, andother indications should not be neglected. Figure 3609bshows a radar PPI presentation of a tropical cyclone. If theeye is out of range, the spiral bands (Figure 3609b) may in-dicate its direction from the vessel. Tracking the eye orupwind portion of the spiral bands enables determining thedirection and speed of movement; this should be done for at
Figure 3609a. Approximate relationship of wind to isobars and storm center in the Northern Hemisphere.
516 TROPICAL CYCLONES
al”
e inustcan
eureblefaceobalt-
esisselenen
isketer
ir-
hem
eaterug-
he intoe).
hermnd thanmi-rm
the
ulder,bleponthehe at
least 1 hour because the eye tends to oscillate. The trackingof individual cells, which tend to move tangentially aroundthe eye, for 15 minutes or more, either at the end of the bandor between bands, will provide an indication of the windspeed in that area of the storm.
Distance from the storm center is more difficult to de-termine than direction. Radar is perhaps the best guide.However, the rate of fall of the barometer is someindication.
3610. Statistical Analysis Of Barometric Pressure
The lowest-sea-level pressure ever recorded was 877millibars in typhoon Ida, on September 24, 1958. The ob-servation was taken by a reconnaissance aircraft dropsonde,some 750 miles east of Luzon, Philippines. This observa-tion was obtained again in typhoon Nora on October 6,1973. The lowest barometric reading of record for the Unit-ed States is 892.3 millibars, obtained during a hurricane atLower Matecumbe Key, Florida, in September 1935. Inhurricane Camille in 1969, a 905 millibar pressure wasmeasured by reconnaissance aircraft. During a 1927 ty-phoon, the S.S. Sapoeroea recorded a pressure of 886.6millibars, the lowest sea-level pressure reported from aship. Pressure has been observed to drop more than 33 mil-libars per hour, with a pressure gradient amounting to achange of 3.7 millibars per mile.
A method for alerting the mariner to possible tropicalcyclone formation involves a statistical comparison of ob-served weather parameters with the climatology (30 yearaveraged conditions) for those parameters. Significant fluc-tuations away from these average conditions could meanthe onset of severe weather. One such statistical method in-volves a comparison of mean surface pressure in the tropics
with the standard deviation (s.d.) of surface pressure. Anysignificant deviation from the norm could indicate proxim-ity to a tropical cyclone. Analysis shows that surfacepressure can be expected to be lower than the mean minus1 s.d. less than 16% of the time, lower than the mean minus1.5 s.d. less than 7% of the time, and lower than the meanminus 2 s.d. less than 3% of the time. Comparison of the ob-served pressure with the mean will indicate how “unusuthe present conditions are.
As an example, assume the mean surface pressurthe South China Sea to be about 1005 mb during Augwith a s.d. of about 2 mb. Therefore, surface pressure be expected to fall below 1003 mb about 16% of the timand below 1000 mb about 7% of the time. Ambient pressany lower than that would alert the mariner to the possionset of heavy weather. Charts showing the mean surpressure and the s.d. of surface pressure for various glregions can be found in the U.S. Navy Marine Climatic Alas of the World.
3611. Maneuvering To Avoid The Storm Center
The safest procedure with respect to tropical cyclonis to avoid them. If action is taken sufficiently early, this simply a matter of setting a course that will take the veswell to one side of the probable track of the storm, and thcontinuing to plot the positions of the storm center as givin the weather bulletins, revising the course as needed.
However, this is not always possible. If the ship found to be within the storm area, the proper action to tadepends in part upon its position relative to the storm cenand its direction of travel. It is customary to divide the ccular area of the storm into two parts.
In the Northern Hemisphere, that part to the right of tstorm track (facing in the direction toward which the storis moving) is called the dangerous semicircle. It is consid-ered dangerous because (1) the actual wind speed is grthan that due to the pressure gradient alone, since it is amented by the forward motion of the storm, and (2) tdirection of the wind and sea is such as to carry a vesselthe path of the storm (in the forward part of the semicircl
The part to the left of the storm track is called the lessdangerous semicircle, or navigable semicircle. In thispart, the wind is decreased by the forward motion of tstorm, and the wind blows vessels away from the stotrack (in the forward part). Because of the greater wispeed in the dangerous semicircle, the seas are higherin the less dangerous semicircle. In the Southern Hesphere, the dangerous semicircle is to the left of the stotrack, and the less dangerous semicircle is to the right ofstorm track.
A plot of successive positions of the storm center shoindicate the semicircle in which a vessel is located. Howevif this is based upon weather bulletins, it may not be a reliaguide because of the lag between the observations uwhich the bulletin is based and the time of reception of bulletin, with the ever-present possibility of a change in tdirection of the storm. The use of radar eliminates this lag
Figure 3609b. Radar PPI presentation of a tropicalcyclone.

TROPICAL CYCLONES 517
rse
thewerion to thestastith po-f of of
short range, but the return may not be a true indication of thecenter. Perhaps the most reliable guide is the wind. Withinthe cyclonic circulation, a wind shifting to the right in thenorthern hemisphere and to the left in the southern hemi-sphere indicates the vessel is probably in the dangeroussemicircle. A steady wind shift opposite to this indicates thevessel is probably in the less dangerous semicircle.
However, if a vessel is underway, its own motion shouldbe considered. If it is outrunning the storm or pulling rapidlytoward one side (which is not difficult during the early stagesof a storm, when its speed is low), the opposite effect occurs.This should usually be accompanied by a rise in atmosphericpressure, but if motion of the vessel is nearly along an isobar,this may not be a reliable indication. If in doubt, the safest ac-tion is usually to stop long enough to define the propersemicircle. The loss in time may be more than offset by theminimizing of the possibility of taking the wrong action, in-creasing the danger to the vessel. If the wind direction remainssteady (for a vessel which is stopped), with increasing speedand falling barometer, the vessel is in or near the path of thestorm. If it remains steady with decreasing speed and rising ba-rometer, the vessel is near the storm track, behind the center.
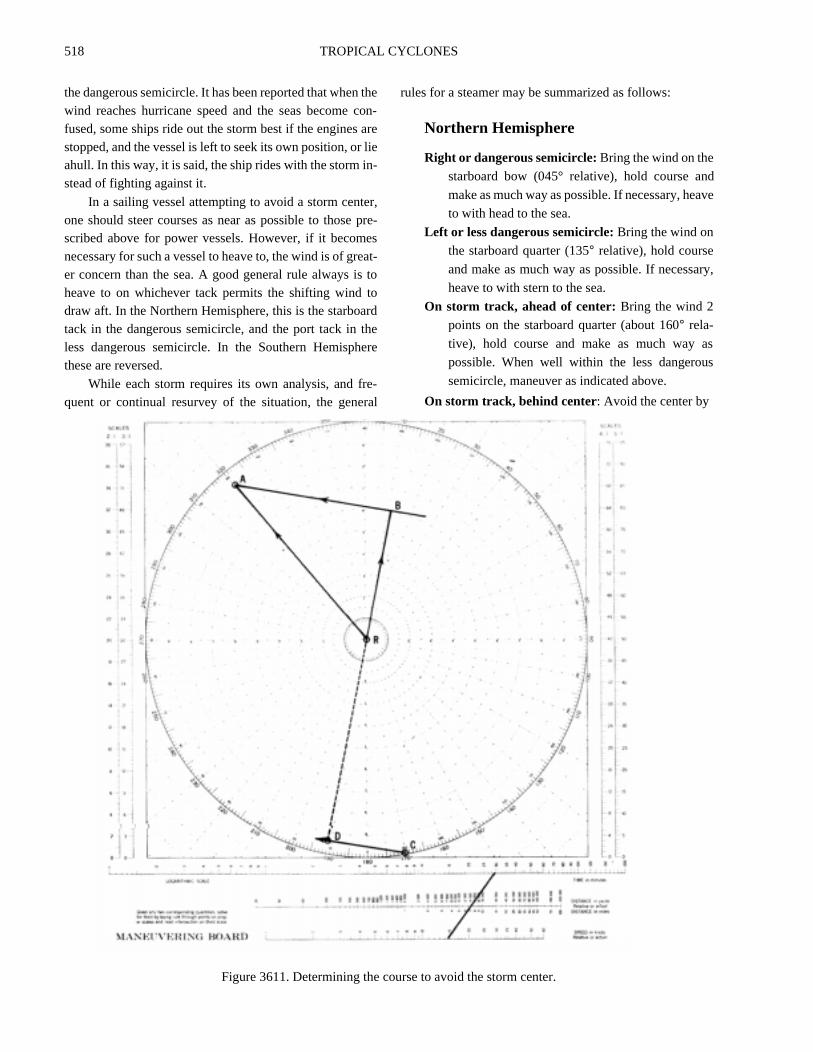
The first action to take if the ship is within the cycloniccirculation is to determine the position of his vessel with re-spect to the storm center. While the vessel can still makeconsiderable way through the water, a course should be se-lected to take it as far as possible from the center. If thevessel can move faster than the storm, it is a relatively sim-ple matter to outrun the storm if sea room permits. Butwhen the storm is faster, the solution is not as simple. In thiscase, the vessel, if ahead of the storm, will approach nearerto the center. The problem is to select a course that will pro-duce the greatest possible minimum distance. This is bestdetermined by means of a relative movement plot, as shownin the following example solved on a maneuvering board.
Example: A tropical cyclone is estimated to be movingin direction 320° at 19 knots. Its center bears 170°, at an es-timated distance of 200 miles from a vessel which has amaximum speed of 12 knots.
Required: (1) The course to steer at 12 knots to produce the
greatest possible minimum distance between the vessel and the storm center.
(2) The distance to the center at nearest approach.(3) Elapsed time until nearest approach.
Solution: (Figure 3611) Consider the vessel remainingat the center of the plot throughout the solution, as ona radar PPI.(1) To locate the position of the storm center relative to
the vessel, plot point C at a distance of 200 miles (scale 20:1)in direction 170° from the center of the diagram. From thecenter of the diagram, draw RA, the speed vector of the stormcenter, in direction 320°, speed 19 knots (scale 2:1). From A
draw a line tangent to the 12-knot speed circle (labeled 6 atscale 2:1) on the side opposite the storm center. From the cen-ter of the diagram, draw a perpendicular to this tangent line,locating point B. The line RB is the required speed vector forthe vessel. Its direction, 011°, is the required course.
(2) The path of the storm center relative to the vessel willbe along a line from C in the direction BA, if both storm andvessel maintain course and speed. The point of nearest ap-proach will be at D, the foot of a perpendicular from the centerof the diagram. This distance, at scale 20:1, is 187 miles.
(3) The length of the vector BA (14.8 knots) is the speedof the storm with respect to the vessel. Mark this on the lowestscale of the nomogram at the bottom of the diagram. The rel-ative distance CD is 72 miles, by measurement. Mark this(scale 10:1) on the middle scale at the bottom of the diagram.Draw a line between the two points and extend it to intersectthe top scale at 29.2 (292 at 10:1 scale). The elapsed time istherefore 292 minutes, or 4 hours 52 minutes.
Answers: (1) C 011°, (2) D 187 mi., (3) 4h 52m.The storm center will be dead astern at its nearestapproach.
As a general rule, for a vessel in the Northern Hemi-sphere, safety lies in placing the wind on the starboard bowin the dangerous semicircle and on the starboard quarter inthe less dangerous semicircle. If on the storm track ahead ofthe storm, the wind should be put about 160° on the star-board quarter until the vessel is well within the lessdangerous semicircle, and the rule for that semicircle thenfollowed. In the Southern Hemisphere the same rules hold,but with respect to the port side. With a faster than averagevessel, the wind can be brought a little farther aft in eachcase. However, as the speed of the storm increases along itstrack, the wind should be brought farther forward. If landinterferes with what would otherwise be the best maneuver,the solution should be altered to fit the circumstances.
If the vessel is faster than the storm, it is possible toovertake it. In this case, the only action usually needed is toslow enough to let the storm pull ahead.
In all cases, one should be alert to changes in the direc-tion of movement of the storm center, particularly in thearea where the track normally curves toward the pole. If thestorm maintains its direction and speed, the ship’s coushould be maintained as the wind shifts.
If it becomes necessary for a vessel to heave to, characteristics of the vessel should be considered. A povessel is concerned primarily with damage by direct actof the sea. A good general rule is to heave to with headthe sea in the dangerous semicircle, or stern to the sea inless dangerous semicircle. This will result in greateamount of headway away from the storm center, and leamount of leeway toward it. If a vessel handles better wthe sea astern or on the quarter, it may be placed in thissition in the less dangerous semicircle or in the rear halthe dangerous semicircle, but never in the forward half
518 TROPICAL CYCLONES
nd
ave
ry,
as
s
the dangerous semicircle. It has been reported that when thewind reaches hurricane speed and the seas become con-fused, some ships ride out the storm best if the engines arestopped, and the vessel is left to seek its own position, or lieahull. In this way, it is said, the ship rides with the storm in-stead of fighting against it.
In a sailing vessel attempting to avoid a storm center,one should steer courses as near as possible to those pre-scribed above for power vessels. However, if it becomesnecessary for such a vessel to heave to, the wind is of great-er concern than the sea. A good general rule always is toheave to on whichever tack permits the shifting wind todraw aft. In the Northern Hemisphere, this is the starboardtack in the dangerous semicircle, and the port tack in theless dangerous semicircle. In the Southern Hemispherethese are reversed.
While each storm requires its own analysis, and fre-quent or continual resurvey of the situation, the general
rules for a steamer may be summarized as follows:
Northern Hemisphere
Right or dangerous semicircle: Bring the wind on the
starboard bow (045° relative), hold course a
make as much way as possible. If necessary, he
to with head to the sea.
Left or less dangerous semicircle: Bring the wind on
the starboard quarter (135° relative), hold course
and make as much way as possible. If necessa
heave to with stern to the sea.
On storm track, ahead of center: Bring the wind 2
points on the starboard quarter (about 160° rela-
tive), hold course and make as much way
possible. When well within the less dangerou
semicircle, maneuver as indicated above.
On storm track, behind center: Avoid the center by
Figure 3611. Determining the course to avoid the storm center.

TROPICAL CYCLONES 519
esedfrs.te’s
eein-
verfall ar-
fews
s ofts ins,ervel-idlyhentheen-ndle,ave
r-l toionht.
the best practicable course, keeping in mind thetendency of tropical cyclones to curve northwardand eastward.
Southern Hemisphere
Left or dangerous semicircle: Bring the wind on theport bow (315° relative), hold course and make asmuch way as possible. If necessary, heave to withhead to the sea.
Right or less dangerous semicircle: Bring the windon the port quarter (225° relative), hold course andmake as much way as possible. If necessary, heaveto with stern to the sea.
On storm track, ahead of center: Bring the windabout 200° relative, hold course and make as muchway as possible. When well within the less dan-gerous semicircle, maneuver as indicated above.
On storm track, behind center: Avoid the center bythe best practicable course, keeping in mind thetendency of tropical cyclones to curve southwardand eastward.
It is possible, particularly in temperate latitudes afterthe storm has recurved, that the dangerous semicircle is theleft one in the Northern Hemisphere (right one in the South-ern Hemisphere). This can occur if a large high lies north ofthe storm and causes a tightening of the pressure gradient inthe region.
The Typhoon Havens Handbook for the Western Pacif-ic and Indian Oceans is published by the NavalOceanographic and Atmospheric Research Lab (NOARL)Monterey, California, as an aid to captains and command-ing officers of ships in evaluating a typhoon situation, andto assist them in deciding whether to sortie, to evade, to re-main in port, or to head for the shelter of a specific harbor.
CONSEQUENCES OF TROPICAL CYCLONES
3612. High Winds And Flooding
The high winds of a tropical cyclone inflict widespreaddamage when such a storm leaves the ocean and crossesland. Aids to navigation may be blown out of position or de-stroyed. Craft in harbors, often lifted by the storm surge,break moorings or drag anchor and are blown ashore andagainst obstructions. Ashore, trees are blown over, housesare damaged, power lines are blown down, etc. The greatestdamage usually occurs in the dangerous semicircle a shortdistance from the center, where the strongest winds occur.As the storm continues on across land, its fury subsidesfaster than it would if it had remained over water.
Wind instruments are usually incapable of measuringthe 175 to 200 knot winds of the more intense hurricanes; ifthe instrument holds up, often the supporting structuregives way. Doppler radar may be effective in determiningwind speeds, but may also be blown away.
Wind gusts, which are usually 30 to 50 percent higherthan sustained winds, add significantly to the destructive-ness of the tropical cyclone. Many tropical cyclones thatreach hurricane intensity develop winds of more than 90knots sometime during their lives, but few develop winds ofmore than 130 knots.
Tropical cyclones have produced some of the world’sheaviest rainfalls. While average amounts range from 6 to10 inches, totals near 100 inches over a 4-day period havebeen observed. A 24-hour world’s record of 73.62 inchesfell at Reunion Island during a tropical cyclone in 1952.Forward movement of the storm and land topography havea considerable influence on rainfall totals. Torrential rainscan occur when a storm moves against a mountain range;this is common in the Philippines and Japan, where evenweak tropical depressions produce considerable rainfall. A
24-hour total of 46 inches was recorded in the Philippinduring a typhoon in 1911. As hurricane Camille crosssouthern Virginia’s Blue Ridge Mountains in August o1969, there was nearly 30 inches of rain in about 8 houThis caused some of the most disastrous floods in the stahistory.
Flooding is an extremely destructive by-product of thtropical cyclone’s torrential rains. Whether an area will bflooded depends on the physical characteristics of the draage basin, rate and accumulation of precipitation, and ristages at the time the rains begin. When heavy rains over flat terrain, the countryside may lie under water formonth or so, and while buildings, furnishings, and undeground power lines may be damaged, there are usually fatalities. In mountainous or hill country, disastrous flooddevelop rapidly and can cause a great loss of life.
There have been occasional reports in tropical cyclonewaves greater than 40 feet in height, and numerous reporthe 30- to 40-foot category. However, in tropical cyclonestrong winds rarely persist for a sufficiently long time or ova large enough area to permit enormous wave heights to deop. The direction and speed of the wind changes more rapin tropical cyclones than in extratropical storms. Thus, tmaximum duration and fetch for any wind condition is ofteless in tropical cyclones than in extratropical storms, and waves accompanying any given local wind conditions are gerally not so high as those expected, with similar local wiconditions, in the high-latitude storms. In hurricane Camilsignificant waves of 43 feet were recorded; an extreme wheight reached 72 feet.
Exceptional conditions may arise when waves of cetain dimensions travel within the storm at a speed equathe storm’s speed, thus, in effect, extending the duratand fetch of the wave and significantly increasing its heig

520 TROPICAL CYCLONES
eirndbove
re,tormrgeura-
n ao,
es-ttlester-ic
Both
t of, andageave
Theom- the
cur-f theieses.orna- that
a isentheea-entline
This occurs most often to the right of the track in the North-ern Hemisphere (left of the track in the SouthernHemisphere). Another condition that may give rise to ex-ceptional wave heights is the intersection of waves fromtwo or more distinct directions. This may lead to a zone ofconfused seas in which the heights of some waves willequal the sums of each individual wave train. This processcan occur in any quadrant of the storm, so it should not beassumed that the highest waves will always be encounteredto the right of the storm track in the Northern Hemisphere(left of the track in the Southern Hemisphere).
When these waves move beyond the influence of thegenerating winds, they become known as swell. They arerecognized by their smooth, undulating form, in contrast tothe steep, ragged crests of wind waves. This swell, particu-larly that generated by the right side of the storm, can travela thousand miles or more and may produce tides 3 or 4 feetabove normal along several hundred miles of coastline. Itmay also produce tremendous surf over offshore reefswhich normally are calm.
When a tropical cyclone moves close to a coast, windoften causes a rapid rise in water level, and along with thefalling pressure may produce a storm surge. This surge isusually confined to the right of the track in the NorthernHemisphere (left of the track in the Southern Hemisphere)and to a relatively small section of the coastline. It most of-ten occurs with the approach of the storm, but in somecases, where a surge moves into a long channel, the effectmay be delayed. Occasionally, the greatest rise in water isobserved on the opposite side of the track, when northerlywinds funnel into a partially landlocked harbor. The surgecould be 3 feet or less, or it could be 20 feet or more, de-pending on the combination of factors involved.
There have been reports of a “hurricane wave,” describedas a “wall of water,” which moves rapidly toward the coastline.Authenticated cases are rare, but some of the world’s greatestnatural disasters have occurred as a result of this wave, whichmay be a rapidly rising and abnormally high storm surge. In In-dia, such a disaster occurred in 1876, between Calcutta andChittagong, and drowned more than 100,000 persons.
Along the coast, greater damage may be inflicted by wa-ter than by the wind. There are at least four sources of waterdamage. First, the unusually high seas generated by the storm
winds pound against shore installations and craft in thway. Second, the continued blowing of the wind toward lacauses the water level to increase perhaps 3 to 10 feet aits normal level. This storm tide, which may begin when thestorm center is 500 miles or even farther from the shogradually increases until the storm passes. The highest stides are caused by a slow-moving tropical cyclone of ladiameter, because both of these effects result in greater dtion of wind in the same direction. The effect is greatest ipartly enclosed body of water, such as the Gulf of Mexicwhere the concave coastline does not readily permit thecape of water. It is least on small islands, which present liobstruction to the flow of water. Third, the furious windwhich blow around the wall of the eye create a ridge of wacalled a storm wave, which strikes the coast and often inflicts heavy damage. The effect is similar to that of a seismsea wave, caused by an earthquake in the ocean floor. of these waves are popularly called tidal waves. Stormwaves of 20 feet or more have occurred. About 3 or 4 feethis wave is due to the decrease of atmospheric pressurethe rest to winds. Like the damage caused by wind, damdue to high seas, the storm surge and tide, and the storm wis greatest in the dangerous semicircle, near the center.fourth source of water damage is the heavy rain that accpanies a tropical cyclone. This causes floods that add todamage caused in other ways.
There have been many instances of tornadoes ocring within the circulation of tropical cyclones. Most othese have been associated with tropical cyclones ofNorth Atlantic Ocean and have occurred in the West Indand along the gulf and Atlantic coasts of the United StatThey are usually observed in the forward semicircle along the advancing periphery of the storm. These tordoes are usually short-lived and less intense than thoseoccur in the midwestern United States.
When proceeding along a shore recently visited bytropical cyclone, a navigator should remember that timerequired to restore aids to navigation which have beblown out of position or destroyed. In some instances aid may remain but its light, sound apparatus, or radiobcon may be inoperative. Landmarks may have bedamaged or destroyed, and in some instances the coasand hydrography may be changed.