chapter 38 accident statisticsmospi.nic.in/sites/default/files/statistical_year_book...572 38.6 road...
TRANSCRIPT
570
CHAPTER 38
ACCIDENT STATISTICS
38.1 As human beings evolve, their capacity to tackle vagaries of nature like cyclones, famines etc. increases. Improved hygiene and medical
discoveries reduce incidence of epidemics like cholera and small pox. Consequently, the proportion of accidental deaths due to natural causes (heat
stroke, exposure to cold, starvation, epidemic, cyclone etc.) is expected to decrease significantly . However, during the process of evolution, changing
lifestyle (increasing stress, obesity etc.) introduces new elements like traffic
accidents and cardiac arrests that effect mortality .Besides these, incidences of deliberate termination of life through suicide or abortions also increase. With
the increasing population, accidental deaths are expected to increase in absolute terms (on the average), but a systematic increase/decrease in rates
may be looked at to assess our progress towards the attainment of human well being.
38.2 Accidental Deaths (Incidence & Rates) Average incidence of
accidental deaths per year and average annual rates of accidental deaths for decades 1971 onwards reveal not only increasing accidental deaths in India
but also continuous annual increase in the rate of accidental deaths (accidental deaths per 1 lakh population ) from 18.8 during 1971- 80 to 32.6 in 2013.
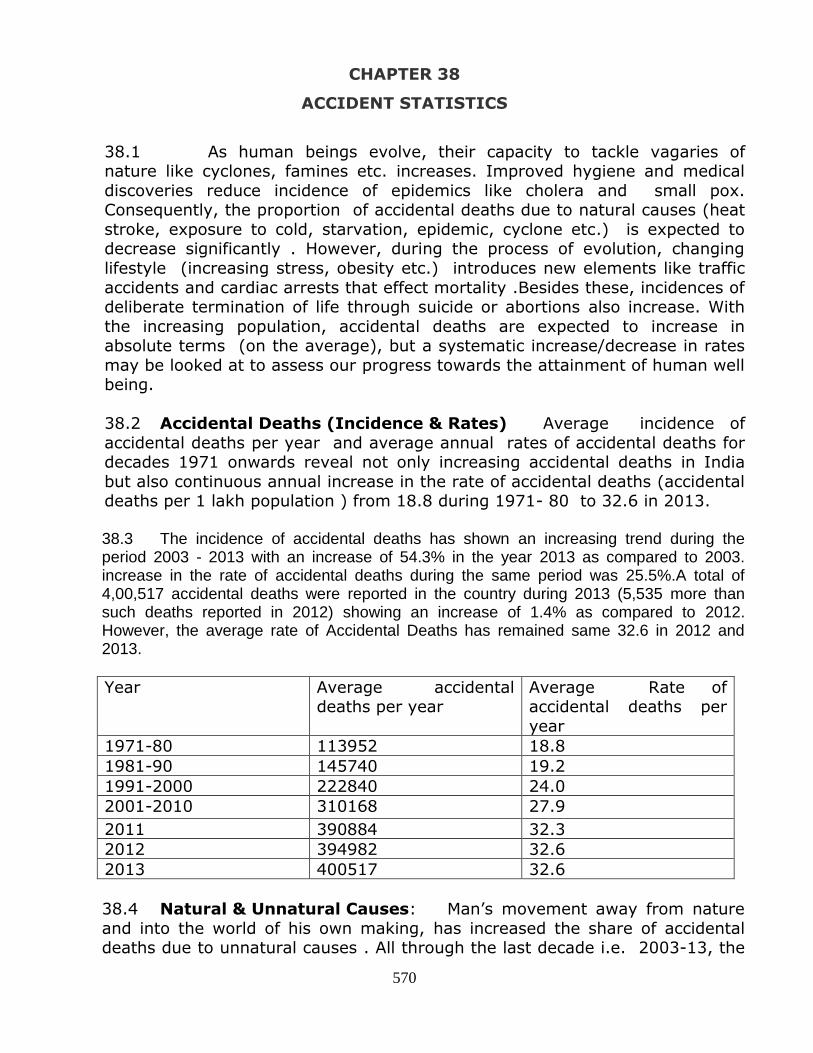
38.3 The incidence of accidental deaths has shown an increasing trend during the period 2003 - 2013 with an increase of 54.3% in the year 2013 as compared to 2003. increase in the rate of accidental deaths during the same period was 25.5%.A total of 4,00,517 accidental deaths were reported in the country during 2013 (5,535 more than such deaths reported in 2012) showing an increase of 1.4% as compared to 2012. However, the average rate of Accidental Deaths has remained same 32.6 in 2012 and 2013.
Year Average accidental deaths per year
Average Rate of accidental deaths per
year
1971-80 113952 18.8
1981-90 145740 19.2
1991-2000 222840 24.0
2001-2010 310168 27.9
2011 390884 32.3
2012 394982 32.6
2013 400517 32.6
38.4 Natural & Unnatural Causes: Man’s movement away from nature
and into the world of his own making, has increased the share of accidental deaths due to unnatural causes . All through the last decade i.e. 2003-13, the

571
share of accidental deaths due to unnatural causes has remained consistently high at around 92-94 %. A total of 3,77,758 (94.3%) deaths were due to un-natural causes and the rest of 5.7% deaths (22,759) were due to causes attributable to nature, out of total 4,00,517 accidental deaths during the year 2013. There was a decline of 0.9% in deaths due to causes attributable to nature and an increase of 1.5% in deaths due to un-natural causes as compared to 2012.
During the last decade, amongst identified natural
causes of accidental deaths, lightning seems most
significant accounting for about 10 % of deaths due to natural
causes whereas amongst unnatural causes, traffic
accident caused maximum
unnatural deaths ( 42-45 % of unnatural deaths) followed by
drowning (8-9 %) , poisoning(8-10 %), fire (6-
8%) and sudden deaths( 6 - 8 %) also accounted for
significant share of unnatural deaths during last decade
38.5 State wise Comparison : Maharashtra has reported maximum (62,770) accidental deaths out of 4,00,517 such deaths in the country during the year and it accounted for nearly one-sixth (15.7%) of total accidental deaths reported in the country. Uttar Pradesh, the most populous State in the country with population share of 16.9%, on the other hand, has accounted for 8.2% of accidental deaths in the country. The other States having larger percentage share in total accidental deaths were Madhya Pradesh (9.4%), Tamil Nadu (8.3%) and Andhra Pradesh (7.8%). However, Gujarat (6.6%), Rajasthan (6.2%), Karnataka (5.6%) and West Bengal (5.5%) have also reported significant shares of deaths due to accidents during 2013. The highest rate of accidental deaths was reported by Puducherry (68.3) followed by Chhattisgarh (63.3), Maharashtra (54.0), Goa (53.1), Daman & Diu (51.5) and Madhya Pradesh (50.0) against the national average rate of 32.6.Amongst bigger States , Bihar, UP, Jharkhand, Odisha , West Bengal were less accident prone states with the accident rate below national average.

572
38.6 Road Accidents : Fatalities and injuries due to traffic accidents , is increasingly becoming matter of concern with surge in motorization both due to increasing population and increased vehicular penetration.
38.7 International Scenario : Road traffic injuries are the eighth leading cause of death, and as such are an important global public health problem. As per WHO, They are the number one cause of death among those aged 15-29 years. There were approximately 1.24 million road traffic deaths in the world in 2010, 77% of which were among males. Middle-income countries had the highest burden and the highest road traffic death rates. In 2010, low- and middle-income countries had higher road traffic fatality rates (18.3 and 20.1, respectively) compared to high-income countries (8.7). The African region had the highest road traffic fatality rate, at 24.1, while the European region had the lowest rate, at 10.3.While road traffic death rates in many high-income countries have stabilized or declined in recent decades, data suggest that in most other regions of the world, the global epidemic of traffic injuries is still increasing. About 1.2 Million people, each year, die on world roads. Fifty per cent of those dying on roads are vulnerable road users . About half of countries do not have a law requiring use of child restraints for young children in vehicles.

573
Estimated Number of Road Traffic Deaths 2010
38.8 International Comparison of Road Traffic Injury Accidents and Deaths: Cross country comparisons of incidents of road accident related deaths and injury accidents per lakh population as per World Road Statistics (WRS) 2012 (published by International Road Federation, Geneva) showed lower incidence of both the parameters for India in comparison to many developed and developing countries (Table 11.1). In 2010, the number of road accident deaths per lakh of population at (11.43) in India was much lower compared with South Africa (27.94), Malaysia (24.20), Russian Federation (18.72), Kuwait (13.67), Qatar (12.96) (Chart 11.1). For the year 2010, South Africa reported the highest figure at (27.94) deaths per lakh population and Philippines reported the lowest number of deaths per lakh population at (1.35).
Number of Persons killed per lakh population 2010
38.9 Injury accidents per lakh of population in India was substantially lower at around (42.46) during 2010 when compared with France (103.42), United Kingdom (248.13), Canada (359.90), Germany (352.54). For 2010, the highest figure was reported by Japan (569.45) and Australia (5.53) reported the lowest figures in respect of injury accidents per lakh population. However, the lower rates in countries like India may not necessarily be indicative of improved road safety. Large population with less vehicles, conditions of road (limiting the speed limits ) etc might also contribute towards lower rates.

574
38.10 Comparison of India & China : A comparative status of road accidents and persons killed in China and India is shown below through graphs which
clearly brings out that in China both road accidents and fatalities are on a downward slide, while in India both road accidents and the number of persons
killed are steadily rising.
Total Number of Road Accidents – India and China
Total Number of Persons killed in Road Accidents-India & China
38.11 Indian Scenario : Expansion in the road network, surge in motorization and a rising population of a country contribute towards increasing numbers of road accidents, accident related injuries and fatalities . Between 1970 and 2011, the number of accidents increased by 4.4 times, accompanied with 9.8 times increase in fatalities and 7.3 times increase in the number of persons injured, in the backdrop of more than 100 fold increase in the number of registered motor vehicles and close to 4 fold increase in the road network.
Growth in Select Accident Related Parameters: CAGR in per cent Per
iod
Number
of
Accidents
Number
of
Fatalities
Number
of
Persons
Injured
Number of
Registered
Vehicles
Road Length
(in
kilometre)
2001/1991
3.2 3.7 4.7 9.9 3.7
2011/2001
2.1 5.8 2.4 9.9 3.4
575
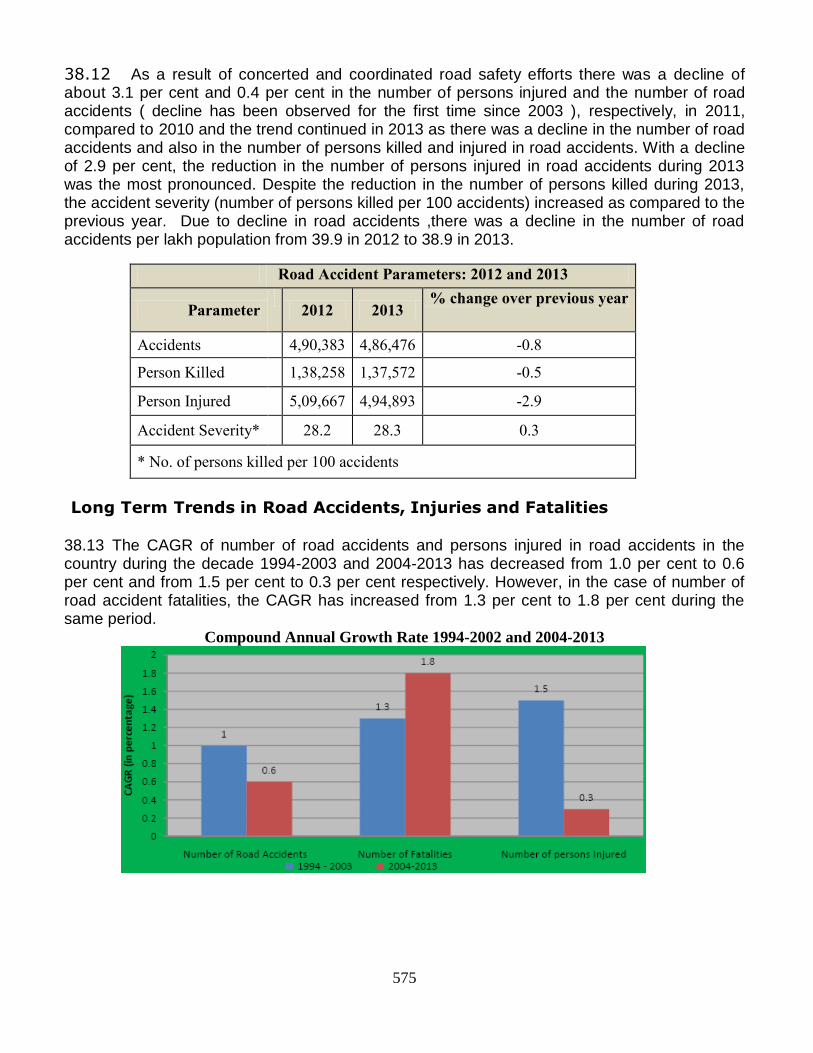
38.12 As a result of concerted and coordinated road safety efforts there was a decline of about 3.1 per cent and 0.4 per cent in the number of persons injured and the number of road accidents ( decline has been observed for the first time since 2003 ), respectively, in 2011, compared to 2010 and the trend continued in 2013 as there was a decline in the number of road accidents and also in the number of persons killed and injured in road accidents. With a decline of 2.9 per cent, the reduction in the number of persons injured in road accidents during 2013 was the most pronounced. Despite the reduction in the number of persons killed during 2013, the accident severity (number of persons killed per 100 accidents) increased as compared to the previous year. Due to decline in road accidents ,there was a decline in the number of road accidents per lakh population from 39.9 in 2012 to 38.9 in 2013.
Road Accident Parameters: 2012 and 2013
Parameter
2012 2013 % change over previous year
Accidents 4,90,383 4,86,476 -0.8
Person Killed 1,38,258 1,37,572 -0.5
Person Injured 5,09,667 4,94,893 -2.9
Accident Severity* 28.2 28.3 0.3
* No. of persons killed per 100 accidents
Long Term Trends in Road Accidents, Injuries and Fatalities
38.13 The CAGR of number of road accidents and persons injured in road accidents in the country during the decade 1994-2003 and 2004-2013 has decreased from 1.0 per cent to 0.6 per cent and from 1.5 per cent to 0.3 per cent respectively. However, in the case of number of road accident fatalities, the CAGR has increased from 1.3 per cent to 1.8 per cent during the same period.
Compound Annual Growth Rate 1994-2002 and 2004-2013
576
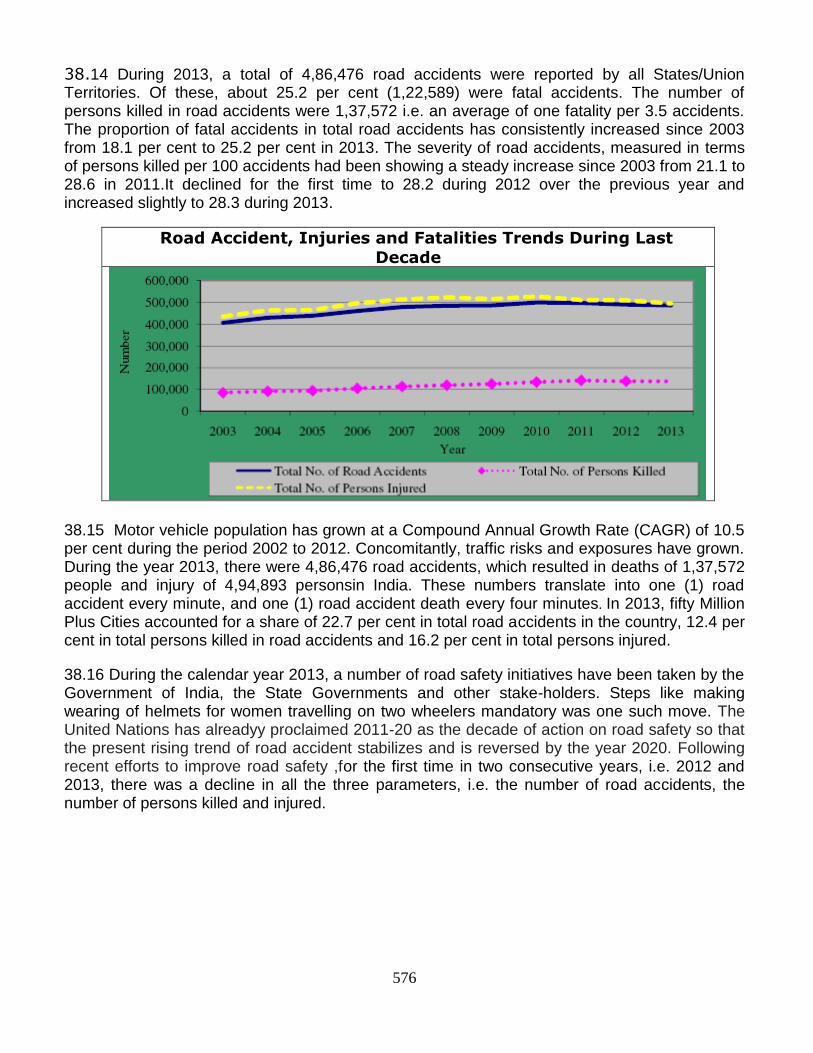
38.14 During 2013, a total of 4,86,476 road accidents were reported by all States/Union Territories. Of these, about 25.2 per cent (1,22,589) were fatal accidents. The number of persons killed in road accidents were 1,37,572 i.e. an average of one fatality per 3.5 accidents. The proportion of fatal accidents in total road accidents has consistently increased since 2003 from 18.1 per cent to 25.2 per cent in 2013. The severity of road accidents, measured in terms of persons killed per 100 accidents had been showing a steady increase since 2003 from 21.1 to 28.6 in 2011.It declined for the first time to 28.2 during 2012 over the previous year and increased slightly to 28.3 during 2013.
Road Accident, Injuries and Fatalities Trends During Last
Decade
38.15 Motor vehicle population has grown at a Compound Annual Growth Rate (CAGR) of 10.5 per cent during the period 2002 to 2012. Concomitantly, traffic risks and exposures have grown. During the year 2013, there were 4,86,476 road accidents, which resulted in deaths of 1,37,572 people and injury of 4,94,893 personsin India. These numbers translate into one (1) road accident every minute, and one (1) road accident death every four minutes. In 2013, fifty Million Plus Cities accounted for a share of 22.7 per cent in total road accidents in the country, 12.4 per cent in total persons killed in road accidents and 16.2 per cent in total persons injured.
38.16 During the calendar year 2013, a number of road safety initiatives have been taken by the Government of India, the State Governments and other stake-holders. Steps like making wearing of helmets for women travelling on two wheelers mandatory was one such move. The United Nations has alreadyy proclaimed 2011-20 as the decade of action on road safety so that the present rising trend of road accident stabilizes and is reversed by the year 2020. Following recent efforts to improve road safety ,for the first time in two consecutive years, i.e. 2012 and 2013, there was a decline in all the three parameters, i.e. the number of road accidents, the number of persons killed and injured.

570
Normalized Indicators of Road Accidents, Injuries & Fatalities: All India Averages
38.17 To get an appropriate measure of incidence of accidents, three normalized/standardized accident rates
normally used in India are conversions of absolute numbers into (a) per lakh persons, (b) per ten thousand motor vehicles and (c) per ten thousand kilometres of road length. These help in neutralizing the effect of
increased motorization. Some of the broad trends at the all-India level are summarized below
(a) Accidents & Deaths per lakh population : Both accidents and deaths per lakh population have
shown significant increase during 1980-2000. Fatality rate continued to increase till 2011 declining thereafter whereas road accidents rate, which has been fluctuating in a narrow range of 39 to 42 since 2000 and has
steadily declined since 2010 , when it was 42.5 to reach 38.9 in 2013.
Road Accidents per Lakh Population Persons Killed per Lakh Population

571
(b) Accidents & Deaths per ten thousand vehicle : Both accidents rate and fatality rate shows identical trend with steep decline during 1970 – 2000 with slow but steady decline thereafter.
Road Accidents per Ten Thousand Vehicles Persons Killed per Ten Thousand Vehicles
(c) Accidents & Deaths per ten thousand Kms of road length : Both accidents & deaths per ten thousand
km road length show sharp rise during 1970-90 , sharp fall thereafter till 2000 with accidents rate showing
very gradual decline (fluctuating , not steady) whereas fatality rate increased gradually with some fluctuations
Road Accidents per Ten Thousand Km of Road Persons Killed per Ten Thousand Km of Road

570
Road Accidents Distribution: 38.18 The States of Tamil Nadu, Maharashtra, Madhya Pradesh, Karnataka, Andhra radesh, Kerala, Uttar Pradesh, Gujarat, Rajasthan, Chhattisgarh, West Bengal, Haryana and Bihar together accounted for 88.4 per cent of all road accidents in the country in the year 2013 and their share has remained stable at 88-89 % since 2010. These states have also accounted for more than 80 % of registered motor vehicles since 2010 and their share in road accident related injuries & fatalities has been in the range of 88-89 % and 85-86% respectively. The highest number of persons killed per lakh of population was accounted for by Tamil Nadu (21.0)whereas the highest and lowest number of persons injured in road accidents per lakh population were in Goa (130.2) and Lakshadweep (3.1) respectively.
38.19 National Highways accounted for a share of 28.1 per cent in total road accidents and 33.2 per cent in total number of persons killed in road accidents during 2013. The State Highways accounted for a share of 25.6 per cent of total accidents and 29.6 per cent in the
total number of persons killed in road accidents during same period of time.Highways
permit greater speed resulting in relatively greater number of road accidents and fatalities. In 2013, the total number of road accidents that occurred in rural areas was more than that in the urban areas; the former accounting for 54.2 per cent (2,63,593) and the latter accounting for 45.8 per cent (2,22,883) of total accidents. Rural areas had more fatalities (61.8 per cent) than urban areas (38.2 per cent). The number of persons injured was also more in rural areas (59.8 per cent) as compared to urban areas (40.2 % cent).
38.20 Motorized vehicles accounted for 94.5 per cent of the total road accidents in the year 2013. Amongst the vehicle categories, two-wheelers accounted for the highest share in total road accidents (26.3 per cent) in 2013; followed by cars, jeeps and taxis (22.2 per cent); trucks, tempos, tractors and other articulated vehicles (21.1 per cent); other motor vehicles (9.9 per cent), buses (8.6 per cent) and auto rickshaws (6.4 per cent). The category of ‘trucks, tempos, tractors and other articulated vehicles’ accounted for the highest proportion of persons killed (27.2 per cent) of the total fatalities in road accidents.
Deaths due to suicide 38.21 International scenario : Over 800,000 people die due to suicide every year and there are many more who attempt suicide. This indicates an annual global age-standardized suicide rate of 11.4 per 100 000 population (15.0 for males and 8.0 for females). Many millions of people are affected or experience suicide bereavement every year. Suicide occurs throughout the lifespan and was the second leading cause of death among 15-29 year olds globally in 2012. Suicide accounted for 1.4% of all deaths worldwide, making it the 15th leading cause of death in 2012.

571
38.22 Age-Sex Distribution : Based on the reported information, WHO reports reveal that share of deaths due to suicide has increased in younger age group i.e
5-44 years from 40 to 55 per cent during 1950 to 2000. This might be expected because of increased population in the younger age group i.e. less than 44 years.
Across most countries the suicide rates are higher for males than for females (except China & few other smaller countries). The global Male:Female ratio of age-standardized suicide rates was 1.9 in 2012
38.23 Distribution of suicide rates across the world : The major differences between high-income countries and low- and middle-income countries (LMICs) are that young adults and elderly women in LMICs have much higher suicide rates than their counterparts in high-income countries, while middle-aged men in high-income countries have much higher suicide rates than middle-aged men in LMICs. Most suicides in the world occur in the South-East Asia Region (39 per cent of those in low- and middle-income countries in South-East Asia alone) with India accounting for the highest estimated number of suicides overall in 2012
572
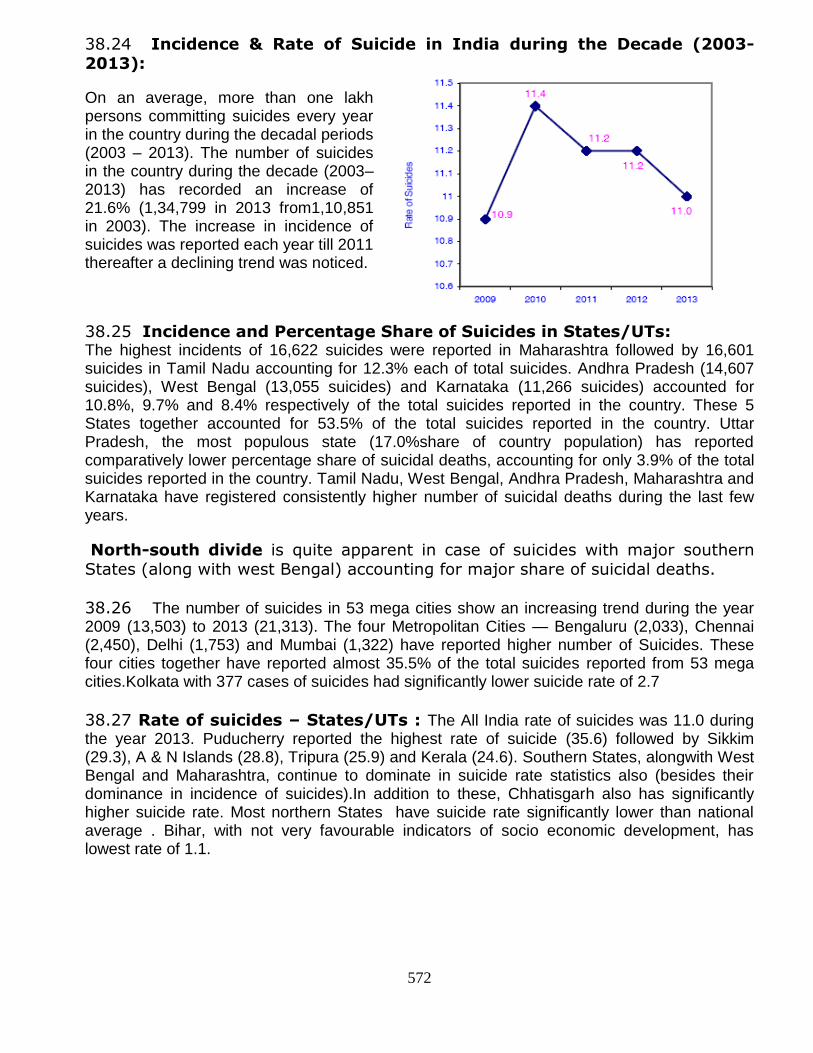
38.24 Incidence & Rate of Suicide in India during the Decade (2003-2013):
On an average, more than one lakh persons committing suicides every year in the country during the decadal periods (2003 – 2013). The number of suicides in the country during the decade (2003–2013) has recorded an increase of 21.6% (1,34,799 in 2013 from1,10,851 in 2003). The increase in incidence of suicides was reported each year till 2011 thereafter a declining trend was noticed.
38.25 Incidence and Percentage Share of Suicides in States/UTs: The highest incidents of 16,622 suicides were reported in Maharashtra followed by 16,601 suicides in Tamil Nadu accounting for 12.3% each of total suicides. Andhra Pradesh (14,607 suicides), West Bengal (13,055 suicides) and Karnataka (11,266 suicides) accounted for 10.8%, 9.7% and 8.4% respectively of the total suicides reported in the country. These 5 States together accounted for 53.5% of the total suicides reported in the country. Uttar Pradesh, the most populous state (17.0%share of country population) has reported comparatively lower percentage share of suicidal deaths, accounting for only 3.9% of the total suicides reported in the country. Tamil Nadu, West Bengal, Andhra Pradesh, Maharashtra and Karnataka have registered consistently higher number of suicidal deaths during the last few years.
North-south divide is quite apparent in case of suicides with major southern States (along with west Bengal) accounting for major share of suicidal deaths.
38.26 The number of suicides in 53 mega cities show an increasing trend during the year 2009 (13,503) to 2013 (21,313). The four Metropolitan Cities — Bengaluru (2,033), Chennai (2,450), Delhi (1,753) and Mumbai (1,322) have reported higher number of Suicides. These four cities together have reported almost 35.5% of the total suicides reported from 53 mega cities.Kolkata with 377 cases of suicides had significantly lower suicide rate of 2.7
38.27 Rate of suicides – States/UTs : The All India rate of suicides was 11.0 during the year 2013. Puducherry reported the highest rate of suicide (35.6) followed by Sikkim (29.3), A & N Islands (28.8), Tripura (25.9) and Kerala (24.6). Southern States, alongwith West Bengal and Maharashtra, continue to dominate in suicide rate statistics also (besides their dominance in incidence of suicides).In addition to these, Chhatisgarh also has significantly higher suicide rate. Most northern States have suicide rate significantly lower than national average . Bihar, with not very favourable indicators of socio economic development, has lowest rate of 1.1.

573
Incidence of Suicide 2013

574
38.28 Composition of suicide victims : ‘Family Problems’ and ‘Illness’, accounting for 24.0% and 19.6% respectively, were the major causes of suicides among the specified causes. ‘Drug Abuse/Addiction’ (3.4%), ‘Love Affairs’ (3.3%), ‘Bankruptcy or Sudden change in economic Status’ (2.0%), 'Failure in Examination’ (1.8%), ‘Dowry Dispute’ (1.7%) and ‘Unemployment’ (1.6%) were the other causes of suicides. Suicides due to ‘Illegitimate Pregnancy (64.5%), ‘Fall in Social Reputation’ (49.4%), ‘Professional/Career Problem’ (40.8%), ‘Divorce’ (35.7%), and ‘Cancellation/Non-Settlement of Marriage’ (33.5%) have increased in 2013 over 2012, while for poverty and property dispute have declined as compared to previous year. Suicide due to Drug Abuse/Addition and Ideological Causes/Hero Worshipping has shown an increasing trend while in property Dispute has shown a decreasing trend during last 3 years.
38.29 The overall male: female ratio of suicide victims for the year 2013 was 67.2:32.8, showing a marginal increase of male and marginal decrease of female ratio as compared to year 2012 (66.2:33.8). The proportion of Boys: Girls suicide victims (upto 14 years of age) were 53.5:46.5 in 2013 as compared to 48.4:51.6 in 2012. The proportion of female victims was comparatively more under the heads ‘Dowry Dispute’ (97.1%), 'Barrenness / Impotency (Not having children)‘ (64.8%), and Divorce (55.6%). It is observed that social and economic causes have led most of the males to commit suicide whereas emotional and personal causes have mainly driven females to end their lives. Youths (15-29 years) and lower middle-aged people (30-44 years) were the prime groups taking recourse to the path of suicides. Around 34.4% suicide victims were youths in the age group of 15-29 years and 33.8% were middle aged persons in the age group 30-44 years.
38.30 Data Source : Some information on suicides in various countries across the world is maintained by World Health Organisation. In case of India,
National Crime Record Bureau (NCRB) has been collecting data on accidents for the annual publication 'Accidental Deaths and Suicides in India'. This
publication collects data on accidental deaths due to natural causes such as Cyclone, Earthquakes, Flood, Landslide, Torrential rain etc. as well as due to un-
natural causes such as Explosion, Drowning, Fire, Traffic accidents etc..
38.31 Data on Accident is collected as a by product of FIR received by Police Stations on Accidents. The regularity, quality and completeness in the collection of
these statistics is interwoven with the working of the Police. The data for the report is collected by State Crime Records Bureaux (SCRBx) from District Crime
575
Records Bureaux (DCRBx). Then SCRBx send the data to NCRB. Data from mega-cities (cities having population of 10 lakhs or more as per the latest census 2001)
is also collected separately. Presently data on accidents are being collected from 35 States/UTs & mega-cities.
Data Flow POLICE STATION → DCRB → SCRB → NCRB
38.32 Detailed information on road accidents is available in the publication Road
Accidents in India 2011, Transport Research Wing, M/o Road Transport & Highways.
References:
Road Accidents in India 2013, Transport Research Wing, M/o Road Transport & Highways.
Accidental Deaths and Suicides in India 2013, National Crime Records
Bureau, Ministry of Home Affairs. Website of World Health Organization (WHO).