chapter 4 aggregate demand and aggregate supply. macro issues: © how do we measure a nation’s...
Post on 22-Dec-2015
216 views
TRANSCRIPT

Chapter 4Chapter 4Chapter 4Chapter 4
Aggregate Demand and Aggregate Demand and Aggregate SupplyAggregate Supply

Macro Issues:
How do we measure a nation’s performance?
By the value of aggregate output produced by the economy in a given year or by its GDP.
Formal Definition of GDP:Formal Definition of GDP:
GDP stands for Gross Domestic Product. It represents the total value, measured in current prices, of all finalfinal goods and services, produced in the economy during a during a given yeargiven year.

Macro Issues:
How do we measure a nation’s performance?
Why do nations grow (Economic Growth)?
Why is there unemployment?
Why is there inflation?
Why does the economy perform well in some years and does very bad in others?

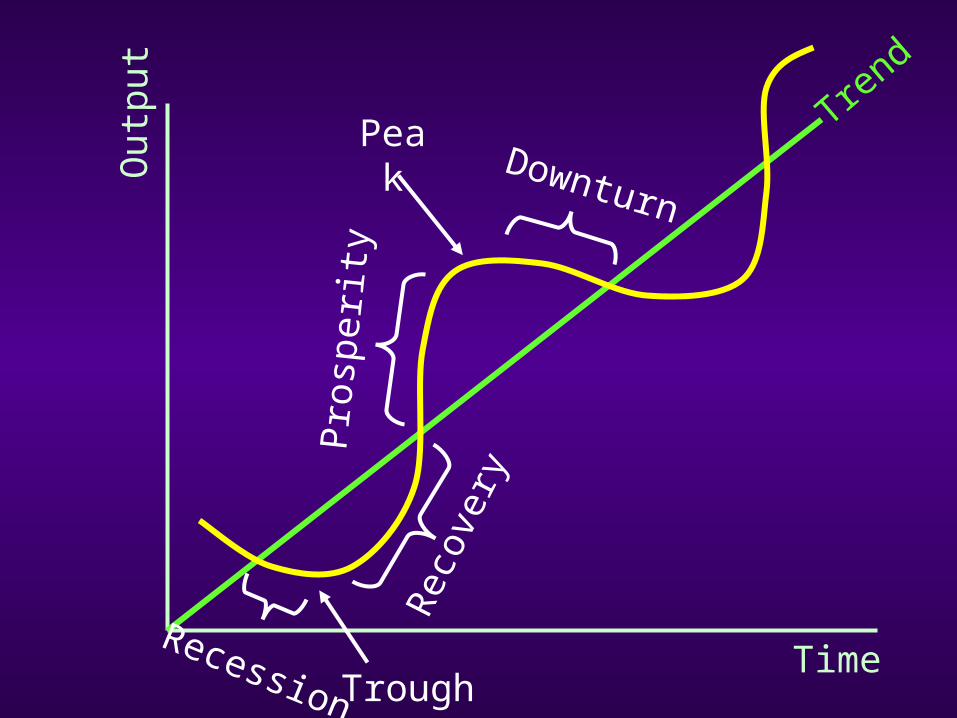
What is the Business Cycle?What is the Business Cycle?What is the Business Cycle?What is the Business Cycle?
Alternating periods of growth and decline in an economy’s outputoutput.

Stages of the Business Cycle?Stages of the Business Cycle?Stages of the Business Cycle?Stages of the Business Cycle?
RecessionRecession TroughTrough RecoveryRecovery ProsperityProsperity Peak or BoomPeak or Boom DownturnDownturn
Recession Trough
Rec
over
y
Pro
sper
ity
Peak Downturn
Trend
Time
Out
put

Recession:Recession:
A phase in the business cycle in which the decline in the economy’s GDP persists for at least a half-year. A recession is marked by relatively high unemployment.
Depression:Depression:
A relatively long and deep recession is A relatively long and deep recession is described as a depression.described as a depression.
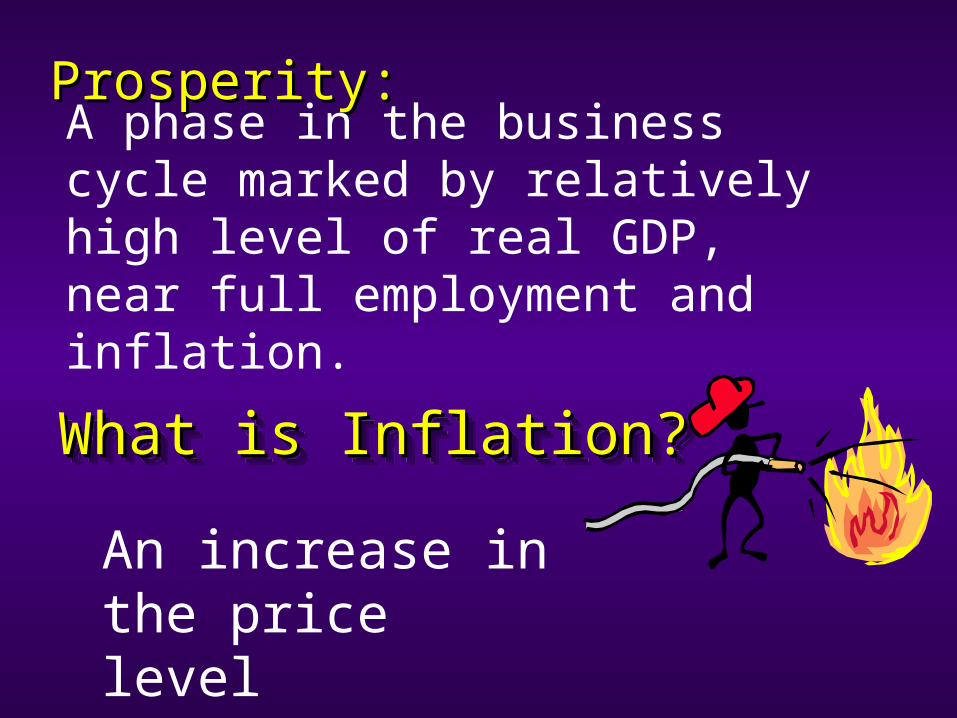
Prosperity:Prosperity:
A phase in the business cycle marked by relatively high level of real GDP, near full employment and inflation.
What is Inflation?What is Inflation?What is Inflation?What is Inflation?
An increase in the price level

Basic Macro Questions:Basic Macro Questions: Can we harness the disturbing swings in our Can we harness the disturbing swings in our business cycle?business cycle?
This implies, can we moderate the inflationary pressures on the economy when it is on the upswing of the buseiness cycle, pressing upon full employment? Can we moderate the inevitable unemployment that occurs when the economy after reaching its peak, begins its slide into recession?
Can we learn how to engineer an attractive rate Can we learn how to engineer an attractive rate of economic growth?of economic growth?

GDP or Gross Domestic Product is the total value, measured in current prices, of all finalfinal goods and services, produced in the economy, during a given yearduring a given year.
GDP:GDP:

What is a Final Good?What is a Final Good?What is a Final Good?What is a Final Good?
A good that is not itself used to produce other goods.
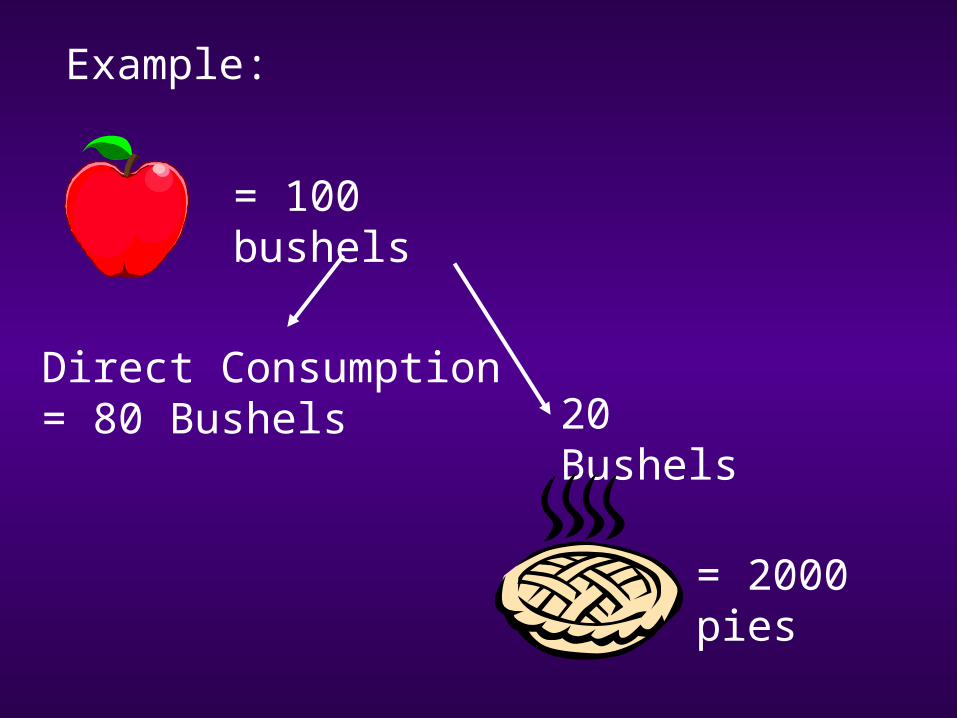
Example:
= 100 bushels
Direct Consumption = 80 Bushels 20 Bushels
= 2000 pies
What does “produced in the What does “produced in the economy” mean?economy” mean?What does “produced in the What does “produced in the economy” mean?economy” mean?
It is produced domestically or within the geographic boundary of the country.
What does “measured in What does “measured in current market prices” mean? current market prices” mean? What does “measured in What does “measured in current market prices” mean? current market prices” mean?
valued at a price that existed in the year in which the good was made.

What is Nominal GDP?What is Nominal GDP?What is Nominal GDP?What is Nominal GDP?
GDP measured in terms of current market prices - it is not adjusted for inflation
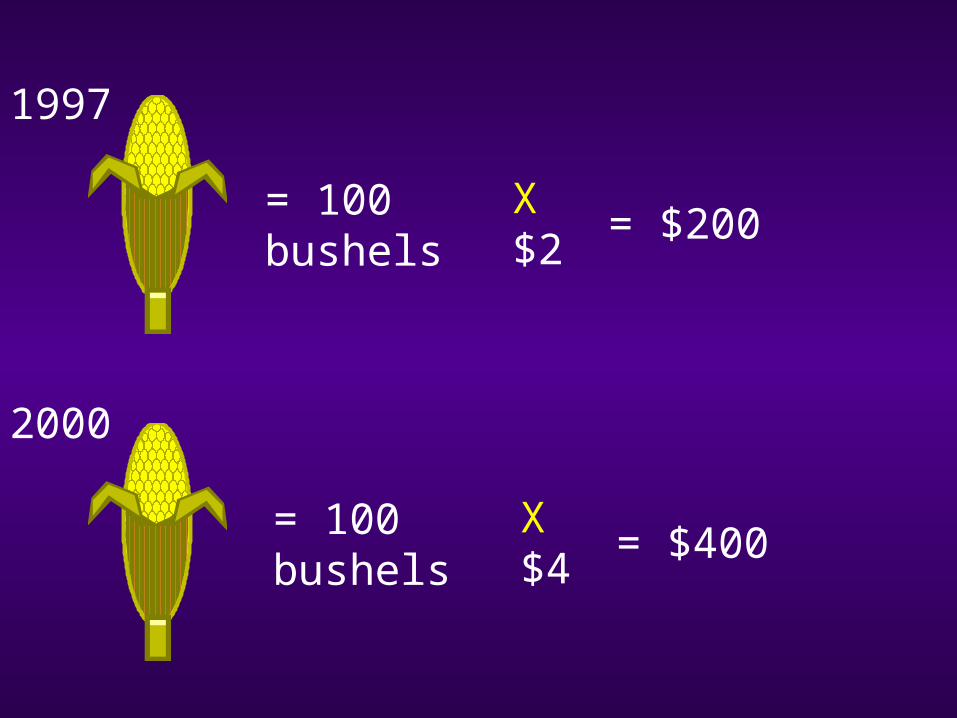
= 100 bushels X $2 = $200
= 100 bushels X $4 = $400
1997
2000

What is Real GDP?What is Real GDP?What is Real GDP?What is Real GDP?
GDP adjusted for changes in the price level
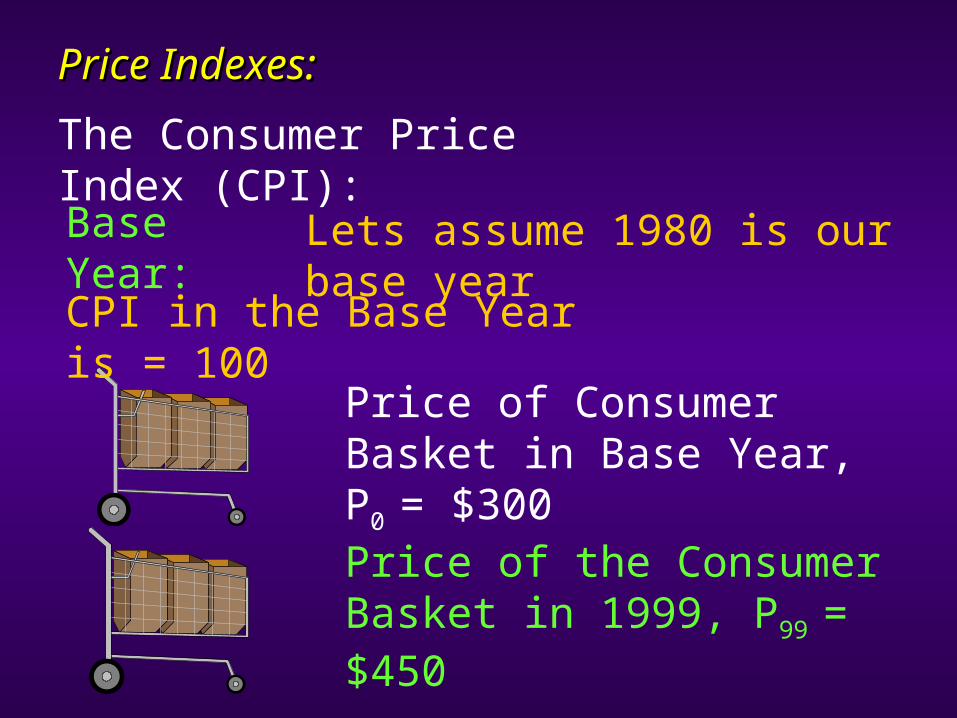
Price Indexes:Price Indexes:
The Consumer Price Index (CPI):
Base Year: Lets assume 1980 is our base year
Price of Consumer Basket in Base Year, P0 = $300
CPI in the Base Year is = 100
Price of the Consumer Basket in 1999, P99 = $450

CPI for 1999 = 10080
99 P
P 100300
450150
Suppose the Nominal GDP in 1999 was 800 billion $. What is the real GDP in 1980 prices?
100CPI
GDP Nominal GDP Real 100
150
800533.33 billion $

GDP Deflator:GDP Deflator:Like the CPI it is also a price index. However the composition of the items in the consumption basket is different.
Instead of only including consumption items, the basket now also includes farm goods, producer goods, crude materials, services, capital equipment and export goods. The basket here is known as Market Basket.
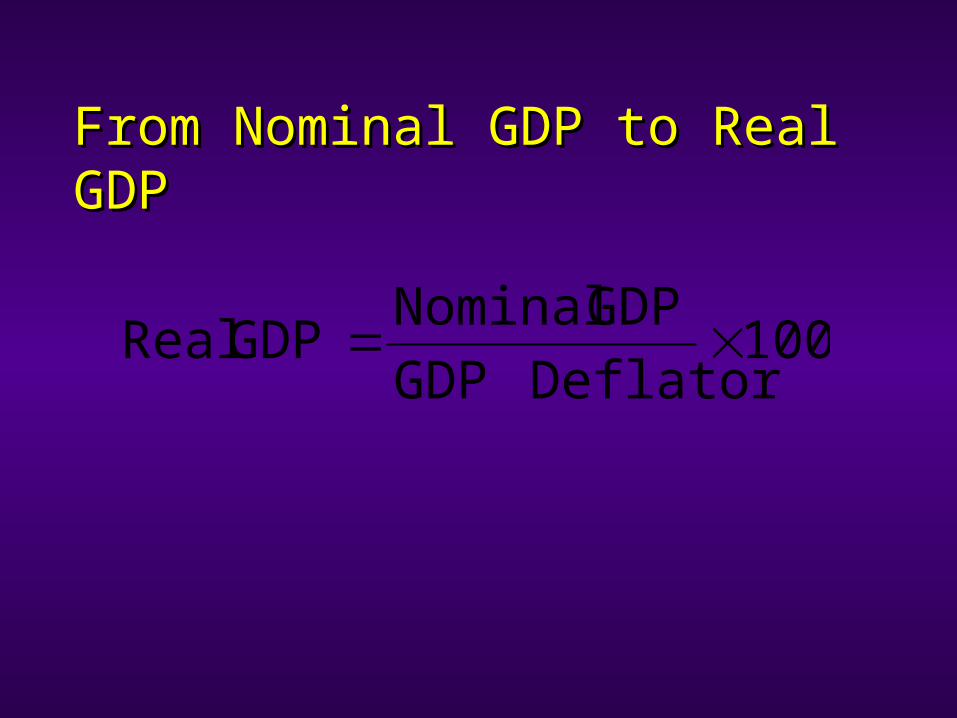
From Nominal GDP to Real GDPFrom Nominal GDP to Real GDP
100 DeflatorGDP
GDP Nominal GDP Real

Converting Nominal GDP to Real GDPConverting Nominal GDP to Real GDP
Year NominalGDP
GDPDeflator
1990 5743.6 93.60
1991 5916.5 97.32
1992 6244.4 100.00
1993 6558.3 102.64
1994 6947.7 105.09
1995 7265.3 107.76
1996 7635.8 110.21
Base Year 1992
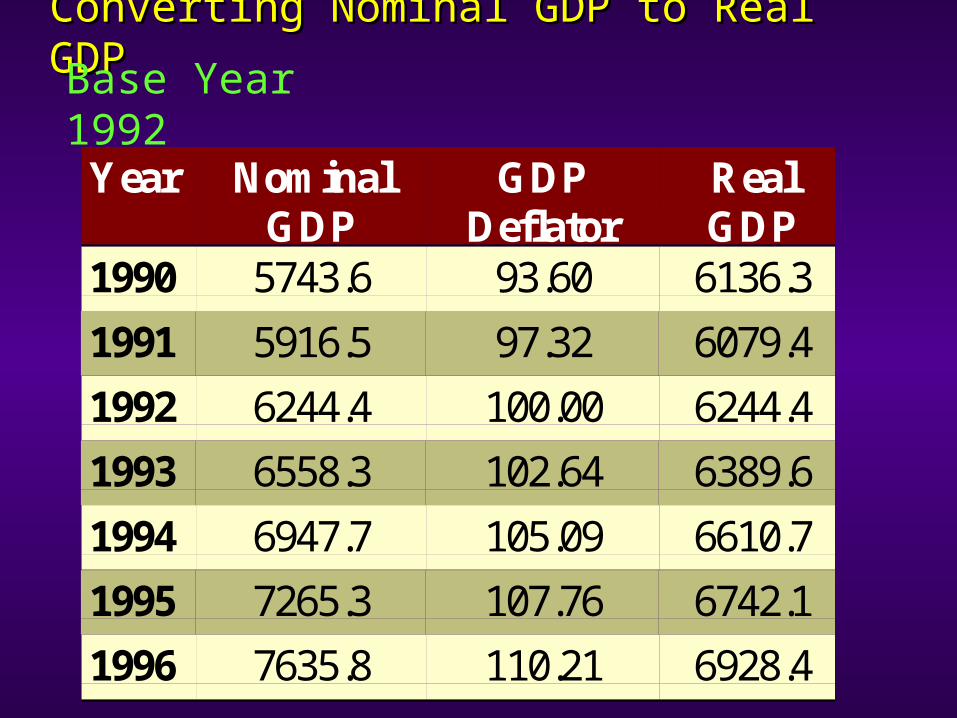
Converting Nominal GDP to Real GDPConverting Nominal GDP to Real GDP
Year NominalGDP
GDPDeflator
RealGDP
1990 5743.6 93.60 6136.3
1991 5916.5 97.32 6079.4
1992 6244.4 100.00 6244.4
1993 6558.3 102.64 6389.6
1994 6947.7 105.09 6610.7
1995 7265.3 107.76 6742.1
1996 7635.8 110.21 6928.4
Base Year 1992

GDP Growth Rate:GDP Growth Rate:
It is the percentage change in GDP
GDP Growth Rate 100GDP
GDP
03.51006244.4
9.313
Real GDP Growth Rate 33.21006244.4
2.145
Year NominalGDP
GDPDeflator
RealGDP
1990 5743.6 93.60 6136.3
1991 5916.5 97.32 6079.4
1992 6244.4 100.00 6244.4
1993 6558.3 102.64 6389.6
1994 6947.7 105.09 6610.7
1995 7265.3 107.76 6742.1
1996 7635.8 110.21 6928.4

Aggregate Demand and Supply ModelAggregate Demand and Supply Model
Aggregate Supply:Aggregate Supply: It is the total It is the total quantity of goods and services that quantity of goods and services that firms in the economy are willing to firms in the economy are willing to supply at varying price levels.supply at varying price levels.
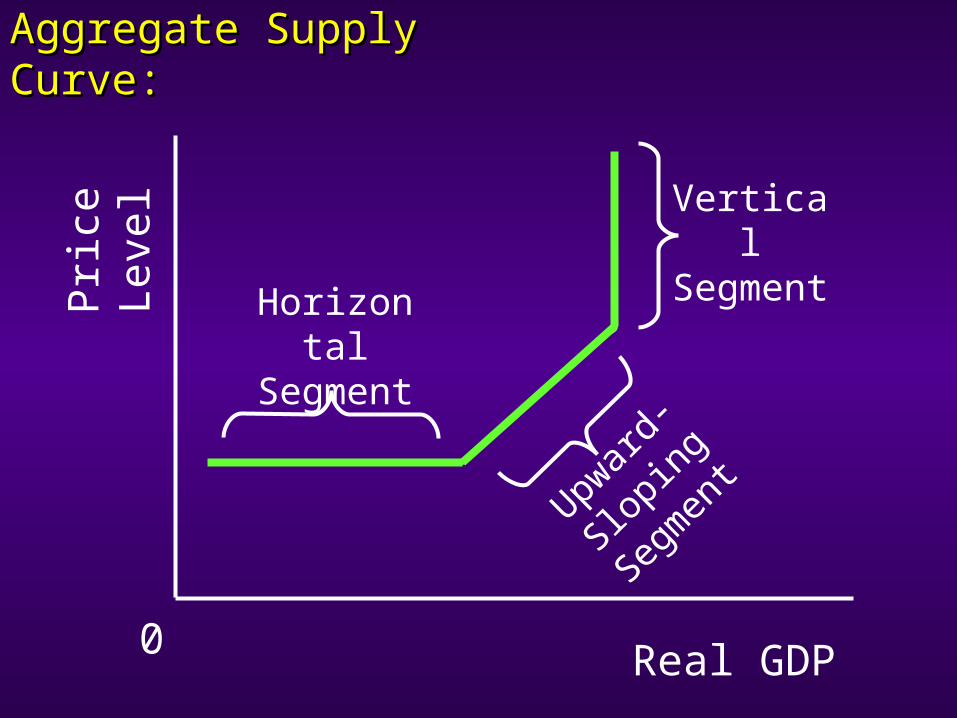
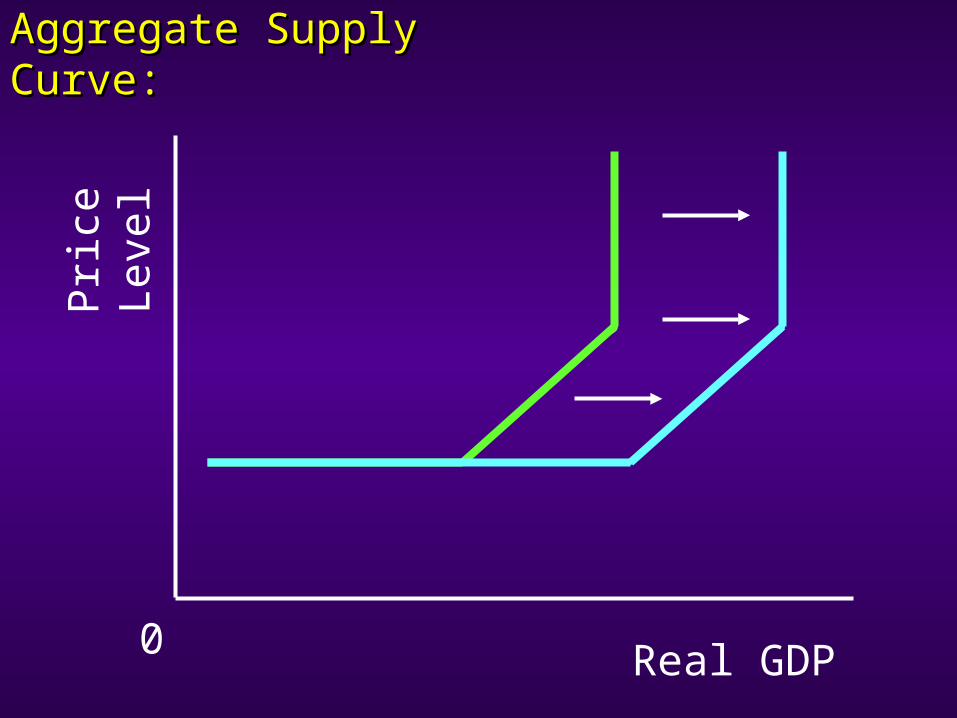
Aggregate Supply Curve:Aggregate Supply Curve:
Real GDP
Pri
ce
Lev
el
0
Horizontal Segment
Upward
-Slop
ing
Segmen
t
Vertical Segment

Aggregate DemandAggregate Demand
It is the total quantity of It is the total quantity of goods and services demanded goods and services demanded by households, firms, foreigners by households, firms, foreigners and government at varying price and government at varying price levels.levels.
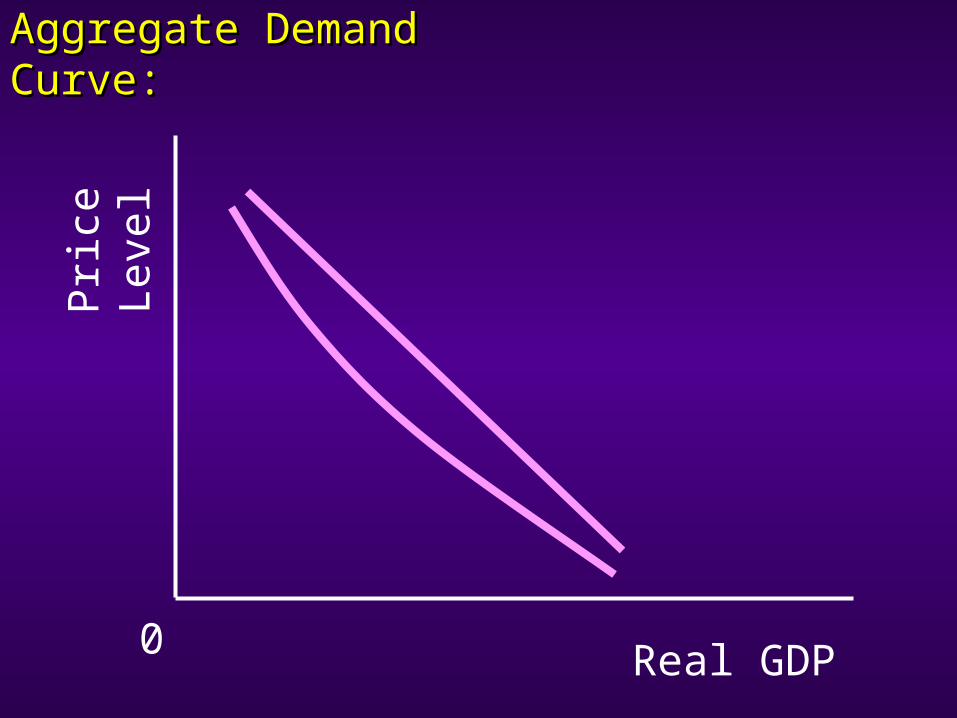
Aggregate Demand Curve:Aggregate Demand Curve:
Real GDP
Pri
ce
Lev
el
0
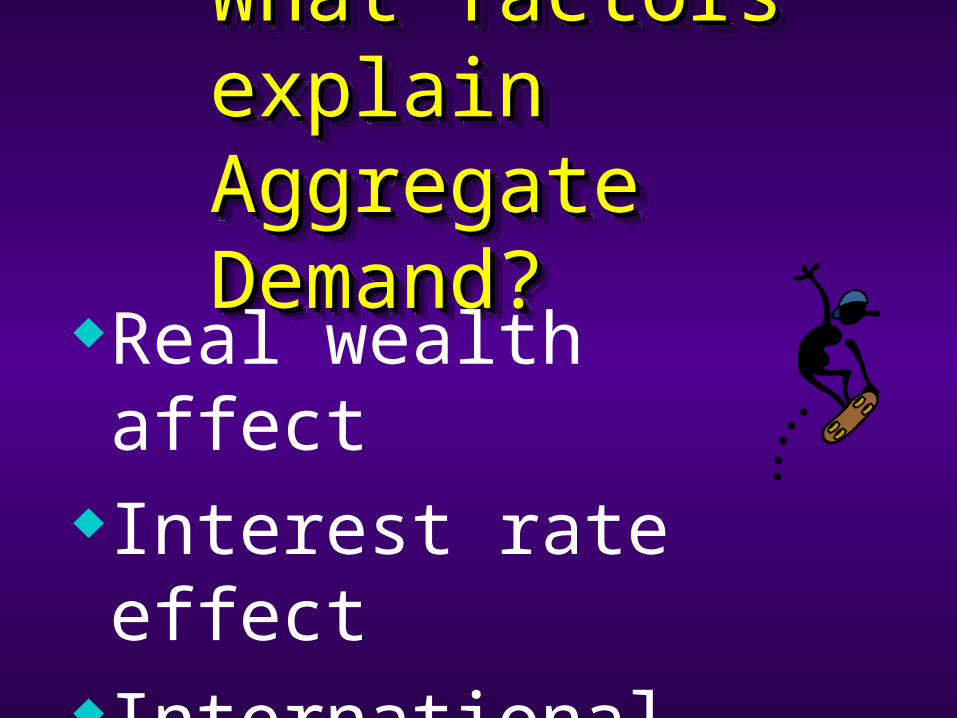
What factors explain What factors explain Aggregate Demand?Aggregate Demand?What factors explain What factors explain Aggregate Demand?Aggregate Demand?
Real wealth affectInterest rate effectInternational trade effect

What factors cause a shift What factors cause a shift in Aggregate Demand? A in Aggregate Demand? A change in ... change in ...
What factors cause a shift What factors cause a shift in Aggregate Demand? A in Aggregate Demand? A change in ... change in ...
government spendingtaxesincome abroadexpectations

Aggregate Demand Curve:Aggregate Demand Curve:
Real GDP
Pri
ce
Lev
el
0

What factors cause a shift What factors cause a shift in Aggregate Supply? A in Aggregate Supply? A change in ...change in ...
What factors cause a shift What factors cause a shift in Aggregate Supply? A in Aggregate Supply? A change in ...change in ...
resource availabilitywagesinterest ratesrents
Aggregate Supply Curve:Aggregate Supply Curve:
Real GDP
Pri
ce
Lev
el
0

Macroeconomic Equilibrium:Macroeconomic Equilibrium:
Real GDP
Pri
ce
Lev
el
0
AS
110
7.14.5
Excess Supply

Macroeconomic Equilibrium:Macroeconomic Equilibrium:
Real GDP
Pri
ce
Lev
el
0
AS
90
7.14.6 Excess Demand
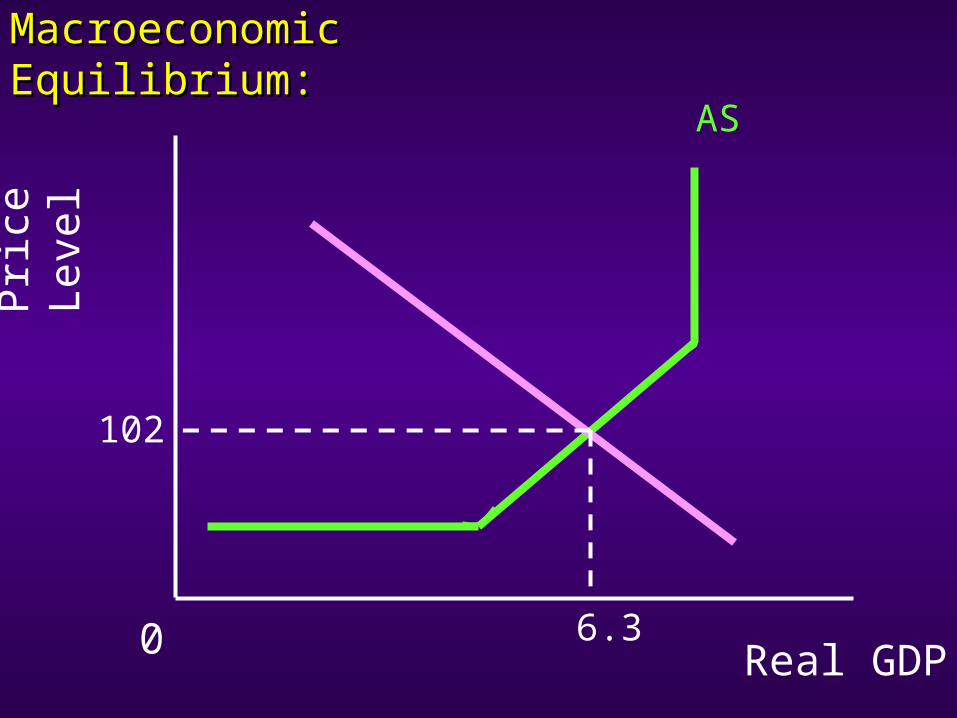
Macroeconomic Equilibrium:Macroeconomic Equilibrium:
Real GDP
Pri
ce
Lev
el
0
AS
6.3
102

The Depression of the 30s:The Depression of the 30s:
Real GDP
Pri
ce
Lev
el
0
AS
a
b
c
d
AS'

The Vietnam War:The Vietnam War:
Real GDP
Pri
ce
Lev
el
0
AS
a
b

Demand-Pull InflationDemand-Pull Inflation
Inflation caused primarily by an increase in aggregate demand

Cost-Push Inflation: The OPEC LegacyCost-Push Inflation: The OPEC Legacy
In October 1973, the price of Arabian light crude oil was $2.10 per barrel. By Nov 74, OPEC had cut oil production substantially and raised the price to $10.46. By Jan 79, the price had drifted upward to $13.34 and by April 1980, OPEC had raised the price to $28 and by Jan 1982 to $34.

The OPEC Influence:The OPEC Influence:
Real GDP
Pri
ce
Lev
el
0
AS
a
b
AS'
Stagflation:Stagflation:A period of stagnating real GDP, inflation and relatively high levels of unemployment.
Cost-push Inflation:Cost-push Inflation:Inflation caused primarily by a rise in the cost of resources which leads to a decrease in aggregate supply.

Economic Policy Options:Economic Policy Options:
Real GDP
Pri
ce
Lev
el
0
AS
AD
AD"
AD'