chapter 4: community facilities and services a. introduction
TRANSCRIPT
4-1
Chapter 4: Community Facilities and Services
A. INTRODUCTION This chapter examines the potential effects of the proposed actions on community facilities in the vicinity of the project site, which is located on the Lower East Side of Manhattan. The City Environmental Quality Review (CEQR) Technical Manual (January 2012 edition) defines community facilities as public or publicly funded facilities, including schools, health care, day care, libraries, and fire and police protection services. CEQR methodology focuses on direct impacts on community facilities and services and on increased demand for community facilities and services generated by new users such as the population that would occupy the proposed development.
PRINCIPAL CONCLUSIONS
Based on a preliminary screening, the proposed actions warrant analysis for direct effects to health care facilities and indirect effects to public elementary and intermediate schools and child care centers. The analysis finds that the proposed actions would not result in any significant adverse impacts on community facilities.
DIRECT EFFECTS ON HEALTH CARE SERVICES
The proposed actions would result in the relocation of the Downtown Health Center, a clinic at 150 Essex Street (on Site 10) that is run by the Community Healthcare Network (CHN). The lease between the New York City Economic Development Corporation (NYCEDC) and the CHN allows for the facility to be relocated to another location in the immediate area. NYCEDC, no earlier than January 1, 2015, is required to provide no less than twelve months notice of relocation to CHN. Because CHN would be relocated in the immediate area, it is expected that it would be able to serve the same population and the extent of service disruption would be minimal. Therefore, the relocation of the Downtown Health Center would not be considered a significant adverse impact.
INDIRECT EFFECTS ON PUBLIC SCHOOLS
The analysis of indirect effects on public schools concludes that the proposed actions would not result in any significant adverse impacts on public elementary or intermediate schools.
The proposed project site is located within Sub-districts 1 and 2 of Community School District (CSD) 1 and Sub-district 1 of CSD 2. The proposed actions would result in the development of 900 residential units in the study area. Based on CEQR student generation rates, the proposed actions would generate approximately 108 elementary school students and 36 intermediate school students in the study area by 2022.
Although elementary schools within the three sub-districts analyzed would operate with a shortage of seats in 2022, the proposed actions would introduce a small number of students
Seward Park Mixed-Use Development Project
4-2
relative to the overall enrollment of the study area. As a result, they would not substantially increase the elementary school utilization rate. The largest increase in utilization over the No Action condition would be in Sub-district 1 of CSD 2, where the proposed actions would increase the utilization rate by approximately two percent, which is below the CEQR threshold of five percent or more for a significant adverse impact. Because the proposed actions would increase the elementary school utilization rate by less than five percentage points, the proposed actions would not result in a significant adverse impact on elementary schools in any of the sub-districts analyzed. Therefore, the proposed actions would not result in a significant adverse impact on elementary schools.
With regard to intermediate schools, the increase in the utilization rate in all three sub-districts analyzed (Sub-districts 1 and 2 of CSD 1 and Sub-district 1 of CSD 2) would be less than five percentage points in 2022. Therefore, the proposed actions would not result in any significant adverse impacts on intermediate schools.
INDIRECT EFFECTS ON CHILD CARE FACILITIES
As discussed below, the proposed actions would not result in any significant adverse impacts on publicly funded child care facilities. The proposed actions would introduce 450 low- to middle-income units by 2022. Based on the most recent CEQR child care multipliers, this development would generate approximately 52 children under the age of six who would be eligible for publicly funded child care programs. With the addition of these children, there would be a deficit of slots in the study area by 2022, and the proposed actions would result in an increase in the utilization rate of three percent over the No Action condition. While child care facilities in the study area would operate above capacity, the increase due to the proposed actions would be less than five percentage points and below the CEQR threshold. Therefore, the proposed actions would not result in a significant adverse impact on child care facilities.
B. PRELIMINARY SCREENING This analysis of community facilities has been conducted in accordance with CEQR Technical Manual guidelines and the latest data and guidance from agencies such as the New York Department of Education (DOE) and the New York City Department of City Planning (DCP).
The purpose of the preliminary screening is to determine whether a community facilities assessment is required. As recommended by the CEQR Technical Manual, a community facilities assessment is warranted if a project has the potential to result in either direct or indirect effects on community facilities. If a project would physically alter a community facility, whether by displacement of the facility or other physical change, this “direct” effect triggers the need to assess the service delivery of the facility and the potential effect that the physical change may have on that service delivery. New population added to an area as a result of a project would use existing services, which may result in potential “indirect” effects on service delivery. Depending on the size, income characteristics, and age distribution of the new population, there may be effects on public schools, libraries, or child care centers.
DIRECT EFFECTS
The proposed development on Site 10 (Block 354, Lot 12) would require the relocation of the Downtown Health Center located at 150 Essex Street that is run by CHN.

Chapter 4: Community Facilities and Services
4-3
The proposed actions would not physically alter or directly displace any other community facility, and therefore the assessment of direct effects in this chapter is limited to the health care uses on Site 10.
INDIRECT EFFECTS
The CEQR Technical Manual provides thresholds that provide guidance in making an initial determination of whether a detailed analysis is necessary to determine potential impacts. Table 4-1 lists those CEQR Technical Manual thresholds for each community facility analysis. If a proposal exceeds the threshold for a specific facility, a more detailed analysis is warranted. A preliminary screening analysis was conducted to determine if the proposed actions would exceed established CEQR Technical Manual thresholds warranting further analysis. Based on that screening, a detailed analysis is provided for public elementary and intermediate schools.
Table 4-1 Preliminary Screening Analysis Criteria
Community Facility Threshold For Detailed Analysis Public schools More than 50 elementary/middle school or 150 high school students
Libraries Greater than 5 percent increase in ratio of residential units to libraries in borough
Health care facilities (outpatient) Introduction of sizeable new neighborhood where none existed before1
Child care centers (publicly funded) More than 20 eligible children based on number of low- and low/moderate-income units by borough
Fire protection Introduction of sizeable new neighborhood where none existed before1 Police protection Introduction of sizeable new neighborhood where none existed before1 Notes: 1 The CEQR Technical Manual cites the Hunter’s Point South project as an example of a project that would introduce a sizeable new neighborhood where none existed before. The Hunter’s Point South project would introduce approximately 6,650 new residential units to the Hunter’s Point South waterfront in Long Island City, Queens. Source: CEQR Technical Manual (January 2012 edition).
PUBLIC SCHOOLS
The CEQR Technical Manual recommends conducting a detailed analysis of public schools if a proposed action would generate more than 50 elementary/intermediate school students and/or more than 150 high school students. Based on 900 residential units and the CEQR student generation rates (0.12 elementary, 0.04 middle, and 0.06 high school students per housing unit in Manhattan), the proposed actions would generate approximately 200 total students—with approximately 108 elementary school students, 36 intermediate school students, and 54 high school students. This number of students warrants a detailed analysis of the proposed actions’ effects on elementary and intermediate schools. Because the proposed actions would not introduce more than 150 high school students, a detailed analysis of public high schools is not warranted.
LIBRARIES
Potential impacts on libraries can result from an increased user population. According to the CEQR Technical Manual, a proposed action in Manhattan that generates a 5 percent increase in the average number of residential units served per branch (901 residential units in Manhattan) may cause significant impacts on library services and require further analysis. With 900 units,
Seward Park Mixed-Use Development Project
4-4
the proposed actions do not exceed this threshold, and a detailed analysis of libraries is not warranted.
CHILD CARE CENTERS
According to the CEQR Technical Manual, if a proposed action would add more than 20 children eligible for child care to the study area’s child care facilities, a detailed analysis of its impact on publicly funded child care facilities is warranted. This threshold is based on the number of low-income and low/moderate-income units within a proposed project site.1 In Manhattan, projects introducing 170 or more low- to moderate-income units would introduce 20 or more children eligible for child care services. Because the proposed actions would introduce 450 affordable housing units, a detailed child care analysis is warranted.
HEALTH CARE FACILITIES
Health care facilities include public, proprietary, and nonprofit facilities that accept government funds (usually in the form of Medicare and Medicaid reimbursements) and that are available to any member of the community. Examples of these types of facilities include hospitals, nursing homes, clinics, and other facilities providing outpatient health services.
According to the CEQR Technical Manual, if a proposed action would create a sizeable new neighborhood where none existed before, there may be increased demand on local public health care facilities, which may warrant further analysis of the potential for indirect impacts on outpatient health care facilities. The proposed actions would not result in the creation of a sizeable new neighborhood where none existed before, as the proposed actions are located in the densely populated Lower East Side neighborhood of Manhattan. Therefore a detailed analysis of indirect effects on health care facilities is not warranted.
The potential for direct effects on the health care facility on Site 10 is discussed below.
POLICE AND FIRE SERVICES
The CEQR Technical Manual recommends detailed analyses of impacts on police and fire service in cases where a proposed action would affect the physical operations of, or direct access to and from, a precinct house or fire station, or where a proposed action would create a sizeable new neighborhood where none existed before. The proposed actions would not result in these direct effects on either police or fire services, nor would it create a sizeable new neighborhood where none existed before; therefore, no further analysis is warranted.
C. DIRECT EFFECTS ON HEALTH CARE SERVICES As noted above, Site 10 currently contains the Downtown Health Center, a clinic at 150 Essex Street that is run by the Community Healthcare Network. The Community Healthcare Network is a group of 10 non-profit medical centers that provide healthcare services in Manhattan, the Bronx, Queens, and Brooklyn. The Downtown Health Center, which has been in operation since
1 Low-income and low/moderate-income are the affordability levels used in the CEQR Technical Manual.
They are intended to approximate the financial eligibility criteria established by the Administration for Children’s Services, which generally corresponds to 200 percent Federal Poverty Level or 80% of area median income.
Chapter 4: Community Facilities and Services
4-5
1971 and operating at 150 Essex Street since 2007, provides a range of services, including: prenatal and post-partum care; pediatrics; adolescent and adult medicine; geriatric care; preventive medicine; family planning; immunizations; school physicals; HIV education, testing, and treatment; nutrition counseling; pediatric weight management; reproductive health care; social services; health education; and a mobile mammogram program.1
Under the proposed actions, Site 10 would be redeveloped by 2022, and the Downtown Health Center would be relocated. The lease between NYCEDC and CHN allows for the facility to be relocated to another location in the immediate area. NYCEDC, no earlier than January 1, 2015, is required to provide no less than twelve months’ notice of relocation to CHN. Because CHN would be relocated in the immediate area, it is expected that it would be able to serve the same population and the extent of service disruption would be minimal. Therefore, the relocation of Downtown Health Center would not be considered a significant adverse impact.
D. INDIRECT EFFECTS ON PUBLIC ELEMENTARY AND INTERMEDIATE SCHOOLS
METHODOLOGY
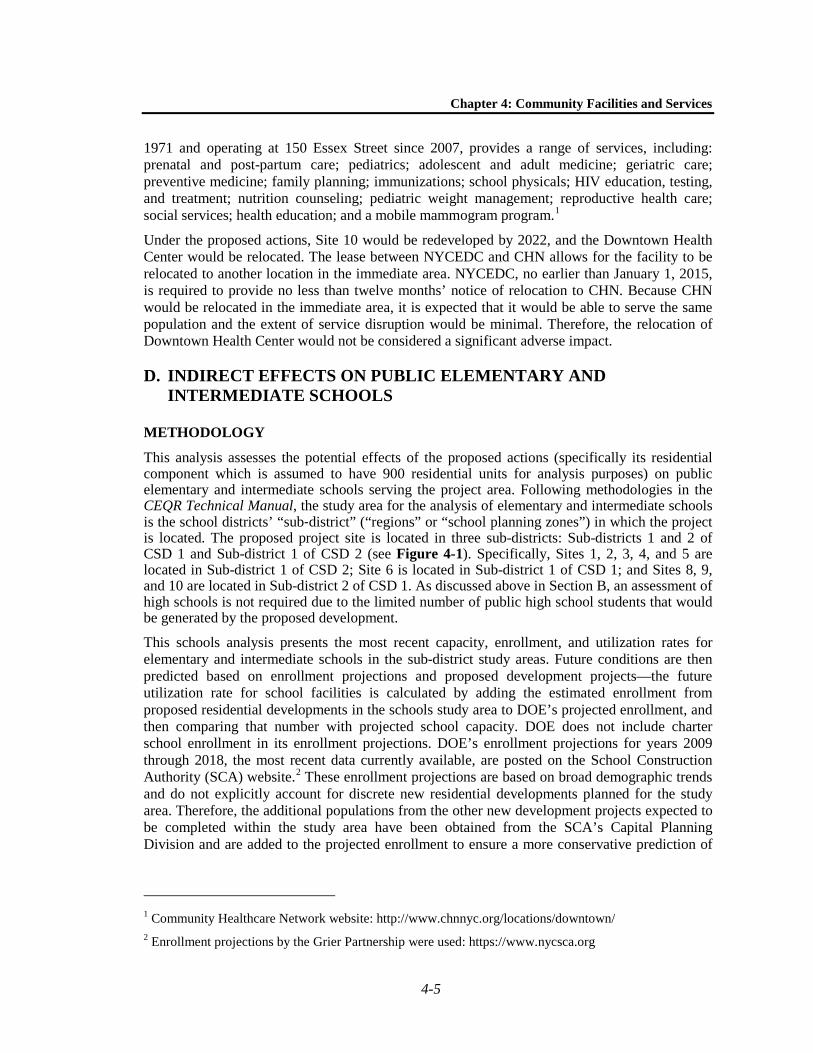
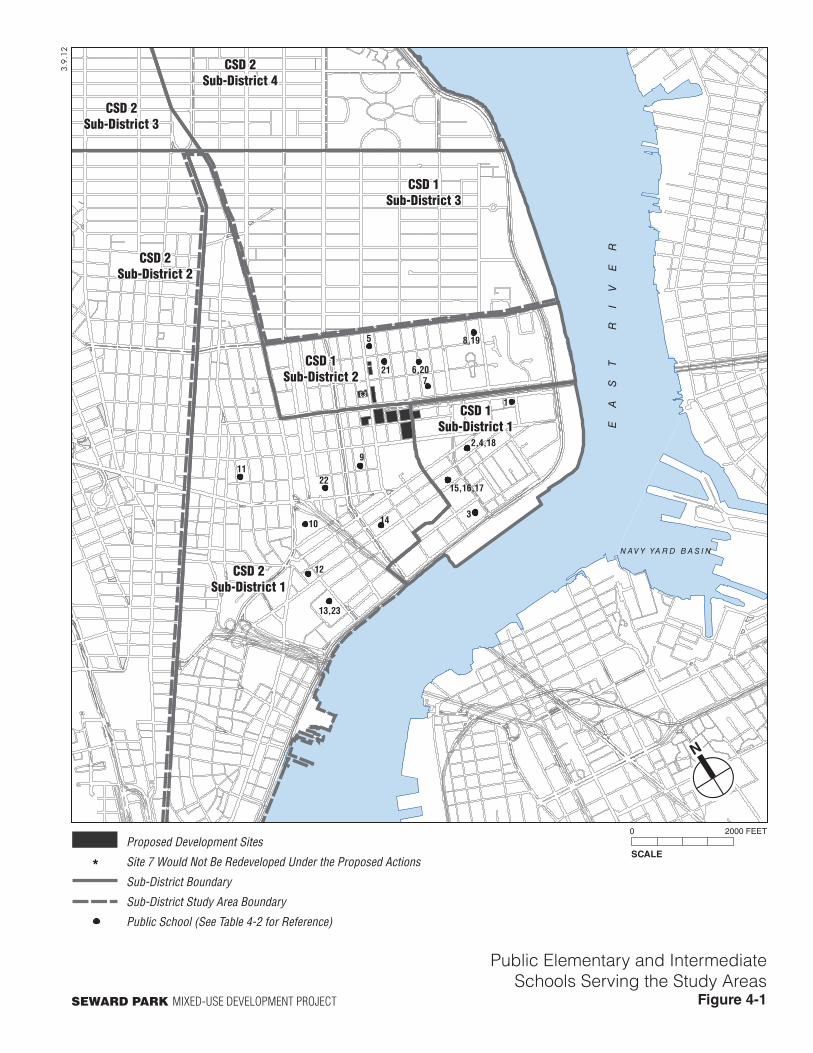
This analysis assesses the potential effects of the proposed actions (specifically its residential component which is assumed to have 900 residential units for analysis purposes) on public elementary and intermediate schools serving the project area. Following methodologies in the CEQR Technical Manual, the study area for the analysis of elementary and intermediate schools is the school districts’ “sub‐district” (“regions” or “school planning zones”) in which the project is located. The proposed project site is located in three sub-districts: Sub-districts 1 and 2 of CSD 1 and Sub-district 1 of CSD 2 (see Figure 4-1). Specifically, Sites 1, 2, 3, 4, and 5 are located in Sub-district 1 of CSD 2; Site 6 is located in Sub-district 1 of CSD 1; and Sites 8, 9, and 10 are located in Sub-district 2 of CSD 1. As discussed above in Section B, an assessment of high schools is not required due to the limited number of public high school students that would be generated by the proposed development.
This schools analysis presents the most recent capacity, enrollment, and utilization rates for elementary and intermediate schools in the sub-district study areas. Future conditions are then predicted based on enrollment projections and proposed development projects—the future utilization rate for school facilities is calculated by adding the estimated enrollment from proposed residential developments in the schools study area to DOE’s projected enrollment, and then comparing that number with projected school capacity. DOE does not include charter school enrollment in its enrollment projections. DOE’s enrollment projections for years 2009 through 2018, the most recent data currently available, are posted on the School Construction Authority (SCA) website.2 These enrollment projections are based on broad demographic trends and do not explicitly account for discrete new residential developments planned for the study area. Therefore, the additional populations from the other new development projects expected to be completed within the study area have been obtained from the SCA’s Capital Planning Division and are added to the projected enrollment to ensure a more conservative prediction of
1 Community Healthcare Network website: http://www.chnnyc.org/locations/downtown/ 2 Enrollment projections by the Grier Partnership were used: https://www.nycsca.org
N AV Y YA R D B A S I N
CSD 1Sub-District 2
CSD 1Sub-District 2
CSD 1Sub-District 3
CSD 1Sub-District 3
CSD 2Sub-District 4
CSD 2Sub-District 4
CSD 2Sub-District 3
CSD 2Sub-District 3
CSD 2Sub-District 2
CSD 2Sub-District 2
CSD 2Sub-District 1
CSD 2Sub-District 1
CSD 1Sub-District 1
CSD 1Sub-District 1
8,19
21 6,20 7
1
2,4,18
15,16,17
314
9
10
2211
12
13,23
5
EA
ST
R
IV
ER
3.9.12
Public Elementary and IntermediateSchools Serving the Study Areas
Figure 4-1
SCALE
0 2000 FEET
SEWARD PARK MIXED-USE DEVELOPMENT PROJECT
Proposed Development Sites
Site 7 Would Not Be Redeveloped Under the Proposed Actions
Sub-District Boundary
Sub-District Study Area Boundary
Public School (See Table 4-2 for Reference)

Seward Park Mixed-Use Development Project
4-6
future enrollment and utilization. In addition, any new school projects identified in the DOE Five-Year Capital Plan are included if construction has begun.
The effect of the new students introduced by the proposed actions on the capacity of schools within the study areas is then evaluated. According to the CEQR Technical Manual, a significant adverse impact may occur if the proposed actions would result in both of the following conditions:
1. A utilization rate of the elementary and/or intermediate schools in the sub‐district study area that is equal to or greater than 100 percent in the future with the proposed actions condition (With Action); and
2. An increase of five percentage points or more in the collective utilization rate between the future without the proposed actions (No Action) and With Action conditions.
EXISTING CONDITIONS
ELEMENTARY SCHOOLS
As shown in Figure 4-1, a number of elementary schools serve the sub-district study areas. As shown in Table 4-2, DOE’s 2010-2011 school year enrollment figures, which are the most recent data currently available, Sub-district 1 of CSD1 has a total enrollment of 1,558 students, or 86 percent of capacity, with 245 available seats. Sub-district 2 of CSD 1 has a total enrollment of 1,895 students, or 83 percent of capacity, with 401 available seats. Sub-district 1 of CSD 2 has a total enrollment of 4,566 students, or 97 percent of capacity, with 146 available seats.
INTERMEDIATE SCHOOLS
As shown in Table 4-2, total enrollment at the intermediate schools in Sub-district 1 of CSD 1 is 663 students, or 58 percent of capacity, with a surplus of 475 seats. Sub-district 2 of CSD 1 has a total enrollment of 849 students, or 81 percent of capacity, with 198 available seats. Sub-district 1 of CSD 2 has a total enrollment of 1,056 students, or 92 percent of capacity, with 88 available seats.
THE FUTURE WITHOUT THE PROPOSED ACTIONS
ENROLLMENT PROJECTIONS
As noted above, SCA provides future enrollment projections by district for up to 10 years. The latest available enrollment projections to 2018 have been used in this analysis for student enrollment to 2022.
These enrollment projections focus on the natural growth of the City’s student population (through births and grade retention) and do not account for new residential developments planned for the sub-district study areas (No Action projects). Therefore, as noted above, the additional students from the anticipated No Action projects within the study areas were also included to more conservatively predict future enrollment and utilization. Therefore, as noted above, the additional projected student populations from the other new development projects expected to be completed within the study area have been obtained from the SCA’s Capital Planning Division and are added to the projected enrollment to ensure a more conservative prediction of future enrollment and utilization.

Chapter 4: Community Facilities and Services
4-7
Table 4-2 Public Schools Serving the Project Sites,
Enrollment and Capacity Data, 2010-2011 School Year Map No. Name Address Enrollment Capacity
Available Seats Utilization
Elementary Schools Sub-district 1 of CSD 1
1 PS 110 Florence Nightingale School 285 Delancey St 435 484 49 90% 2 PS 134 Henrietta Szold School 293 E Broadway 371 413 42 90% 3 PS 137 John L Bernstein School 327 Cherry St 232 247 15 94% 4 PS 184 Shuang Wen School (PS Component) 293 E Broadway 520 659 139 79%
Sub-district 1 of CSD 1 Total 1,558 1,803 245 86% Sub-district 2 of CSD 1
5 PS 20 Anna Silver School 166 Essex St 625 823 198 76% 6 PS 140 Nathan Straus School (PS Component) 123 Ridge St 209 330 121 63% 7 PS 142 Amalia Castro School 100 Attorney St 430 508 78 85%
8 New Explorations Science, Tech And Math School (PS Component) 111 Columbia St 631 635 4 99%
Sub-district 2 of CSD 1 Total 1,895 2,296 401 83% Sub-district 1 of CSD 2
9 PS 42 Benjamin Altman School 71 Hester St 810 709 -101 114% 10 PS 124 Yung Wing School 40 Division St 926 887 -39 104% 11 PS 130 Hernando DeSoto School 143 Baxter St 1,022 946 -76 108% 12 PS 1 Alfred E Smith School 8 Henry St 544 720 176 76% 13 PS 126 Jacob August Riis School (PS Component) 80 Catherine St 432 539 107 80% 14 PS 2 Meyer London School 122 Henry St 832 911 79 91%
Sub-district 1 of CSD 2 Total 4,566 4,712 146 97% Intermediate Schools
Sub-district 1 of CSD 1 15 IS 332 University Neighborhood Middle School 220 Henry St 116 323 207 36%
16 IS 345 Collaborative Academy Of Science, Technology And Language Arts Education 220 Henry St 262 417 155 63%
17 JHS 292 Henry Street School For International Studies (IS Component)* 220 Henry St 120 189 69 63%
18 PS 184 Shuang Wen School (IS Component) 293 E Broadway 165 209 44 79% Sub-district 1 of CSD 1 Total 663 1,138 475 58%
Sub-district 2 of CSD 1
19 New Explorations Science, Tech And Math School (IS Component)* 111 Columbia St 395 398 3 99%
20 PS 140 Nathan Straus School (IS Component) 123 Ridge St 188 296 108 64% 21 IS 378 145 Stanton St 266 353 87 75%
Sub-district 2 of CSD 1 Total 849 1,047 198 81% Sub-district 1 of CSD 2
22 IS 131 100 Hester St 703 703 0 100% 23 PS 126 Jacob August Riis School (IS Component) 80 Catherine St 353 441 88 80%
Sub-district 1 of CSD 2 Total 1,056 1,144 88 92% Notes: See Figure 4-1 Sources: DOE Utilization Profiles: Enrollment/Capacity/Utilization, 2010-2011.
Table 4-3 outlines the estimated number of new public school students generated as a result of development in the future without the proposed actions, which is based on student generation rates listed in Table 6-1a of the CEQR Technical Manual (0.12 elementary students and 0.04 intermediate school students per residential unit in Manhattan).
PROJECTED SCHOOL CAPACITY
According to the DOE’s 2010-2014 Five-Year Capital Plan—Proposed February 2012 Amendment, there is no new school capacity under construction within CSD 1 or CSD 2’s Sub-district 1.
Seward Park Mixed-Use Development Project
4-8
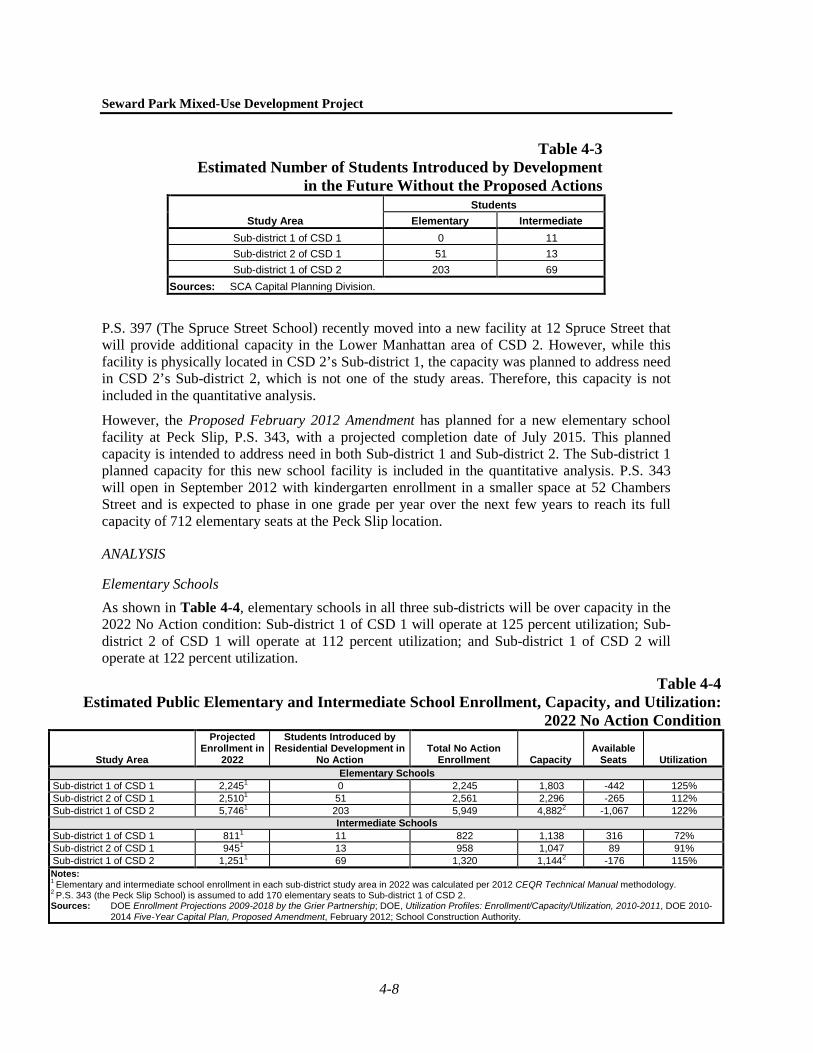
Table 4-3 Estimated Number of Students Introduced by Development
in the Future Without the Proposed Actions
Study Area Students
Elementary Intermediate Sub-district 1 of CSD 1 0 11 Sub-district 2 of CSD 1 51 13 Sub-district 1 of CSD 2 203 69
Sources: SCA Capital Planning Division.
P.S. 397 (The Spruce Street School) recently moved into a new facility at 12 Spruce Street that will provide additional capacity in the Lower Manhattan area of CSD 2. However, while this facility is physically located in CSD 2’s Sub-district 1, the capacity was planned to address need in CSD 2’s Sub-district 2, which is not one of the study areas. Therefore, this capacity is not included in the quantitative analysis.
However, the Proposed February 2012 Amendment has planned for a new elementary school facility at Peck Slip, P.S. 343, with a projected completion date of July 2015. This planned capacity is intended to address need in both Sub-district 1 and Sub-district 2. The Sub-district 1 planned capacity for this new school facility is included in the quantitative analysis. P.S. 343 will open in September 2012 with kindergarten enrollment in a smaller space at 52 Chambers Street and is expected to phase in one grade per year over the next few years to reach its full capacity of 712 elementary seats at the Peck Slip location.
ANALYSIS
Elementary Schools As shown in Table 4-4, elementary schools in all three sub-districts will be over capacity in the 2022 No Action condition: Sub-district 1 of CSD 1 will operate at 125 percent utilization; Sub-district 2 of CSD 1 will operate at 112 percent utilization; and Sub-district 1 of CSD 2 will operate at 122 percent utilization.
Table 4-4 Estimated Public Elementary and Intermediate School Enrollment, Capacity, and Utilization:
2022 No Action Condition
Study Area
Projected Enrollment in
2022
Students Introduced by Residential Development in
No Action Total No Action
Enrollment Capacity Available
Seats Utilization Elementary Schools
Sub-district 1 of CSD 1 2,2451 0 2,245 1,803 -442 125% Sub-district 2 of CSD 1 2,5101 51 2,561 2,296 -265 112% Sub-district 1 of CSD 2 5,7461 203 5,949 4,8822 -1,067 122%
Intermediate Schools Sub-district 1 of CSD 1 8111 11 822 1,138 316 72% Sub-district 2 of CSD 1 9451 13 958 1,047 89 91% Sub-district 1 of CSD 2 1,2511 69 1,320 1,1442 -176 115% Notes: 1 Elementary and intermediate school enrollment in each sub-district study area in 2022 was calculated per 2012 CEQR Technical Manual methodology. 2 P.S. 343 (the Peck Slip School) is assumed to add 170 elementary seats to Sub-district 1 of CSD 2. Sources: DOE Enrollment Projections 2009-2018 by the Grier Partnership; DOE, Utilization Profiles: Enrollment/Capacity/Utilization, 2010-2011, DOE 2010-
2014 Five-Year Capital Plan, Proposed Amendment, February 2012; School Construction Authority.

Chapter 4: Community Facilities and Services
4-9
Intermediate Schools As shown in Table 4-4, intermediate schools in all three sub-districts will operate with a surplus of seats: Sub-district 1 of CSD 1 will operate at 72 percent utilization, Sub-district 2 of CSD 1 will operate at 91 percent utilization, and Sub-district 1 of CSD 2 will operate at 115 percent utilization.
PROBABLE IMPACTS OF THE PROPOSED ACTIONS
The proposed actions would result in the development of 900 residential units in the study areas. Based on the CEQR student generation rates, the proposed actions would generate approximately 108 elementary school students and 36 intermediate school students by 2022 (see Table 4-5).
Table 4-5 Estimated Number of Students Introduced in the Study Areas:
2022 Future With the Proposed Actions Study Area Housing Units Elementary Students Intermediate Students
Sub-district 1 of CSD 1 74 9 3 Sub-district 2 of CSD 1 127 15 5 Sub-district 1 of CSD 2 699 84 28 Total 900 108 36 Sources: CEQR Technical Manual (January 2012 edition), Table 6-1a.
ELEMENTARY SCHOOLS
The total enrollment of Sub-district 1 of CSD 1 would increase by 9 students to 2,254 (125 percent utilization), and the deficit of seats would increase slightly to 451 seats from 442 seats in the future without the proposed actions. The total enrollment of Sub-district 2 of CSD 1 would increase by 15 students to 2,576 (112 percent utilization), and the deficit of seats would increase slightly to 280 seats from 265 seats in the future without the proposed actions. The total enrollment of Sub-district 1 of CSD 2 would increase by 84 students to 6,033 (124 percent utilization), and the deficit of seats would increase to 1,151 seats from 1,067 seats in the future without the proposed actions (see Table 4-6).
Table 4-6 Estimated Public Elementary and Intermediate School Enrollment, Capacity, and Utilization:
2022 With Action Condition
Study Area
Future No Action Enrollment
Students Introduced by
Proposed Actions
Total With Action Enrollment Capacity
Available Seats Utilization
Increase in Utilization over
No Action Elementary Schools
Sub-district 1 of CSD 1 2,245 9 2,254 1,803 -451 125% 0% Sub-district 2 of CSD 1 2,561 15 2,576 2,296 -280 112% 1% Sub-district 1 of CSD 2 5,949 84 6,033 4,882 -1,151 124% 2%
Intermediate Schools Sub-district 1 of CSD 1 822 3 825 1,138 313 72% 0% Sub-district 2 of CSD 1 958 5 963 1,047 84 92% 0% Sub-district 1 of CSD 2 1,320 28 1,348 1,144 -204 118% 3% Sources: DOE Enrollment Projections 2009-2018 by the Grier Partnership; DOE, Utilization Profiles: Enrollment/Capacity/Utilization, 2010-2011, DOE
2010-2014 Five-Year Capital Plan, Proposed Amendment, February 2012; School Construction Authority.
As noted above, a significant adverse impact may occur if the proposed actions would result in both of the following conditions: (1) a utilization rate of the elementary schools in the sub-

Seward Park Mixed-Use Development Project
4-10
district study area that is equal to or greater than 100 percent in the future without the proposed actions; and (2) an increase of five percentage points or more in the collective utilization rate between the future without the proposed actions and future with the proposed actions conditions.
Although elementary schools within the three sub-districts analyzed would operate with a shortage of seats in 2022, the proposed actions would introduce a small number of students relative to the overall enrollment of the study area. As a result, they would not substantially increase the elementary school utilization rate. The largest increase in utilization over the No Action condition would be in Sub-district 1 of CSD 2, where the proposed actions would increase the utilization rate by approximately two percent, which is below the CEQR threshold of 5 percent or more for a significant adverse impact. Because the proposed actions would increase the elementary school utilization rate by less than five percentage points, the proposed actions would not result in a significant adverse impact on elementary schools in any of the sub-districts analyzed. Therefore, the proposed actions would not result in a significant adverse impact on elementary schools.
INTERMEDIATE SCHOOLS
The total enrollment of Sub-district 1 of CSD 1 would increase by 3 to 825 (72 percent utilization), resulting in a surplus of 313 seats. The total enrollment of Sub-district 2 of CSD 1 would increase by 5 to 963 (92 percent utilization), resulting in a surplus of 84 seats. The total enrollment of Sub-district 1 of CSD 2 would increase by 28 to 1,348 (118 percent utilization), and there would be a deficit of 204 seats (see Table 4-6).
As noted above, a significant adverse impacts may occur if the proposed actions would result in both of the following conditions: (1) a utilization rate of the intermediate schools in the sub-district study area that is equal to or greater than 100 percent in the future without the proposed actions; and (2) an increase of five percentage points or more in the collective utilization rate between the future without the proposed actions and future with the proposed actions condition.
Two sub-districts analyzed (Sub-districts 1 and 2 of CSD 1) would operate with surplus capacity at the intermediate school level in 2022, and the proposed actions would not result in a collective utilization rate equal to or greater than 100 percent. In addition, in all three sub-districts analyzed the proposed actions would increase the intermediate school utilization rate by no more than 3 percent. Therefore, the proposed actions would not result in any significant adverse impacts on intermediate schools.
E. INDIRECT EFFECTS ON CHILD CARE SERVICES
METHODOLOGY
The New York City Administration for Children’s Services (ACS) provides subsidized child care in center-based group child care, family-based child care, informal child care, and Head Start. Publicly financed child care services are available for income-eligible children up to the age of 12. In order for a family to receive subsidized child care services, the family must meet specific financial and social eligibility criteria that are determined by federal, state, and local regulations. In general, children in families that have incomes at or below 200 percent Federal Poverty Level (FPL), depending on family size, are financially eligible, although in some cases eligibility can go up to 275 percent FPL.1 The inclusion of families with incomes up to 200 percent FPL provides a 1 2012 Federal Poverty Levels (also known as poverty guidelines) are issued annually by the Department
of Health and Human Services and are available online at: http://aspe.hhs.gov/poverty/12poverty.shtml.

Chapter 4: Community Facilities and Services
4-11
conservative assessment of demand, because eligibility for subsidized child care is not strictly defined by income; it also accounts for family size and other social eligibility criteria. For instance, a family must also have an approved “reason for care,” such as involvement in a child welfare case or participation in a “welfare-to-work” program. Head Start is a federally funded child care program that provides children with half-day or full-day early childhood education; program eligibility is limited to families with incomes 130 percent or less of federal poverty level.
Most children are served through contract with private and nonprofit organizations that operate child care programs throughout the City. Registered or licensed providers can offer family-based child care in their homes. Informal child care can be provided by a relative or neighbor for no more than two children. Children aged two months through 12 years old can be cared for either in group child care centers licensed by the Department of Health or in homes of registered child care providers. ACS also issues vouchers to eligible families, which may be used by parents to pay for child care from any legal child care provider in the City.
Publicly financed child care centers, under the auspices of the New York City Division for Child Care and Head Start (CCHS) within ACS, provide care for the children of income-eligible households. Space for one child in such child care centers is termed a “slot.” These slots may be in group child care or Head Start centers, or they may be in the form of family-based child care in which 7 to 12 children are placed under the care of a licensed provider and an assistant in a home setting.
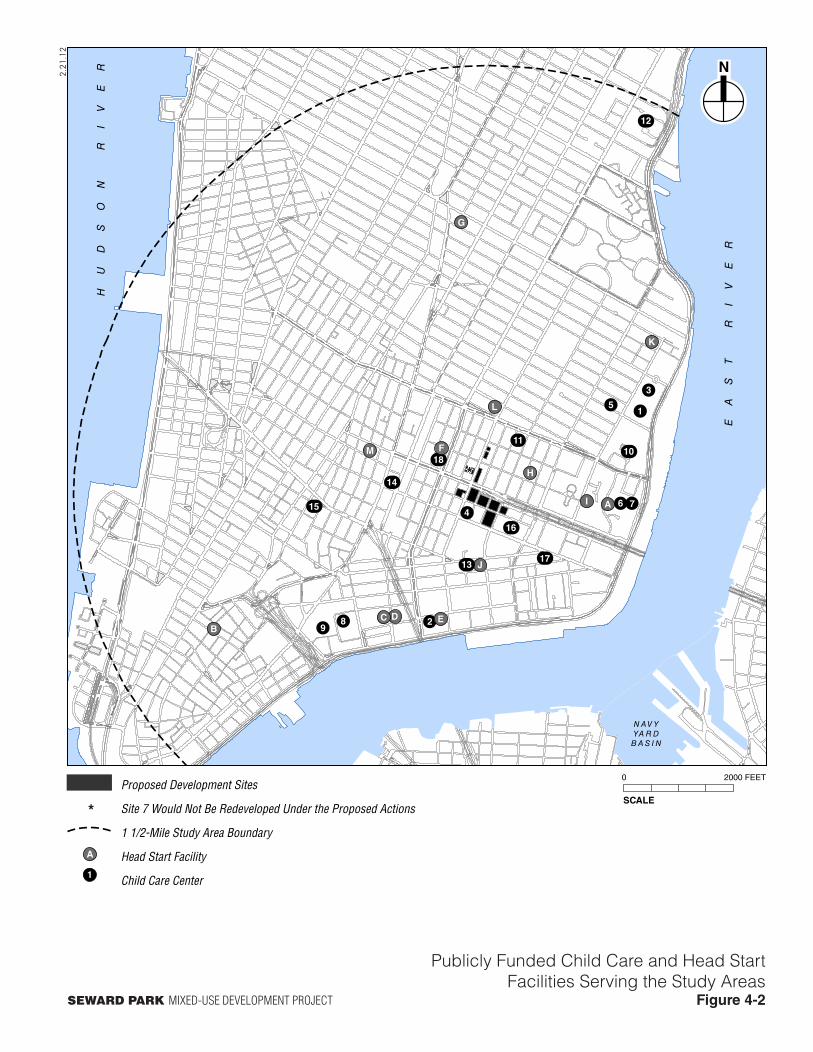
Since there are no locational requirements for enrollment in child care centers, and some parents or guardians choose a child care center close to their employment rather than their residence, the service areas of these facilities can be quite large and not subject to strict delineation in order to identify a study area. However, according to the current methodology for child care analyses, the locations of publicly funded group child care centers within 1½ miles or so of the project site should be shown, reflecting the fact that the centers closest to the project site are more likely to be subject to increased demand. Current enrollment data for the child care and Head Start centers closest to the project site was gathered from ACS.
The child care enrollment in the future without the proposed actions was estimated by multiplying the number of new low-income and low/moderate-income housing units expected in the 1½-mile study area by the CEQR Technical Manual multipliers for estimating the number of children under age six eligible for publicly funded child care services. For Manhattan, the multiplier estimates 0.115 public child care-eligible children under age six per low- and low/moderate-income household.1 The estimate of new public child care-eligible children was added to the existing child care enrollment to estimate enrollment in the future without the proposed actions.
The child care-eligible population introduced by the proposed actions was estimated using the CEQR Technical Manual child care multipliers (Table 6-1b). The population of public child care eligible children under age six was then added to the child care enrollment calculated in the future without the proposed actions. According to the CEQR Technical Manual, if a proposed action would result in a demand for slots greater than remaining capacity of child care centers, and if that demand constitutes an increase of 5 percent or more of the collective capacity of the child care centers serving the area of the proposed actions, a significant adverse impact may result.
1 Low-income and low/moderate-income are the affordability levels used in the CEQR Technical Manual.
They are intended to approximate the financial eligibility criteria established by ACS, which generally corresponds to 200 percent FPL or 80 percent of AMI.
Seward Park Mixed-Use Development Project
4-12
EXISTING CONDITIONS
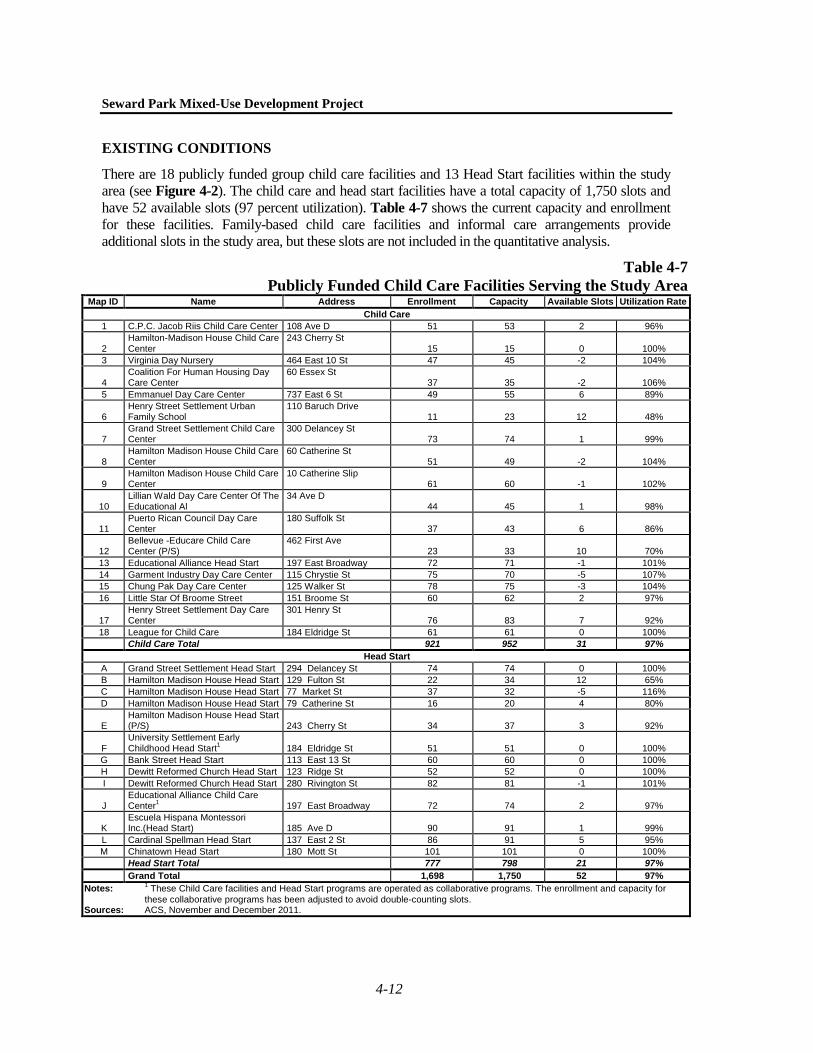
There are 18 publicly funded group child care facilities and 13 Head Start facilities within the study area (see Figure 4-2). The child care and head start facilities have a total capacity of 1,750 slots and have 52 available slots (97 percent utilization). Table 4-7 shows the current capacity and enrollment for these facilities. Family-based child care facilities and informal care arrangements provide additional slots in the study area, but these slots are not included in the quantitative analysis.
Table 4-7 Publicly Funded Child Care Facilities Serving the Study Area
Map ID Name Address Enrollment Capacity Available Slots Utilization Rate Child Care
1 C.P.C. Jacob Riis Child Care Center 108 Ave D 51 53 2 96%
2 Hamilton-Madison House Child Care Center
243 Cherry St 15 15 0 100%
3 Virginia Day Nursery 464 East 10 St 47 45 -2 104%
4 Coalition For Human Housing Day Care Center
60 Essex St 37 35 -2 106%
5 Emmanuel Day Care Center 737 East 6 St 49 55 6 89%
6 Henry Street Settlement Urban Family School
110 Baruch Drive 11 23 12 48%
7 Grand Street Settlement Child Care Center
300 Delancey St 73 74 1 99%
8 Hamilton Madison House Child Care Center
60 Catherine St 51 49 -2 104%
9 Hamilton Madison House Child Care Center
10 Catherine Slip 61 60 -1 102%
10 Lillian Wald Day Care Center Of The Educational Al
34 Ave D 44 45 1 98%
11 Puerto Rican Council Day Care Center
180 Suffolk St 37 43 6 86%
12 Bellevue -Educare Child Care Center (P/S)
462 First Ave 23 33 10 70%
13 Educational Alliance Head Start 197 East Broadway 72 71 -1 101% 14 Garment Industry Day Care Center 115 Chrystie St 75 70 -5 107% 15 Chung Pak Day Care Center 125 Walker St 78 75 -3 104% 16 Little Star Of Broome Street 151 Broome St 60 62 2 97%
17 Henry Street Settlement Day Care Center
301 Henry St 76 83 7 92%
18 League for Child Care 184 Eldridge St 61 61 0 100% Child Care Total 921 952 31 97%
Head Start A Grand Street Settlement Head Start 294 Delancey St 74 74 0 100% B Hamilton Madison House Head Start 129 Fulton St 22 34 12 65% C Hamilton Madison House Head Start 77 Market St 37 32 -5 116% D Hamilton Madison House Head Start 79 Catherine St 16 20 4 80%
E Hamilton Madison House Head Start (P/S) 243 Cherry St 34 37 3 92%
F University Settlement Early Childhood Head Start1 184 Eldridge St 51 51 0 100%
G Bank Street Head Start 113 East 13 St 60 60 0 100% H Dewitt Reformed Church Head Start 123 Ridge St 52 52 0 100% I Dewitt Reformed Church Head Start 280 Rivington St 82 81 -1 101%
J Educational Alliance Child Care Center1 197 East Broadway 72 74 2 97%
K Escuela Hispana Montessori Inc.(Head Start) 185 Ave D 90 91 1 99%
L Cardinal Spellman Head Start 137 East 2 St 86 91 5 95% M Chinatown Head Start 180 Mott St 101 101 0 100% Head Start Total 777 798 21 97% Grand Total 1,698 1,750 52 97%
Notes: 1 These Child Care facilities and Head Start programs are operated as collaborative programs. The enrollment and capacity for these collaborative programs has been adjusted to avoid double-counting slots.
Sources: ACS, November and December 2011.
HU
DS
ON
R
IV
ER
EA
ST
R
IV
ER
N AV YYA R D
B A S I N
2.21
.12
Publicly Funded Child Care and Head StartFacilities Serving the Study Areas
Figure 4-2
SCALE
0 2000 FEET
SEWARD PARK MIXED-USE DEVELOPMENT PROJECT
1
11
2
12
3
4
14
5
15 6
16
7
17
8
18
9
10
A
BD E
F
G
H
I
J
K
L
M
C
13
Proposed Development Sites
Site 7 Would Not Be Redeveloped Under the Proposed Actions
1 1/2-Mile Study Area Boundary
Head Start Facility
Child Care Center
A
1

Chapter 4: Community Facilities and Services
4-13
THE FUTURE WITHOUT THE PROPOSED ACTIONS
In the future without the proposed actions, no new development would occur on the project site. Within the 1½-mile study area planned or proposed development projects will introduce approximately 926 new affordable housing units by 2022.1 Based on the CEQR generation rates for the projection of children eligible for publicly funded day care multipliers, this amount of development would introduce approximately 106 new children under the age of six who would be eligible for publicly funded child care programs.
Based on these assumptions, the number of children eligible for public child care would exceed available slots in the future without the proposed actions. As described above, there is currently a combined surplus of 52 seats in group child care and head start programs. When the estimated 106 children under age six introduced by planned development projects are added to this total, there would be a deficit of 54 seats in publicly funded child care programs in the study area (103 percent utilization).
PROBABLE IMPACTS OF THE PROPOSED ACTIONS
The proposed actions would introduce 450 low- to middle-income units by 2022. To provide a conservative analysis, it is assumed that all of these units, including the middle-income units, would meet the financial and social eligibility criteria for publicly funded child care. Based on CEQR child care multipliers, this development would generate approximately 52 children under the age of six who would be eligible for publicly funded child care programs.
As noted above, the CEQR Technical Manual guidelines indicate that a demand for slots greater than the remaining capacity of child care facilities and an increase in demand of 5 percent of the study area capacity could result in a significant adverse impact. With the addition of these children, child care facilities would continue to operate over 100 percent capacity, with a deficit of 106 slots in the study area. Total enrollment would increase to 1,856 compared to a capacity of 1,750 slots, which represents a utilization rate of 106 percent, three percentage points over the No Action condition. While child care facilities in the study area would operate above capacity, the increase in the utilization rate due to the proposed actions would be less than five percent, and therefore, the proposed actions would not result in a significant adverse impact on child care facilities.
Furthermore, several factors may reduce the number of children in need of publicly funded child care slots in ACS-contracted child care facilities. Families in the study area could make use of alternatives to publicly funded child care facilities. There are slots at homes licensed to provide family-based child care that families of eligible children could elect to use instead of public center child care. As noted above, these facilities provide additional slots in the study area but are not included in the quantitative analysis. Parents of eligible children are also not restricted to enrolling their children in child care facilities in a specific geographical area and could use public child care centers outside of the study area.
1 Assuming that 20 percent of units in developments of 20 or more units would be occupied by low- or
low/moderate-income households meeting the financial and social criteria for publicly funded child care. The analysis excludes developments that would not include low- to moderate-income units, such as dormitories and faculty housing.