chapter 4 engine experimental test rig -...
TRANSCRIPT

37
Chapter 4
Engine experimental test rig
The complete experimental set up, test matrix and procedure for
engine emission studies are discussed in this chapter. The main components of the
experimental set up were fuel tank, fuel measuring unit. Electrical loading
arrangement, voltmeter, ammeter, wattmeter, rpm meter, six channel temperature
indicator, EGR rate indicator and emission equipments measurements are shown
in the diagram (figure.4.1). The details of the experimental data acquisition are
discussed below.
4.1 Engine
The engine used for experimental analysis is an indirect injection
(IDI) low speed diesel engine. This engine is widely used mostly for agricultural
irrigation purposes and also in many other small and medium scale commercial
applications like producing electricity, running flour mills, oil expellers, rice mills
etc. The engine was mounted on vibration isolators to avoid the excessive
vibrations. The coupling of engine and generator is done by V-belt drive power
transmission system. The diameters of the pulley mounted on engine and
generator was so selected that the engine at designed rpm of 1000 at full load. The

38
electrical loading arrangement was used for loading the engine. The study was
carried out by loading the engine at 0%, 25%, 50%, 75% and 100% of its rated
load. The integrated system of experimental set up is shown in figure 4.2. The
technical specifications of the generator and engine are listed in table 4.1 and
table 4.2 respectively.
The sub systems of the test rig are integrated and the schematic
diagram of experimental test set up is shown below in figure 4.1.
Figure 4.1: Schematic diagram of experimental test setup.
1. Electrical loading 2. Single cylinder 4-stroke diesel engine & Alternator 3.
Exhaust gas recirculation system 4. Three way catalytic converter 5. Gas analyzer
& Smoke meter 6. Fuel tank and 7. Air drum.

39
Figure 4.2: single cylinder IDI diesel engine.
40
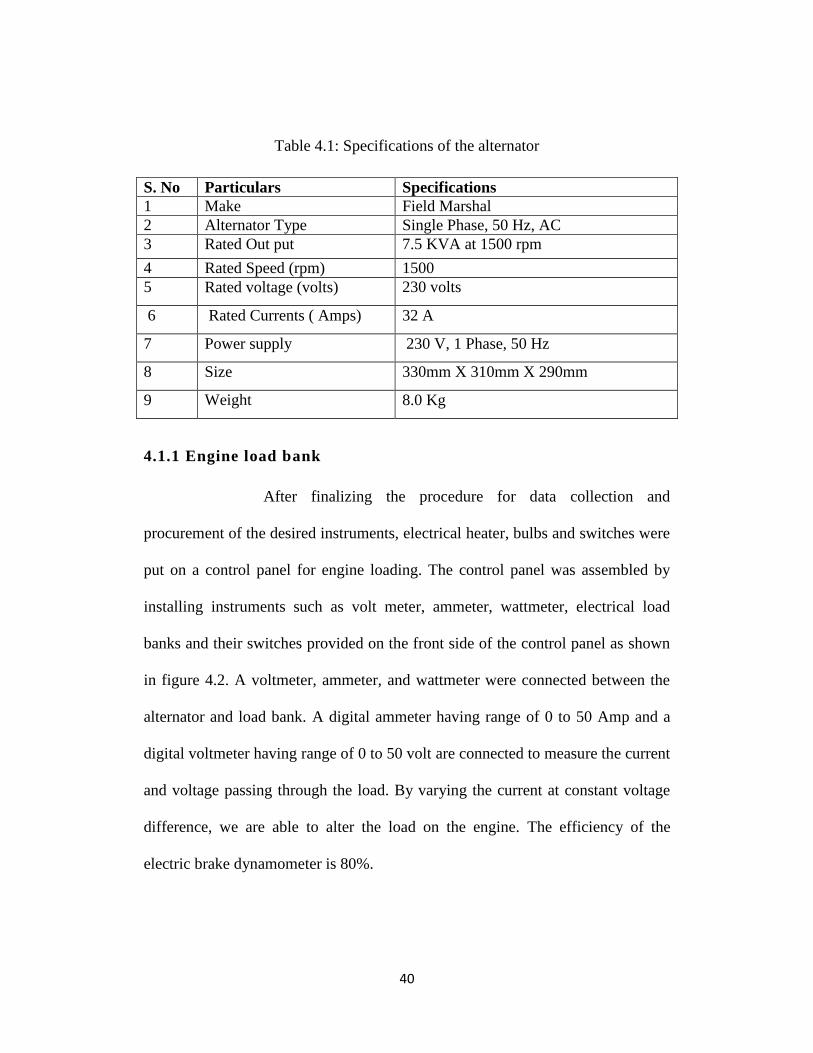
Table 4.1: Specifications of the alternator
S. No Particulars Specifications
1 Make Field Marshal
2 Alternator Type Single Phase, 50 Hz, AC
3 Rated Out put 7.5 KVA at 1500 rpm
4 Rated Speed (rpm) 1500
5 Rated voltage (volts) 230 volts
6 Rated Currents ( Amps) 32 A
7 Power supply 230 V, 1 Phase, 50 Hz
8 Size 330mm X 310mm X 290mm
9 Weight 8.0 Kg
4.1.1 Engine load bank
After finalizing the procedure for data collection and
procurement of the desired instruments, electrical heater, bulbs and switches were
put on a control panel for engine loading. The control panel was assembled by
installing instruments such as volt meter, ammeter, wattmeter, electrical load
banks and their switches provided on the front side of the control panel as shown
in figure 4.2. A voltmeter, ammeter, and wattmeter were connected between the
alternator and load bank. A digital ammeter having range of 0 to 50 Amp and a
digital voltmeter having range of 0 to 50 volt are connected to measure the current
and voltage passing through the load. By varying the current at constant voltage
difference, we are able to alter the load on the engine. The efficiency of the
electric brake dynamometer is 80%.
41
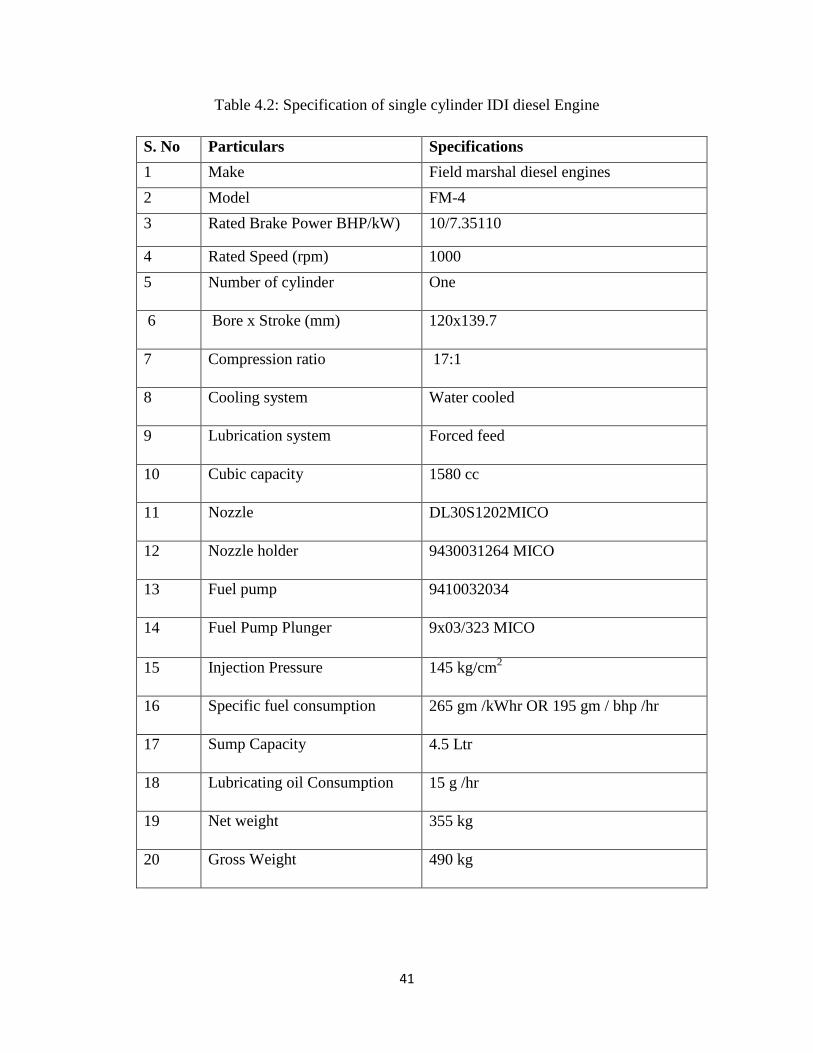
Table 4.2: Specification of single cylinder IDI diesel Engine
S. No Particulars Specifications
1 Make Field marshal diesel engines
2 Model FM-4
3 Rated Brake Power BHP/kW) 10/7.35110
4 Rated Speed (rpm) 1000
5 Number of cylinder One
6 Bore x Stroke (mm) 120x139.7
7 Compression ratio 17:1
8 Cooling system Water cooled
9 Lubrication system Forced feed
10 Cubic capacity 1580 cc
11 Nozzle DL30S1202MICO
12 Nozzle holder 9430031264 MICO
13 Fuel pump 9410032034
14 Fuel Pump Plunger 9x03/323 MICO
15 Injection Pressure 145 kg/cm2
16 Specific fuel consumption 265 gm /kWhr OR 195 gm / bhp /hr
17 Sump Capacity 4.5 Ltr
18 Lubricating oil Consumption 15 g /hr
19 Net weight 355 kg
20 Gross Weight 490 kg
42
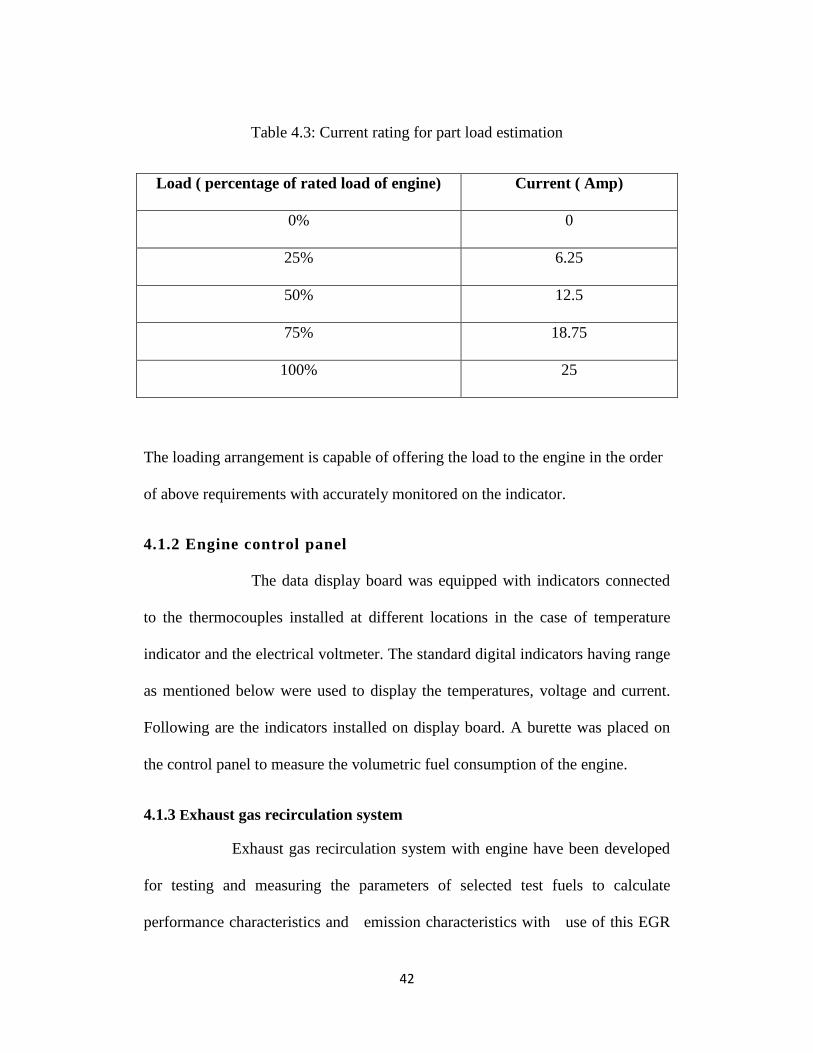
Table 4.3: Current rating for part load estimation
Load ( percentage of rated load of engine) Current ( Amp)
0% 0
25% 6.25
50% 12.5
75% 18.75
100% 25
The loading arrangement is capable of offering the load to the engine in the order
of above requirements with accurately monitored on the indicator.
4.1.2 Engine control panel
The data display board was equipped with indicators connected
to the thermocouples installed at different locations in the case of temperature
indicator and the electrical voltmeter. The standard digital indicators having range
as mentioned below were used to display the temperatures, voltage and current.
Following are the indicators installed on display board. A burette was placed on
the control panel to measure the volumetric fuel consumption of the engine.
4.1.3 Exhaust gas recirculation system
Exhaust gas recirculation system with engine have been developed
for testing and measuring the parameters of selected test fuels to calculate
performance characteristics and emission characteristics with use of this EGR
43
system. The EGR system is developed to reduce the amount of oxides of nitrogen
(NOX) created by the engine during operating periods that usually results in high
combustion temperatures. NOX is formed in high concentrations whenever
combustion temperatures exceed about 25000 F.
The EGR system reduces NOX production by recirculation small
amount of exhaust gases into the intake manifold where it mixes with the
incoming air. By diluting the air mixture under these conditions, peak combustion
temperature and pressure are reduced, resulting in overall reduction of NOX
output. The EGR system consists of EGR control valve, exhaust control valve,
EGR cooler (water cooled type), exhaust cooler (water cooled type) and digital
manometer. In the current research the exhaust gas coming out of the engine is
passed to an exhaust cooler. The exhaust from the exhaust cooler after cooling is
passed via a valve and digital manometer. The digital manometer is provided in
order to find the total amount of exhaust gas flow (when the EGR control valve is
closed) and valve controlling the flow. The digital manometer operates at a
temperature range of 10-500 C; this is the reason for cooling the exhaust gas after
the EGR system. In the main exhaust line, a tapping is provided for EGR system.
The exhaust gas from the tapping via a valve and is passed to the EGR cooler,
where the exhaust gas is cooled before sending it to the engine. A digital
manometer is provided at the inlet manifold of the engine in order to know the
flow of exhaust gas to the engine. To allow desired percentage of EGR into the
engine, the first step is to find the total flow of exhaust gas with the digital
44
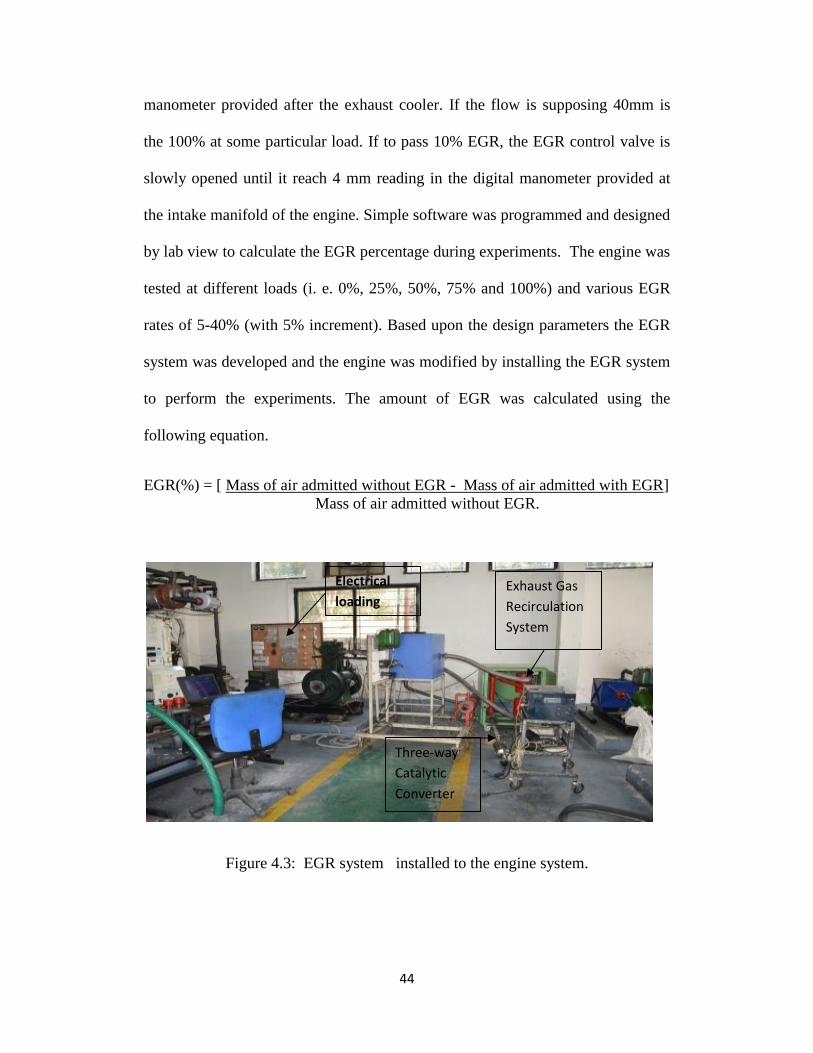
manometer provided after the exhaust cooler. If the flow is supposing 40mm is
the 100% at some particular load. If to pass 10% EGR, the EGR control valve is
slowly opened until it reach 4 mm reading in the digital manometer provided at
the intake manifold of the engine. Simple software was programmed and designed
by lab view to calculate the EGR percentage during experiments. The engine was
tested at different loads (i. e. 0%, 25%, 50%, 75% and 100%) and various EGR
rates of 5-40% (with 5% increment). Based upon the design parameters the EGR
system was developed and the engine was modified by installing the EGR system
to perform the experiments. The amount of EGR was calculated using the
following equation.
EGR(%) = [ Mass of air admitted without EGR - Mass of air admitted with EGR]
Mass of air admitted without EGR.
Figure 4.3: EGR system installed to the engine system.
Electrical
loading Exhaust Gas
Recirculation
System
Three-way
Catalytic
Converter
45
After installing the EGR system on engine, the experiment was
carried out by fuelling the engine with diesel, biodiesel and their blends. The
engine was tested at different loads (i. e. 0%, 25%, 50%, 75% and 100%) and at
various EGR rates of 5-40% (with 5% increment).
4.1.4 Catalytic converter
Three- way catalytic converter was fitted with engine for testing
and evaluating the parameters selected of the test fuels. The converter has two
basic components, an outer stainless steel cylindrical casing, which is housed a
honeycomb matrix core consisting of many parallel channel passage ways through
which the exhaust gas flows. The honeycomb passage ways are made from
ceramic material, a highly porous aluminium (Al2O
3) wash coat provides a rough
surface finish and covers the passage ways walls to significantly increase the
effective surface area exposed to the exhaust gas. The wash coat is impregnated
by vapour deposition with the noble metals as catalysts, usually platinum (Pt),
rhodium (Rh) and palladium (Pd). The Rh as a catalyst to release the oxygen
atoms stored in NOx
in the reduction reaction. The oxygen atoms made available
in the reduction process will simultaneously provide an oxidation environment to
oxidise HC and CO. Therefore, the three main harmful exhaust species, namely
HC, CO and NOx
are either oxidised or reduced when passing through the
catalytic converter
Three- way catalytic converter can store oxygen from the exhaust
gas stream, usually when the air fuel ratio goes lean. When the insufficient

46
oxygen is available from the exhaust stream the stored oxygen is released and
consumed. This happens when oxygen is derived from NOx.
The engine system with EGR and three way-catalytic converter
is developed to reduce the amount of oxides of nitrogen (NOX) created by the
engine during operating periods that usually results in high combustion
temperature, NOX is formed in high concentrations whenever combustion
temperature exceed about 25000F. After installing the EGR system and three
way-catalytic converter on engine the experiment was carried out by fuelling the
engine with diesel, biodiesel and their blends.
4.2 Measurement methods
Required data for performance and emission characteristics of the
engine were obtained with the help of volumetric fuel consumption measuring
unit, electrical loading arrangement, voltmeter, ammeter, tachometer, temperature
indicator, smoke and exhaust gas analyzer. The performance parameter such as
BTE and BSFC were evaluated from the fundamentals data generated during the
experiments. Smoke opacity was also measured by AVL make gas analyzer along
with NOX, CO, CO2 and HC. The detailed procedure for data generation and
analyzers are explained in the following sections.
4. 2. 1 Brake power
The brake power is among the most important parameter in
testing of an engine. The power developed by the engine was measured with the
47
help of an electric alternator type of dynamometer. The lamp load was connected
in series with the generator to act as resistive load bank. The engine was started
and engine was running for about 15 minutes to get stabilized. After that the
voltage and current corresponding to all the operating points were recorded from
the Voltmeter & Ammeter mounted on the control panel. The product of voltage
and current gives the actual load on engine alternator system.
4.2.2 Measurement of temperature
A digital temperature indicator was provided on the control panel.
The thermocouples were inserted into the flow line to a sufficient extent to
capture the temperature correctly. The suitable fabrication work was done to
accommodate the thermocouples at desired locations. The wires communicating
the signals from thermocouples to the digital indicators were connected to the
appropriate terminals rigidly. The range and the type of temperature indicators
installed on data display board are as follows:
I. Exhaust gas temperature indicator: Range 500 0C ( J 100 type)
II. Exhaust gas temperature indicator at heat exchanger outlet: Range 500
0C (J 100 type)
III. Cooling water inlet temperature indicator: Range 1000 C ( Type PT
100)
IV. Cooling water outlet temperature indicator: Range 1000 C (Type PT
100)
V. Lubricating oil temperature indicator: Range 1000 C (Type PT 100)
VI. Inlet air temperature at inlet to Air tank indicator: Range 1000 C
(Type PT 100)
48
4.2.3 Measurement of speed
The magnetic pickup produces a pulse for every revolution and a
pulse counter accurately measures the speed. The instrument is capable of
functioning in the range of 1 to 9,999 rpm with a sampling time of 1 second. For
measurement, a nut was welded on the fly wheel face and sensor was mounted on
a bracket near the fly wheel in such a way that the distance was less than 5 mm.
The display unit is digital and mounted on the below the temperature
measurement of the panel board.
4.2.4 Fuel flow measuring system
The fuel consumption of the engine was measured by
determining the volume flow in a given time interval and multiplying it by the
specific gravity of the fuel which was needed to be measured occasionally to get
an accurate value. Another method is to measure the time required for
consumption of a given mass of fuel. The test facilities were built up for
measuring both diesel, biodiesel and their blends consumption rates. For this, one
tank, one burette and two numbers of valves were provided on the panel. The time
for 50 cc fuel consumed in recorded with the help of stopwatch.
4.2.5 Measurement of EGR rate
Data acquisition system was used for EGR system analysis of
the engine. EGR system was used for acquiring EGR rate, using this interface the
data is transferred from EGR system indicator to personal computer. Personal

49
computer was used for analyzing the acquired data from EGR system with the
help of software “Engine Soft”. This acquired data can be opened in any of the
data processing software and various calculations were made. Figure 4.4 shows
the acquired data and graphs on personal computer.
4.2.6 Measurement of air flow rate
The air flow measurement was achieved by a U-tube manometer
and air chamber. It has an air chamber. The air chamber is equipped with an inlet
orifice having coefficient of discharge 0.6. The pressure difference in the inlet
manifold was measured by a normal U-tube manometer. Airflow was measured
by taking the difference in heights of the water column in the two legs of the
manometer and area of orifice of the surge tank.
Table 4.4: Capabilities of measurement AVL-437 smoke meter
Exhaust gas Measurement range Resolution
NOx 0 – 4000 vol. ppm 1 vol. ppm
CO 0 – 10 vol. % 0.01 vol. %
CO2 0 -20 vol. % 0.1 vol. %
HC 0 – 20,000 ppm 1ppm
O2 0 – 22 vol % 0.01 vol %

50
Figure 4.4: Un steady and steady EGR rate at (40%) on Computer monitor.
51
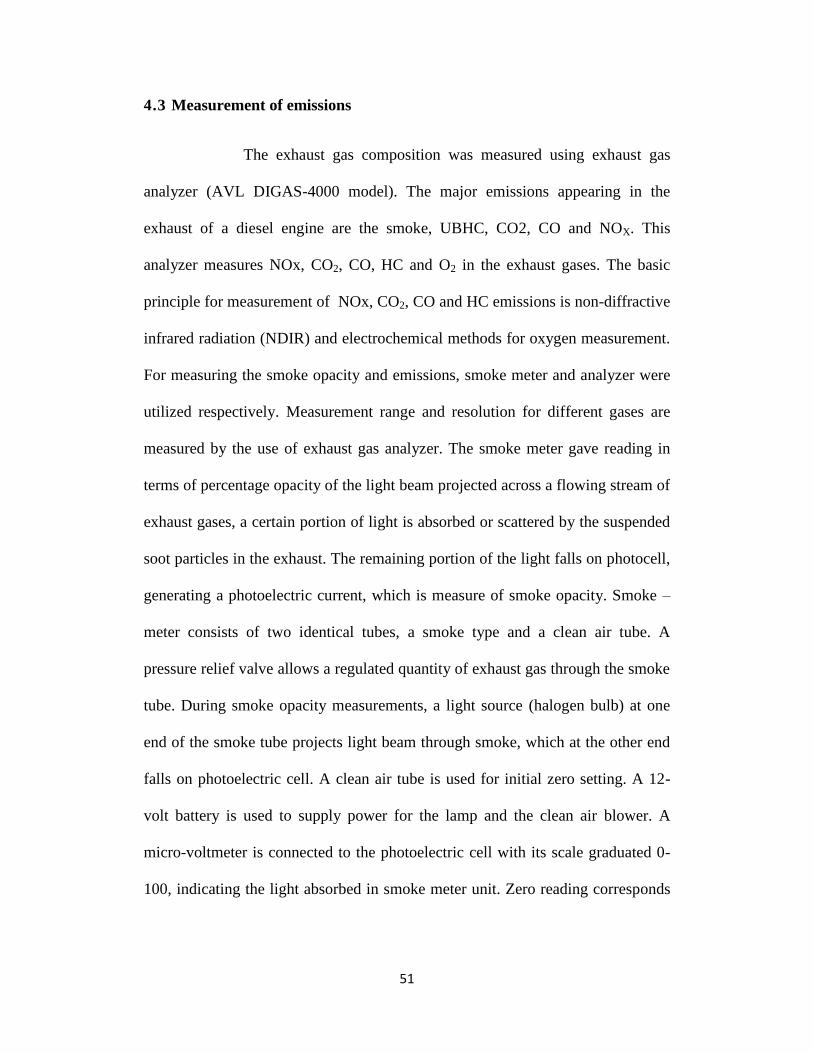
4.3 Measurement of emissions
The exhaust gas composition was measured using exhaust gas
analyzer (AVL DIGAS-4000 model). The major emissions appearing in the
exhaust of a diesel engine are the smoke, UBHC, CO2, CO and NOX. This
analyzer measures NOx, CO2, CO, HC and O2 in the exhaust gases. The basic
principle for measurement of NOx, CO2, CO and HC emissions is non-diffractive
infrared radiation (NDIR) and electrochemical methods for oxygen measurement.
For measuring the smoke opacity and emissions, smoke meter and analyzer were
utilized respectively. Measurement range and resolution for different gases are
measured by the use of exhaust gas analyzer. The smoke meter gave reading in
terms of percentage opacity of the light beam projected across a flowing stream of
exhaust gases, a certain portion of light is absorbed or scattered by the suspended
soot particles in the exhaust. The remaining portion of the light falls on photocell,
generating a photoelectric current, which is measure of smoke opacity. Smoke –
meter consists of two identical tubes, a smoke type and a clean air tube. A
pressure relief valve allows a regulated quantity of exhaust gas through the smoke
tube. During smoke opacity measurements, a light source (halogen bulb) at one
end of the smoke tube projects light beam through smoke, which at the other end
falls on photoelectric cell. A clean air tube is used for initial zero setting. A 12-
volt battery is used to supply power for the lamp and the clean air blower. A
micro-voltmeter is connected to the photoelectric cell with its scale graduated 0-
100, indicating the light absorbed in smoke meter unit. Zero reading corresponds
52
to just clean smoke, where as reading of 100 refers to dense smoke, which allows
no light to pass through it. This smoke meter measures the opacity of the polluted
exhaust, in a particular diesel exhaust gases (in a measurement chamber of a
defined measurement length). The effective length of the measurement chamber
was 0.430 ± 0.005 m. The temperature of the exhaust gas to be measured was kept
between 70 0 C and 130
0C as per recommendations of the manufacturer as shown
in the table. 4.4.
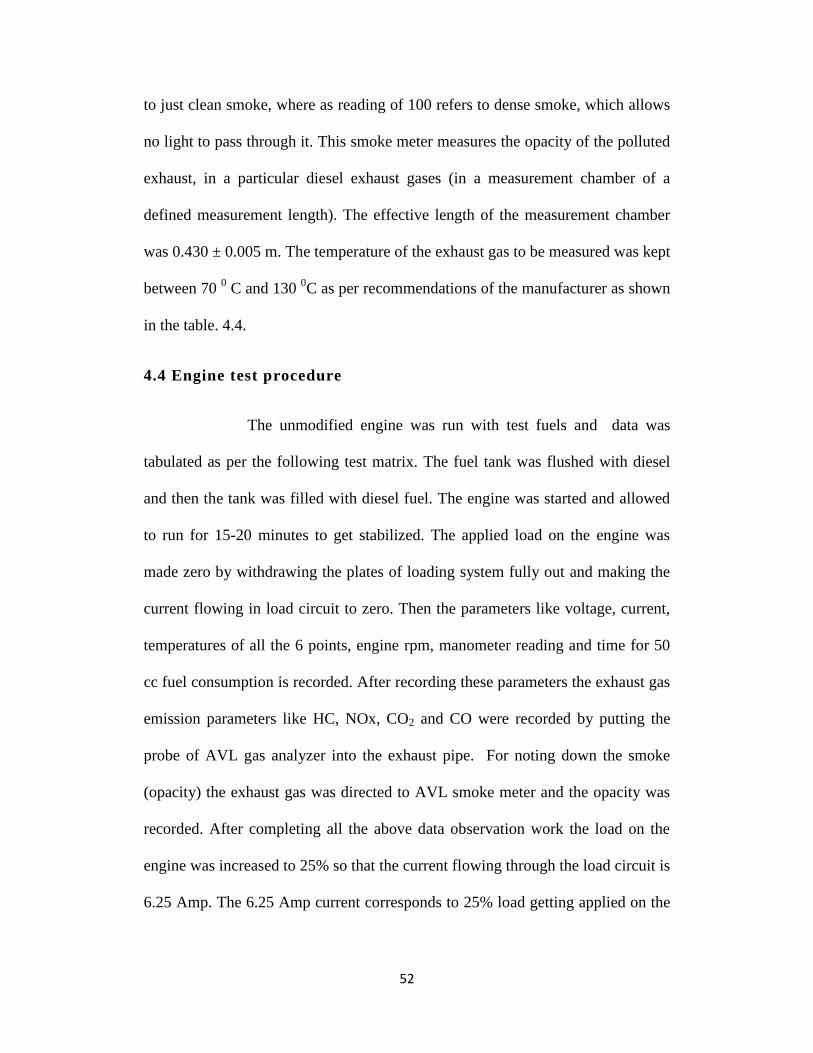
4.4 Engine test procedure
The unmodified engine was run with test fuels and data was
tabulated as per the following test matrix. The fuel tank was flushed with diesel
and then the tank was filled with diesel fuel. The engine was started and allowed
to run for 15-20 minutes to get stabilized. The applied load on the engine was
made zero by withdrawing the plates of loading system fully out and making the
current flowing in load circuit to zero. Then the parameters like voltage, current,
temperatures of all the 6 points, engine rpm, manometer reading and time for 50
cc fuel consumption is recorded. After recording these parameters the exhaust gas
emission parameters like HC, NOx, CO2 and CO were recorded by putting the
probe of AVL gas analyzer into the exhaust pipe. For noting down the smoke
(opacity) the exhaust gas was directed to AVL smoke meter and the opacity was
recorded. After completing all the above data observation work the load on the
engine was increased to 25% so that the current flowing through the load circuit is
6.25 Amp. The 6.25 Amp current corresponds to 25% load getting applied on the
53
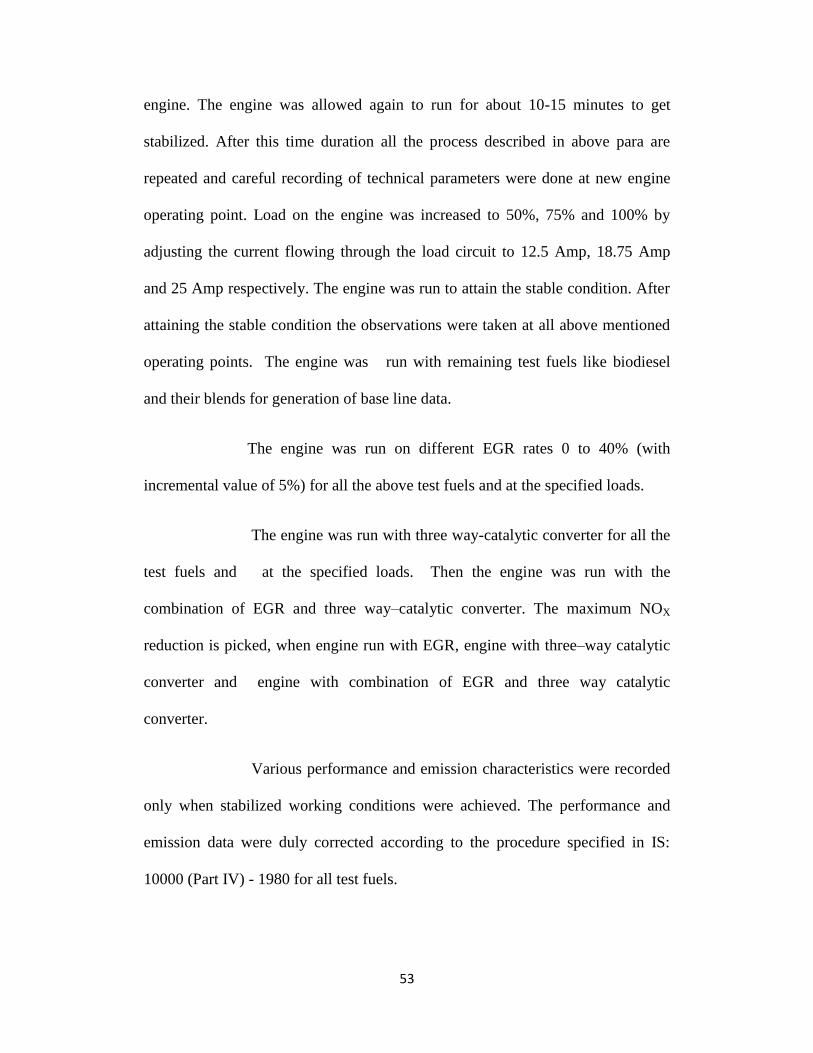
engine. The engine was allowed again to run for about 10-15 minutes to get
stabilized. After this time duration all the process described in above para are
repeated and careful recording of technical parameters were done at new engine
operating point. Load on the engine was increased to 50%, 75% and 100% by
adjusting the current flowing through the load circuit to 12.5 Amp, 18.75 Amp
and 25 Amp respectively. The engine was run to attain the stable condition. After
attaining the stable condition the observations were taken at all above mentioned
operating points. The engine was run with remaining test fuels like biodiesel
and their blends for generation of base line data.
The engine was run on different EGR rates 0 to 40% (with
incremental value of 5%) for all the above test fuels and at the specified loads.
The engine was run with three way-catalytic converter for all the
test fuels and at the specified loads. Then the engine was run with the
combination of EGR and three way–catalytic converter. The maximum NOX
reduction is picked, when engine run with EGR, engine with three–way catalytic
converter and engine with combination of EGR and three way catalytic
converter.
Various performance and emission characteristics were recorded
only when stabilized working conditions were achieved. The performance and
emission data were duly corrected according to the procedure specified in IS:
10000 (Part IV) - 1980 for all test fuels.