chapter 4jpan/diatrives/tsiamtsiouri/chapter4.pdf · presentation of the available greek crime data...
TRANSCRIPT

37
Chapter 4
Presentation of the Available Greek
Crime Data
4.1 Offenses under consideration
The available data is crimes reported over the periods 1982-1997 for
annual counts and 1987-1997 for monthly counts. Annual data is tabulated as
crime counts by crime for the period 1982-1997 and as crime counts by
location for the period 1987-1997. Monthly data is only tabulated as crime
counts by crime. However, information about the exact date or time and
location of each crime occurrence was not available.
The offenses used in our analyses are the following:
Commonly dangerous crimes. According to the Greek Penal Code
commonly dangerous crimes include
arson and arson in forests,
debacle,
explosion,
illegal manufacturing, supply, or possession of explosives,
intentional severe damage of anything that can put man in danger,
arsis of safety habitations in mines, plants and other locations
putting the workers’ lives in jeopardy,
wrecking,
poisoning of founts or foods,
adulteration of foods, drinks, medical material or other items whose
usage could harm the health of human beings,
poisoning of rangelands, grasslands, lakes or other watering places,
infection of animals,

38
violation of measures about diseases’ forestalling,
violation of measures about epizootic diseases’ forestalling,
violation of building instructions,
violation of provisioning contracts,
prevention of action necessary to avoid or suppress existing or
imminent danger and omission of providing assistance in case of an
accident or common danger.
Offenses against life. According to the Greek Penal Code offenses against
life include
premeditated killing of a person,
acquiescent murder,
homicide participation,
homicide by misadventure,
infanticide,
abortion,
physical injury of a fetus or neonate,
promotion of abortion means,
exposition to danger,
omission of rescuing a human life.
Physical injuries. According to the Greek Penal Code commonly
dangerous crimes include:
simple physical injury,
unprovoked physical injury,
critical physical injury,
severe physical injury,
fatal physical injury,
juveniles’ physical injury,
encounter,
physical injury by misadventure.
Property crimes. According to the Greek Penal Code commonly dangerous
crimes include:
larceny,
grand larceny,
defalcation,

39
concealment of finding,
worthless larceny and defalcation,
abstraction,
robbery,
damage of foreign property,
grand damage,
quelling damage which provoke the public feeling.
Beggary and vagrancy. Vagrancy was abolished in 1994. Therefore,
counts of beggary and vagrancy in our tables concern only beggary from
1994 on.
Illegal possession and usage of fire guns.
Illegal possession of explosives.
Offenses concerning antiquities.
Drug offenses.
Smuggling offenses.
Arsons.
Arsons in forests.
Murder.
Homicide by misadventure.
Caused death by car.
Physical injury of a person by car.
Simple, unprovoked and dangerous physical injury.
Physical injury by misadventure.
Cases of one taking the law into one’s own hands.
Larceny.
Robbery.
Rape. Rape is recorded as an individual offense only after 1988.
Therefore, rape counts are available from 1988 to 1997, both in annual and
in monthly data.

40
4.2 Preliminary examination of Greek crime data
4.2.1 Annual data
A first examination of the data shows a general increase of crime
activity.
Commonly dangerous crimes (figure 1) appear to have increased by
almost 64% since 1982, although there was a peak in 1988 where the crimes
reported where about two and a half times as many as in 1997 (increased by
148.57% since 1987).
Commonly dangerous crimes
1997
1996
1995
1994
1993
1992
1991
1990
1989
1988
1987
1986
1985
1984
1983
1982
800
700
600
500
400
300
200
100
Figure 1. Annual counts of commonly dangerous crimes for the period 1982-1997.
Offenses against life (figure 2) seem to be steadily increasing since
1982, with a few small fluctuations, to reach a 22.66% increase in 1997.
Physical injuries (figure 3) have shown several fluctuations since 1982
to increase only by 7.72% in 1997.
Property crimes (figure 4) are one of the offenses with the highest
increase. They have been increasing to reach 90583 offenses in 1997, almost
four times as many as they were in 1982 (23423 offenses in 1982).

41
Offenses against life
1997
1996
1995
1994
1993
1992
1991
1990
1989
1988
1987
1986
1985
1984
1983
1982
2100
2000
1900
1800
1700
1600
Figure 2. Annual counts of offenses against life for the period 1982-1997.
Physical Injuries
1997
1996
1995
1994
1993
1992
1991
1990
1989
1988
1987
1986
1985
1984
1983
1982
29000
28000
27000
26000
25000
24000
Figure 3. Annual counts of physical injuries for the period 1982-1997.
Property crimes
1997
1996
1995
1994
1993
1992
1991
1990
1989
1988
1987
1986
1985
1984
1983
1982
100000
80000
60000
40000
20000
0
Figure 4. Annual counts of property crimes for the period 1982-1997.

42
Beggary and vagrancy (figure 5) show some considerable fluctuation
from 1982 to 1992 on a generally decreasing pattern, but from 1992 and on it
has a clear increasing pattern with an impressive rate. There were 200
reported beggary and vagrancy offenses in 1992 (decreased by 14.89% since
1982) to increase in 907 offenses in 1997 (a 285.96% increase since 1982).
We have to notice that the highest increase appeared in 1993 when the
reported beggary and vagrancy offenses were 437, more than twice as many
as in 1992. However, one would expect that since vagrancy was abolished in
1994 the reported offenses would be decreasing after 1994. In fact there was a
22.59% decrease from 1994 to 1995. Unfortunately, it was only a short
backward that did not last. The increasing course of reported offenses found
once more its way in 1996.
Beggary and vagrancy
1997
1996
1995
1994
1993
1992
1991
1990
1989
1988
1987
1986
1985
1984
1983
1982
1000
800
600
400
200
0
Figure 5. Annual counts of beggary and vagrancy for the period 1982-1997.
Illegal possession and usage of fire guns (figure 6) also had an almost
steadily increasing pattern from 1982 to 1997, with some small backward in
1984-1985, in 1990 and in 1993. As a result reported offenses where 1390 in
1997, increased by 232.54% since 1982.

43
Illegal possession and usage of arms
1997
1996
1995
1994
1993
1992
1991
1990
1989
1988
1987
1986
1985
1984
1983
1982
1600
1400
1200
1000
800
600
400
200
Figure 6. Annual counts of illegal possession and usage of fire guns for the period 1982-
1997.
Illegal possession of explosives (figure 7) after reaching its peak in 1991
where the number of offenses was four and a half times larger than the
number of reported offenses in 1982, shows a decreasing pattern since then,
to reach the 153 offenses in 1997 (decreased by 48.66% since 1991).
However, these offenses are still twice as many as in 1982.
Illegal possession of explosives
1997
1996
1995
1994
1993
1992
1991
1990
1989
1988
1987
1986
1985
1984
1983
1982
400
300
200
100
0
Figure 7. Annual counts of illegal possession of explosives for the period 1982-1997.
The offenses concerning antiquities (figure 8) show a similar pattern.
After reaching their peak in the period 1993-1994 (with a 460% increase since
1982) they are decreasing since then, to be 139 in 1997, showing a 223.26%
increase since 1982 (decreased by 42% since 1994).
fire guns

44
Offenses concerning antiquities
1997
1996
1995
1994
1993
1992
1991
1990
1989
1988
1987
1986
1985
1984
1983
1982
300
200
100
0
Figure 8. Annual counts of offenses concerning antiquities for the period 1982-1997.
Another impressive pattern is that of the drug offenses (figure 9). It is
clear that there is a dramatic increase since 1993. Although there was a 22%
decrease from 1992 to 1993 the general pattern is upward reaching a 1082%
increase from 1982 to 1997.
Drug offenses
1997
1996
1995
1994
1993
1992
1991
1990
1989
1988
1987
1986
1985
1984
1983
1982
7000
6000
5000
4000
3000
2000
1000
0
Figure 9. Annual counts of drug offenses for the period 1982-1997.
Smuggling (figure 10) also has an interesting pattern. There were just 11
reported smuggling offenses in 1982 to reach the 161 offenses in 1987
increased by 1363.64%. They were decreasing from 1987 to 1989 to reach the
54 offenses in 1989 and start increasing again to count 198 offenses in 1992
(an 1700% increase since 1982). Although there was a considerable

45
fluctuation from 1992 to 1997, the reported smuggling offenses were 220 in
1997, with a total increase of 1900% since 1982.
Smuggling
1997
1996
1995
1994
1993
1992
1991
1990
1989
1988
1987
1986
1985
1984
1983
1982
300
200
100
0
Figure 10. Annual counts of smuggling for the period 1982-1997.
Arsons (figure 11) show a rather fluctuating pattern. They increase from
1982 to 1983 to decrease in 1984, and suddenly they blast off at 306 offenses
in 1985, increased by 209% since 1982 (218.75% since 1984). During the
next two years, 1986-1987, they decrease again to make a new impressive
jump to 511 offenses in 1988, increased by 185.47% in one year, resulting in
a 416.16% increase since 1982. Fortunately, they decreased from 1988 to
1993 (with only a small upward in 1992) to 134 offenses (a 73.78% decrease
since 1988). The period from 1993 to 1997 they start increasing again to
reach the 212 offenses, which may be twice as many as in 1982, yet they are
less than half of the arsons reported in 1988.
Unfortunately, we have to mention that both jumps in reported arsons
coincide with similar jumps in reported arsons in forests (figure 12). While
the reported arsons in forests were 19 in 1982, they become 97 in 1985,
increased by 410.53% (with an increase of 288% in one year). Moreover, the
reported offenses were decreased in 46 in 1987 to jump at 135 in 1988,
increased by 610.53% since 1982. Hopefully from 1992 to 1997 they have
decreased (with only one upward in 1996) to reach the 16 reported arsons in
1997, decreased by 15.79% since 1982.

46
Arsons
1997
1996
1995
1994
1993
1992
1991
1990
1989
1988
1987
1986
1985
1984
1983
1982
600
500
400
300
200
100
0
Figure 11. Annual counts of arsons for the period 1982-1997.
Arsons in forests
1997
1996
1995
1994
1993
1992
1991
1990
1989
1988
1987
1986
1985
1984
1983
1982
160
140
120
100
80
60
40
20
0
Figure 12. Annual counts of arsons in forests for the period 1982-1997.
Murder has an almost steadily increasing pattern, without exceeding the
13% annual increase of 1988. As a result the reported murders are 350 in
1997, increased by 105.88% since 1982.
Homicide by misadventure (figure 13) shows a decreasing pattern since
1987 to increase from 1987 to 1989 and show a rather fluctuating pattern
since then. Hopefully, the reported homicides are 28 in 1997, decreased by
24.32% and 17.65% since 1982 and 1996 respectively.

47
Murder
1997
1996
1995
1994
1993
1992
1991
1990
1989
1988
1987
1986
1985
1984
1983
1982
400
300
200
100
Figure 13. Annual counts of murder for the period 1982-1997.
Homicide by misadventure
1997
1996
1995
1994
1993
1992
1991
1990
1989
1988
1987
1986
1985
1984
1983
1982
80
70
60
50
40
30
20
10
Figure 14. Annual counts of homicide by misadventure for the period 1982-1997.
Caused deaths by car (figure 15) have a pattern with small fluctuations,
although the increase rate since 1982 is always positive. Reported offenses
are 1561 in 1997, increased by 12.79% since 1982.
Furthermore, physical injuries by car (figure 16) show the most
fluctuating pattern with no certain trend. Reported car injuries are 21267 in
1997 just 1.82% increased since 1982. Nevertheless, keeping in mind that the
number of cars is also increasing one could probably expect that the increase
of the two last mentioned offenses would be higher. Thus, one can conclude
that either car drivers are very careful nowadays, or that cars’ safety
standards are higher than they used to be.

48
Killing of a person by car
1997
1996
1995
1994
1993
1992
1991
1990
1989
1988
1987
1986
1985
1984
1983
1982
1700
1600
1500
1400
1300
Figure 15. Annual counts of caused deaths by car for the period 1982-1997.
Physical injury by car
1997
1996
1995
1994
1993
1992
1991
1990
1989
1988
1987
1986
1985
1984
1983
1982
22000
21000
20000
19000
18000
Figure 16. Annual counts of physical injury by car for the period 1982-1997.
Simple, unprovoked and dangerous physical injuries (figure 17) show a
slightly fluctuating pattern with an increasing trend. There is a peak in 1994
when 7566 offenses were reported, although the highest increase was from
1987 to 1988 by 24% and 6688 reported offenses. Furthermore, reported
offenses were 6582 in 1997, increased by 34.38% since 1982, yet decreased
by 13% since 1988.
Caused deaths by car

49
Simple, unprovoked and dangerous physical injuries
1997
1996
1995
1994
1993
1992
1991
1990
1989
1988
1987
1986
1985
1984
1983
1982
8000
7000
6000
5000
4000
Figure 17. Annual counts of simple, unprovoked and dangerous physical injuries for the
period 1982-1997.
Physical injuries by misadventure (figure 18) have a quite fluctuating
pattern with a peak in 1983, when 665 offenses were reported, whereas only
186 offenses were reported in 1982. Thus there was a 257.73% increase in
one year. A second peak, although lower than the first one, is appeared in
1988. Reported offenses had been decreasing from 1983 to 1987 and jumped
to 251 offenses in 1988, increasing by 286.15% in one year. Then they
decrease again with an upward in 1992 to decrease again and turn again
upwards in 1994. The period from 1994 to 1997 they decrease to count only
87 reported offenses. Thus, there was a 53.23% decrease from 1982 to 1997.
Other physical injuries
1997
1996
1995
1994
1993
1992
1991
1990
1989
1988
1987
1986
1985
1984
1983
1982
700
600
500
400
300
200
100
0
Figure 18. Annual counts of physical injuries by misadventure for the period 1982-1997.

50
Cases of one taking the law into one’s own hands (figure 19) have been
increasing since 1982 with a few backwards to reach their peak in 1994 when
1149 offenses where reported, increased by 386.86%. The period from 1994
to 1996 they have decreased to 949 reported offenses. Finally, the reported
offenses were 985 in 1997, increased by 317.37% since 1982.
Cases of one taking the law into one’s own hands
1997
1996
1995
1994
1993
1992
1991
1990
1989
1988
1987
1986
1985
1984
1983
1982
1200
1000
800
600
400
200
0
Figure 19. Annual counts of cases of one taking the law into one’s own hands for the
period 1982-1997.
Larceny (figure 20) has an almost steadily increase since 1982, with two
small backwards in 1983 and in 1992. The reported offenses were 85070 in
1997, increased by 287.14% since 1982.
Larceny
1997
1996
1995
1994
1993
1992
1991
1990
1989
1988
1987
1986
1985
1984
1983
1982
100000
80000
60000
40000
20000
0
Figure 20. Annual counts of larceny for the period 1982-1997.

51
Robbery (figure 21) shows a fluctuating pattern especially since 1992.
There was a jump in 1988, when the reported robberies reached the 657,
showing a 126.55% increase since 1987. Reported offenses were 1967 in
1997, increased by 1357% since 1982.
Robbery
1997
1996
1995
1994
1993
1992
1991
1990
1989
1988
1987
1986
1985
1984
1983
1982
3000
2000
1000
0
Figure 21. Annual counts of robbery for the period 1982-1997.
Rape
1997199619951994199319921991199019891988
300
280
260
240
220
200
180
160
Figure 22. Annual counts of rape for the period 1988-1997.
As far as rape (figure 22) is concerned, we can only draw a picture from
1988 to 1997. This pattern has no obvious trend. Reported rapes show a peak
in 1992. The period from 1992 to 1996 they have been decreasing to increase
again in 1997 with 217 reported cases of rape, which, however, are still less
than 1982 by 9.58%.

52
4.2.2 Monthly data
An examination of the monthly data gives us a more detailed picture of
the crime activity. Monthly data is available for the period 1987-1997. All of
the offenses have rather fluctuating patterns with many of them indicating
seasonality.
Commonly dangerous crimes (figure 23), smuggling offenses (figure
24), arsons (figure 25), arsons in forests (figure 26) and homicide by
misadventure (figure 27) have similar patterns. They all have a peak
sometime in the period 1987-1989 and afterwards their fluctuations seem
random with an almost non-increasing pattern.
Commonly dangerous crimes
JUL 97
DEC 96
MAY 96
OCT 95
MAR 95
AUG 94
JAN 94
JUN 93
NOV 92
APR 92
SEP 91
FEB 91
JUL 90
DEC 89
MAY 89
OCT 88
MAR 88
AUG 87
JAN 87
200
100
0
Figure 23. Monthly counts of commonly dangerous crimes for the period 1987-1997
Smuggling Offenses
JUL 97
DEC 96
MAY 96
OCT 95
MAR 95
AUG 94
JAN 94
JUN 93
NOV 92
APR 92
SEP 91
FEB 91
JUL 90
DEC 89
MAY 89
OCT 88
MAR 88
AUG 87
JAN 87
120
100
80
60
40
20
0
Figure 24. Monthly counts of smuggling offenses for the period 1987-1997

53
Arsons
JUL 97
DEC 96
MAY 96
OCT 95
MAR 95
AUG 94
JAN 94
JUN 93
NOV 92
APR 92
SEP 91
FEB 91
JUL 90
DEC 89
MAY 89
OCT 88
MAR 88
AUG 87
JAN 87
160
140
120
100
80
60
40
20
0
Figure 25. Monthly counts of arsons for the period 1987-1997
Arsons in forests
JUL 97
DEC 96
MAY 96
OCT 95
MAR 95
AUG 94
JAN 94
JUN 93
NOV 92
APR 92
SEP 91
FEB 91
JUL 90
DEC 89
MAY 89
OCT 88
MAR 88
AUG 87
JAN 87
40
30
20
10
0
Figure 26. Monthly counts of arsons in forests for the period 1987-1997
Homicide by misadventure
JUL 97
DEC 96
MAY 96
OCT 95
MAR 95
AUG 94
JAN 94
JUN 93
NOV 92
APR 92
SEP 91
FEB 91
JUL 90
DEC 89
MAY 89
OCT 88
MAR 88
AUG 87
JAN 87
50
40
30
20
10
0
Figure 27. Monthly counts of homicide by misadventure for the period 1987-1997

54
Another group of offenses that seem to have similar patterns is that
consisting of property offenses (figure 28), beggary and vagrancy (figure 29),
illegal possession and usage of fire guns (figure 30), drug offenses (figure
31), larceny (figure 32) and robbery (figure 33). Their pattern is clearly
increasing. There might be seasonality but the trend of these offenses is the
most important characteristic in this case. They increase more rapidly after
1993-1994. All of the above-mentioned offenses, even drug offenses and
illegal possession of fire guns, involve wealth. Therefore, one would expect
that they should follow similar patterns.
Offenses against property
JUL 97
DEC 96
MAY 96
OCT 95
MAR 95
AUG 94
JAN 94
JUN 93
NOV 92
APR 92
SEP 91
FEB 91
JUL 90
DEC 89
MAY 89
OCT 88
MAR 88
AUG 87
JAN 87
10000
9000
8000
7000
6000
5000
4000
3000
2000
Figure 28. Monthly counts of property offenses for the period 1987-1997
Begarry and vagrancy
JUL 97
DEC 96
MAY 96
OCT 95
MAR 95
AUG 94
JAN 94
JUN 93
NOV 92
APR 92
SEP 91
FEB 91
JUL 90
DEC 89
MAY 89
OCT 88
MAR 88
AUG 87
JAN 87
200
100
0
Figure 29. Monthly counts of beggary and vagrancy for the period 1987-1997

55
At this point we should notice once more that the counts of beggary and
vagrancy have increased even after the abolishment of vagrancy in 1994. This
shows that the beggary was truly the offense with the rapid increase, which is
more related to the other offenses, probably indicating that the need for
money and the possible difficult in obtaining it after 1994 have led many
people either to stealing or to beggaring.
Illegal possession and usage of arms
JUL 97
DEC 96
MAY 96
OCT 95
MAR 95
AUG 94
JAN 94
JUN 93
NOV 92
APR 92
SEP 91
FEB 91
JUL 90
DEC 89
MAY 89
OCT 88
MAR 88
AUG 87
JAN 87
160
140
120
100
80
60
40
20
Figure 30. Monthly counts of illegal possession and usage of fire guns
for the period 1987-1997
Drug offenses
JUL 97
DEC 96
MAY 96
OCT 95
MAR 95
AUG 94
JAN 94
JUN 93
NOV 92
APR 92
SEP 91
FEB 91
JUL 90
DEC 89
MAY 89
OCT 88
MAR 88
AUG 87
JAN 87
800
700
600
500
400
300
200
100
0
Figure 31. Monthly counts of drug offenses for the period 1987-1997
fire guns

56
Larceny
JUL 97
DEC 96
MAY 96
OCT 95
MAR 95
AUG 94
JAN 94
JUN 93
NOV 92
APR 92
SEP 91
FEB 91
JUL 90
DEC 89
MAY 89
OCT 88
MAR 88
AUG 87
JAN 87
9000
8000
7000
6000
5000
4000
3000
2000
Figure 32. Monthly counts of larceny for the period 1987-1997
Robbery
JUL 97
DEC 96
MAY 96
OCT 95
MAR 95
AUG 94
JAN 94
JUN 93
NOV 92
APR 92
SEP 91
FEB 91
JUL 90
DEC 89
MAY 89
OCT 88
MAR 88
AUG 87
JAN 87
300
200
100
0
Figure 33. Monthly counts of robbery for the period 1987-1997
Another group of offenses shows periodically patterns. These offenses
are those against life (figure 34), physical injuries (figure 35), illegal
possession and usage of explosives (figure 36), caused deaths by car (figure
37), simple, unprovoked and dangerous physical injuries (figure 38), physical
injuries of a person by car (figure 39) and rape (figure 40). The patterns of
these offenses are characterized by periodicity rather than trend, although a
slight increase is present for most of them.

57
Offenses against life
JUL 97
DEC 96
MAY 96
OCT 95
MAR 95
AUG 94
JAN 94
JUN 93
NOV 92
APR 92
SEP 91
FEB 91
JUL 90
DEC 89
MAY 89
OCT 88
MAR 88
AUG 87
JAN 87
260
240
220
200
180
160
140
120
100
80
Figure 34. Monthly counts of offenses against life for the period 1987-1997
Physical Injuries
JUL 97
DEC 96
MAY 96
OCT 95
MAR 95
AUG 94
JAN 94
JUN 93
NOV 92
APR 92
SEP 91
FEB 91
JUL 90
DEC 89
MAY 89
OCT 88
MAR 88
AUG 87
JAN 87
4000
3000
2000
1000
Figure 35. Monthly counts of physical injuries for the period 1987-1997
Illegal possession and usage of explosives
JUL 97
DEC 96
MAY 96
OCT 95
MAR 95
AUG 94
JAN 94
JUN 93
NOV 92
APR 92
SEP 91
FEB 91
JUL 90
DEC 89
MAY 89
OCT 88
MAR 88
AUG 87
JAN 87
120
100
80
60
40
20
0
Figure 36. Monthly counts of illegal possession and usage of explosives
for the period 1987-1997

58
Non-negligent killing by car
JUL 97
DEC 96
MAY 96
OCT 95
MAR 95
AUG 94
JAN 94
JUN 93
NOV 92
APR 92
SEP 91
FEB 91
JUL 90
DEC 89
MAY 89
OCT 88
MAR 88
AUG 87
JAN 87
220
200
180
160
140
120
100
80
60
Figure 37. Monthly counts of caused deaths by car for the period 1987-1997
Simple, unprovoked and dangerous physical injuries
JUL 97
DEC 96
MAY 96
OCT 95
MAR 95
AUG 94
JAN 94
JUN 93
NOV 92
APR 92
SEP 91
FEB 91
JUL 90
DEC 89
MAY 89
OCT 88
MAR 88
AUG 87
JAN 87
900
800
700
600
500
400
300
Figure 38. Monthly counts of simple, unprovoked and dangerous physical injuries
for the period 1987-1997
Physical injuries of a person by car
JUL 97
DEC 96
MAY 96
OCT 95
MAR 95
AUG 94
JAN 94
JUN 93
NOV 92
APR 92
SEP 91
FEB 91
JUL 90
DEC 89
MAY 89
OCT 88
MAR 88
AUG 87
JAN 87
2600
2400
2200
2000
1800
1600
1400
1200
1000
Figure 39. Monthly counts of physical injuries of a person by car for the period 1987-1997
Caused deaths by car

59
Rape
JUL 97
DEC 96
MAY 96
OCT 95
MAR 95
AUG 94
JAN 94
JUN 93
NOV 92
APR 92
SEP 91
FEB 91
JUL 90
DEC 89
MAY 89
OCT 88
MAR 88
AUG 87
JAN 87
40
30
20
10
0
Figure 40. Monthly counts of rapes for the period 1988-1997
Other simple physical injuries (figure 41) show a rather fluctuating
pattern with no obvious seasonality or steadily increasing trend. They reach
high peaks for some months from March 1988 to May 1994 but they decrease
from that point on.
Other simple physical injuries
JUL 97
DEC 96
MAY 96
OCT 95
MAR 95
AUG 94
JAN 94
JUN 93
NOV 92
APR 92
SEP 91
FEB 91
JUL 90
DEC 89
MAY 89
OCT 88
MAR 88
AUG 87
JAN 87
80
60
40
20
0
Figure 41. Monthly counts of other simple physical injuries for the period 1987-1997
The cases of someone taking the law into one’s own hand (figure 42)
show a rather fluctuating pattern with a clearly increasing trend from 1987 to
May 1989, but only a slight increase after that, with no obvious seasonality.

60
Taking the law into one's hand
JUL 97
DEC 96
MAY 96
OCT 95
MAR 95
AUG 94
JAN 94
JUN 93
NOV 92
APR 92
SEP 91
FEB 91
JUL 90
DEC 89
MAY 89
OCT 88
MAR 88
AUG 87
JAN 87
140
120
100
80
60
40
20
0
Figure 42. Monthly counts of cases that one took the law into one’s hand
for the period 1987-1997
Offenses concerning antiquities (figure 43) reach their highest values
between April 1991 and April 1994, and they are decreasing since then.
Offenses concerning antiquities
JUL 97
DEC 96
MAY 96
OCT 95
MAR 95
AUG 94
JAN 94
JUN 93
NOV 92
APR 92
SEP 91
FEB 91
JUL 90
DEC 89
MAY 89
OCT 88
MAR 88
AUG 87
JAN 87
40
30
20
10
0
Figure 43. Monthly counts of offenses concerning antiquities for the period 1987-1997
Murders (figure 44) show a steadily increasing, yet too fluctuating,
pattern.

61
Murder
JUL 97
DEC 96
MAY 96
OCT 95
MAR 95
AUG 94
JAN 94
JUN 93
NOV 92
APR 92
SEP 91
FEB 91
JUL 90
DEC 89
MAY 89
OCT 88
MAR 88
AUG 87
JAN 87
50
40
30
20
10
0
Figure 44. Monthly counts of murders for the period 1987-1997
4.3 Principal Components Analysis
Given a set of n observations on p variables, the purpose of Principal
Components Analysis (PCA) is to determine r new variables, where r is small
relative to p. The r new variables called principal components must together
account for most of the variation in the p original variables. The components
are linear transformations of the original variables and are mutually
orthogonal. The principal components can be used to give an approximation
for the data matrix.
Both annual and monthly data were analyzed using Principal
Components Analysis. Its results can give us information about the
relationships of the behavior of the above-mentioned offenses through time.
As far as the annual data is concerned the time period under consideration is
from 1982 to 1997. Rape is excluded from this analysis since there are
available counts for rape only after 1988. Nevertheless, as far as the monthly
data is concerned, a PCA analysis can be employed to all crime-variables for
the time period from 1988 to 1997. In the following paragraphs we present the
results of the two PCA analyses.

62
4.3.1 PCA Analysis of the annual data
The PCA analysis of the annual data resulted in four interesting
uncorrelated components, which account for the 88.6% of the total variation.
In table 1 the percentages of variance explained by each of the four
components for the annual data are presented. The criterion used to determine
the number of components is the eigenvalue-one-criterion (see Jobson, 1992).
However, the scree test criterion (see Jobson, 1992) indicates that only three
components should be retained (figure 45).
Figure 45. Scree plot of the PCA analysis of the annual data
TABLE 1
Variance explained by the four most important components
of the annual data by PCA analysis
Component Total % of Variance Cumulative %
1 11.656 55.5 55.5
2 3.549 16.9 72.4
3 2.224 10.6 83.2
4 1.179 5.6 88.6
In table 2 the correlations between variables and the four principal
components from the corresponding correlation matrix are given.
For reasons of convenience the three largest positive correlations for
each component are green-colored whereas the three largest negative
correlations are red-colored.
63
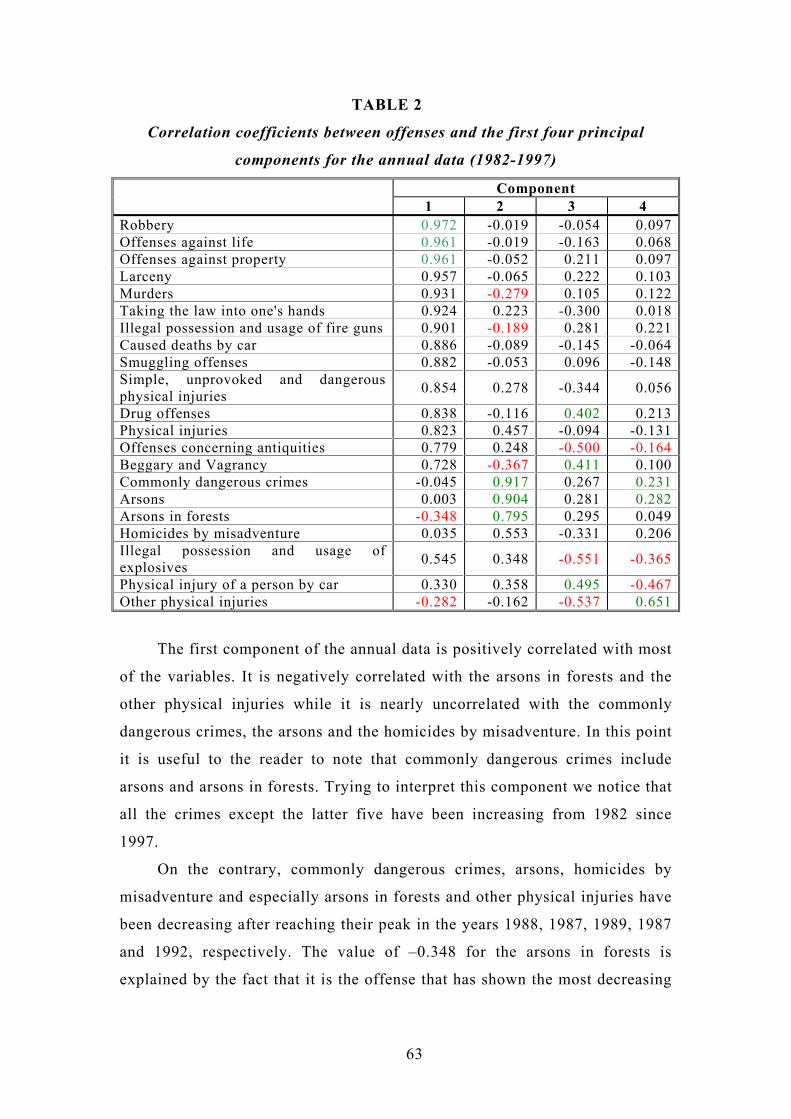
TABLE 2
Correlation coefficients between offenses and the first four principal
components for the annual data (1982-1997)
Component 1 2 3 4 Robbery 0.972 -0.019 -0.054 0.097Offenses against life 0.961 -0.019 -0.163 0.068Offenses against property 0.961 -0.052 0.211 0.097Larceny 0.957 -0.065 0.222 0.103Murders 0.931 -0.279 0.105 0.122Taking the law into one's hands 0.924 0.223 -0.300 0.018Illegal possession and usage of fire guns 0.901 -0.189 0.281 0.221Caused deaths by car 0.886 -0.089 -0.145 -0.064Smuggling offenses 0.882 -0.053 0.096 -0.148Simple, unprovoked and dangerous physical injuries
0.854 0.278 -0.344 0.056
Drug offenses 0.838 -0.116 0.402 0.213Physical injuries 0.823 0.457 -0.094 -0.131Offenses concerning antiquities 0.779 0.248 -0.500 -0.164Beggary and Vagrancy 0.728 -0.367 0.411 0.100Commonly dangerous crimes -0.045 0.917 0.267 0.231Arsons 0.003 0.904 0.281 0.282Arsons in forests -0.348 0.795 0.295 0.049Homicides by misadventure 0.035 0.553 -0.331 0.206Illegal possession and usage of explosives
0.545 0.348 -0.551 -0.365
Physical injury of a person by car 0.330 0.358 0.495 -0.467Other physical injuries -0.282 -0.162 -0.537 0.651
The first component of the annual data is positively correlated with most
of the variables. It is negatively correlated with the arsons in forests and the
other physical injuries while it is nearly uncorrelated with the commonly
dangerous crimes, the arsons and the homicides by misadventure. In this point
it is useful to the reader to note that commonly dangerous crimes include
arsons and arsons in forests. Trying to interpret this component we notice that
all the crimes except the latter five have been increasing from 1982 since
1997.
On the contrary, commonly dangerous crimes, arsons, homicides by
misadventure and especially arsons in forests and other physical injuries have
been decreasing after reaching their peak in the years 1988, 1987, 1989, 1987
and 1992, respectively. The value of –0.348 for the arsons in forests is
explained by the fact that it is the offense that has shown the most decreasing

64
pattern the last years. Thus, it is obvious that the first component of the
annual data measures the general increase of crime.
The second component of the annual data shows the higher correlations
with the commonly dangerous crimes, arsons, arsons in forests and homicide
by misadventure. Thus, it shows the higher correlations with the offenses that,
as mentioned before, have decreasing patterns from a breaking point after. On
the other hand, the absolute larger negative correlations appear with beggary,
premeditated murder and illegal possession of fire guns, which have been
steadily increasing and with an increasing rate. Therefore, the second
component of the annual data might be interpreted as an index of an offense
having a decreasing trend.
The third component of the annual data has the higher correlations,
although negative ones, with the illegal possession and usage of explosives,
other physical injuries and offenses concerning antiquities, whereas the
largest positive correlations, yet not too strong, are those with physical
injuries of a person by car, beggary and drug offenses. However, it is not
clear what this component represents.
The interpretation of the fourth component is even more difficult and it
will not be attempted.
The squares of the correlation coefficients given in table 3 describe the
portion of the total variance in an offense variable that is explained by the
principal component.

65
TABLE 3
Proportions of the variance explained by each of the first four principal
components and communalities for the annual data
Component 1 2 3 4
Communalities
Robbery 94.48% 0.04% 0.29% 0.94% 95,51%
Offenses against life 92.35% 0.04% 2.66% 0.46% 98,02%Offenses against property 92.35% 0.27% 4.45% 0.94% 98,00%Larceny 91.58% 0.42% 4.93% 1.06% 97,05%Murders 86.68% 7.78% 1.10% 1.49% 99,38%Taking the law into one's hands 85.38% 4.97% 9.00% 0.03% 97,53%Illegal possession and usage of fire guns 81.18% 3.57% 7.90% 4.88% 81,80%Caused deaths by car 78.50% 0.79% 2.10% 0.41% 81,19%Smuggling offenses 77.79% 0.28% 0.92% 2.19% 92,81%Simple, unprovoked and dangerous physical injuries 72.93% 7.73% 11.83% 0.31% 92,27%Drug offenses 70.22% 1.35% 16.16% 4.54% 91,22%Physical injuries 67.73% 20.88% 0.88% 1.72% 94,52%Offenses concerning antiquities 60.68% 6.15% 25.00% 2.69% 84,36%Beggary and Vagrancy 53.00% 13.47% 16.89% 1.00% 96,76%Commonly dangerous crimes 0.20% 84.09% 7.13% 5.34% 97,57%Arsons 0.00% 81.72% 7.90% 7.95% 84,26%Arsons in forests 12.11% 63.20% 8.70% 0.24% 45,90%Homicides by misadventure 0.12% 30.58% 10.96% 4.24% 85,50%Illegal possession and usage of explosives 29.70% 12.11% 30.36% 13.32% 70,02%Physical injury of a person by car 10.89% 12.82% 24.50% 21.81% 81,79%Other physical injuries 7.95% 2.62% 28.84% 42.38% 95,75%
The first component accounts for 94.48% 2[(0.972 ) 0.944784] of the
total variation in robbery variable. This is the largest (in absolute magnitude)
correlation coefficient between the first principal component and any of the
offenses; however, the first component explains the largest portion of the total
variation for the most of the offenses. The sum of squares of the four
correlation coefficients for each offense variable is the communality or
variance explained by the retained components (Jobson 1992). This adding is
allowable because the principal components are mutually uncorrelated. The

66
obtained communalities for the annual data given in table 3 show that the four
components together explain sufficiently the variation in the offenses, with an
exception for the arsons in forests, whose communality is only 45.90%.
The component scores for the four principal components are given in
table 4, and in figure 46 the scatter-plot of the component scores for the first
two principal components of the annual data is shown.
TABLE 4
Component Score Coefficient Matrix for the annual data
Component 1 2 3 4 Commonly dangerous crimes -0.004 0.258 0.120 0.196Offenses against life 0.082 -0.005 -0.073 0.058Physical injuries 0.071 0.129 -0.042 -0.111Offenses against property 0.082 -0.015 0.095 0.082Beggary and Vagrancy 0.062 -0.104 0.185 0.085Illegal possession and usage of fire guns 0.077 -0.053 0.126 0.187Illegal possession and usage of explosives 0.047 0.098 -0.248 -0.309Offenses concerning antiquities 0.067 0.070 -0.225 -0.139Drug offenses 0.072 -0.033 0.181 0.181Smuggling offenses 0.076 -0.015 0.043 -0.126Arsons 0.000 0.255 0.126 0.239Arsons in forests -0.030 0.224 0.133 0.042Murders 0.080 -0.079 0.047 0.103Homicides by misadventure 0.003 0.156 -0.149 0.174Caused deaths by car 0.076 -0.025 -0.065 -0.055Physical injury of a person by car 0.028 0.101 0.223 -0.396Taking the law into one's hands 0.079 0.063 -0.135 0.016Larceny 0.082 -0.018 0.100 0.088Robbery 0.083 -0.005 -0.024 0.083Simple, unprovoked and dangerous physical injuries 0.073 0.078 -0.155 0.048Other physical injuries -0.024 -0.046 -0.242 0.552

67
First component
,10,00-,10
Sec
ond
com
pone
nt
,3
0,0
-,3
Opi
Spi
roblar
law
Pic
kcr
hom
mur
forars
smgDro
antexp
arm
BV
Oap
Pi
Oal
Cdc
Figure 46. Scatter plot of component scores for the first two principal components of the annual data
4.3.2 PCA Analysis of the monthly data
The PCA analysis of the monthly data resulted in five important
components, which account for the 74.7% of the total variation. In table 5 the
percentages of variance explained by each of the five components for the
monthly data are presented. The criterion used to determine the number of
components is again the eigenvalue-one-criterion. However, as in the case of
the annual data, the scree test criterion indicates that only three components
should be retained (figure 47).

68
Figure 47. Scree plot of the PCA analysis of the monthly data
TABLE 5
Variance explained by the five most important components
of the monthly data by PCA analysis
Component Total % of Variance Cumulative %
1 6.536 29.7 29.7
2 5.203 23.6 53.4
3 2.377 10.8 64.2
4 1.285 5.8 70.0
5 1.042 4.7 74.7
In table 6 the correlation coefficients between variables and the five
principal components from the corresponding correlation matrix are given.
For reasons of convenience the three largest positive correlations for
each component are green-colored whereas the three largest negative
correlations are red-colored.
The first component of the monthly data is positively correlated with
most of the offenses (table 6), as in the analysis of the annual data. The
higher correlation coefficients are those of offenses against life, property,
larceny, murder, illegal possession of fire guns, non-negligent killing of a
person by car and drug offenses. In our attempt to interpret this component
we notice that these offenses are those who have a clear steadily increasing
pattern although fluctuation is present. The negative correlations of illegal
possession of explosives, homicide by misadventure and other physical
injuries can (as in the case of the annual data) be explained because of the

69
fact that these offenses have decreased the last few years (last months as
well). Hence, the first component of the monthly data can again be interpreted
as measuring the increase of crime activity.
TABLE 6
Correlation coefficients between offenses and the first five principal
components for the monthly data (1988-1997)
Component 1 2 3 4 5 Offenses against life 0.770 0.436 -0.165 -0.221 0.021Offenses against property 0.759 -0.557 0.219 0.009 -0.019Larceny 0.758 -0.557 0.215 0.010 -0.023Murders 0.757 -0.163 0.041 -0.003 -0.226Illegal possession and usage of fire guns 0.713 -0.507 0.241 0.134 0.054Caused deaths by car 0.700 0.488 -0.191 -0.197 -0.007Drug offenses 0.697 -0.413 0.395 0.013 0.084Physical injuries of a person by car 0.682 0.653 -0.028 -0.073 0.126Beggary and vagrancy 0.626 -0.253 0.073 0.242 0.284Taking the law into one's hand 0.512 0.244 -0.376 0.189 -0.120Smuggling Offenses 0.477 -0.304 -0.044 0.405 -0.058Arsons in forests -0.050 0.739 0.477 0.255 -0.079Commonly dangerous crimes -0.028 0.701 0.623 0.273 -0.029Physical Injuries 0.664 0.688 -0.097 -0.062 0.122Simple, unprovoked and dangerous physical injuries 0.578 0.633 -0.266 -0.051 0.153Total cases of rape 0.482 0.544 -0.352 0.124 -0.124Robbery 0.519 -0.531 -0.091 0.068 -0.153Offenses concerning antiquities -0.103 -0.016 -0.676 0.341 0.166Arsons -0.045 0.646 0.656 0.267 -0.042Illegal possession and usage of explosives -0.212 -0.138 -0.237 0.669 0.381Homicide by misadventure -0.136 0.140 0.137 -0.226 0.673Other simple physical injuries -0.181 0.333 -0.251 0.249 -0.392
The second component of the monthly data is highly correlated with the
commonly dangerous crimes, arsons in forests, physical injuries, arsons and
physical injuries of a person by car. All of these offenses have a very
fluctuating pattern, with evidence of seasonality. Arsons and arsons in forests,
which have decreased the last years, also have a periodical pattern in a

70
monthly base, with higher frequencies for the months June to October.
Moreover, it is negatively correlated with offenses that appear to have no
seasonality, such as offenses against property, larceny and robbery. Thus, the
second component of the monthly data might be interpreted as an index of
periodicity in crime activity.
The third component of the monthly data has the largest positive
correlations with arsons, commonly dangerous crimes and arsons in forests,
whereas the largest negative correlations appear with offenses concerning
antiquities, cases of one taking the law into one’s hand and rape. However, it
is difficult to find an interpretation of this component from these correlations.
The interpretation of the other components is even more difficult and it
will not be attempted.
The squares of the correlation coefficients given in table 7 describe the
portion of the total variance in an offense variable that is explained by each of
the principal components.
The first component accounts for 59.29% 2[(0.770 ) 0.5929] of the total
variation in offenses against life variable. This is the largest (in absolute
magnitude) correlation coefficient between the first principal component and
any of the offenses. As one can easily see from the values given in table 7, the
portions of variance explained by the first component for the monthly data are
not as high as in the case of the annual data. However, the communalities of
variance explained by the retained components, also given in table 7, show
that the five components together explain quite sufficiently the variation for
most of the offenses. The offenses with the smaller communalities are other
simple physical injuries (42.23%), smuggling offenses (48.93%), taking the
law into one's hand (51.32%), homicide by misadventure (56.09%) and
robbery (58.76%).

71
TABLE 7
Proportions of the variance explained by each of the first five principal
components and communalities for the monthly data
Component 1 2 3 4 5
Communalities
Offenses against life 59.29% 19.01% 2.72% 4.88% 0.04% 85.95%Offenses against property 57.61% 31.02% 4.80% 0.01% 0.04% 93.47%Larceny 57.46% 31.02% 4.62% 0.01% 0.05% 93.17%Murders 57.30% 2.66% 0.17% 0.00% 5.11% 65.24%Illegal possession and usage of fire guns 50.84% 25.70% 5.81% 1.80% 0.29% 84.44%Caused deaths by car 49.00% 23.81% 3.65% 3.88% 0.00% 80.35%Drug offenses 48.58% 17.06% 15.60% 0.02% 0.71% 81.96%Physical injuries of a person by car 46.51% 42.64% 0.08% 0.53% 1.59% 91.35%Beggary and vagrancy 39.19% 6.40% 0.53% 5.86% 8.07% 60.04%Taking the law into one's hand 26.21% 5.95% 14.14% 3.57% 1.44% 51.32%Smuggling Offenses 22.75% 9.24% 0.19% 16.40% 0.34% 48.93%Arsons in forests 0.25% 54.61% 22.75% 6.50% 0.62% 84.74%Commonly dangerous crimes 0.08% 49.14% 38.81% 7.45% 0.08% 95.57%Physical Injuries 44.09% 47.33% 0.94% 0.38% 1.49% 94.24%Simple, unprovoked and dangerous physical injuries 33.41% 40.07% 7.08% 0.26% 2.34% 83.15%Total cases of rape 23.23% 29.59% 12.39% 1.54% 1.54% 68.29%Robbery 26.94% 28.20% 0.83% 0.46% 2.34% 58.76%Offenses concerning antiquities 1.06% 0.03% 45.70% 11.63% 2.76% 61.17%Arsons 0.20% 41.73% 43.03% 7.13% 0.18% 92.27%Illegal possession and usage of explosives 4.49% 1.90% 5.62% 44.76% 14.52% 71.29%Homicide by misadventure 1.85% 1.96% 1.88% 5.11% 45.29% 56.09%Other simple physical injuries 3.28% 11.09% 6.30% 6.20% 15.37% 42.23%
The component scores for the four principal components are given in
table 8, and in figure 48 the scatter-plot of the component scores for the first
two principal components of the annual data is shown.

72
TABLE 8
Component Score Coefficient Matrixfor the monthly data
Component 1 2 3 4 5 Commonly dangerous crimes -0.004 0.135 0.262 0.212 -0.028Offenses against life 0.118 0.084 -0.070 -0.172 0.020Physical Injuries 0.102 0.132 -0.041 -0.049 0.117Offenses against property 0.116 -0.107 0.092 0.007 -0.018Beggary and vagrancy 0.096 -0.049 0.031 0.189 0.273Illegal possession and usage of fire guns 0.109 -0.097 0.101 0.104 0.052Illegal possession and usage of explosives -0.032 -0.027 -0.100 0.521 0.365Offenses concerning antiquities -0.016 -0.003 -0.284 0.266 0.159Drug offenses 0.107 -0.079 0.166 0.010 0.080Smuggling Offenses 0.073 -0.059 -0.019 .315 -0.056Arsons -0.007 0.124 0.276 0.208 -0.040Arsons in forests -0.008 0.142 0.201 0.199 -0.076Caused deaths by car 0.107 0.094 -0.080 -0.153 -0.007Homicide by misadventure -0.021 0.027 0.058 -0.176 0.646Simple, unprovoked and dangerous physical injuries 0.088 0.122 -0.112 -0.040 0.147Physical injuries of a person by car 0.104 0.125 -0.012 -0.057 0.121Other simple physical injuries -0.028 0.064 -0.106 0.194 -0.376Taking the law into one's hand 0.078 0.047 -0.158 0.147 -0.115Total cases of rape 0.074 0.105 -0.148 0.097 -0.119Murders 0.116 -0.031 0.017 -0.002 -0.216Larceny 0.116 -0.107 0.091 0.008 -0.022Robbery 0.079 -0.102 -0.038 0.053 -0.146

73
First component
,120,00-,12
Sec
ond
com
pone
nt
,2
0,0
-,2
rob lar
mur
rap
lawOpi
PicSpi
hom
kcr
forars
smgDro
ant
exp
arm
BV
Oap
Pi
Oal
Cdc
Figure 48. Scatter plot of component scores for the first two principal components of the monthly data
4.4 Clustering of the offenses according to their behavior
through time
Clustering methods can also be employed in order to classify the above-
mentioned offenses according to their behavior over the giving time period. In
this paragraph we will only give some hierarchical clustering methods (see
Everitt, 1993).
In order to determine the most appropriate number of clusters for the
data there are several stopping rules (objective criteria), which indicate where
to ‘cut’ the dendrogram (see Everitt, 1993, and Jobson 1992). For reasons of
simplicity, since these are only preliminary analyses, we will not get deeper
into the selection criteria. In order to obtain the appropriate number of
clusters we will use the scree-test criterion. A red line on the following
dendrograms indicates where one should ‘cut’ the dendrograms in order to get
the most representative partition for the data.

74
4.4.1 Annual data
The offenses used for the subsequent analyses are commonly dangerous
crimes, homicides by misadventure, physical injuries, illegal possession and
usage of explosives, offenses concerning antiquities, cases of one taking the
law into one’s hand, offenses against life, offenses against property, beggary
and vagrancy, illegal possession and usage of fire guns, drug offenses,
smuggling offenses, murder, larceny and robbery.
The methods that will be presented in this paragraph are the Complete
Linkage, the Centroid, and the Ward’s method.
Using Complete Linkage (figure 50) a three-cluster solution seems to be
more appropriate as the corresponding scree plot indicates (figure 49).
Figure 49. Scree plot of the clustering criterion for the annual data using Complete
Linkage method
The first cluster consists of commonly dangerous crimes and
homicides by misadventure.
The second cluster consists of offenses against life, offenses against
property, beggary and vagrancy, illegal possession and usage of fire
guns, drug offenses, smuggling offenses, murder, larceny and
robbery.
The third cluster consists of physical injuries, illegal possession
and usage of explosives, offenses concerning antiquities and the
cases of one taking the law into one’s hand.

75
take_
law
antiq
ui t
injur i
es
explos
iv
homici
de
commondru
gsarm
s
beggar
y
smug
gl
murder
larce
ny
pr ope
rty
r obb
eryl ife
1,29
0,86
0,43
0,00
Distance
Variables Figure 50. Dendrogram of the annual data using Complete Linkage method
Using Centroid Method (figure 52) we again obtain a three-cluster
solution as it derives from the corresponding scree plot (figure 51).
Figure 51. Scree plot of the clustering criterion for the annual data using Centroid method
The first cluster consists of commonly dangerous crimes.
The second cluster consists of homicides by misadventure.
The third cluster consists of offenses against life, offenses against
property, beggary and vagrancy, illegal possession and usage of fire
guns, drug offenses, smuggling offenses, murder, larceny, robbery,
physical injuries, illegal possession and usage of explosives,

76
offenses concerning antiquities and the cases of one taking the law
into one’s hand
common
homici
de li fe
robb
er y
take_
law
prope
rty
larce
nyarm
sdru
gs
murder
smuggl
begga
ry
injur i
es
explo
siv
antiq
ui t
0,00
0,24
0,47
0,71
Variables
Distance
Figure 52. Dendrogram of the annual data using Centroid method
Using Ward’s Method (figure 54) a three-cluster solution seems to be
more appropriate (see also the scree plot in figure 53).
Figure 53. Scree plot of the clustering criterion for the annual data using Ward’s method
The first cluster consists of commonly dangerous crimes and
homicides by misadventure.
The second cluster consists of offenses against life, offenses against
property, beggary and vagrancy, illegal possession and usage of fire

77
guns, drug offenses, smuggling offenses, murder, larceny and
robbery.
The third cluster consists of physical injuries, illegal possession
and usage of explosives, offenses concerning antiquities and the
cases of one taking the law into one’s hand.
take_
law
antiq
ui t
injur i
es
explos
iv
homici
de
common
smug
gl
murder
drugs
arms
larce
ny
pr ope
rty
r obb
er yl i fe
begga
ry
2,52
1,68
0,84
0,00
Distance
Variables Figure 54. Dendrogram of the annual data using Ward’s method.
The Complete Linkage and the Ward’s methods led to exactly the same
clustering of the annual offenses.
4.4.2 Monthly data
The method that will be presented for the monthly data is only the
Ward’s method, since the rest of the methods applied could not give a clear
cut of the dendrogram.
Using Ward’s Method (figure 56) a three-cluster solution seems to be
more appropriate (see also the corresponding scree plot in figure 55).

78
Figure 55. Scree plot of the clustering criterion for the monthly data using Ward’s method
smuggl
beggar
y
robb
er y
murder
drugs
arms
larce
ny
prope
rtyinj
_no
ki l l_n
oan
tiq
explo
s iv
for_a
rso
ar son
s
common
take_
lawrapes
sim_in
j
car_i
nj
injur i
es
car_k
i llli fe
4,70
3,14
1,57
0,00
Distance
Variables Figure 56. Dendrogram of the monthly data using Ward’s method
The first cluster consists of commonly dangerous crimes, illegal
possession and usage of explosives, offenses concerning antiquities,
arsons, arsons in forests, homicides by misadventure and other
physical injuries.
The second cluster consists of offenses against life, physical
injuries, killing of a person by car, simple, unprovoked and
dangerous physical injuries, physical injuries of a person by car,
cases of one taking the law into one’s hand and rape.

79
The third cluster consists of offenses against property, beggary and
vagrancy, illegal possession and usage of fire guns, drug offenses,
smuggling offenses, murder, larceny and robbery.
Further analyses are yet to be employed in order to obtain a more
detailed picture of the crime activity in Greece. So far we have only
commented on some analyses employed to crime counts per year or per
month. Employment of statistical analyses to crime counts per location will
determine the relationships between different types of offenses in certain
counties of Greece.

80