chapter 4 potassium management ver6 - nutrient … · chapter(4:(potassium(management(((|((3...
TRANSCRIPT
Chapter 4: Potassium Management
Agustin Pagani, Antonio P. Mallarino, and John E. Sawyer / Department of Agronomy, Iowa State University Developed in cooperation with Lara Moody, TFI; John Davis, NRCS; and Steve Phillips, IPNI. Funding provided by the USDA Natural Resources Conservation Service (USDA-NRCS) and the Fertilizer Institute (TFI).
Introduction Potassium (K) is abundant in most soils, but the vast majority is unavailable to plants. Plants require K for
photosynthesis; synthesis of ATP (an energy exchange compound), many carbohydrates, and proteins;
translocation of sugars, and nitrogen (N) fixation in legumes. Adequate K supply strengthens plant stalks
and stems, thus helping reduce lodging, and also increases resistance to several diseases through a variety
of mechanisms. Typical K-deficiency symptoms develop first in the older leaves and may consist of
yellow or white spots on the leaf edges (as in alfalfa, for example), chlorosis and necrosis of the leaf
edges (as in corn and soybean), or chlorosis of leaf tips (as in wheat).
When compared with other macronutrients, K total plant uptake is generally second only to N, and in
some crops such as sugar beets and potatoes K uptake exceeds N uptake. Annual K removal from fields
depends greatly on the plant part harvested, crop, and yield level; and ranges from 50 to 500 lb K2O/acre.
Table 1 shows an example of guidelines concerning K concentration per unit of yield for several crops.
Commercial K fertilizer analysis has historically been expressed as the oxide form (K2O) rather than the
elemental form (K). Therefore K uptake and removal values are usually expressed as K2O per unit of
yield. Using the ratio of their molecular weights, the amount of K2O can be converted to K by dividing by
1.2. To estimate K2O uptake, multiply the yield by the amount in the table per unit of crop yield
harvested.
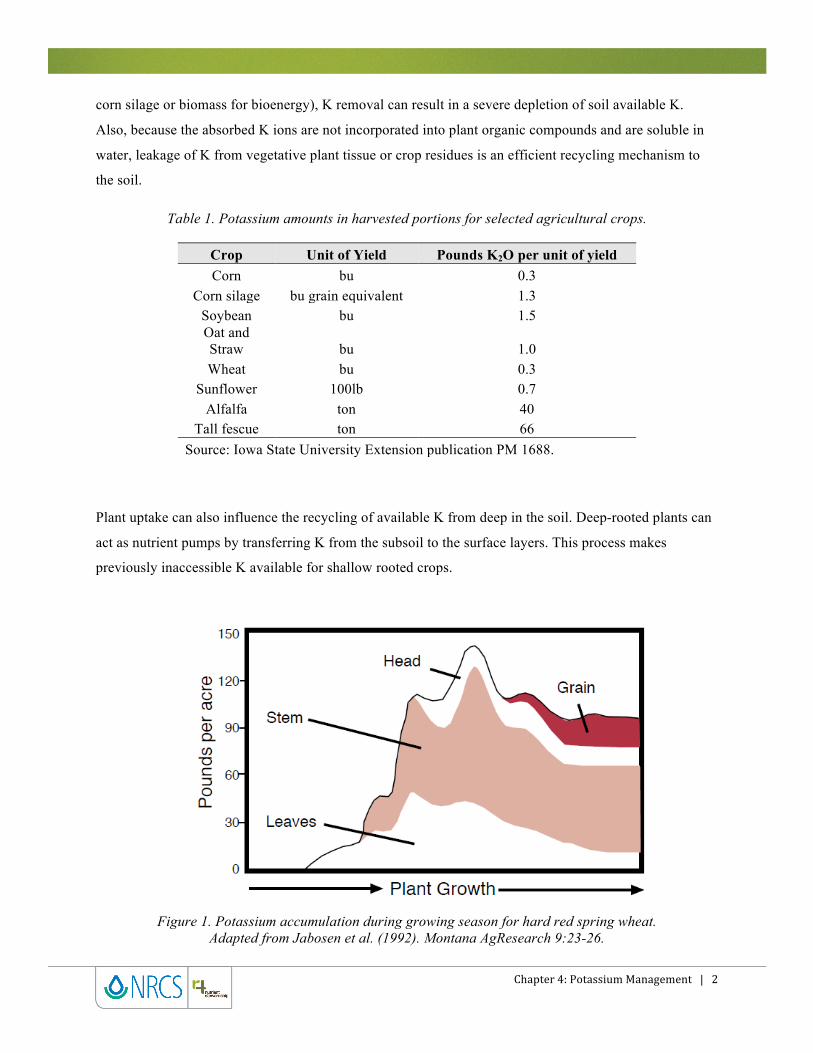
In contrast to phosphorus (P), the K concentration and removal with grain harvest of cereals is a much
smaller proportion of the total plant uptake. Most grain crops reach the maximum K uptake before
physiological maturity, and the total K contained in aboveground plant parts can even decrease by grain
maturity. Figure 1 shows, as an example, the total K uptake by wheat and its distribution among plant
parts during the growing season. Therefore, if most of the plant material is removed at harvest (such as for
Chapter 4: Potassium Management | 2
corn silage or biomass for bioenergy), K removal can result in a severe depletion of soil available K.
Also, because the absorbed K ions are not incorporated into plant organic compounds and are soluble in
water, leakage of K from vegetative plant tissue or crop residues is an efficient recycling mechanism to
the soil.
Table 1. Potassium amounts in harvested portions for selected agricultural crops.
Crop Unit of Yield Pounds K2O per unit of yield Corn bu 0.3
Corn silage bu grain equivalent 1.3 Soybean bu 1.5 Oat and Straw bu 1.0 Wheat bu 0.3
Sunflower 100lb 0.7 Alfalfa ton 40
Tall fescue ton 66 Source: Iowa State University Extension publication PM 1688.
Plant uptake can also influence the recycling of available K from deep in the soil. Deep-rooted plants can
act as nutrient pumps by transferring K from the subsoil to the surface layers. This process makes
previously inaccessible K available for shallow rooted crops.
Figure 1. Potassium accumulation during growing season for hard red spring wheat. Adapted from Jabosen et al. (1992). Montana AgResearch 9:23-26.
Chapter 4: Potassium Management | 3
Potassium application and management does not result in water quality concerns as with N and P. An
understanding of K reactions in soils, cycling, and availability for crop is important to improve K use
efficiency, to meet crop K needs in a profitable way, and to help with K management decisions.
Potassium Processes in the Soil-Plant System Forms of Soil Potassium The vast majority of soil K is contained in unweathered primary minerals such as feldspars and micas
(muscovite, biotite, and others). The top layer of most soils contains thousands of ppm of mineral K, but
the K in the crystal structure of these minerals is released very slowly over dozens or hundreds of years
and has no relevance for crop nutrition. Other soil K pools include dissolved K+ ions (solution K),
exchangeable K, and slowly exchangeable K (often referred to as nonexchangable K in textbooks).
Readily plant-available K includes the solution and exchangeable K fractions, and there is a fast
equilibrium between these two fractions in response to K additions and plant uptake or leaching. The
exchangeable K fraction contains hydrated K+ ions weakly sorbed to the negatively charged surfaces of
mineral soil particles and organic matter, and can rapidly replenish the solution K pool as K is taken up by
plants. Plants can only directly use K from the soil solution, yet solution K concentrations range from
only 1 to 10 ppm except shortly after fertilization, and the exchangeable K fraction in U.S. soils may
range from about 20 to 1,000 ppm. The slowly exchangeable K is held within clay layers by stronger
bonds and is not readily exchangeable or available to plants in the short term (days or weeks). In soils of
the U.S., the amount of K held in this fraction varies greatly, and may range from about 100 up to 2,000
ppm.
Potassium Exchange and Reactions in Soils When solution K is depleted due to plant uptake or leaching, K desorbs from the soil particles and enters
the solution. When the amount of solution K is increased by fertilization or K leaching from crop
residues, added K will also be held on the soil exchange capacity (CEC) sites. Fine-textured soils with
high CEC generally have large exchangeable K concentrations and a strong capacity to maintain a
sufficient K supply to the soil solution and for plant uptake throughout the growing season. Low CEC
soils often lack the capacity to sorb sufficient K reserves to satisfy crop requirements over a growing
season.
Exchange reactions involving the slowly exchangeable K fraction are important in the long term (weeks
to years), and can dominate processes affecting the long-term crop availability of K mainly in soils with
Chapter 4: Potassium Management | 4
predominant mica (illite) or vermiculite clay types. A portion of the K in this fraction may become plant
available during the growing season and over the years; conversely, some added K may become strongly
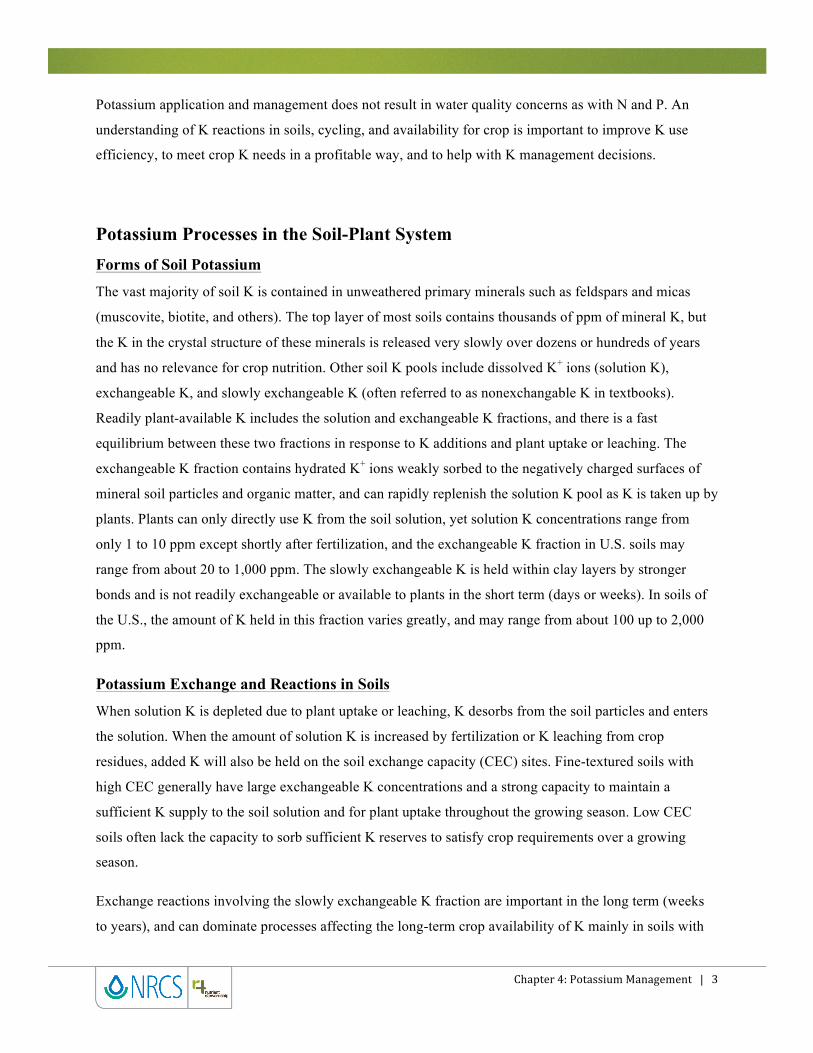
retained and nonexchangeable. Both processes are highly influenced by the opening (peeling apart) and
closing of sheet-like clay crystal structures near fracture borders in response to drying-wetting, freezing-
thawing, changes in soil aeration, or long-term weathering (Figure 2).
Figure 2. The opening and closing of layered clay minerals releases K into solution and also can retain K in a form that may be unavailable to plants. Adapted from McLean (1978), Potassium in Soils and Crops.
Potassium retention and release by clay, and its availability to plants can be affected by soil pH. As the
pH increases (i.e., with increased lime application, for example) in very acid soils having exchangeable
aluminum (Al), which are common in the southern and southeast regions of the U.S., the soil capacity to
retain K (and added calcium) in an exchangeable form increases mainly because the liming transforms
exchangeable Al into insoluble forms. In acid soils without exchangeable Al, the effect of a pH increase is
less clear concerning availability to plants. As the pH increases due to liming, the soil CEC is increased
and H+ ions are removed from cation exchange sites, and more exchange sites are available for holding K+
and calcium ions (Ca2+) in an exchangeable form. However, high amounts of Ca2+ can reduce crop uptake
of K, and the pH increase can cause the collapse of expanded clay layers and trapping of K ions in the
non-exchangeable form.
Soils with high K-fixing capacity typically show a smaller soil-test K (STK) response to fertilizer
application than other soils because a portion of the supplied K can quickly bind to clays in a
nonexchangeable form. A soil with high K-retention capacity will generally be capable of sustaining
available K levels to a crop over many years of production, thereby buffering the crop removal of K. This
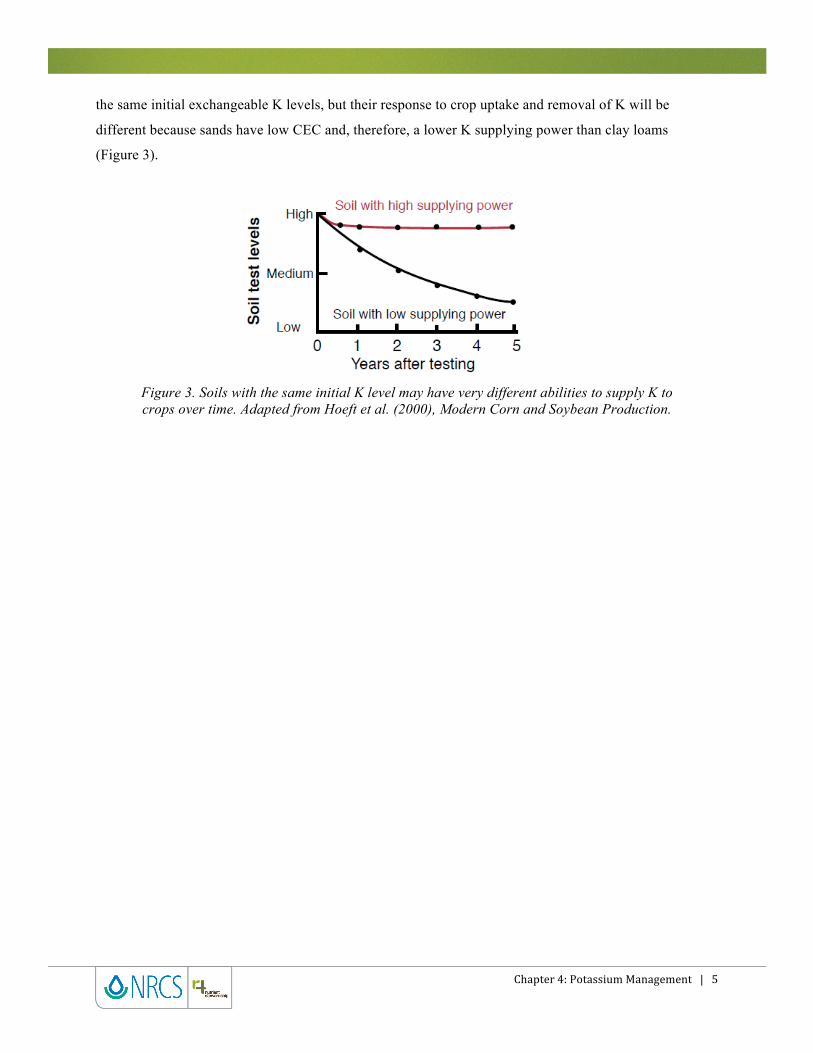
property has been called the ‘K supplying power’ of a soil. A sandy soil and a clay loam soil may have
Chapter 4: Potassium Management | 5
the same initial exchangeable K levels, but their response to crop uptake and removal of K will be
different because sands have low CEC and, therefore, a lower K supplying power than clay loams
(Figure 3).
Figure 3. Soils with the same initial K level may have very different abilities to supply K to crops over time. Adapted from Hoeft et al. (2000), Modern Corn and Soybean Production.
Chapter 4: Potassium Management | 6
Potassium: A Relatively Immobile Nutrient As a result of K exchange reactions and retention in soils, K moves only short distances through soil and
only slightly more than P. The amount of K that reaches the root surface with water mass flow is not
sufficient to supply plant needs, and K ion diffusion through the soil solution is the main mechanism of
plant K uptake. This characteristic has several important consequences. Factors that limit the rate of K
diffusion and both the rate of root growth and the size of the root system can limit K uptake. These
include cold temperature and low moisture (which limit diffusion and root growth), soil physical
properties that inhibit root growth, and diseases or pests that impair root function. Therefore, induced K
deficiency may occur even with presumably adequate soil-test K levels. In these situations, placement that
puts applied K near young plant roots may increase plant growth and yield compared with broadcast
application.
The amount of K loss with leaching through the soil profile is much less than K loss with erosion and
surface runoff in most soils and landscapes. In coarse-textured soils or in moderately textured soils with
sustained high K applications, K can move through the profile and increase subsoil K concentrations or
leach to groundwater or surface waters through subsurface tile drainage. Therefore, although K does
constitute a water quality problem, minimizing soil erosion and excess application to coarse textured soils
will help maximize K utilization by crops.
Chapter 4: Potassium Management | 7
Potassium Soil Testing The primary goal of soil testing for K is to estimate the supply of K available to a crop. Solution and
exchangeable K are the most important forms for plant growth, but the estimate of exchangeable K is far
more important than the solution K fraction. The STK methods used in the U.S. measure solution K and
most of the exchangeable K. The most widely used methods extract K with the ammonium acetate and the
Mehlich-3 methods, but a few states use the Bray-P1, Morgan, or Mehlich-1. In contrast to P, the
measurement of extracted K can be done by various laboratory procedures that give the same result Only
the top six to eight inches of soil is generally tested for K because the surface soil is the most significant
source of K for most plants, although in a few states a shallower sampling depth is recommended for
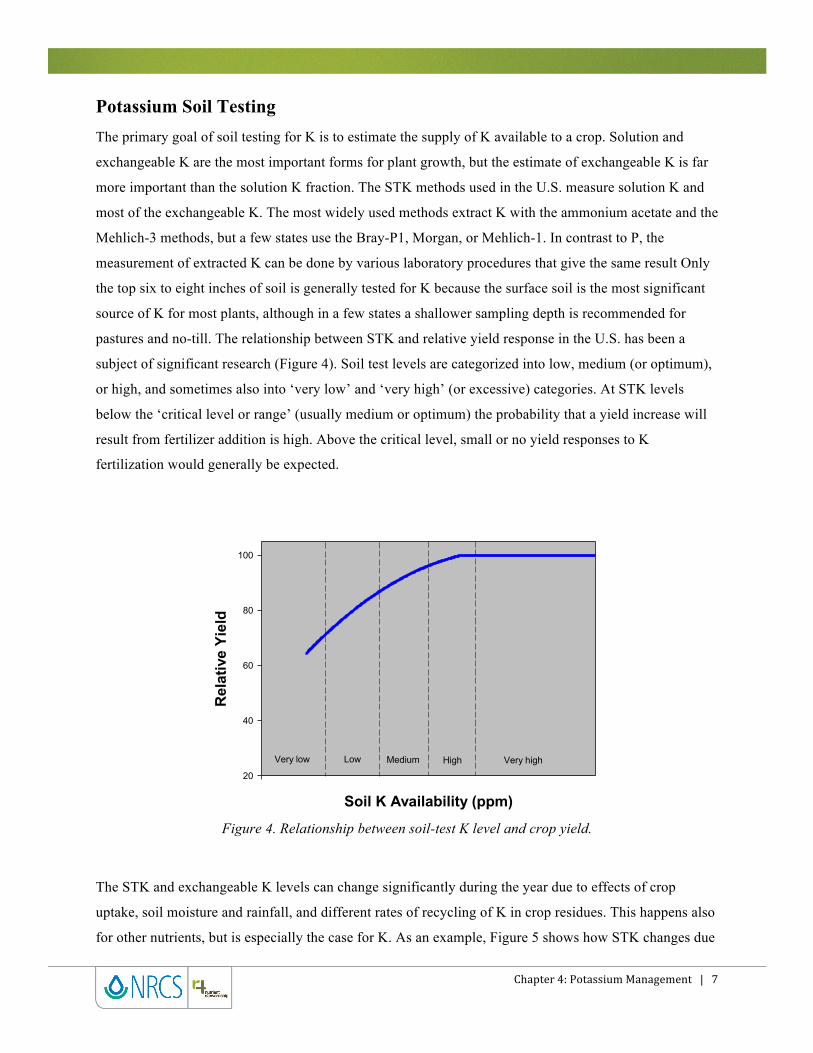
pastures and no-till. The relationship between STK and relative yield response in the U.S. has been a
subject of significant research (Figure 4). Soil test levels are categorized into low, medium (or optimum),
or high, and sometimes also into ‘very low’ and ‘very high’ (or excessive) categories. At STK levels
below the ‘critical level or range’ (usually medium or optimum) the probability that a yield increase will
result from fertilizer addition is high. Above the critical level, small or no yield responses to K
fertilization would generally be expected.
Soil K Availability (ppm)
Rel
ativ
e Yi
eld
20
40
60
80
100
Very low Very highLow HighMedium
Figure 4. Relationship between soil-test K level and crop yield.
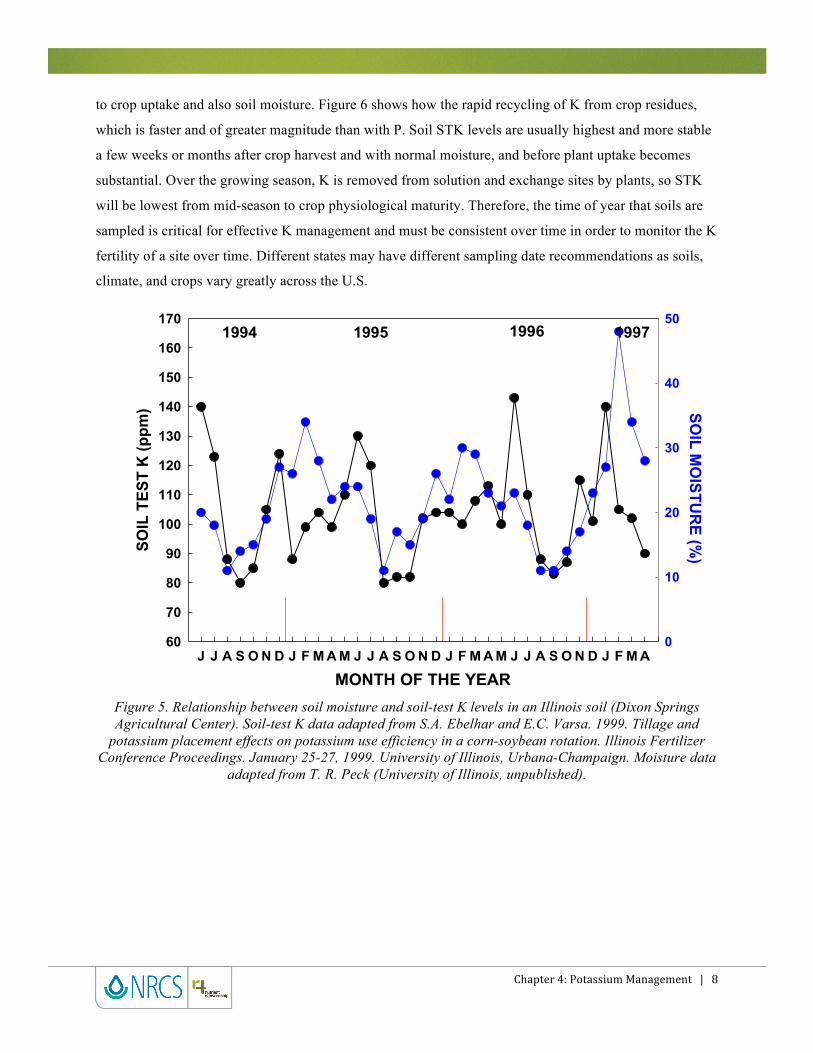
The STK and exchangeable K levels can change significantly during the year due to effects of crop
uptake, soil moisture and rainfall, and different rates of recycling of K in crop residues. This happens also
for other nutrients, but is especially the case for K. As an example, Figure 5 shows how STK changes due
Chapter 4: Potassium Management | 8
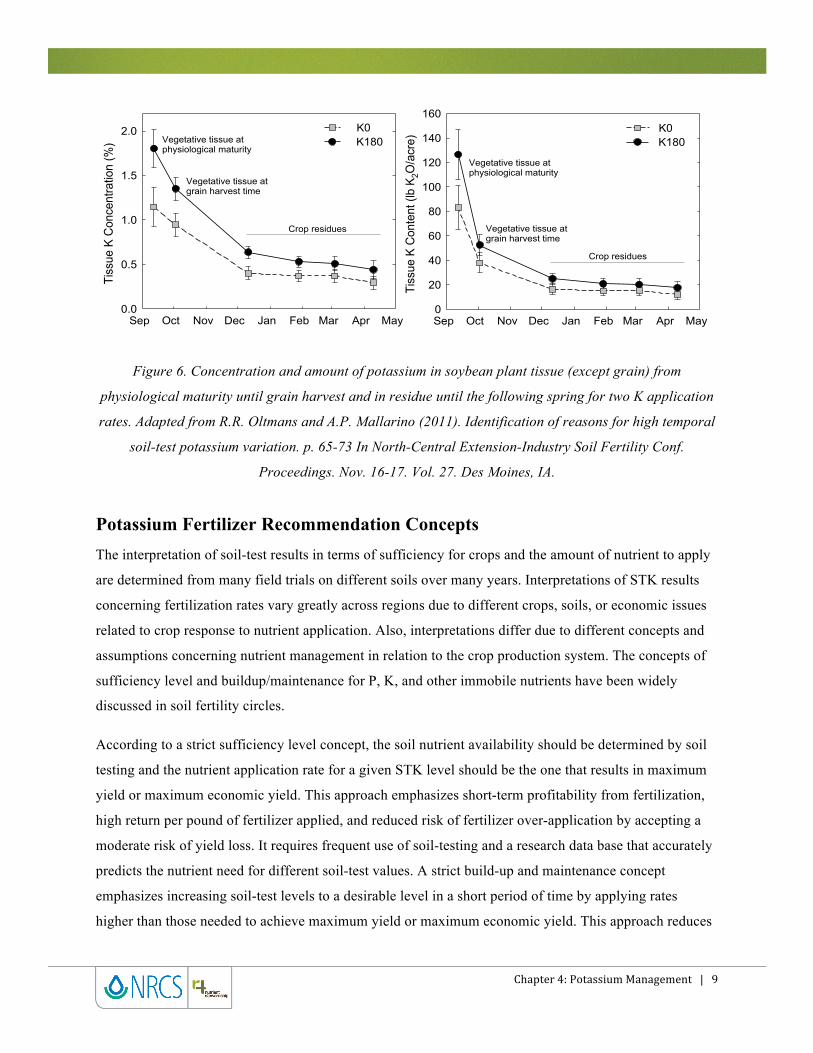
to crop uptake and also soil moisture. Figure 6 shows how the rapid recycling of K from crop residues,
which is faster and of greater magnitude than with P. Soil STK levels are usually highest and more stable
a few weeks or months after crop harvest and with normal moisture, and before plant uptake becomes
substantial. Over the growing season, K is removed from solution and exchange sites by plants, so STK
will be lowest from mid-season to crop physiological maturity. Therefore, the time of year that soils are
sampled is critical for effective K management and must be consistent over time in order to monitor the K
fertility of a site over time. Different states may have different sampling date recommendations as soils,
climate, and crops vary greatly across the U.S.
MONTH OF THE YEARJ J A S O N D J F M A M J J A S O N D J F M A M J J A S O N D J F M A
SOIL
TES
T K
(ppm
)
60
70
80
90
100
110
120
130
140
150
160
170
SOIL M
OISTU
RE (%
)
0
10
20
30
40
501994 199719961995
Figure 5. Relationship between soil moisture and soil-test K levels in an Illinois soil (Dixon Springs Agricultural Center). Soil-test K data adapted from S.A. Ebelhar and E.C. Varsa. 1999. Tillage and
potassium placement effects on potassium use efficiency in a corn-soybean rotation. Illinois Fertilizer Conference Proceedings. January 25-27, 1999. University of Illinois, Urbana-Champaign. Moisture data
adapted from T. R. Peck (University of Illinois, unpublished).
Chapter 4: Potassium Management | 9
Sep Oct Nov Dec Jan Feb Mar Apr May
Tiss
ue K
Con
cent
ratio
n (%
)
0.0
0.5
1.0
1.5
2.0
Sep Oct Nov Dec Jan Feb Mar Apr May
Tiss
ue K
Con
tent
(lb
K 2O
/acr
e)
0
20
40
60
80
100
120
140
160
Vegetative tissue atgrain harvest time
Crop residues
Vegetative tissue atphysiological maturity
Vegetative tissue atgrain harvest time
Crop residues
Vegetative tissue atphysiological maturity
K180K0
K180K0
Figure 6. Concentration and amount of potassium in soybean plant tissue (except grain) from
physiological maturity until grain harvest and in residue until the following spring for two K application
rates. Adapted from R.R. Oltmans and A.P. Mallarino (2011). Identification of reasons for high temporal
soil-test potassium variation. p. 65-73 In North-Central Extension-Industry Soil Fertility Conf.
Proceedings. Nov. 16-17. Vol. 27. Des Moines, IA.
Potassium Fertilizer Recommendation Concepts The interpretation of soil-test results in terms of sufficiency for crops and the amount of nutrient to apply
are determined from many field trials on different soils over many years. Interpretations of STK results
concerning fertilization rates vary greatly across regions due to different crops, soils, or economic issues
related to crop response to nutrient application. Also, interpretations differ due to different concepts and
assumptions concerning nutrient management in relation to the crop production system. The concepts of
sufficiency level and buildup/maintenance for P, K, and other immobile nutrients have been widely
discussed in soil fertility circles.
According to a strict sufficiency level concept, the soil nutrient availability should be determined by soil
testing and the nutrient application rate for a given STK level should be the one that results in maximum
yield or maximum economic yield. This approach emphasizes short-term profitability from fertilization,
high return per pound of fertilizer applied, and reduced risk of fertilizer over-application by accepting a
moderate risk of yield loss. It requires frequent use of soil-testing and a research data base that accurately
predicts the nutrient need for different soil-test values. A strict build-up and maintenance concept
emphasizes increasing soil-test levels to a desirable level in a short period of time by applying rates
higher than those needed to achieve maximum yield or maximum economic yield. This approach reduces
Chapter 4: Potassium Management | 10
the risk of yield loss due to insufficient nutrient levels and emphasizes long-term productivity and
profitability from fertilization. It may not require frequent soil testing or accurate soil-test calibration, but
requires knowledge of fertilizer rates needed to maintain soil-test values over time, which usually is based
on measured or estimated K removal with crop harvest. A short-term yield response or profit to
maintenance fertilization usually is not expected.
The soil test interpretation and fertilizer recommendation systems used across the U.S. seldom strictly
follow these two concepts. For example, recommendations by the University of Illinois are closer to the
buildup/maintenance concept, those in Minnesota are closer to the sufficiency level concept, and those in
Kansas provide recommendations for both concepts. The main reason that allows the use of the buildup
and maintenance approach for K is that many soils retain applied K but do not “fix” it in forms
unavailable for crops, and this allows for both buildup and drawdown as management options within the
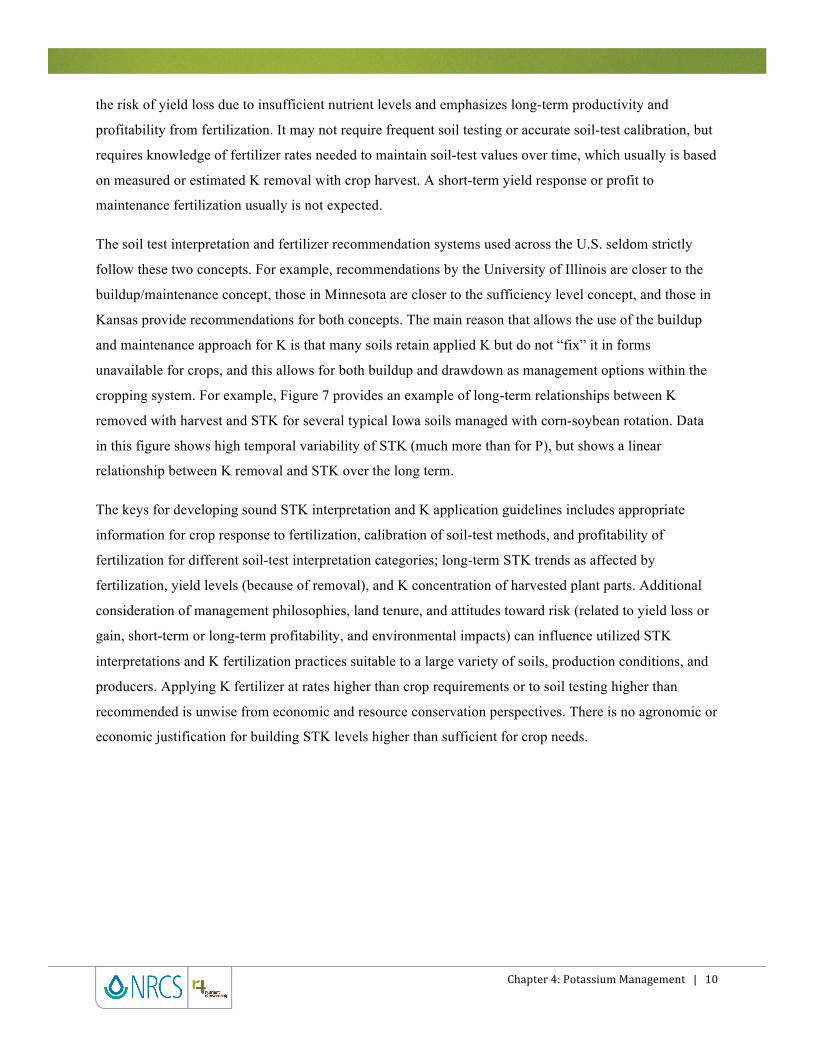
cropping system. For example, Figure 7 provides an example of long-term relationships between K
removed with harvest and STK for several typical Iowa soils managed with corn-soybean rotation. Data
in this figure shows high temporal variability of STK (much more than for P), but shows a linear
relationship between K removal and STK over the long term.
The keys for developing sound STK interpretation and K application guidelines includes appropriate
information for crop response to fertilization, calibration of soil-test methods, and profitability of
fertilization for different soil-test interpretation categories; long-term STK trends as affected by
fertilization, yield levels (because of removal), and K concentration of harvested plant parts. Additional
consideration of management philosophies, land tenure, and attitudes toward risk (related to yield loss or
gain, short-term or long-term profitability, and environmental impacts) can influence utilized STK
interpretations and K fertilization practices suitable to a large variety of soils, production conditions, and
producers. Applying K fertilizer at rates higher than crop requirements or to soil testing higher than
recommended is unwise from economic and resource conservation perspectives. There is no agronomic or
economic justification for building STK levels higher than sufficient for crop needs.
Chapter 4: Potassium Management | 11
Gra
in K
Rem
oval
(lb
K 2O/a
cre)
-400
-300
-200
-100
0
125
175
225
275
-500
-400
-300
-200
-100
0
80
100
120
140
160
-400
-300
-200
-100
0
100
125
150
175
200
-500
-400
-300
-200
-100
0 Soil-Test K (ppm
)100
120
140
160
1994 1996 1998 2000 2003-500
-400
-300
-200
-100
0
150
175
200
225
250
NERF NIRF
NWRF SERF
SWRF
1994 1996 1998 2000 2003-500
-400
-300
-200
-100
0
120
140
160
180
200AVG
STKSTK
CornCornSoybean Soybean
STK
STK
STK
STK
Figure 7. Soil-test K and cumulative K removal long-term trends for five Iowa sites and the average.
From Mallarino et al. (2011). Factors determining high temporal soil-test potassium variation and soil
sampling and testing alternatives. In Proceedings, North Central Region Soil and Plant Analyst
Workshop. Feb. 23-24, 2011. Bettendorf, IA. Available at http://ncera-13.missouri.edu/publications.htm.
Fertilizer and Manure Potassium Management
Potassium Sources
Potassium fertilizer is available commercially mainly as potassium chloride (KCl, 0-0-60), potassium
sulfate (K2SO4, 0-0-50), and potassium nitrate (KNO3, 13-0-44). The potassium is all water soluble for
these sources. These sources (especially potassium nitrate) have the potential for inhibiting plant growth
due to salt effects (the plant cannot get enough water from the soil) if applied in excess and close
proximity or with the seed. Potassium chloride accounts for over 95% of all K fertilizer sold in the U.S.
because it is mined from raw KCl deposits, and minimal processing and transportation make this the most
economic K source. Potassium sulfate is primarily used where Cl toxicity or sulfur (S) deficiency is a
problem. Potassium nitrate also is a source of N, but is expensive and is widely used only for foliar sprays
of K application to fruits and vegetables.
Chapter 4: Potassium Management | 12
Potassium in organic sources, manures and sewage sludge, occurs predominantly as soluble inorganic K+
and is readily available for crop uptake. In animal manures, the K concentration ranges between 0.2 and
2% of dry matter, so large application rates are required to meet crop needs.
Placement Method and Timing There are many ways of applying K to crops and most considerations, except potential salt effects, are
similar to those for P fertilizers. Band applications concentrate nutrients at or near the root zone, which is
important for young plants with limited root systems, particularly in cold and/or compacted soils. The
"starter" effect from K is much less than for N and P, however, and too much K fertilizer close to the seed
can reduce seed germination and injure roots due to high salt concentrations. Band K should be placed
beside and below the seed level to reduce potential damage or by using very low rates if it is applied to
the seed furrow. Band K applications can be more effective than broadcast application in soils with a
strong capacity to retain added K in forms of low plant availability. This may be the case in soils with
very high clay content or soils with significant levels of vermiculate in the clay fraction. Otherwise, and
in most regions, broadcasting K fertilizer before planting is a convenient and low-cost way for applying
high amounts of K fertilizer. Research with corn, mainly in Iowa and Minnesota, has shown that deep
banding of K can be more effective than other placement methods, especially for ridge-till and sometimes
for no-tillage and strip-tillage. The research demonstrated that the cause of increased efficiency of this
method does not necessarily relate only to STK stratification typical for these systems, and that is
explained by water availability deeper in the soil profile when the top few inches of soil are dry.
With the exception of regions that have soils with very high K retention capacity, the timing of K
application before planting has little or no impact on K use efficiency by crops. This fact justifies, for
example, widespread K application in the fall for summer crops in the Corn Belt and the Great Plains, and
also application every other year for some rotations. In soils that retain or transform a significant
proportion of applied K into forms of low crop availability, however, application long in advance of crop
growth may reduce K use efficiency and often there are large differences between placement methods
(less efficiency with broadcast and incorporated application, for example).
Variable Rate Potassium Application Dense soil sampling in many fields has shown very large within-field spatial variability of STK, crop
yield levels, and crop response to K fertilization. Figure 8 shows an example of the variation in corn yield
response to K fertilization for field areas 10 to 25 acres in size that had different STK values. Precision

Chapter 4: Potassium Management | 13
agriculture technologies available to producers or custom fertilizer applicators facilitate application of
fertilizer and manure at rates adequate for different parts of a field based on STK and estimated K
removal. Grid or zone soil sampling methods, combined with variable rate application of fertilizer or
manure K, may not always increase crop yield or increase profits compared with traditional uniform rate
application, because the average fertilization effect on yield and amount of K applied depends on the
overall level and distribution of STK values. Also, soil testing seldom is performed on an annual basis,
there is always a certain degree of sampling error (especially in fields with high small-scale variability),
and research has shown that short-term relationships between K removal and STK are very variable.
Therefore, even with annual soil sampling and variable-rate application, use of this technology faces
challenges for K management. However, variable-rate application of K fertilizer minimizes or avoids K
application to high-testing areas within fields, reduces STK variability, and as a consequence, improves K
use efficiency. Variable rate application of K fertilizer is now common in the Great Plains and Corn Belt.
Cor
n Yi
eld
Incr
ease
(bu/
acre
)
0
10
20
30
40
50
60
70
80
OH
L
O
VL
L
O
VL
OH
Field 4 Field 6
Field 3
Field 5Field 2O
H
Field 1
LO
VL
L
Field 7 Field 8
VL VLVL
VL
L
L
LL
H HO
L = 91 to 130O = 131 to 170H = 171 to 200
VL < 90 ppmSoil K Classes
Figure 8. Within-field soil-test K variability and yield response variability from eight representative strip
trials conducted in Iowa (field identifiers are arbitrary codes). From A.P. Mallarino and D.J. Wittry
(2006). Variable-rate application for phosphorus and potassium: impacts on yield and nutrient
management. p.219-224. In The Integrated Crop Management Conf. Proceedings. Nov. 29-30, 2006.
Iowa State Univ. Extension. Available at
http://www.agronext.iastate.edu/soilfertility/info/mallarino_Variable-PK%202.pdf
Chapter 4: Potassium Management | 14
Summary
Effective K management requires not only a thorough understanding of K reactions in the soil, but also an
awareness of how climate, aeration, and moisture can affect the capacity of a plant to access the large
reserves of soil K. Potassium exists in large, albeit finite amounts in soils, but the readily available forms
can be depleted during short period of high crop demand or over long-term crop production.
Proper management of K is essential to maximize the profitability of crop production as well as maximize
the efficiency of a non-renewable resource. Potassium management, as well as P management, is
somewhat simpler than for N in humid regions due to relatively easier to predict chemical transformations
and no gaseous phase or volatilization problems. Also, although there is more temporal variability of STK
and uncertainty with soil testing than for P, soil sampling and testing for K is still a useful diagnostic tool.
The goal of sound K management in most regions of the U.S. should be to keep the STK level at optimal
ranges for maximum economic crop yield and utilize application methods that optimize K use efficiency
and profitability. Substantial within-field variability of STK and K removal with harvest in most
agricultural areas justifies the use of appropriate soil sampling methods and variable-rate application
technology to increase K use efficiency.
Best Management Practices for K Fertilization:
Any list of best K management practices will need to be tailored to a specific region because of large
variation in crops, soils, and production systems; and likely will be incomplete in regard to addressing all
potential issues. However, the following list includes the most important concepts underlying K
management strategies.
1. Sample soil as frequently and densely as possible, and use appropriately calibrated soil-test
methods based on research for each state or region.
2. Consider yield levels and crop removal between and within fields to help maintain optimum soil-
test K levels in conjunction with soil testing.
3. Fertilize K deficient soils using economically sound agronomic guidelines. In general, soils
testing ‘high’ or “very high” will not respond economically to additional K and should not
receive fertilizer except for a small amount of starter fertilizer in certain specific conditions.
Chapter 4: Potassium Management | 15
4. Divide large, non-uniform fields into smaller fertility management units based upon yield
potential, soil tests, and relevant soil properties.
5. Account for crop available K applied with manures and other organic sources when deciding on
K application requirements.
6. Refer to local research and guidelines concerning K placement methods to optimize K use
efficiency and the profitability of nutrient application.
Case Study
Several K management strategies and philosophies are used by producers across the U.S. One example
representative for all geographic areas, crops, and current management systems is not possible. Therefore,
the following situation and suggested options for improved management apply to a specific farm in the
U.S. Corn Belt. However, many issues and possible practices the producer could consider to improve crop
K use efficiency and economic return from K application apply to other regions.
Example scenario
• An 800-acre dairy farm in northeastern Iowa.
• Soils are well drained, moderately permeable, are of loam, silt loam, or silty clay loam texture,
and slopes range from 2 to 12 percent.
• The farm has fields with continuous corn and others in a rotation consisting of three years of
alfalfa, two year of corn, and then soybean one year. About one-half of the corn is used for silage that is
fed to dairy cattle.
• The producer uses chisel plow in approximately one-half of the fields and no-till in the other half.
• Some corn fields receive high rates of dairy manure, including for corn after the last alfalfa
production year. Large quantities of manure are produced in the overall farm operation, which is applied
without using manure nutrient analyses or soil testing.
Chapter 4: Potassium Management | 16
• For many years the farmer has assumed that sufficient amounts of nutrients are applied with the
dairy manure, including K, so only occasional fertilizer application is used. This fertilizer is mainly N for
the continuous corn and some broadcasts K fertilizer (as potassium chloride) to some fields with alfalfa.
• The dairy manure is broadcast and incorporated by chisel plowing and disking in fields managed
with tillage (all with continuous corn), but is not incorporated or injected in fields managed with no-
tillage.
• In recent years, especially after harvesting some high yielding corn silage, the farmer has noticed
older corn leaves on the lower part of plants with yellow or brown edges in spots, and also wonders about
apparently increasing within-field variation of yields of both corn and alfalfa.
The farmer's recent observations are consistent with likely K deficiency given the crop and nutrient
practices that he has been using. This scenario could be a frequent situation in geographic areas with
crops that remove large amounts of K when manure and soil analysis are not used as it should, and the
manure is not managed appropriately. With the high nutrient removal with alfalfa and corn silage harvest,
it is likely that the amount of K applied is not adequate to maintain soil test K at optimum levels. This,
together with uneven or not careful manure application, will lead to extreme variation in soil tests across
and within fields, and limited crop yields at least in some areas.
Following are some new management options to consider:
• It is very important from the agronomic and economic point of view to monitor soil nutrient
levels routinely. This is crucial in order to adjust nutrient application rates to meet crop requirements,
maximize profitability, and avoid potentially high risk of water quality impairment due to excess N and P
loss from fields. In this specific case, it is very likely that the spotty K deficiency symptoms in corn, and
large within-field crop yield variability, is due to continued uneven application of dairy manure without
consideration of K being applied and varying yields. For example, corn silage harvest removes almost
four times more K than grain only harvest. Harvest of a high yielding alfalfa crop can result in even more
K removal than a high yielding corn silage crop. While soybean is a minor crop in the rotations, soybean
grain harvest will remove more K than corn grain harvest. Therefore, the producer should adopt a soil
sampling strategy for monitoring soil test levels, K in particular, and within-field soil test variability. An
ideal sampling strategy would be a 2.5 acre grid sampling on all fields, or a less dense zone sampling
Chapter 4: Potassium Management | 17
approach that considers at least soil map units and topography. Some measurement of within-field yield
variation would be very useful, although this is easy and of relatively low cost only for grain yield with
yield monitors and GPS. The soil sampling frequency should reflect the crop rotation. For example,
sampling before each new alfalfa seeding and before the first-year corn after alfalfa, and every two to
three years in the continuous corn. The soil test information would allow the farmer to know what fields
and field areas require supplemental K fertilizer application, and if excess manure P is being applied to
some fields or field areas.
• The farmer should have a regular manure sampling and analysis program so the amount of
nutrients applied can be appropriately determined. In fact, regular soil and manure analyses are beginning
to be required by many NRCS programs and state agencies in charge of preserving environmental quality.
Once a K soil test map of the farm is carefully studied, the next step would be to target dairy manure or K
fertilizer application in field areas with lower K levels and avoid/reduce applications in areas with high K
levels and/or excessive soil-test P levels (if they exist). Consideration should be made for the needed N,
P, and K. For example, if soil test P is very high, and K soil test is low, then fertilizer K should be applied
instead of manure. If the field is rotating from alfalfa to first year corn, then manure application should be
avoided, or only a low rate should be applied, since first-year corn after alfalfa crop requires little or no
additional N. Application of manure or fertilizer can be accomplished by using conventional
manure/fertilizer application practices, or variable rate application equipment depending on the degree
and scale of P and K spatial variability and the availability of variable-rate technology equipment.
• The dairy manure should be injected when it is applied to fields managed with no-tillage. This
will increase manure N use efficiency (by reducing ammonia volatilization) and will reduce the risk of P
loss with surface runoff. Known crop availability of N, P, and K in dairy manure, and the diversity of
cropping and harvest systems being used in this dairy farm (and in most farms that include animal
production), present a serious challenge concerning maximum use of the manure resource while attending
to crop nutrient needs and risk of water quality impairment due to excess N and P application.
• In order to properly maintain adequate K supply for all crops and minimize the risk of excessive
N and P loss, the farmer has to appropriately consider manure and inorganic fertilizer application rates,
avoid application of N at rates much higher than needed by each corn crop, and use an environmental P
risk assessment tool (such as the P Index). Use of the P Index helps to determine what fields or field areas
testing high in P can have application of manure to supply N and K, and will not result in excessive risk
of P loss and water quality impairment.