chapter 4 research design and …studentsrepo.um.edu.my/1631/5/ch_4.pdfexploratory and conclusive...
TRANSCRIPT

142
CHAPTER 4
RESEARCH DESIGN AND METHODOLOGY
4.1 Introduction
The chapter is concerned with the methodology and methods used in the study. The first
section of this chapter, provide a detailed description and justification of the methodology
used in the present investigation. This includes a discussion on the research design,
targeted informant, data collection procedures, the research instruments employed and
methods used for the data analysis in this study. Subsequently the chapter provides a
discussion on the description about the operationalisation of constructs used in the second
section and consequently, the discussion focuses on the reliability and validity assessment
of the constructs at the third section of the chapter.
Section One: Research Design and Strategy
4.2 Research Design
Matching the research design with an appropriate research methodology is an important
consideration in any research project. The methodology must not only be appropriate to
the type of research but also to the environment in which the research is being undertaken
(Cresarell, 1994). This is because a good research design can provide a context in which
relatively unambiguous can be drawn. In other words, it is a form of a carefully
developed and controlled plan to carry out the research investigation.

143
A research design, according to Malhotra (2004) is a framework or blueprint that
specifies the detail of the procedures necessary for obtaining the information to be used to
structure and/or solve the research problems of the study. He categorised it into
exploratory and conclusive research. The main objective of exploratory research is to
provide insights and understanding of the research problem, while conclusive research is
to test specific hypotheses and examine the relationship between the investigated factors.
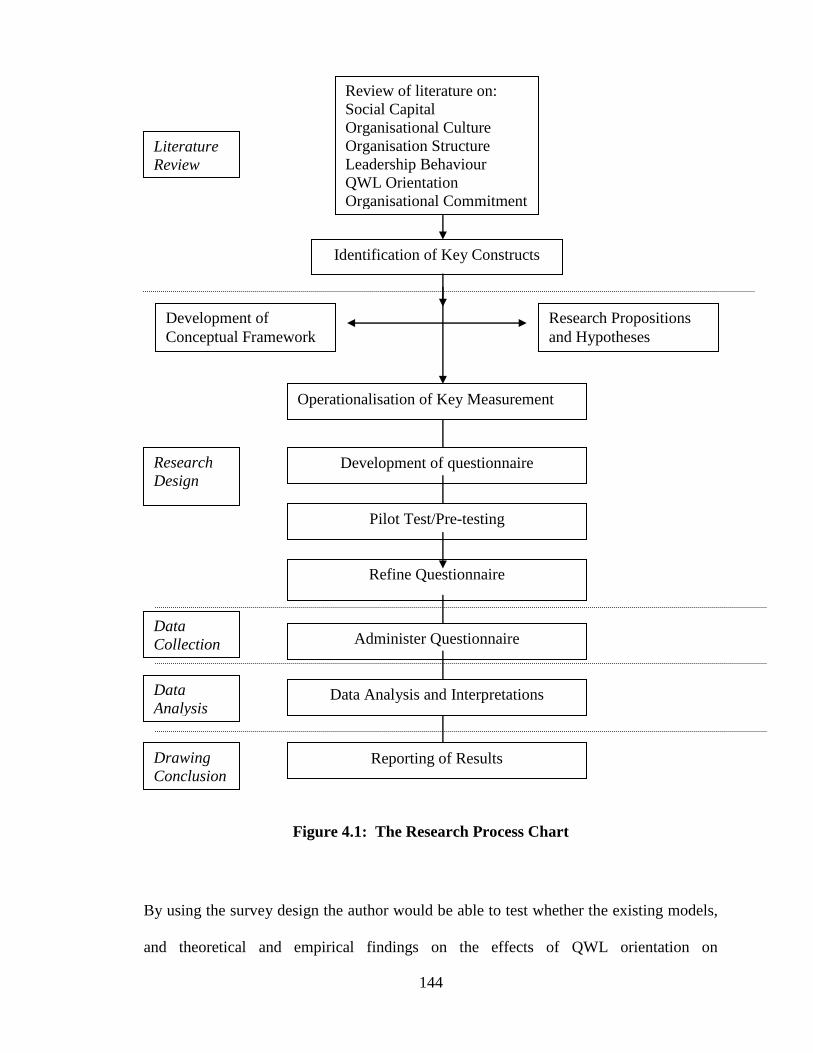
Figure 4.1 describes the different stages of research process.
In the earlier stage of this study, an extensive literature search pertaining to the related
independent variables such as social capital, organisational culture, organisation
structure, leadership behaviour, quality of work life orientation as the mediating variable,
and organisational commitment as the dependent variable, was undertaken and focused
on in order to provide an understanding on these subjects. The literature review is
important to formulate the conceptual framework and further led to the research
propositions and hypotheses. The search also indicates that the work utilizes conclusive
research based on a cross-sectional design and that the findings of this research can be
used as input into managerial decision making (e.g. Slater and Narver, 1994). The
preliminary design of the questionnaire was structured based on the identified constructs.
The questionnaire was pre-tested and feedback received was used to refine the key
constructs. Administration of the questionnaire was carried out, and responses was
analyzed and interpreted. Finally, results are reported.
144
Figure 4.1: The Research Process Chart
By using the survey design the author would be able to test whether the existing models,
and theoretical and empirical findings on the effects of QWL orientation on
Review of literature on:
Social Capital
Organisational Culture
Organisation Structure
Leadership Behaviour
QWL Orientation
Organisational Commitment
Literature
Review
Identification of Key Constructs
Research Propositions
and Hypotheses
Development of
Conceptual Framework
Operationalisation of Key Measurement
Research
Design
Development of questionnaire
Pilot Test/Pre-testing
Refine Questionnaire
Data
Collection
Administer Questionnaire
Data
Analysis Data Analysis and Interpretations
Drawing
Conclusion Reporting of Results

145
organisational commitment, based on the Western prescriptions, describe the Malaysian
context. The survey research is also chosen due to its practicality and feasibility in terms
of gaining access to organisations, i.e., public service organisations.
Furthermore,compared to other methods,survey design is more transparent and
accountable; the methods and procedures used are accessible to other parties, thus
making it possible to assess the implementation and the overall research design.
4.3 Unit of Analysis
The unit of analysis is where information about the study is collected. It describes the
characteristics or level of analysis of the study (De Vaus, 2002). According to Zikmund
(2003) the level of the analysis can be organisation, departments, work groups, dyads,
individuals or objects. It is important to determine the unit of analysis at the early stage,
particularly at the problem definition stage, as variables in the conceptual framework,
data collection methods, and sample size are dependent on this (Zikmund, 2000).
This study selects the public service organisations in Malaysia as the unit of analysis.
This is because as Malaysia is forging ahead into achieving its vision, goals and
objectives stated in its macro policies and development plans, the Malaysian Public
Service is expected to play its role as a pace setter, facilitator, regulator and strategic
integrator in cooperation with the private sector and the community-based organisations
in meeting the challenges posed by the changing environment. Therefore, various policies
measures and programmes have been introduced to strengthen the management of its
human resource as well as enhance the effectiveness and efficiency of the overall
146
administrative machinery of the public service organisations. Hence, it is an advantage to
have an overall view of the studies by examining the responses from the survey of these
organisations. In fact, this is particularly meaningful given the relatively new topics that
are being discussed and researched by this study.
4.3.1 Key Informant
The questionnaire was mailed to the Head/Director/Manager of the Human Resource
Management/Administrative and Management Services Division of the sample
agencies.These targeted informants were chosen due to their expertise in the subject-
matter and their hands-on experiencebecause they are presumed to have a wide
knowledge of the operations of the organisation, and would be able to provide accurate
information (Kumar et al, 1994). As such, they played both roles as respondent and also
informant of their organisations.
4.4 Sampling Procedures
According to Tudd, Smith and Kidder (1991:130), a population is the aggregate of all the
cases that conform to some designated set of specifications. The population ofinterest of
this study consisted of public service agencies in Malaysia. Using a purposive sampling
technique a sample of 500 out of 720 organisations both at the Federal and State level
including statutory bodies and local government authorities was chosen.The balance 220
organisations were not included in this sample of studymainly consists of all districts
councils and small organisations which is under existing departments and statutory
bodies that work towards achieving the goals of their parent agencies including some off-
147
budget agencies which are formed under the Companies Act or the Society Act and do
not follow the policies and procedures of personnel management of the public sector.
The purposive sampling technique is used in this study because it is a non-random
technique that does not need underlying theories and it allows researcher to home in on
organisations which have good grounds in what we believe will be a critical for the
research.
The mailing list was taken from the Malaysian Public Service Department (PSD) a
central agency under the Prime Minister Department and the Malaysia Government‟s
Official Portal.The sample of 500 organisations was taken with the anticipation that it
provides useable responses in the range of 30 percent to 40 percent, or approximately 150
to 200 responses.
Several other factors were also considered in determining the sample, such as, sufficient
data to do Structural Equation Modeling, as well as time and resource constraints on the
part of the researcher in implementing the survey. These issues correspond with the
factors recommended by Hair, Black, Babin, Anderson, and Tatham(2006) in
determining the sample size.
4.5 Research Instrument
A structured set of questionnaire was used to gather the relevant data for this study. From
the literature review, established measures from related fields were incorporated in the
questionnaire in order to evaluate the constructs of this study which include social capital,
148
organisational culture, organisation structure, leadership behaviour, quality of work life
orientation and organisational commitment.
4.5.1 Scaling of Measurement
Scaling is the “procedure for the assignment of numbers (or other symbols) to a property
of objects in order to impart some of the characteristics of numbers to the properties of
objects” (Cooper and Schindler, 2006:332). It can be classified into comparative scales
and non-comparative scales (Malhotra, 2004). Comparative scales involve one of two
types of scaling techniques in which there is direct comparison of stimulus objects of the
study with one another, whereas non-comparative scales are independent of one another.
This study uses the non-comparative scales where the itemised rating scales can be
further classified as Likert, semantic differential or staple scales. The semantic
differential-liked scale was applied to most of the constructs of this study.
The semantic differential scale measures the psychological meanings of an attitude object
using bipolar adjectives (Cooper and Schindler, 2006). The method consists of a set of
bipolar rating scales, by which one or more participant‟s rate one or more concepts on
each scale items. A six point semantic differential-liked scale was used to measure all the
constructs involve. For the purpose of data interpretation, the descriptive phrases for the
scale were (1) “strongly agree”, (2) “moderately agree”, (3) “slightly agree”, (4) “slightly
disagree”, (5) “moderately disagree”, and, (6) “ strongly disagree”. The scale contains a
series of bipolar items for the various properties of the construct. The bipolar scale
provides the opportunities for respondents to view the alternative at the other side of the
continuum as well as enables the researcher to probe into both directions and the intensity
149
of respondents‟ perception (Green et. al, 1988). Thus, the scales would lead to a high
degree of reliability (Dickson and Albaum, 1977). The scale also specifies more precisely
the dimension rather than allowing one pole of the scale to be interpreted
idiosyncratically (Goldberg and Kilkowski, 1985). All items generated for all bipolar
scales in this study have been reviewed by an expert in English language to ensure its
accuracy.
An even-numbered six-point scale was used in this study, to avoid the clustering of
responses at the neutral point, which will turn out to make the result unreliable (Ling,
1998). Most people use a neutral response as a dumping ground when they would prefer
not to have to choose, don‟t care, or have no opinion. Thus, by using a six-point scale, the
validity of the question will be improved. After all, results of a study comparing an odd
scale (seven-point) with an even scale (six-point) concluded that there was no significant
difference in the results between scales (Kinnear and Taylor, 1996). Furthermore,
decades of psychological research have shown that a six-point scale with three levels of
agreement and three levels of disagreement works best for the assessment of
psychological attributes. Osuagwu (2001) argued that by forcing the subjects to decide on
one half of the scale may be some otherwise hidden biases could be revealed.
4.5.2 Questionnaire Structure and Sequencing
The survey instrument was a structured ten (10) pages questionnaire with two (2) pages
allocated for important contact details, instructions on answering the questionnaire and
assurance on the confidentiality of the information supplied. The questionnaire was
divided into seven (7) parts with each part separated by a specific heading. Instructions
150
were clearly and precisely stated at the first page before each heading. This is to avoid
repeated instructions at every page besides keeping the usage of pages at minimum level.
The background information of the organisation was presented on the final part of the
questionnaire. This procedure was adopted following suggestions that sensitive questions
were to be set towards the end of the questionnaire (Dillman, 1999, Zikmund, 2000). As
such, if this part was not completed, it would not significantly affect the propositions and
hypotheses testing of the study.
4.6 Pre-testing
Pre-testing is carried out to identify any items that may be difficult to comprehend and
revise them prior to conducting the survey. Dillman (1991) indicates that measurement
errors result from the way questions are asked and from the sequence of the questionnaire
might impede respondents in answering correctly to the survey questions. In fact, it is
considered as the last step in questionnaire design before final questionnaires are mailed-
out (Diamantopoulos et al., 1994). Thus, a pre-test is conducted for the purpose of:
(i) Checking for face and content validity of the questionnaire;
(ii) Assuring that the questions are understood and correctly interpreted;
(iii) Checking for its comprehensiveness, syntax errors and the general layout
format.
For the purpose of this study, the questionnaire was first distributed to colleagues in three
public service organisations for comments on the questions form and layout, wording,
content, sequence, question difficulty and instructions. The second draft of the
questionnaire was then distributed to another group of colleagues for second pre-testing

151
in another two public service organisations in Kuala Lumpur. This was important in order
to make sure that the questions asked were understood and relevant to the Malaysian
public service context.
All the feedback received from the pre-test was considered in the final revision of the
survey instrument. Most of the respondents had a favourable attitude to the questions,
structure and design of the questionnaire. The major feedbacks obtained from the pre-test
to further improve the instruments are as follows:
(a) Some of the wording and language used in the questionnaires need to be
rephrased for clarity purposes and to suit the Malaysian public service culture
environment. It was suggested that:
(i) the number of questions need to be reduced especially questions which is
redundant and not relevant in order to shortened the time to complete the
whole questionnaire from 30 minutes to 20 minutes.
(ii) Some of the respondents did suggest a personal telephone call be made to
the respondents as a reminder after the due date. This is associated with
Malaysian public service culture that emphasises personal relationships to
any dealing within the organisations.
(iii) Such a suggestion was incorporated in the administration of the survey.
This is also conforms to the recommendation made by De Vaus (2002) on
the use of telephone calls as part of the reminder to respondents.

152
(b) Respondents were also given contact details if they had queries on the survey,
which included the address of the Faculty of Business and Accountancy,
University Malaya on the cover letter and on the second page of the questionnaire.
4.7 Data Collection Method
Data were collected form respondents using a structured questionnaire, which meant that
questions asked were limited to certain responses of alternatives stated. Such a method
has been proven to be reliable (Malhotra, et al., 1999). The mail survey method was used
for reasons of anonymity and privacy of respondents, low cost and simplicity of the
procedure (Dillman, 1991). The questionnaire was 12 pages with 10 pages contained the
relevant questions. Although the questionnaire is considered slightly long, but the effects
of questionnaire length did not influence the response rate.
As the questionnaire was self-administered, questions asked were simple to comprehend,
and detailed instruction was provided. The questionnaires began to be posted in the
middle week of June 2006. Questionnaire was posted in batches to assist the researcher
to recognize the due date for each of the batch. The first batches of questionnaires were
posted to all Ministries and Federal Government Agencies in the KlangValley. This was
followed by the second batches to all Federal Departments and Statutory Bodies (Federal
and State level) in the first week of July 2006. The third batches of questionnaires were
posted to all state government offices and local government authority nationwide by end
of July and early August 2006. Respondents were given a month to respond to the
153
questionnaire. This took into account delays in posting and receiving of the questionnaire
nation-wide.
As suggested by various authors (e.g. Kerlinger and Lee; Dillman, 1978) one of the
possible problems that may arise from gathering data by mail questionnaire is the failure
of participants to respond. To some extent, a slow and low response rate in the present
study was to be expected. It is typical for mail surveys to have poor response rate, and as
a result they have been criticised for non-response bias (Maholtra, 1999). It has been
suggested that the best way to protect against non-response bias is to improve the
response rate (e.g. Armstrong and Overton, 1977). Thus, to encourage participation, a
follow-up call was made to all those organisations that do not respond after a month‟s
time to remind the personal assistant of the identified managers of the survey. By middle
of August, all questionnaires were posted.
In order to increase the participation and response rate of the study a total design method
was applied in the implementation of the survey (Dillman, 1991). This includes the mail
package consisting of an outgoing envelope, cover letter, questionnaire and a return
envelope.
4.7.1 Outgoing Envelope and Return Envelope
A 9”x12.75” sized envelope was used. The size of the envelope was selected to allow
enough space for the questionnaire and a return envelope but most importantly, to allow a
professional presentation of the survey so that it would be able to attract attention and

154
interest in the questionnaire. The outgoing envelope was personalised to the
Head/Director/Manager of the Human Resource Management/Administrative and
Management Services Division of each public service agencies. To facilitate respondents
to return the questionnaire, an A4 sized reply paid envelope was included. This was done
for the convenience of respondents, to cut their cost, to encourage them to respond to the
survey, and to lessen their time taken in responding (Newman and McNeil, 1998).
4.7.2 Cover Letter
The cover letter that was included in the questionnaire was printed on a Faculty of
Business and Accountancy, University Malaya letter head and was signed by both the
principal supervisor and the researcher. The department letterhead was used not only to
differentiate this study from other commercial research that was going on at that time, but
also reflect the commitment of the faculty to the importance of the study. The cover letter
was addressed to the Head/Director/Manager of the Human Resource
Management/Administrative and Management Services Division of the public service
agencies. The introduction introduced the researcher and the supervisor and specified the
purpose of the study. It, then, specified the objectives of the study, the contribution of the
study and the time needed to finish the questionnaire. Respondents were informed about
the confidentiality of the study and reassured that only the researchers and the supervisor
would have access to the information given and all reports of the study would be
presented on an aggregate level only. Contact details of the researcher and the supervisor
were also made available in the cover letter.
155
4.7.3 Questionnaire
The questionnaire was bound in a booklet format with University Malaya printed on top
of the cover, followed by the title of the survey. A simple graphic was used to enhance
the cover and to attract attention and interest in the questionnaire. The idea to bind the
questionnaire in a booklet style was not only to allow for a professional look, but most
importantly, to generate interest among respondents to answer the survey. The
professional look was also meant to differentiate this study from many other studies that
were received by respondents at the same time. The booklet was 12 pages, double sided,
with the first page allocated for the title, time needed to answer the questionnaire, the due
date and contact details of the researcher. The phrase “ALL INFORMATION WILL BE
STRICTLY CONFIDENTIAL” was also included on the first page. The second page
concerned the instructions of the survey ad reiteration of the confidentiality of the
responses given. The content of the survey began with the topic related to the title that
was stated on the cover of the questionnaire (Dillman, 1991). (Please refer to Appendix
1 for the booklet of the questionnaire).
4.8 Response Rate
The data collection took slightly more than two months to complete, which started in the
middle of June and ended in August 2006. Out of 500 questionnaires mailed out, 208
responses were received by the end of October. Two hundred and three (203) were
useable and 3 questionnaires were incomplete and two (2) were returned to the sender for
reason that the identified respondents were not with the organisations. As a result, the
response rate of the survey was at 40.6 percent. This percentage is above the expected

156
rate for mail surveys that are randomly sampled with no prior contact established with
respondents (Malhotra, 1999). Table 4.1 exhibits details of the response rate.
Table 4.1: Response Rate
Item Descriptions N Percent
(%)
Total target
population
Total target sample
720 organisations
500 organisations
720
500
100.0
69.74
Total
questionnaires
mailed
Total
questionnaires
received
Responses
Total usable
responses
500 organisations
Ministries/Federal Govt. Agencies…34
Departments………………………...48
Statutory Bodies…………………….44
State Government Offices…………..53
Local Government Authorities……...24
500
208
203
100.0
41.6
40.6
Non-responses
292 58.4
4.9 Cleaning the Data
4.9.1 Detecting the Missing Data
Missing data were reduced as much as possible by checking all the questionnaires at the
time of collection. When there was a case whereby some of the questions were not
answered, it was immediately brought to the attention of the related respondents. Since
157
all the data had been keyed into the SPSS manually, before any tests were conducted
using the data set, frequency distributions for each variable in the study as well as
missing value analysis were run to ensure that the data were “clean”. The results indicate
that there was no missing data exists in the data set of this study.
4.9.2 Detecting the Outliers
Hair et al (1998) defined outliers as “the observations with a unique combination of
characteristics identifiable as distinctly different from the other observations”. It is
important to make a distinction between outliers that ought to be deleted and those that
ought not to be. Outliers that require deletion are incorrect data entry, recorded missing
values that have been read as real values and data from respondents who are not members
of the intended population (Tabachnick and Fidell, 2001).
In this study, from the output of the descriptive tables, all the items in each section of the
questionnaire were examined to ensure that the responses were within the range of the
items or scales, and the extreme values were identified. The results indicated that no error
was detected in the data set of the study.
4.9.3 Data Coding
For some scales, the wording of particular items has been reversed to help prevent
response bias. Thus, all the negatively worded questions as shown in Table 4.2 needed to
be reversed before performing the statistical analyses on the data. The negatively worded
items needed to be reversed before a total score can be calculated for that particular scale.
Therefore, the range of the six-point bipolar scale for the negatively worded items was

158
transformed from 1 (Strongly Agree) – 6 (Strongly Disagree) to 1 (Strongly Disagree) – 6
(Strongly Agree).
Table 4.2: Negatively Worded Questions
Work Environment (Part E)
No.
3 My present job is only a tiny part of the overall work
9 My present job is quite simple and repetitive
10 My present job gives me little chance to get to know other people
12 My present job is not significant, where the outcome of my work are
not likely to have any effect on other people
22 At this workplace my abilities are not fully utilized
28 At this workplace I find it difficult to cope with the amount of work I
have to do
31 At this workplace I often face difficulties in balancing my work and
family lives
Organisational Performance – commitment towards the organisation (Part F)
No.
3 I feel very little loyalty to this organisation
7 I could just as well be working for a different organisation as long the
type of work were similar
9 It would cause very little change in my present circumstances to leave
this organisation
11 There‟s not too much to be gained by sticking with this organisation
indefinitely
12 Often, I find it difficult to agree with this organisation‟s policies on
important matters relating to its employees
15 Deciding to work for this organisation was a definite mistake on my
part
4.10 Response Bias Analysis
Before proceeding to the data analysis steps, absence of response bias was established
first. Response bias is the effect of non-responses on survey estimates (Fowler, 1988).
This procedure examines the scenario if the non-respondents had responded; their
responses would have substantially changed the overall results of the survey. In this
study, a wave analysis (Leslie, 1972) was deployed. The process entails monitoring the
159
response pattern for items of the main variables for over eight weeks. The procedure
assumes that those who return surveys in the final weeks of the response period can be
considered non respondents. The results indicated that there is no statistical change from
week to week; hence a case for absence of response bias was established.
4.11 Data Analysis
The study used statistical software SPSS version 14.0 and AMOS software to analyze the
data derived from the questionnaire survey. The nature of the sample was examined
through descriptive statistics. Coefficient alpha and factor analysis with varimax rotation
and confirmatory factor analysis was used to purify the data and examine the reliability
and validity of the measures. In order to test the hypotheses of the study, statistical
techniques ranging from correlation, multiple regressions, to structural equation
modelling and path analysis were used. These analytical techniques are discussed in
Chapters 5.
Section Two – Measurement of Research Construct
4.12 Operationalisation of Constructs
Most of the constructs were measured by adapting established scales from the extant
literature. A major concern when using a scale developed in other contexts is its validity
across societies. Even though the validity was theoretically proven, some of these
measures have not been tested its validity in a Malaysian setting. Therefore, steps were
taken to ensure that the scales were interpretable and could be understood by the
respondents. For example, some modifications were implemented to suit the language
160
and the public service environment of the respondents. This was done as a result of
feedback from the pre-testing. The modification however, does not alter the content of
the constructs.
Table 4.3 to Table 4.8 show measurement items used. On average, each construct was
measured using to three to five items. This number of items is considered acceptable by
methodologists (Fabrigar et al. 1999). It is argued that a construct with more items can
more fully capture the underlying factor, while a construct that have fewer items in a
scale can reduce the „stray‟ loading and may strengthen the discriminate validity,
particularly for a narrowly defined measure (Ferratt et al., 1981). The following
discussion of the constructs used for the study is based on the sequence that they are
presented in the conceptual framework.
4.13 Measurement Scales
4.13.1 Organisation Structure
This study viewed organisation structure as having three main dimensions namely
centralization, formalization and complexity (Robbins, 1990). In order to measure
organisation structure, this study employed a survey approach which is based on
perceptual measure. According to other behavioural science research, this measure is
suggested to be adequately and accurately reflect the degree of structure experienced by
an individual (Duncan, 1972) and influence pattern within a group (March, 1955).

161
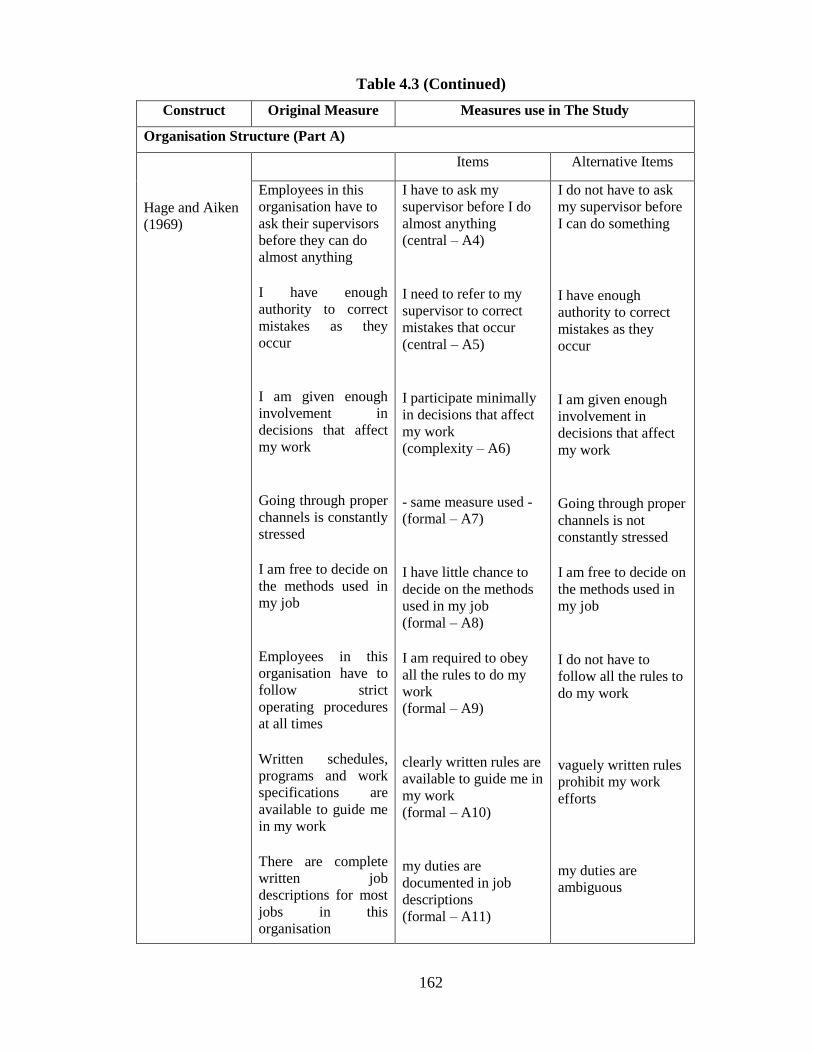
The widely used scales developed by Hage and Aiken (1969) were adapted to measure
the organisation structure dimensions of centralization and formalization.These scales
were selected due to its high reliability and popularity among researchers in the
organisational behaviour studies (Lau et al. 2003). The original measurement for both
dimensions scored on a seven-point Likert scale ranging from 1 (Strongly disagree) to 7
(Strongly agree). However, the scales are modified to meet the needs of this study. For
the measurement of complexity two items were modified from John and Martin (1984)
while the other two was adapted from the vertical differentiation scale developed by
Aiken et al. (1980). The six points on the semantic differential-liked scale are ranging
from strongly agree (1) to strongly disagree (6) is applied. Table 4.3 shows the items
used.
Table 4.3: Measures for the Organisation Structure
Construct Original Measure Measures use in the Study
Organisational Structure (Part A)
Items Alternative Items
Hage and Aiken
(1969) There can be little
action in this
organisation until a
supervisor approves a
decision Even small matters
have to be referred to
someone higher up
for a final answer in
this organisation A person who wants
to make his own
decision would be
quickly discouraged
in this organisation
I can only take minimal
action until my
supervisor approves a
decision (central – A1) even small matters have
to be referred to the
supervisor (central – A2)
I am discouraged from making decisions on my work (central – A3)
I can act on a
decision without my
supervisor‟s approval
only important
matters have to be
referred to the
supervisor
I am allowed to make
a lot of decisions on
my work
162
Table 4.3 (Continued)
Construct Original Measure Measures use in The Study
Organisation Structure (Part A)
Hage and Aiken
(1969)
Items Alternative Items
Employees in this
organisation have to
ask their supervisors
before they can do
almost anything I have enough
authority to correct
mistakes as they
occur
I am given enough
involvement in
decisions that affect
my work
Going through proper
channels is constantly
stressed I am free to decide on
the methods used in
my job
Employees in this
organisation have to
follow strict
operating procedures
at all times Written schedules,
programs and work
specifications are
available to guide me
in my work There are complete
written job
descriptions for most
jobs in this
organisation
I have to ask my supervisor before I do almost anything (central – A4)
I need to refer to my supervisor to correct mistakes that occur (central – A5)
I participate minimally in decisions that affect my work (complexity – A6)
- same measure used - (formal – A7)
I have little chance to
decide on the methods
used in my job (formal – A8) I am required to obey
all the rules to do my
work (formal – A9)
clearly written rules are
available to guide me in
my work (formal – A10)
my duties are
documented in job
descriptions (formal – A11)
I do not have to ask
my supervisor before
I can do something
I have enough
authority to correct
mistakes as they
occur
I am given enough
involvement in
decisions that affect
my work
Going through proper
channels is not
constantly stressed I am free to decide on
the methods used in
my job
I do not have to
follow all the rules to
do my work
vaguely written rules
prohibit my work
efforts
my duties are
ambiguous
163
Table 4.3 (Continued)
Construct Original Measure Measures use in The Study
Organisation Structure (Part A)
Hage and Aiken
(1969) Cook et al
(1981) John and Martin
(1984)
Items Alternative Items
People in this
organisation feel as if
they were being
watched constantly to
see they obey all the
rules I often face barriers in expressing my ideas to upper management Employees in this
organisation tend to
be widely dispersed
geographically
This organisation is
highly
departmentalized
I feel that I am
constantly being
watched by my
supervisor (central – A12)
- same measure used - (complexity – A13)
Employees tend to be widely dispersed spatially (complexity – A14)
The organisation
structure is comprised of
many sub-units (complexity – A15)
I am relatively free
from being watched
by my supervisor
I have enough
opportunities to
express my ideas to
upper management Employees are
closely linked to each
other
The organisation
structure is relatively
flat
4.13.2 Organisational Culture
Organisational culture refers to “the deep structure of organisations, which is rooted in
the values, beliefs and assumptions held by organisational members (Denison, 1996).
Organisational culture is a means by which organisational members develop a collective
identity, relationships within the organisation, and the ways of working together. This
study adopted the new, shortened version of the Organisational Culture Profile (OCP) by
Sarros et al., (2001).

164
OCP consist of seven dimensions as follows: supportiveness, innovation,
competitiveness, performance orientation, stability, emphasis on rewards and social
responsibility. The scales however, are modified to meet the needs of this study
(amending the five point Likert scales used by Sarros et al. 2001). The six points on the
semantic differential-liked scale are ranging from strongly agree (1) to strongly disagree
(6). Table 4.4 exhibits the measures for organisational culture.
Table 4.4: Measures for the Organisational Culture
Construct Original Measure Measures use in the Study
Organisational Culture (Part B)
Items Alternative Items
Sarros, Gray,
Densten and
Cooper (2005)
To what extend is
your organisation
recognized for its… Achievement
orientation
An emphasis on
quality
Being distinctive – Different from others
Being competitive
I think of better ways of
doing work (competitive – B1)
quality initiatives are a top priority with the management where I work (competitive – B2) I take every opportunity
to be different from my co-workers (competitive – B3)
the management is recognized for being competitive (competitive – B4)
I am comfortable
with my existing
ways of doing work
quality initiatives are
given low emphasis
by the management
I comply with the
demands of my co-
workers
the management is
recognized for being
complacent with its
achievement
165
Table 4.4 (Continued)
Construct Original Measure Measures use in the Study
Organisational Culture (Part B)
Sarros, Gray,
Densten and
Cooper (2005)
Items Alternative Items
To what extend is
your organisation
recognized for its… Being innovative
Quick to take
advantage of
opportunities
Risk taking
Taking individual
responsibility
Being results oriented
Having high
expectations for
performance
I seek innovative
approaches to
improving my work (innovative – B5)
I am quick in taking
advantage of
opportunities (innovative – B6)
I am willing to take
risks on the job (innovative – B7)
I take individual
responsibility over the
tasks given by my
supervisor (innovative – B8)
I am willing to be bold
in my actions (perform – B9)
the organisation is
recognized for having
high expectations on
performance (perform – B10)
I comply to the
standard operating
procedures of my
work
I rarely take
advantage of
opportunities
I avoid taking any risk on the job
I follow others in
working on the tasks
given by my
supervisor
I have to be discreet
in showing my
capabilities
the organisation is
recognized for being
indifferent towards
performance
166
Table 4.4 (Continued)
Construct Original Measure Measures use in the Study
Organisational Culture (Part B)
Items Alternative Items
Sarros, Gray,
Densten and
Cooper (2005)
To what extend is
your organisation
recognized for its…
Enthusiasm for the
job
Being highly
organized
I take pride in doing my
job as best as I can
(perform – B11)
employees' work
objectives are clearly
defined (perform – B12)
I am not much
affected by how well
I do in this job
employees have
unclear work objectives
Being team oriented
Being people oriented
Collaboration
teamwork is used to get
work done (support – B13)
the management values
people above
everything else (support – B14)
it is easy to get
collaboration from
other units in
completing my tasks (support – B15)
work is done
individually
the management
values output above
everything else
it is difficult to get
collaboration from
other units in
completing my tasks
167
Table 4.4 (Continued)
Construct Original Measure Measures use in The Study
Organisational Culture (Part B)
Sarros, Gray,
Densten and
Cooper (2005)
Items Alternative Items
To what extend is
your organisation
recognized for it‟s… Sharing information
freely
Fairness
Praises for good
performance
information flows
openly between the
management and
employees (support – B16) I am fairly paid for
what I contribute to this
organisation (rewards – B17) my supervisor praises
me for my good
performance (rewards – B18)
information is filtered
at the management
level
I feel the amount of
money I make is less
than what I deserve
my supervisor seldom
praises me for my
good work
Opportunities for
professional growth
High pay for good
performance
Having clear guiding
philosophy
Being socially
responsible
I am given appropriate
opportunities for
professional growth (rewards – B19) employees get fixed
benefits regardless of
performance (rewards – B20) corporate values guide
the decisions of the
management team (socres – B21)
the organisation is
recognized for being
socially responsible
towards community
activities (socres – B22)
I hardly receive
opportunities for
professional growth
employees are paid
based on their merits
corporate values are
rarely referred by the
management team
when making
decisions the organisation
generally does not
participate in
community activities

168
Table 4.4 (Continued)
Construct Original Measure Measures use in The Study
Organisational Culture (Part B)
Sarros, Gray,
Densten and
Cooper (2005)
Items Alternative Items
To what extend is
your organisation
recognized for its… Having a good
reputation
Being reflective
Stability
Being calm
Security of
employment
Low conflict
the organisation is
consistently responsive
to stakeholders‟
demands (socres – B23) employees always
behave in an ethical
manner (socres – B24) the organisation is
recognized for its
stability (stability – B25) the management
remains calm when
encountered with crisis (stability – B26)
the management keeps
us informed of changes
affecting the
organisation (stability – B27) compromise is the best
way to resolve any
disagreement between
employees (stability – B28)
the organisation often
ignores stakeholders'
demands
employees tend to
demonstrate unethical
behaviour
the organisation tends
to be slightly unstable
the management
tends to be easily
distracted when
encountered with
crisis the management
doesn‟t tell us much
about what‟s going
on in the organisation
employees argue
persuasively with
peers to resolve any
disagreement

169
4.13.3 Social Capital
Social capital characterizes the structure of social relations or network among individuals
or group within the organisation (Leana and Van Buren, 1999; Requena, 2003; Lowe et
al. 2001). It is the ability of people to work together, trust in others, to participate and
engage for common purposes in groups and organisations. The dimensions consist of
trust, social relation, influence, engagement and communication. The scale by Lowe et al
(2001) and Requena (2003) was adapted to examine this perspective with some
modification to meet the needs of this study. The six points on the semantic differential-
liked scale are ranging from strongly agree (1) to strongly disagree (6). Table 4.5 exhibits
the measures for social capital.
Table 4.5: Measures for Social Capital
Construct Original Measure Measures use in The Study
Social Capital (Part C)
Requena (2003) Lowe and
Schellenberg
(2001)
Items Alternative Items
I trust my employer
to treat me fairly
Someone at work
shows concern for
my well-being
Your employer treats
you with respect
the management always
treats its employees
fairly (trust – C1)
the management gives
top priority to
employee well-being (trust – C2) the management treats
its employees with
respect (trust – C3)
the management
tends to give more
opportunities to a
few groups of
employees the management
shows minimal
concern for
employee welfare the management
shows little respect to
its employees

170
Table 4.5 (Continued)
Construct Original Measure Measures use in The Study
Social Capital (Part C)
Requena (2003) Lowe and
Schellenberg
(2001)
Items Alternative Items
In my organisation
people who work
together trust each
other because that is
the best and easiest
way to get the work
done
I trust my co-workers
because it is the best
way to get work done (trust – C4)
I prefer to do my
work without getting
help from my co-
workers
I feel really close to
most of my co-
workers We often discuss
work issues and/or
problems during
lunch or coffee break
I know what is
happening in sections
outside my own
The people you work
with are friendly and
helpful
You can influence
management
decisions that affect
your job or work life
At work I can put my
ideas into practice
I have close friendships
with all my colleagues (socrel – C5) work issues and/or
problems are discussed
during lunch or coffee
break (socrel – C6) - same measure used- (socrel – C7)
employees and the
management have a
good relationship with
each other (socrel – C8) I have the support to
make the necessary
decisions to complete my
task (influ – C9) I can put my ideas into
practice to implement
the tasks given to me (influ – C10)
I have superficial
friendships with most
of my colleagues work issues and/or
problems are
discussed at formal
meetings only
I have little
information about
what‟s going on in
other sections employees and the
management tend to
be distant from each
other
I feel powerless in
my current task
I seldom get the
opportunity to
practise my ideas in
doing my work

171
Table 4.5 (Continued)
Construct Original Measure Measures use in The Study
Social Capital (Part C)
Requena (2003) Lowe and
Schellenberg
(2001)
Items Alternative Items
My organisation cares
about my opinion
You are free to decide
how to do your work
Give more input to help
my organisation succeed
I would be sad if I had to
move to another
organisation
I plan to continue to
work here until I retire
In my
organisationcollaboration
exists because there is a
hierarchy which ensures
that tasks are completed
the management pays
careful attention to
employees‟
suggestions (influ – C11) the management gives
me the freedom to
decide on my work
schedule (influ – C12) I am willing to work
hard beyond my job
expectations to help
my organisation
succeed (engage – C13)
- same measure used- (engage– C14)
- same measure used- (engage – C15)
collaboration exists
because there is a
hierarchy which
ensures that tasks are
completed (engage – C16)
the management
rarely accepts any
suggestion from its
employees the management
outlines my work
schedule
I am not willing to
go out of my way
just to help the
organisation
I would be happy to
move to another
organisation
I would change to
some other
organisation if I had
the chance
collaboration exists
because that is the
way employees
work to complete a
given task
172
Table 4.5 (Continued)
Construct Original Measure Measures use in The Study
Social Capital (Part C)
Requena (2003) Lowe and
Schellenberg
(2001)
Items Alternative Items
Communication is
good among the
people you work with
I am kept well
informed about the
progress of my work
You receive
recognition for work
well done
Essential information
is always
communicated to me
in a very timely
manner
communication is good
among the people I
work with (comm – C17) - same measure used- (comm – C18)
I receive appropriate
recognition for the
work well done (comm – C19) - same measure used- (comm– C20)
communication is
poor among the
people I work with
often I am not
informed of any
changes affecting my
work I am seldom
acknowledged for my
good performance
essential information
is not given to me on
time
4.13.4 Leadership Behaviour
Bass and Avolio‟s (1995) multifactor leadership questionnaire (MLQ – leader form –
form 5X) was selected to measure this construct. It represents one of the few measures
available that attempts to assess the full range leadership behaviour using the multi-
factorial model. The MLQ 5X identifies three types of leadership behaviour:
transformational, transactional and laissez-fair. Transformational (measures of relation-
oriented leadership behaviour) refers to the leader‟s effect on the followers where the
leader transforms and motivates followers by making them aware of the importance of

173
task outcome, inducing them to transcend their own self-interest for the sake of the
organisation and activating their higher-order needs (Block, 2003).
The subscales of transformational include charisma/inspirational (CH) (a combination of
inspirational motivation, idealized attributed and idealized behaviour subscales),
intellectual stimulation (IS), and individualized consideration (IC) (Avolio et al., 1999).
Transactional (measures of task-oriented leadership behaviour) involves motivating
followers by fulfilling their needs in exchange for performance that meets expectations.
The subscales of transactional were contingent reward (CR) and management by
exception active/passive (MA) Bass (1985) note that this category of leaders operates
within the existing environment and prefer to avoid risks and focus on efficiency and
predictability rather than change and innovation. The third types of leadership, laissez-
fair (passive/avoidant – PA) is considered non-leadership and this factor indicated an
absence of leadership in which there is no “transaction” between the leader and the
follower (Block, 2003).
The MLQ 5X consists of behavioural items uses a five-point Likert rating system (0 = not
at all; 1 = once in a while; 2 = sometimes; 3 = fairly often; 4 = frequently, if not always)
was adapted to examine this perspective. However, some modification was made to the
scale to meet the needs of this study. The six points on the semantic differential-liked
scale ranging from strongly agree (1) to strongly disagree (6) was used instead. Table 4.6
exhibits the measures for leadership behaviour.
174
Table 4.6: Measures for the Leadership Behaviour
Construct Original Measure Measures use in The Study
Leadership Behaviour (Part D)
Bass and Avolio
(1995)
Scales Items Alternative Items
models ethical
standards (CH)
display power and
confidence (CH)
proud of him (CH)
arouses awareness
about important
issues (CH) goes beyound self-
interest (CH)
creates an atmosphere
of mutual trust (chains – D1) demonstrates courage
in all transactions (charins – D2) sets a positive example
for others to follow (charins – D3) arouses awareness
about important issues (charins – D4) takes responsibility for
decisions without
finger-pointing (charins – D5)
creates a tensed atmosphere
tends to be cautious
in all transactions
rarely „practises‟ what he/she „preaches‟ is ignorant about surrounding issues
tends to blame others when wrong decision are made
emphasizes the
collective mission
(CH) Individualizes
attention (IC)
Teaches and coaches
(IC)
Focuses your
strengths (IC)
treats all employees
equitably (inconsider – D11) supports my effort to
study and develop in
my work (inconsider – D6) gives clear directions
on my work (inconsider – D7) involves me in
decisions that affect my
work (inconsider – D8)
practices favoritism
is neither interested
in me nor in my
development at work
rarely provides
directions on my
work limits my
involvement in
decisions that affect
my work
175
Table 4.6 (Continued)
Construct Original Measure Measures use in The Study
Leadership Behaviour (Part D)
Bass and Avolio
(1995)
Scales Items Alternative Items
Differentiates among
us (IC)
Clarifies rewards
(CR)
Assists based on
effort (CR)
Recognizes your
achievement (CR)
Rewards your
achievement (CR)
delegates responsibility
sensibly to subordinates (inconsider – D9)
demonstrates full
commitment to quality
initiatives (conreward – D10) assists subordinates
who show effort (conreward – D12) provides me with the
opportunity to receive
recognition for my
contributions (conreward – D13) rewards my
achievements (conreward – D14)
delegates
responsibility
excessively to
subordinates is tolerant to sub-
standard work
fails to provide the
necessary assistance
to subordinates gives me little chance
to receive any
recognition for my
contributions
discredits my
achievements
Re-examines
assumptions (IS)
Seeks different views
(IS)
Suggest new ways
(IS)
is willing to
compromise when
necessary in order to
reach an agreement (instimulate – D15) seeks better ways to get
work done (instimulate – D16) uses informal networks
to get things done (instimulate – D17)
is authoritative when
disagreements occur
is comfortable with
the existing ways of
doing work is generally very
bureaucratic
176
Table 4.6 (Continued)
Construct Original Measure Measures use in The Study
Leadership Behaviour (Part D)
Bass and Avolio
(1995
Scales Items Alternative Items
Suggest different
angels (IS)
generates innovative
ideas and solutions to
problems (instimulate – D18)
prefers the traditional
way of solving
problems
Focuses on your
mistakes (MA)
„Puts out fire‟ (MA)
concentrates on
failure (MA)
tracks your mistakes
(MA)
foresees problems
before they arise (mgtexep – D19)
works well in tensed
situations (mgtexep – D20) is transparent about
problems and/or
mistakes (mgtexep – D21) learns from mistakes
and treats errors as
lessons (mgtexep – D22)
reacts to problems as
and when they arise
is disorganized in
tensed situations
is secretive about
problems and/or
mistakes
is intolerant to
mistakes
absent when needed (PA) delays responding
(PA)
avoids involvement
(PA)
avoids deciding (PA)
is accessible at all times (pasavoid – D23) delays response to
arising issues (pasavoid – D24) takes full charge when
important issues arise (pasavoid – D25) avoids making
decisions (pasavoid – D26)
absent when needed
responsive to
important issues
avoids getting
involved when
important issues arise makes accurate
decisions

177
4.13.5 Quality of Work Life (QWL) Orientation
QWL orientation in this study serves as the mediator that may affect the relationship
between antecedents and organisational commitment. QWL orientation measures are
group into two themes. These include job characteristic (Job Diagnostic Survey - JDS)
and work environment (a combination of several QWL survey and organisational climate
questionnaire).They are mechanisms that organisations employ to gauge employee‟s
experiences within a particular organisation and issues that are specific or of importance
to an organisation (Considine and Callus, 2002; Lau and Bruce, 1998).
The measures by Hackman and Oldham (1975) pertaining to job characteristic are
adopted for this study. JDS proposed five core dimensions for evaluating the job
environment which is associated significantly with job satisfaction and a high sense of
workers‟ motivation. The five jobs design characteristics (skill variety, task identity, task
significance, autonomy and feedback) produces three critical psychological states
(experienced meaningfulness of the work, experienced responsibility for outcomes of the
work and knowledge of the actual results of work activities) which increase the
likelihood of positive personal and work outcomes (Hackman and Oldham, 1976). In
other words, employees are more likely to perceive their jobs as good jobs that are
meaningful and challenging.
The original measurement for all dimensions scored on a seven-point Likert scale ranging
from 1 (Strongly disagree) to 7 (Strongly agree). These items measure asked informant to
describe a specific job objectively. However, the scales are modified to meet the needs of
this study and the six points on the semantic differential-liked scale are ranging from
strongly agree (1) to strongly disagree (6) is applied instead.

178
The work environment category measures various dimensions of work and people in the
organisation. The various dimensions consistently arose in the literature on quality of
work life (e.g. Walton, 1974; Carlson, 1978; Saklani, 2004). In order to examine this
perspective, the general items identified by the Australian Quality of Work Life Survey
(AQWL) (2001) were adapted. These include performance appraisal, interesting and
satisfying work, pay/benefits, working condition (physical and resources), chance for
advancement, opportunity for skill development, health and safety, amount of work, work
and life balance, amount of control over work, relations with people at work and
management treatment to staff. Some modification was made to the items and scale that
would reflect the Malaysian public service environment. Again, each item is measured
using the six points on the semantic differential-liked scale are ranging from strongly
agree (1) to strongly disagree (6). Table 4.7 shows the items used.
179
Table 4.7: Measures for the QWL Orientation
Construct Original Measure Measures use in The Study
Work Environment (QWL Orientation (Part E)
Hackman and
Oldham (1975) Australian
Quality of Work
Life Index
(2002) Cook et al
(1981)
Dimensions Items Alternative Items
Job Characteristic
dimensions: Autonomy Task identity Skill variety Task significance Feedback from others Dealing with others
requires a lot of
cooperative work with
other people (jobcha -
E1)
gives me considerable
freedom to do my job
(jobcha - E2) is only a tiny part of the
overall work (jobcha - E3)
requires me to do a
number of different
things (jobcha - E4)
has the ability to
influence decisions that
significantly affect the
organisation (jobcha - E5) enables me to receive
feedback from my
supervisor/co-workers (jobcha - E6) provides me with
information about my
work performance (jobcha - E7)
requires very little
dealing with other
people
denies me the use of
my personal
initiatives to get my
job done involves doing the
entire work from
start to finish requires that I do the
same things over and
over is not very important
in the broader scheme
of things
give me little chance
to receive feedback
from my supervisor/
co-workers gives me few clues
about my work
performance
180
Table4.7 (Continued)
Construct Original Measure Measures use in The Study
Work Environment (QWL Orientation (Part E)
Hackman and
Oldham (1975) Australian
Quality of Work
Life Index
(2002) Cook et al
(1981)
Dimensions Items Alternative Items
Job Characteristic
dimensions: Autonomy Task identity Skill variety Task significance Feedback from others Dealing with others
enables me to act
independently in
performing my job
functions (jobcha - E8) is quite simple and
repetitive (jobcha - E9) gives me little chance
to get to know other
people (jobcha - E10)
provides me with the
chance to completely
finish the pieces of
work I begin (jobcha - E11) is not significant, where
the outcomes of my
work are not likely to
have any effect on
other people (jobcha - E12) gives me almost no
personal „say‟ about
how and when the work
is done (jobcha - E13) gives me many chances
to figure out how well I
am doing (jobcha - E14)
gives me little chance
to make my own
judgments
requires a high level
of skill gives me the
opportunity to
develop networking
with other people is arranged so that I
do not have the
chance to do the
entire piece of work
is one where a lot of
other people can be
affected by how well
the work gets done
provides me with the
opportunity for
independent thought
and action
provide little
opportunity to find
out how well I am
doing

181
Table 4.7 (Continued)
Construct Original Measure Measures use in The Study
Works Environment (QWL Orientation (Part E)
Hackman and
Oldham (1975) Australian
Quality of Work
Life Index
(2002) Cook et al
(1981)
Dimensions Items Alternative Items
Work environment
includes: performance
appraisal interesting and
satisfying work pay/benefits working condition
(physical and
resources) chance for
advancement opportunity for skill
development health and safety amount of work work and life balance amount of control
over work relations with people
at work management
treatment to staff
provides me with the
tools and resources to
do my job effectively (workenv - E15) provides adequate
chances for me to
pursue professional
development and
growth (workenv - E16) gives me a great sense
of personal satisfaction (workenv -E17)
allows me to see the
results of my own work (workenv - E18)
requires that I work
very fast (workenv - E19)
often requires me to
handle unpredictable
situations (workenv - E20)
gives me little access
to the resources
required to do the job
gives me little chance
for personal
development and
growth
often makes me think
of quitting
gives me little chance
to know the impact of
my work
allows me to control
my own work pace
gives me the
opportunity to know
what to expect from
the job
182
Table 4.7 (Continued)
Construct Original Measure Measures use in The Study Works Environment (QWL Orientation (Part E)
Hackman and
Oldham (1975) Australian
Quality of Work
Life Index
(2002) Cook et al
(1981)
Dimensions Items Alternative Items Work environment
includes:
- Similar scales -
I am provided with
more than enough
training skills (workenv - E21) my abilities are not
fully utilized (workenv - E22) the allocation for
employee training is
small (workenv -E23) I am always treated
fairly with regards to
career opportunities (workenv - E24) communication
between the
management and
employees is open (workenv - E25) the amount of fringe
benefits I receive is
reasonable and good (workenv - E26) I rarely share my
expertise with co-
workers (workenv - E27)
I find it difficult to cope
with the amount of
work I have to do (workenv - E28)
I am deprived from
getting sufficient
training
my abilities are fully
utilized
the allocation for
employee training is
big I am rarely treated
fairly with regards to
career opportunities
communication
between the
management and
employees is guarded
the amount of fringe
benefits I receive is
insufficient
I share my expertise
extensively with co-
workers
I receive a reasonable
amount of work that I
am expected to do

183
Table 4.7 (Continued)
Construct Original Measure Measures use in The Study Works Environment (QWL Orientation (Part E)
Hackman and
Oldham (1975) Australian
Quality of Work
Life Index
(2002) Cook et al
(1981)
Scales Items Alternative Items
- Similar scales -
employee morale is
high (workenv - E29)
management takes care
of employee welfare (workenv – E30) I often face difficulties
in balancing my work
and family lives (workenv – E31) work assignments are
fairly distributed
among employees (workenv – E32 my safety at work is
seriously taken care of
by the management (workenv – E33) the working
environment is flexible (workenv – E34) my chances for career
advancement are good (workenv – E35) I work under a great
deal of pressure (workenv – E36) employee performance
is evaluated fairly (workenv – E37)
employee morale is
low management gives
low priority to
employee welfare I am able to balance
my work priorities
with my personal life
work assignments are
distributed to only a
few employees
my safety at work is
often neglected by
the management
the working
environment is
restrictive my chances for career
advancement are poor
I feel at ease and
relaxed while doing
my work employee appraisals
are not done fairly

184
Table 4.7 (Continued)
Construct Original Measure Measures use in The Study
Works Environment (QWL Orientation (Part E)
Hackman and
Oldham (1975) Australian
Quality of Work
Life Index
(2002) Cook et al
(1981)
Dimensions Items Alternative Items
- Similar scales -
there are essentially no
continuing problems
that reduce my
efficiency at work (workenv – E38) conflicts are accepted
and “worked through” (workenv – E39) the physical working
conditions are very
pleasant (workenv – E40)
there are many
problems that reduce
my efficiency at
work
conflicts are always
avoided or
suppressed the physical working
conditions are very
unpleasant
Using factor analysis the criteria are prioritize into five interrelated dimensions. These
dimensions interestingly found to be similar to the quality of nursing work life (QNWL)
empirical dimensions (Villeneuve et al. (1995), and similar to criteria of QWL
conceptualized by Walton (1975). The five dimensions are further defined by a synthesis
of criteria from prior work in STS, the QWL and QNWL as shown below.
The first dimension is termed the work setting issues and is a broad dimension that
involves physical work environment and the circumstances surrounding. This includes
relationships with supervisory personnel, co-workers, team colleagues, performance
evaluation, communication, welfare, safety and promotion of lifelong learning by the
organisation.This dimension is also referred as characteristics of the organisation
(Attridge and Callahan, 1990) or organisational context (Turcotte, 1988). In this context,

185
organisational or management support appears to play a key role in shaping the
environment of the organisation (Wilson et al., 2004).
Table 4.8: Five Dimensions of the Conceptual QWL Framework
Dimensions
Definition Instrument Items
Work Setting
Issues
As the physical work
environment and the
circumstances surrounding
including the social and
interpersonal aspects of the
work
Open communication among
members
Pleasant working conditions
Management takes care employee
welfare
Receive reasonable fringe benefits
Management serious on work safety
Fair treatment for career
opportunities
Career advancement are good
No continuing problems
Performance evaluated fairly
Employees morale is high
Provide enough training skills
Flexible work environment
Conflicts are accepted and work
through
Gives me freedom to my job
Work assignment fairly distributed
Job itself As the composition of work an
individual perform or the
actual work an employee do
Chance to pursue professional
development
Provide information on work
performance
Gives personal satisfaction
Able to see my work results
Chance to figure how work is done
Enables me to act independently
Ability to influence decision that
affect organisation
Receive ample resources to do my
job
No personal say about how work to
be done

186
Table 4.8 (Continued)
Dimensions
Definition Instrument Items
Challenge of
work
As the work practice settings in
which employee work and the
impact of the work
environment.
Requires cooperative work with
others
Requires me to do a number of
different thing
To receive feedback from others
Handle unpredictable situations
Require me to work fast
Chance to finish the whole work
Feeling about
work
As employee perception
towards his/her job
Little chance to get to know other
people
Simple and repetitive
Only a tiny part of the overall work
Small employee training allocation
Abilities not fully utilized
Work-home
life interaction
As the interface between the
life experience of employee in
their workplace and in the
home
Difficult to cope with workload
Difficult to balance work and family
lives
Rarely share expertise with others
Work not significant and no effect
on others
Work under great pressure
The aspect of job characteristics emphasizes employee individual perceptions of their
immediate work tasks. These aspects have been categorized into three dimensions: the
challenge of work which includes work practice settings in which employee work and the
impact of the work environment. Another aspect of the job characteristic dimension is the
job itself or the nature of work, the composition of work an individual perform or the
actual work an employee do. Here are items that define employees‟ immediate
environment such as autonomy, the provision of resources to do the job, workload

187
control, and job content. Such work arrangements are usually design to accommodate
individual needs and consistent with the social structure (Parker and Wahl, 1998).
The feeling for work is another aspect of job characteristics which reflect an individual
perception toward his/her job. These includes the extent the work provide experience
meaningfulness in terms of variety, identity and significant. The fifth dimension is termed
as work-home life interaction. This dimension reflect the balanced role of work where
work schedules, career demands and other job requirement do not take up leisure and
family time on a regular basis (Walton, 1975; Hackman and Oldham, 1975; Villeneuve et
al.,1995). Organisation of items in such fashion will allow exploration of the field as well
as documentation of the empirical referent underlying the frame work.
4.13.6 Organisational Commitment
Organisational commitment has been widely defined as identification and involvement
with the organisation. This encompasses multiple attitudes of an employee such as
loyalty to the organisation, willingness to contribute, exerting effort on behalf of the
organisation and desire to remain in the organisation (Mowday, Steers and Porter, 1979).
In this study, organisational commitment was measured as a whole attitudinal construct
by using a widely used questionnaire, developed by Mowday et al. (1979). It consists of
15 statements, which assesses the magnitude of an employee identification and
investment in an organisation. The scales however, are modified to meet the needs of this
study (amending the five point Likert scales used in the original measurement). The six
points on the semantic differential-liked scale are ranging from strongly agree (1) to
strongly disagree (6). Table 4.9 exhibits the measures for organisational commitment.
188
Table 4.9: Measures for the Organisational Commitment
Construct Original Measure
Measures use in The Study
Organisational Commitment (Part F)
Items Alternative Items
Mowday,
Steers and
Porter (1979)
I am willing to put in a great
deal of effort beyond that
which is normally expected in
order to help this organisation
be successful I talk about this organisation
to my friends as a great
organisation to work for
I feel very little loyalty to this
organisation
I would accept almost any
type of job assignment in
order to keep working for this
organisation
My values and the
organisation‟s values are
similar I am proud to tell others that I
am part of this organisation
I could just as well be
working for a different
organisation as long the type
of work were similar
This organisation really
inspires the very best in me in
the way of job performance
same measure used
same measure used
I avoid going out of
my way just to help
the organisation
I would not
recommend a close
friend to join my
organisation I feel a strong sense
of loyalty towards
this organisation If I got another offer
for a better job
elsewhere, I would
certainly leave this
organisation My values and the
organisation‟s values
are different I do not feel proud to
be part of this
organisation It would be very hard
for me to leave this
organisation right
now, even if I wanted
to This organisation
does not inspire me in
the way of job
performance

189
Table 4.9 (Continued)
Construct Original Measure Measures use in The Study
Organisational Commitment (Part F)
Mowday, Steers
and Porter
(1979)
Items Alternative Items
It would cause very little
change in my present
circumstances to leave this
organisation I am extremely glad that I
chose this organisation to
work for, over others I was
considering at the time I
joined There‟s not too much to be
gained by sticking with this
organisation indefinitely
Often, I find it difficult to
agree with this organisation‟s policies on
important matters relating
to its employees
I really care about the fate
of this organisation
For me this is the best of all
possible organisations for
which to work
Deciding to work for this
organisation was a definite
mistake on my part
same measure used
same measure used
Too much of my life
would be disrupted if
I decided to leave this
organisation I think I have made a
terrible mistake to
work in this
organisation
Barring unforeseen
circumstances, I
would remain in this
organisation
indefinitely I think most of the
time the organisation tries to
be honest and fair in
dealing with its
employees I have no particular
sentiments towards
this organisation I have always felt that
this organisation was
a cold and unfriendly
place to work I think I have made
the right decision to
work in this
organisation
190
Section Three: Validity and Reliability Assessments
4.14 Introduction of Validity and Reliablity
A critical aspect in any studies is the development of good measures to obtain valid and
reliable estimates of the constructs of interest. It is the hallmarks of good measurement
and a researcher first line of defense against spurious and incorrect conclusions (Salkind,
2000:105).By establishing the validity and reliability of the constructs, it will be easier to
standardize the measurement scales and eventually measure the constructs. Moreover, it
involvesa measurement of accuracy and applicability (Malhotra, 2004). The main reason
behind validity and reliability is the reduction of measurement errors. The idea is to
develop a measurement that reflects a true score of the variables being measured
(Churchill and Iacobucci, 2002). Figure 4.2 illustrates the possible test used to examine
the reliability and validity of measurement.
4.15 Validity
Validity is defined as the “extent to which a measure or set of measures correctly
represents the concept under study – the degree to which it is free from any systematic or
non-random error (Hair et al. 2006). Validity is concerned with how well the concept is
defined by the measure(s).” Perfect validity requires that there be no measurement error
(Xo = XT, XR = 0, XS = 0) (Maholtra, 2004). In testing the validity of the instrument, the
notion of construct, the most important validity tests namely content, convergent,
construct and finally discriminant validity are highlighted in this study.
191
Figure 4.2: Scale Evaluation
Source: Adapted from Malhotra, (2004)
4.15.1 Content Validity
Content validity or face validity is the degree to which the content of the items
adequately represents the universe of all relevant items under study (Cooper and
Schindler, 2006). The evaluation of content validity is a rational judgment process not
open to numerical justification. An instrument has content validity if there is a general
agreement among the subjects and researchers that the measurement items that cover all
important aspects of the variable being measured (Maholtra, 2004). Churchill (1979), in
this regard, recommends that the scale development process discussed earlier helps to
ensure content validity. Given that the method used to evaluate content validity are
Scale Evaluation
Construct
Convergent
Validity
Content
Reliability Generalisability
Criterion Test
Retest
Alternative
Forms
Internal
Consistency Nomological
Discriminant
192
subjective and judgmental (Cooper and Schindler, 2006) where the adequacy of the item
can be argued by other people or researchers, a more formal measure can be obtained by
examining construct and criterion validity (Malhotra, 2004).
4.15.2 Construct Validity
Construct validity addresses the issue of what the constructs or characteristics of scales
are actually measuring (Maholtra, 2004). It lies at the very heart of the scientific process
(Churchill, 1979) and embodies the process of theory development and testing (Mentzer
and Flint, 1997). Evidence of construct validity provides confidence that item measures
taken from a sample represent the actual true score that exists in the population. In this
study, each measurement scale was evaluated by analyzing its convergent and
discriminant validity using factor analysis. Nunnally (1978) indicate that factor analysis
has a role in testing those aspects of validity. Both types of factor analysis, i.e., the
exploratory factor analysis and followed by the confirmatory factor analysis were used in
this study to measure construct validity of the scales. The discussion on the results of
construct validity checking based on factor analysis is shown below:
4.15.2.1 Methods of Assessing Construct Validity
Factor Analysis
According to Maholtra (2004), factor analysis is a class of procedures primarily used for
data reduction and summarization. The underlying principle of factor analysis is data
parsimony and data interpretation (Churchill and Iacobucci, 2002, Zikmund, 2003). The
items are condensed into a smaller set of new, composite dimensions with a minimum

193
loss of information (Hair et al., 2006). The procedures also help researchers to discover
patterns in the relationships amongst variables and enables reduction of the number of
variables into factors combined from these variables. In terms of sample size suitable for
factor analysis, Tabachnick and Fidell (2001) concede that a smaller sample size (e.g.
150) should be sufficient while Hair et al (2006) indicated that the technique can be
performed on observation of more than 50. With the sample size of 203, thus, the data set
is suitable for factor analysis for this study.
Pallant (2005) state that there are two main approaches to factor analysis describes in the
literature namely, exploratory and confirmatory factor analysis. These factor analyses are
designed to explore and confirm the relationship of measures in the research and are also
meant to be an alternative for one another.
(i) Exploratory Factor Analysis (EFA)
EFA is often used in the early stages of research for data exploration to generate
hypotheses. The technique enables researchers to determine the structure of factors to be
examined and can be conducted although the relationship between latent and observed
variables is unknown or uncertain (Bryne, 2001). The distinctive feature of this technique
is that the factors were derived from statistical results (Hair et al, 2006).
In this study, exploratory factor analysis was conducted to establish dimensionality and
convergent validity of the relationship between items and constructs. The Kaiser-Meyer-
Olkin (KMO) and Barlett‟s Test of Sphericity (Bartlett‟s Test) were also employed as
they are measures of sampling adequacy (Pallant, 2005). KMO index that ranges from 0
194
to 1 indicates whether significant correlations are present in the data matrix, which allow
researcher to determine the appropriateness of factor analysis. The index can be
interpreted as follows: 0.8 or above, as meritorious; 0.7 or above as middling; 0.6 or
above, as mediocre; 0.5 or above as miserable; and below 0.5 as unacceptable (Hair et al.,
2006). Bartlettt‟s Test with a significance value of less than 0.05 (p < 0.05) and KMO
with more than 0.60 are considered appropriate for factor analysis (Pallant, 2005).
Bartlett‟s Test shows whether or not the correlation among the factors in the matrix is
identical while KMO is an index used to examine the appropriateness of factor analysis.
The method of principal component with varimax orthogonal rotation was employed for
analysis, because the method is robust and produces more easily interpretable results
(Pallant, 2005). The varimax rotation also maximizes the variance of the loading (Hair et
al, 2006). In this context, the factor loading indicate the strength of the relationship
between the item and the latent construct. A coefficient of more than 0.30 indicates a
reasonable loading (De Vaus, 2002). The factor loading is useful in assessing the
convergent and discriminant validity of the scales (Hair et al, 2006).
The results of factor analysis of all the constructs are exhibited in Table 4.10. The KMO
shows meritorious results of 0.80 and above. This signifies that the variables share a
large amount of common variance. Likewise, Bartlett‟s Test exhibits a significance of
0.00, suggesting that the correlation matrix is not an identity matrix and the null
hypothesis can be rejected. Results from Bartlett‟s and KMO point to the appropriateness
of the factor model.

195
From Table 4.10, the four factors of social capital were produced from the result with
eigen values greater than one. None of the twenty items was dropped. The four factors
contributed 62.80% to the total variance explained and the factor loadings of the items
were between 0.402 and 0.836. The four factors were labelled as relational, network ties,
engagement and communication.

196
Table 4.10: Exploratory Factor Analysis of the Constructs
Social Capital : α = 0.915; KMO = 0.884 ; Bartlett‟s: Sig. = 0.000
Relational F1 F2 F3 F4
Treats employees with respects (rela1) Top priority to employee well-being (rela2) Management treat employees fairly (rela3) Pays attention to employees suggestion (rela4) Information communicated timely (rela5) Received recognition for doing good job (rela6) Good relationship between management and employee (rela7) Received support to make work decision (rela8)
0.836 0.826 0.743 0.727 0.718 0.704 0.682 0.592
Network Ties
Trust co-workers as the best way to work (nwork1) Close friendship with all colleagues (nwork2) Good communication among people (nwork3) Kept informed about work progress (nwork4)
0.825 0.756 0.668 0.509
Engagement
Plan to work here until retire (engage1) Sad if had to move to other organisation (engage2) Work hard beyond expectation (engage3) Collaboration exists because of hierarchy (engage4)
0.822 0.798 0.722 0.480
Communication
Work issues discussed during break (comm1) Have freedom to decide work schedule (comm2) Can put ideas to practice (comm3) Aware what‟s going on with other sections (comm4)
0.716 0.654 0.483 0.402
Five factors of organisational culture were derived from the output (Table 4.10) with
eigen values greater than one. Out of the 26 items, 24 items were found to have
reasonable factor loading (>0.30). The factor solution accounted for approximately
59.07% of the total variance explained by five factors labelled as stability,
peopleorientation, innovation, aggressiveness and team orientation. The values of factor
loading were ranged between 0.404 and 0.830.

197
Table 4.10 (Continued)
Organisational Culture : α = 0.916; KMO = 0.903 ; Bartlett‟s: Sig. = 0.000
Stability F1 F2 F3 F4 F5
Stable organisation (stab1) Management calm when encountered crisis
(stab2) Employees behave ethically (stab3) High performance expectation organisation
(stab4) Resolve disagreement through compromise
(stab5) Management informed changes affecting
organisation(stab6) Management recognized for being competitive
(stab7)
0.729 0.727
0.705 0.697
0.613
0.610
0.464
People Orientation
Opportunities for professional growth (peo1) Supervisors praises performance (peo2) Openly flows of information (peo3) Contribution was paid fairly (peo4) Easy to collaborate with others (peo5) Corporate values guide management decisions
(peo6)
0.761 0.701 0.677 0.645 0.630 0.514
Aggressiveness
Think of better ways to do work (aggres1) Different from others (aggres2) Top priority for quality initiatives (aggres3) Take pride in doing good job (aggres4) Fixed benefits regardless of performance
(aggres5)
0.774 0.677 0.600 0.479 0.404
Innovation
Willing to take risks on the job (innov1) Take advantage on opportunities (innov2) Take bold actions (innov3) Take individual responsibility (innov4) Seek innovative approaches (innov5)
0.830 0.799 0.661 0.578 0.477
Team Orientation
Used teamwork to get job done (team1) Objectives clearly defined (team2) Organisation responsive to stakeholder demands
(team3) Socially responsible organisation (team4)
0.735 0.626 0.619
0.576

198
Following item analysis, the fifteen items of organisation structure constructs were also
subjected to exploratory factor analysis with principal component factor analysis and
varimax rotation used to confirm the number of factors to be extracted (Hair et al., 1998).
As in Table 4.10, three factors were derived from the output with eigen values greater
than one. The three factors contributed 58.28% to the total variance explained with the
values of factor loadings between 0.427 and 0.831. The factors were labelled as
centralization, complexity and formalization.
Table 4.10 (Continued)
Organisation Structure : α = 0.805; KMO = 0.846 ; Bartlett‟s: Sig. = 0.000
Centralization F1 F2 F3
Ask supervisor before doing anything (central1) Refer to supervisor to correct mistake (central2) Minimal action until supervisor approves (central3) Discourage from making decision (central4) Participate minimally (central5) Small matters refer to supervisor (central6) Little chance to decide on work method (central7)
0.831 0.792 0.749 0.737 0.677 0.663 0.543
Complexity
Employees widely dispersed spatially (complex1) Face barriers to express ideas (complex2) Going through proper channels (complex3) Constantly being watched by supervisor (complex4)
0.782 0.755 0.543 0.427
Formalization
Clear written rule available (formal1) Duties documented in job descriptions (formal2) Required to obey all work rules (formal3) Organisation structure with subunits (formal4)
0.797 0.797 0.692 0.632
For leadership behaviour, two factors were extracted from the 26 items of this construct.
Two items were dropped and the remaining 24 items were found to have high factor
loadings (>0.5). The two factors labelled as relation-oriented and task-oriented accounted
199
for approximately 67.42% of the total variance explained and the values of factor
loadings were ranged between 0.591 and 0.848.
Table 4.10 (Continued)
Leadership Behaviour : α = 0.975; KMO = 0.968 ; Bartlett‟s: Sig. = 0.000
Relation-oriented F1 F2
Treats employees equitably (relo1) Assists subordinate who show effort (relo2) Opportunity to receive recognition (relo3) Accessible at all time (relo4) Takes responsibility for decision made (relo5) Rewards my achievement (relo6) Full commitment to quality initiatives (relo7) Compromise to reach agreement (relo8) Gives clear directions on work (relo9) Involves me in decision affecting my work (relo10) Create mutual trusts atmosphere (relo11) Sets positives example for others (relo12) Arouses awareness on important issues (relo13) Learns from mistakes (relo14) Take full charge on important issues (relo15) Delegates responsibility sensibly (relo16) Supports employees to study and develop(relo17) Works well in tensed situations (relo18)
0.795 0.777 0.773 0.742 0.739 0.732 0.730 0.715 0.700 0.699 0.697 0.689 0.664 0.664 0.655 0.634 0.630 0.626
Task-oriented
Uses informal network (task1) Seeks better ways to get work done (task2) Foresee problems before arise (task3) Courage in all transaction (task4) Transparent about problems (task5) Generates innovative ideas (task6)
0.848 0.759 0.733 0.661 0.658 0.591

200
Table 4.10 (Continued)
Quality of Work Life: α = 0.887; KMO = 0.900 ; Bartlett‟s: Sig. = 0.000
Work setting issues F1 F2 F3 F4 F5
Open communication among members (workset1) Pleasant working conditions (workset2) Management takes care employee welfare (workset3) Receive reasonable fringe benefits (workset4) Management serious on work safety (workset5) Fair treatment for career opportunities (workset6) Career advancement are good (workset7) No continuing problems (workset8) Performance evaluated fairly (workset9) Employees morale is high (workset10) Provide enough training skills (workset11) Flexible work environment (workset12) Conflicts are accepted and work through (workset13) Gives me freedom to my job (workset14) Work assignment fairly distributed (workset15)
0.747 0.720 0.716 0.697 0.695 0.691 0.670 0.656 0.646 0.644 0.610 0.556 0.533 0.525 0.446
Job itself
Chance to pursue professional development (job1) Provide information on work performance (job2) Gives personal satisfaction (job3) Able to see my work results (job4) Chance to figure how work is done (job5) Enables me to act independently (job6) Ability to influence decision that affect organisation (job7) Receive ample resources to do my job (job8) No personal say about how work to be done (job9)
0.651 0.619 0.615 0.580 0.565 0.556 0.502
0.498 0.424
Challenge of work
Requires cooperative work with others (chaw1) Requires me to do a number of different thing (chaw2) To receive feedback from others (chaw3) Handle unpredictable situations (chaw4) Require me to work fast (chaw5) Chance to finish the whole work (chaw5)
0.727 0.666 0.590 0.579 0.577 0.487
201
Table 4.10 (Continued)
Quality of work life :
Work home life interaction F1 F2 F3 F4 F5
Difficult to cope with workload (wkhom1) Difficult to balance work and family lives
(wkhom2) Rarely share expertise with others (wkhom3) Work not significant and no effect on others
(wkhom4) Work under great pressure (wkhom5)
0.724 0.723
0.568 0.517
0.412
Feeling about work
Little chance to get to know other people (feel1) Simple and repetitive (feel2) Only a tiny part of the overall work (feel3) Small employee training allocation (feel4) Abilities not fully utilized (feel5)
0.727 0.699 0.585 0.483 0.408
As illustrated in Table 4.10, five factors of QWL orientation were extracted representing
52.71% of the total variance explained. The five factors were identified as work setting
issues (explained 19.32% of the total variance), job itself (explained 10.41% of the total
variance), challenge of work (explained 9.23% of the total variance), work-home life
interaction (explained 7.78% of the total variance) and feeling about work (explained
5.97% of the total variance). None of the 40 items were dropped and the values of factor
loadings were ranged between 0.408 and 0.747.
Finally, three factors of organisational commitment were derived from the output (Table
4.10) with eigen values greater than one. None of the 15 items were dropped and the
three factors contributed 59.32% of the total variance explained with the values of factor

202
loadings between 0.466 and 0.834. The three factors were identified as active, passive
and no commitment.
Table 4.10 (Continued)
Organisational Commitment : α = 0.871; KMO = 0.889 ; Bartlett‟s: Sig. = 0.000
Active commitment F1 F2 F3
work beyond expectation for organisation (acom1) care about the fate of this organisation (acom2) proud to be with this organisation (acom3) have similar values with organisation (acom4) accept all work in order to be in this organisation (acom5) promote organisation as good workplace (acom6) organisation gives inspiration to do the best (acom7)
0.781 0.705 0.700 0.671 0.638 0.609 0.601
Passive commitment
it‟s a mistake to work with this organisation (passive1) often disagree with organisation employees policies (passive2) regard this organisation as the best workplace (passive3) glad to choose and work in this organisation (passive4) feel little loyalty to organisation (passive5)
0.765 0.713 0.650 0.617 0.466
No commitment
can work with other organisation with similar job (no1) present circumstances not affected if leave job (no2) not much gain receive if work in this organisation (no3)
0.834 0.790 0.692
ii) Confirmatory Factor Analysis: Structural Equation Modeling -
Measurement Models
For the purpose of this study, structural equation modeling (SEM) using AMOS was used
as the primary construct validation tool. That is, confirmatory factor analysis (CFA) is
used to analyze convergent and discriminant validity, by assessing the measurement
model developed for testing each of the main variables in this study. The advantages of
using confirmatory factor analyses (Bagozzi et al. 1991: 429) are:
203
(i) measures of the overall degree of fit are provided in any particular
application (e.g., the chi-square, goodness-of-fit test),
(ii) useful information is supplied as to if and how well convergent and
discriminant validity are achieved (e.g., through „chi-square difference
tests, the size of factor leadings for traits and the estimates for trait
correlations), and;
(iii) explicit results are available for partitioning variance into trait, method,
and error components (e.g., through squared factor loadings and error
variance).
Cheng (2001) states that there are two methods commonly used by researchers in
evaluating the validity of measurement model: testing each construct separately, or
testing all construct together at one time.
CFA is used to examine convergent and discriminant validity. Convergent validity would
be accessed through the inspection of the statistical significance of factor loadings (the
estimated parameter between latent variables and their indicators). In terms of the value
of standardized loading, the commonly considered threshold value is 0.4 (Ford,
MacCallum and Tait, 1986).
In assessing the convergent validity, the proposed model has to exhibit a holistic fit. In
this context, researchers should use multiple indices of model of model in determining
the fit model fit of the model, choose the indices that operationalise different aspects of
model fit, and be consistent with the choice of decision rule within and across any
204
analysis (Kelloway, 1995; Hair et al., 2006). To evaluate the overall model fit, Garver
and Mentzer (1999) indicate two strategies: (i) selecting fit indices which represent
different families of fit indices, and (ii) specifying a stringent criteria and selecting fit
indices that best represent this criteria.
Despite a number of fit indices available to evaluate the overall fit, there is little
consensus regarding the best index to be used or which index performs better under
different conditions. According to Hair et al., (2006) and Schumacker and Lomax, (1996)
the hypothesised models need to illustrate a satisfactory fit in terms absolute fit,
incremental fit and model parsimony. Model fit means that the hypothesised model fits
the data well. Absolute fit indices are a direct measure of how well the model specified
by the researcher reproduces the observed data. These indices include chi-square statistics
( 2), normed chi-square or relative chi-square ( 2 /df), goodness-of-fit (GFI), adjusted
goodness-of-fit (AGFI) and root mean-square error of approximation (RMSEA).
Incremental fit indices differ from absolute fit indices in that they assess how well a
specified model fits relative to some alternative baseline model. The most common
baseline model is referred to as a null model, one that assumes all observed variables as
uncorrelated. Here, the results of relationship from the models are compared with the
independent models. The score for the incremental fit model ranges from 0 to 1. A score
close to 1 suggests a perfect fit whereas 0 refers to there being no difference between and
independent model. The indices of the incremental fit comprising of the Normed Fit
Index (NFI), the Comparative Fit Index (CFI), Tucker Lewis Index (TLI) or Non-Normed
Fit Index (NNFI) and Relative Noncentrality Index (RNI).
205
Finally, parsimony fit indices refer to the application of parameters or the coefficient of
model. The fewer the estimated parameters used in the model, the more parsimonious the
model (Hair et al., 2006; Bentler, 1995). The indices include the Parsimony Goodness-of
Fit Index (PGFI), The Parsimony Normed Fit Index (PNFI) and Aikaike Information
Criterion (AIC).
It was argued that many fit indices do not meet the above criteria because they are
adversely affected by sample size (Garver and Mentzer 1999). The chi-square for
example, is the most common method used in evaluating the overall model fit. However,
it is often criticized because of its high sensitivity to sample size, and the fact that the
significance level can be misleading (Hair et al., 2006). In relation to the criteria used,
Garver and Mentzer (1999) recommended three (3) fit indices: (1) the Tucker-Lewis
index (TLI); (2) the comparative fit index (CFI); and the root mean squared
approximation of error (RMSEA). The authors further suggest that when samples of the
study are small (less than 200) TLI and CFI are preferred as they are less likely to
produce biased estimates (Bentler, 1989; Kline, 1998). Others like Kline et al. (1998)
suggested the Goodness of fit index (GFI) and Adjusted Goodness of fit index (AGFI) to
be used to measure the fitness of the model.
As a result from the discussion above, this study used the fit indices recommended by
Garver and Mentzer (1999), which were: (1) the Tucker-Lewis index (TLI); (2) the
comparative fit index (CFI); and the root mean squared approximation of error (RMSEA)
as they are all scaled on a pre-set continuum (0 to 1) for easy interpretation and relatively
independent of sample size effects. Furthermore, this study would also use the goodness-
of-fit (GFI) and Normed Fit Index (NFI) as additional important fit indices, which is

206
commonly used in the previous research, the Chi square, degree of freedom and its
significance level as these figures are important in examining the discriminant validity.
Table 4.11 defines the indicators used to measure the model fit.
All indices discussed thus far are estimated for the measurement models of the study.
They are also used to test for convergent and discriminant validity, which is discussed
below. These indices, however, are not the only criteria used to accept or reject the
hypothesised model. Other unanticipated extenuating circumstances that may affect the
interpretation of model results must also be considered (Hair et al., 2006).
Convergent and Discriminant Validity
Convergent validity refers to the degree to which different methods used to measure the
same construct produce similar results (Anderson and Gerbing, 1988). In other words, it
is based on the correlation between responses obtain by maximally different methods of
measuring the same construct. Ideally, convergent validity is tested by determining
whether the items in a scale converge or load together on a single construct in the
measurement models (Garver and Mentzer 1999). If there is no convergence, the theory
used in the study needs to be analyzed, or the purification of measures can be carried out
by eliminating the items. As suggested by Garver and Mentzer (1999) for examining
convergent validity, the overall fit of the measurement model will be assessed. In this
case to evaluate the overall fit of the model, the Chi Square statistics, GFI, CFI, TLI and
RMSEA will be used as fit indices.
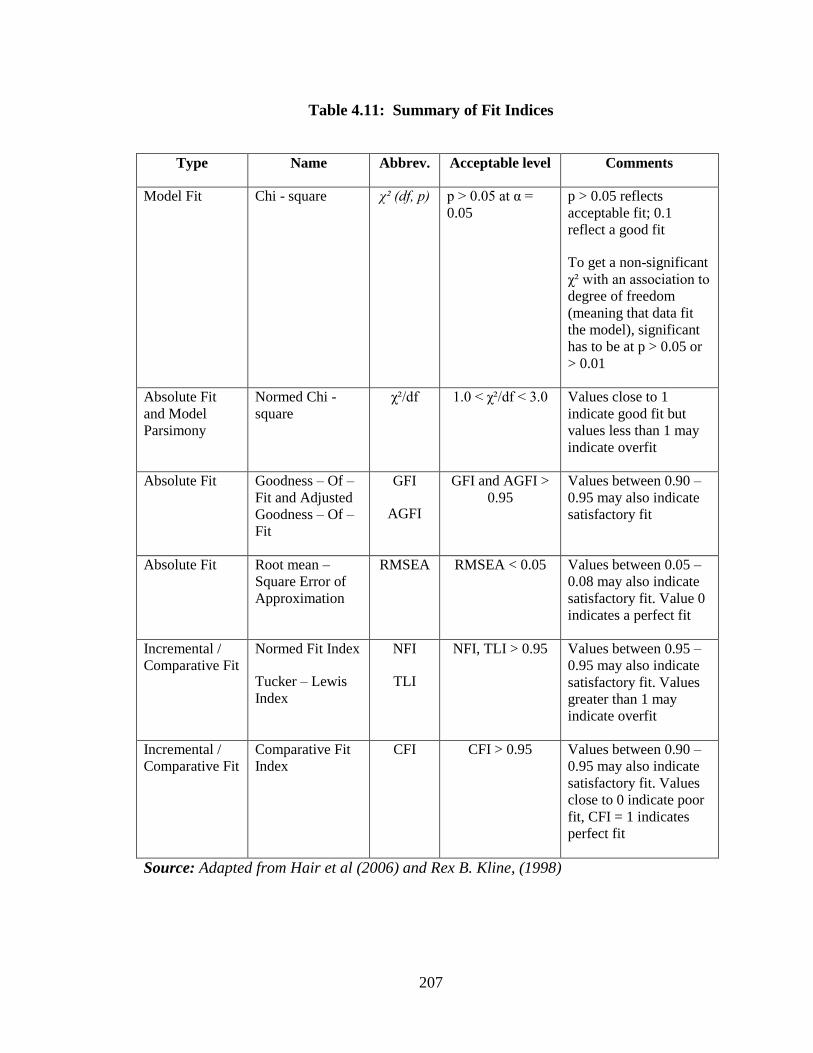
207
Table 4.11: Summary of Fit Indices
Type Name Abbrev. Acceptable level Comments
Model Fit Chi - square χ² (df, p) p > 0.05 at α =
0.05 p > 0.05 reflects
acceptable fit; 0.1
reflect a good fit
To get a non-significant
χ² with an association to
degree of freedom
(meaning that data fit
the model), significant
has to be at p > 0.05 or
> 0.01
Absolute Fit
and Model
Parsimony
Normed Chi -
square χ²/df 1.0 < χ²/df < 3.0 Values close to 1
indicate good fit but
values less than 1 may
indicate overfit
Absolute Fit Goodness – Of –
Fit and Adjusted
Goodness – Of –
Fit
GFI
AGFI
GFI and AGFI >
0.95 Values between 0.90 –
0.95 may also indicate
satisfactory fit
Absolute Fit Root mean –
Square Error of
Approximation
RMSEA RMSEA < 0.05 Values between 0.05 –
0.08 may also indicate
satisfactory fit. Value 0
indicates a perfect fit
Incremental /
Comparative Fit Normed Fit Index
Tucker – Lewis
Index
NFI
TLI
NFI, TLI > 0.95
Values between 0.95 –
0.95 may also indicate
satisfactory fit. Values
greater than 1 may
indicate overfit
Incremental /
Comparative Fit Comparative Fit
Index CFI CFI > 0.95 Values between 0.90 –
0.95 may also indicate
satisfactory fit. Values
close to 0 indicate poor
fit, CFI = 1 indicates
perfect fit
Source: Adapted from Hair et al (2006) and Rex B. Kline, (1998)

208
On the other hand, discriminant validity is the extent to which a construct is truly distinct
from other constructs (Hair et al, 2006). It means that items from one scale should not
load or converge too closely with items from a different scale and that different latent
variables which correlate too highly may indeed be measuring the same construct rather
than different constructs (Garver and Mentzer 1999). In other words, high discriminant
validity provides evidence that a construct is unique and captures some phenomena other
measures do not.
Confirmatory factor analysis, as discussed earlier, is applied in this instance to examine
the instruments in terms of their convergent and discriminant validity. Therefore,
structural equation modeling with Analysis of Moment Structure (AMOS) version 6 is
adopted to examine convergent validity of the constructs used in this study. The section
below discusses the results of convergent and discriminant validity in detail.
Measurement Models
(i) Results of Convergent Validity
Steenkamp and van Trijp (1991) point out three criteria that are used to assess the
convergent validity: (1) the overall fit measurement model; (2) the critical ratio (t-test)
for the factor loading; and (3) the magnitude, direction, and statistical significance of the
estimated parameters between latent variables and their indicators.
Table 4.12 captures all the results of confirmatory factor analysis on the constructs in this
study while, Figures 4.3 to 4.24 exhibit the measurement models for the constructs of the
study namely organisation structure, organisational culture, social capital, leadership

209
behaviour, QWL orientation and organisational commitment. The results from these
model shows that based on modification indices and standardized error, a few items were
deleted to get the data to fit the model. According to Nijssen and Douglas (2004),
dropping items from previous validated scale must be carried out judiciously and sensibly
and in this case, there is justification for dropping the items. For instance, the scales for
organisational structure, leadership behaviour and social capital were integrated from
various researches and are considered exploratory in nature. Therefore, in order to seek
greater parsimony and fitness dropping items were considered legitimate. In fact,
Nyambegera, Daniels and Sparrow (2001) contend that in most exploratory studies there
is a need to delete certain items in the original scales in order to improve their fitness,
validity and reliability. Furthermore, the integrated items had never been used in a
Malaysian sample compared to the previous studies which used scales that were already
established and validated.
Based on the results shown in Table 4.12, all the criteria for the incremental/comparative
fit (CFI and TLI) are above the threshold value of 0.90; thus, provide evidence of a good
fit model. The chi-square statistics offers the most basis fit measure reflecting the sample
size and the value of the maximum likelihood fitting function. Kline (1998) proposed that
χ2/df ratio values of less than 3 are considered favourable for a large sample (i.e. sample
sizes of 200 or more). All values of χ2/df are between 1 and 3, while RMSEA is within
the satisfactory fit (0.05 – 0.08). This shows that χ2/df and RMSEA are good indicators of
the absolute fit of the model. Furthermore, the GFI value of over 0.90 also provides
evidence of an acceptable fit. All of these fit evidences suggest that the convergent
validityis established.

210
Table 4.12: Results of Confirmatory Factor Analysis
χ² p χ²/df NFI GFI TLI CFI RMSEA
Organisation
Structure
70.3 0.000 2.198 0.888 0.935 0.908 0.935 0.077
Centralization
17.5 0.042 1.939 0.965 0.970 0.971 0.983 0.068
Complexity
1.9 0.163 1.949 0.980 0.994 0.970 0.990 0.069
Formalization
2.8 0.247 1.398 0.985 0.993 0.987 0.996 0.044
Organisational
Culture
161.7 0.001 1.484 0.884 0.916 0.948 0.958 0.049
Stability
17.1 0.048 1.897 0.966 0.974 0.973 0.984 0.067
People Orientation
4.3 0.118 2.136 0.983 0.990 0.972 0.991 0.075
Aggressiveness
5.2 0.156 1.743 0.947 0.987 0.952 0.976 0.061
Innovation
3.1 0.211 1.558 0.985 0.993 0.984 0.995 0.053
Team Orientation
1.7 0.190 1.716 0.989 0.994 0.985 0.995 0.060
Social Capital
146.0 0.000 2.056 0.882 0.907 0.916 0.934 0.072
Relational
14.7 0.100 1.632 0.979 0.975 0.986 0.992 0.056
Network ties
1.9 0.164 1.941 0.989 0.994 0.984 0.995 0.068
Engagement
4.5 0.103 2.271 0.942 0.989 0.951 0.984 0.079
Communication
1.5 0.216 1.530 0.955 0.995 0.949 0.983 0.051
Leadership
Behaviour
105.2
0.000 1.984 0.957 0.926 0.973 0.978 0.070
Relation-oriented
30.1 0.007 2.148 0.980 0.961 0.984 0.989 0.075
Task-oriented
16.9 0.050 1.881 0.977 0.973 0.982 0.989 0.066
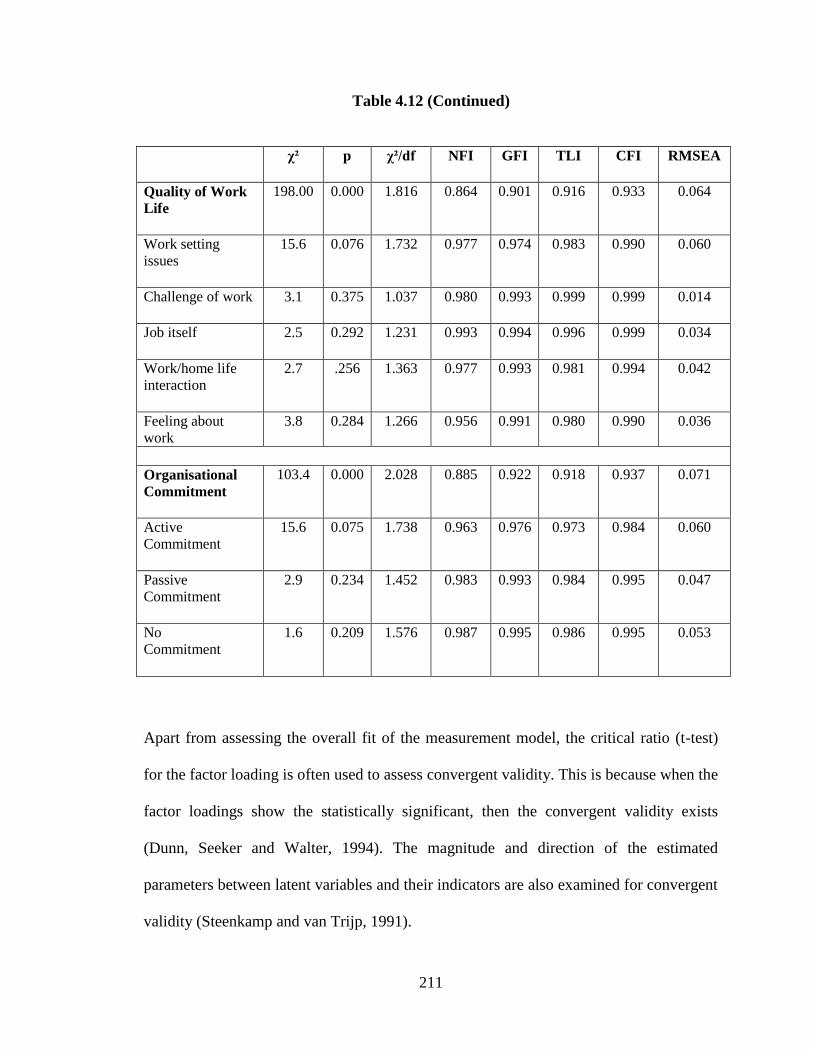
211
Table 4.12 (Continued)
χ²
p χ²/df NFI GFI TLI CFI RMSEA
Quality of Work
Life
198.00 0.000 1.816 0.864 0.901 0.916 0.933 0.064
Work setting
issues
15.6 0.076 1.732 0.977 0.974 0.983 0.990 0.060
Challenge of work
3.1 0.375 1.037 0.980 0.993 0.999 0.999 0.014
Job itself
2.5 0.292 1.231 0.993 0.994 0.996 0.999 0.034
Work/home life
interaction
2.7 .256 1.363 0.977 0.993 0.981 0.994 0.042
Feeling about
work 3.8 0.284 1.266 0.956 0.991 0.980 0.990 0.036
Organisational Commitment
103.4 0.000 2.028 0.885 0.922 0.918 0.937 0.071
Active Commitment
15.6 0.075 1.738 0.963 0.976 0.973 0.984 0.060
Passive Commitment
2.9 0.234 1.452 0.983 0.993 0.984 0.995 0.047
No Commitment
1.6 0.209 1.576 0.987 0.995 0.986 0.995 0.053
Apart from assessing the overall fit of the measurement model, the critical ratio (t-test)
for the factor loading is often used to assess convergent validity. This is because when the
factor loadings show the statistically significant, then the convergent validity exists
(Dunn, Seeker and Walter, 1994). The magnitude and direction of the estimated
parameters between latent variables and their indicators are also examined for convergent
validity (Steenkamp and van Trijp, 1991).

212
Figure 4.3: Measurement Model for Centralization
Centralization
.41
CN3
.46
CN5
eCN3
eCN5
.51
CN2 eCN2
.58
CN4 eCN4
.47
CN6 eCN6
.64
.76
.68
.69
.72
.66
CN1 eCN1
.81
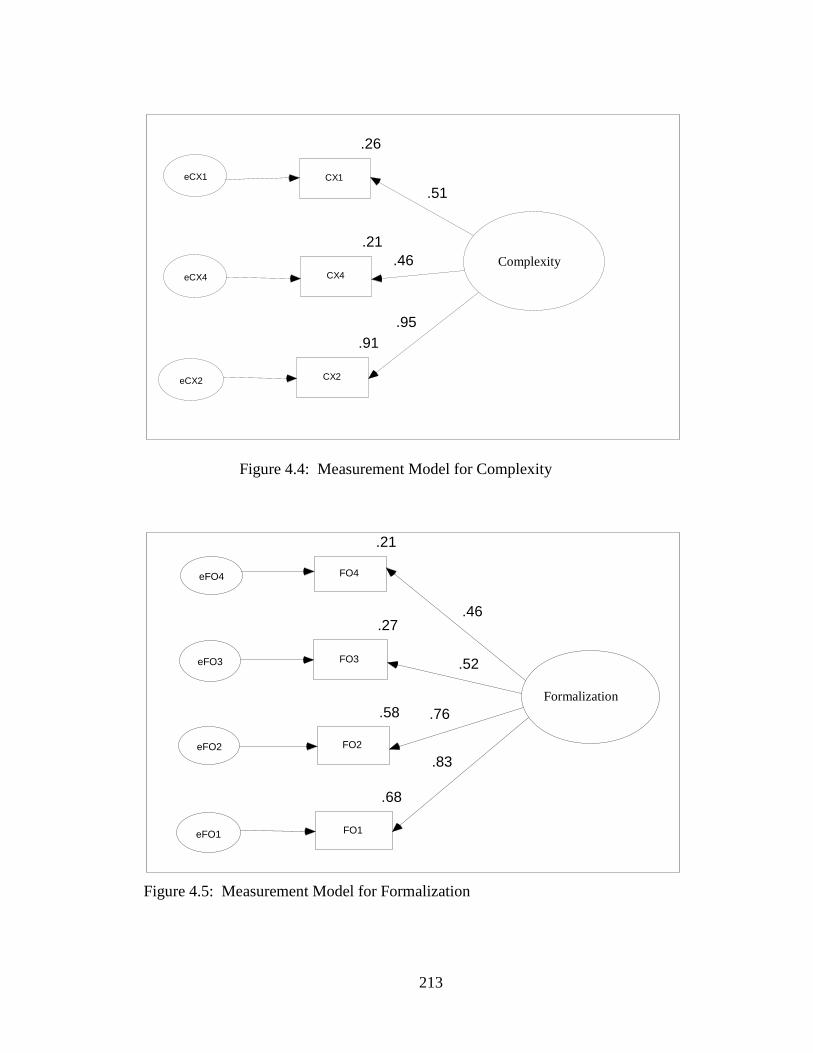
213
Figure 4.4: Measurement Model for Complexity
Figure 4.5: Measurement Model for Formalization
Complexity
.91
CX2 eCX2
.26
CX1 eCX1
.21
CX4 eCX4
.51
.95
.46
Formalization
.58
FO2
.21
FO4
eFO2
eFO4
.68
FO1 eFO1
.27
FO3 eFO3
.76
.52
.46
.83
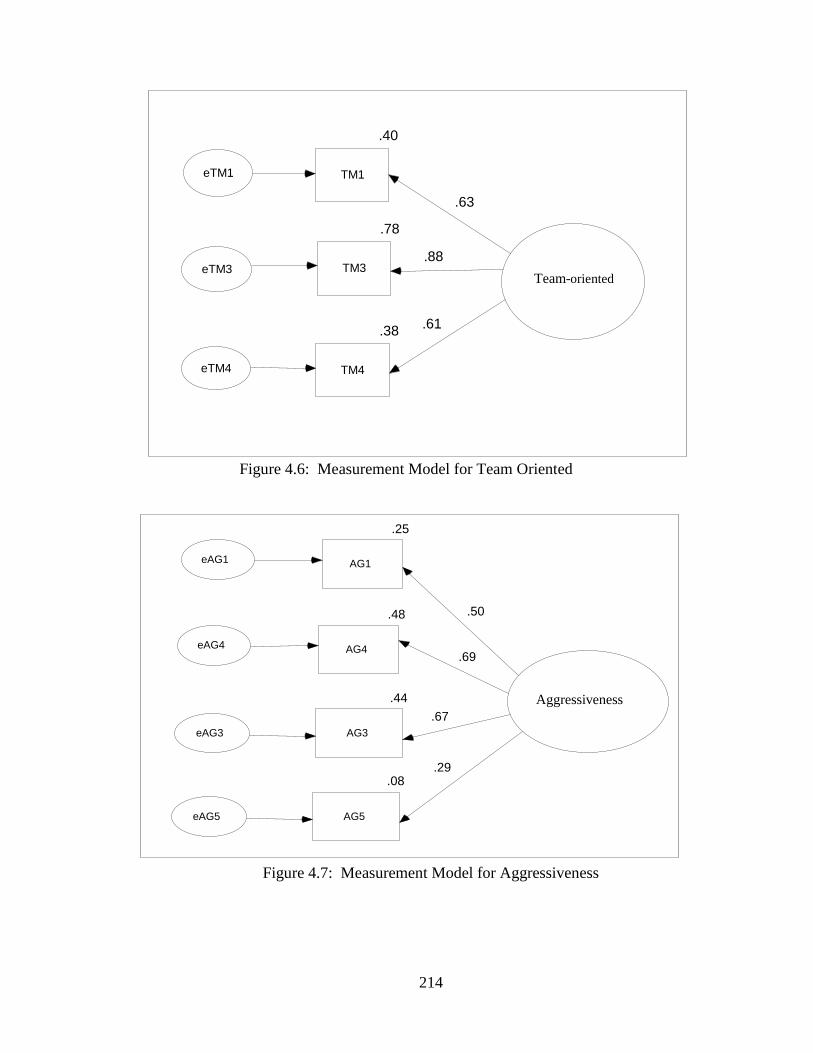
214
Figure 4.6: Measurement Model for Team Oriented
Figure 4.7: Measurement Model for Aggressiveness
Team-oriented
.78
TM3
.40
TM1 eTM1
eTM3
.38
TM4 eTM4
.61
.88
.63
Aggressiveness .44
AG3
.48
AG4 eAG4
eAG3
.25
AG1 eAG1
.50
.08
AG5 eAG5
.29
.69
.67
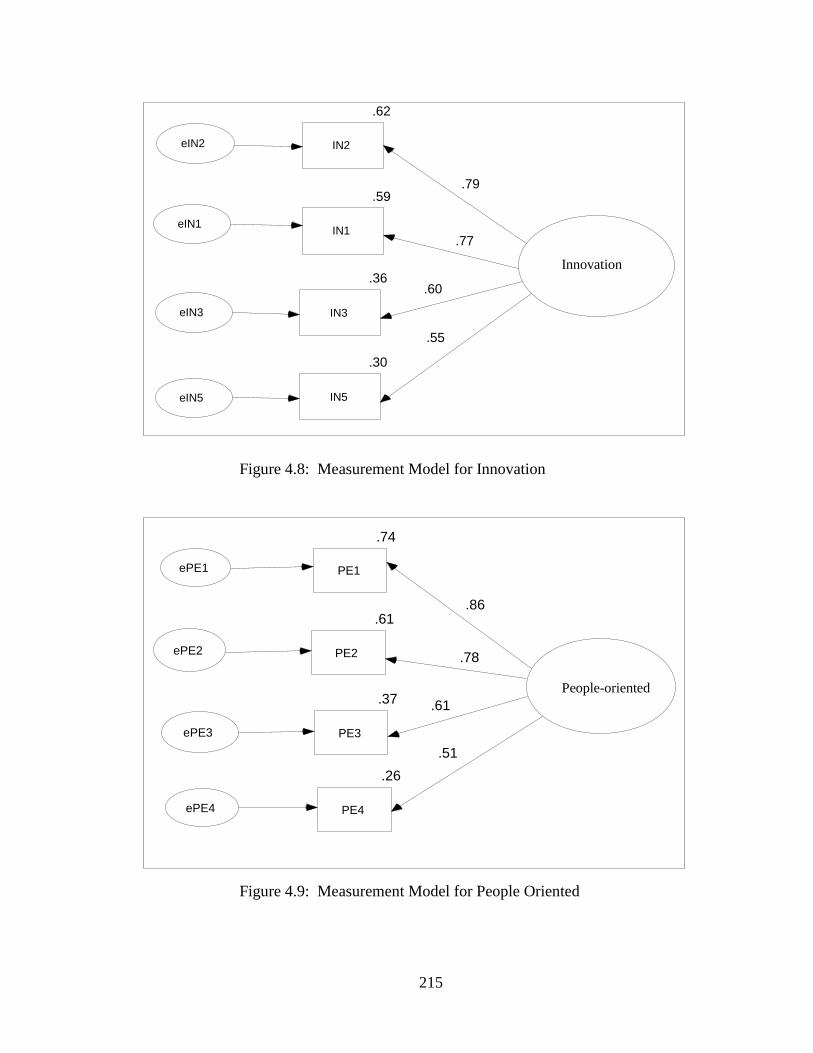
215
Figure 4.8: Measurement Model for Innovation
Figure 4.9: Measurement Model for People Oriented
Innovation
.59
IN1 eIN1
.62
IN2 eIN2
.79
.36
IN3 eIN3
.30
IN5 eIN5
.77
.60
.55
People-oriented
.61
PE2
.74
PE1 ePE1
ePE2
.26
PE4 ePE4
.37
PE3 ePE3
.78
.86
.51
.61
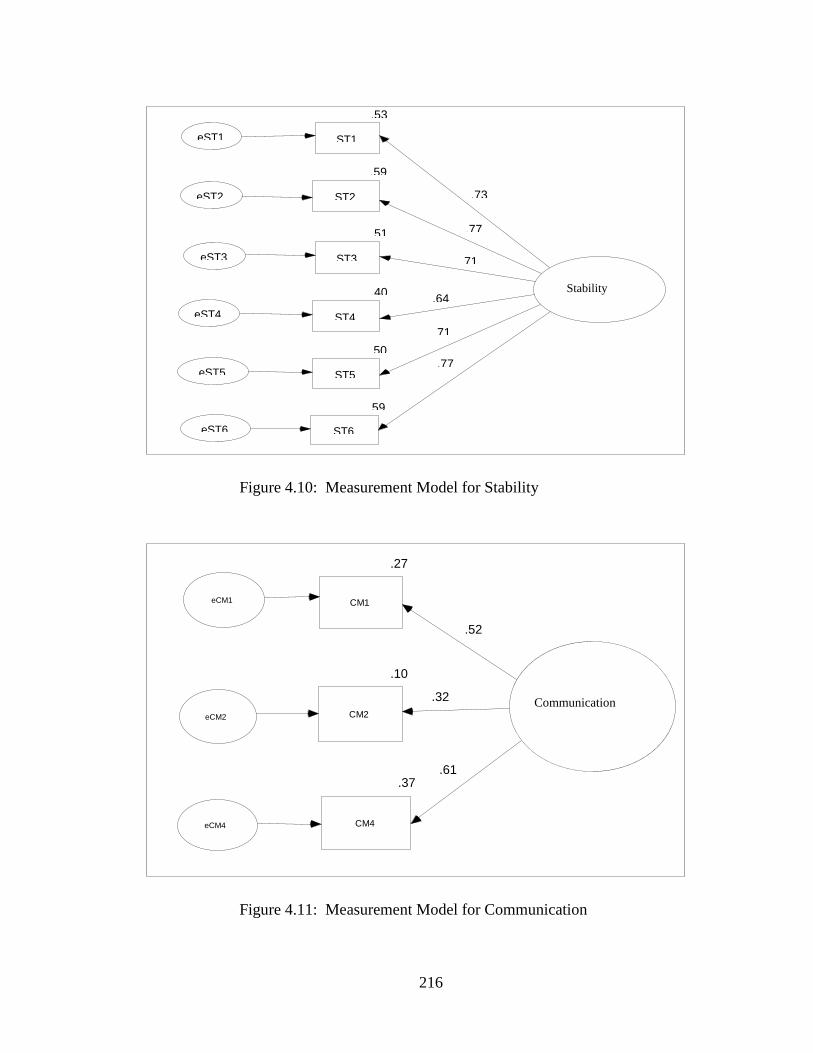
216
Figure 4.10: Measurement Model for Stability
Figure 4.11: Measurement Model for Communication
Stability
.59
ST6 eST6
.59
ST2
.53
ST1 eST1
eST2
.50
ST5 eST5
.51
ST3 eST3
.40
ST4 eST4
.71
.64
.71
.77
.73
.77
Communication
.10
CM2 eCM2
.27
CM1 eCM1
.37
CM4 eCM4
.61
.32
.52

217
Figure 4.12: Measurement Model for Engagement
Figure 4.13: Measurement Model for Network Ties
Engagement .12
EG3 eEG3
.52
EG1
.82
EG2 eEG2
eEG1
.91
.12
EG4 eEG4
.34
.34
.72
Network Ties
.33
NW4 eNW4
.65
NW1 eNW1
.81
.67
NW2 eNW2
.58
.82
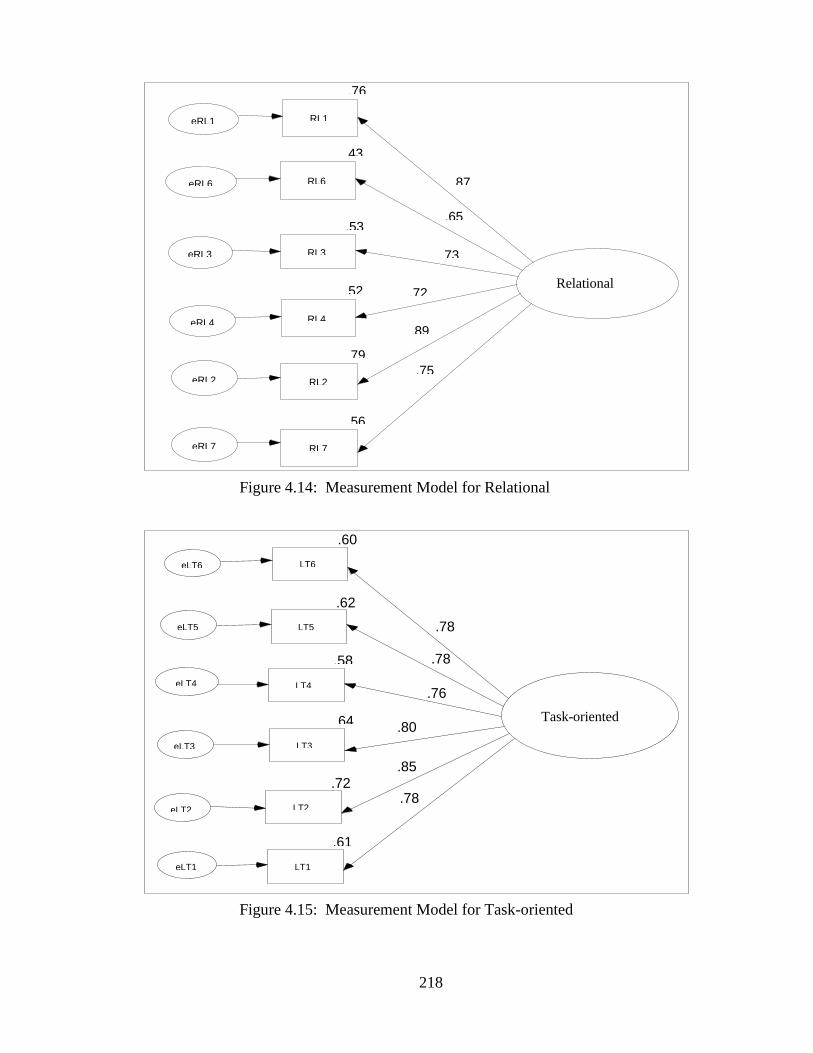
218
Figure 4.14: Measurement Model for Relational
Figure 4.15: Measurement Model for Task-oriented
Relational
.79
RL2
.52
RL4
.53
RL3
eRL2
eRL4
eRL3 .73
.72
.89
.76
RL1 eRL1
.87
.56
RL7 eRL7
.75
.43
RL6 eRL6
.65
Task-oriented
.58
LT4
.62
LT5
eLT4
eLT5
eLT6
.60
LT6
.72
LT2 eLT2
.85
.61
LT1 eLT1
.64
LT3 eLT3
.78
.78
.76
.78
.80
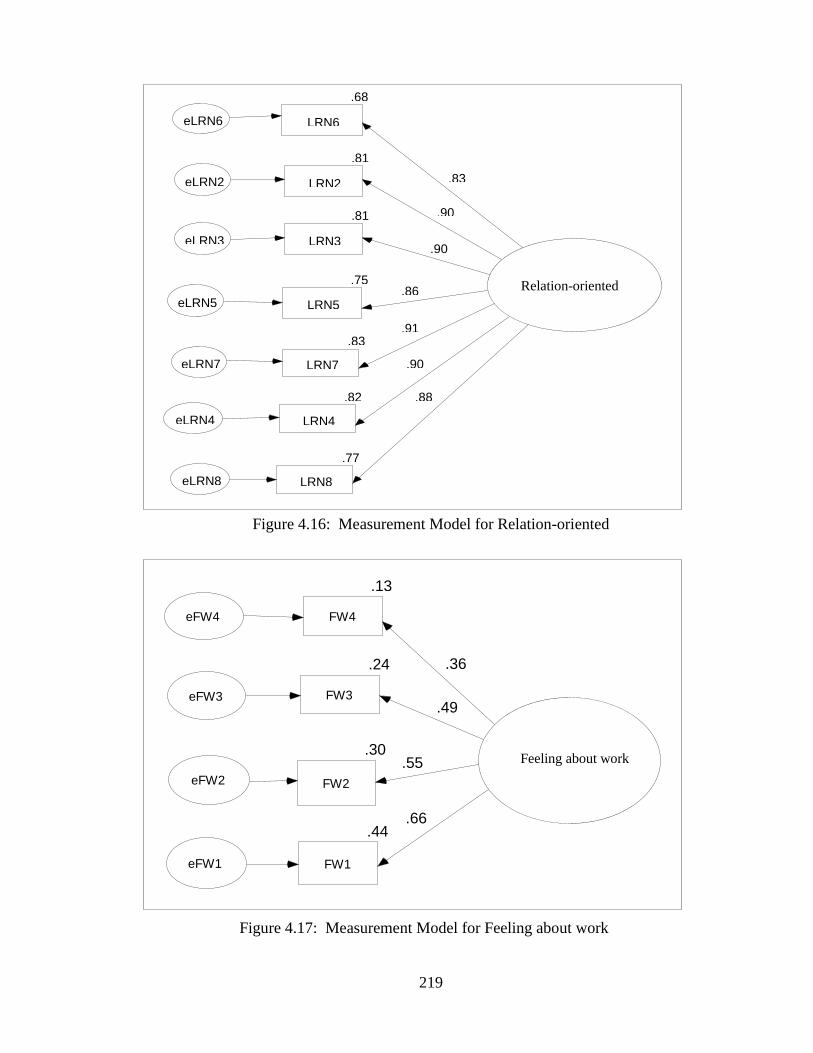
219
Figure 4.16: Measurement Model for Relation-oriented
Figure 4.17: Measurement Model for Feeling about work
Relation-oriented
.81
LRN2 eLRN2
eLRN6
.68
LRN6
.83
LRN7 eLRN7
.75
LRN5 eLRN5
.81
LRN3 eLRN3
.82
LRN4 eLRN4
.77
LRN8 eLRN8
.90
.83
.88
.90
.91
.86
.90
Feeling about work
.44
FW1
.30
FW2
eFW1
eFW2
.24
FW3 eFW3
.13
FW4 eFW4
.36
.49
.55
.66

220
Figure 4.18: Measurement Model for Work home life interaction
Figure 4.19: Measurement Model for Job itself
Work/home- interaction
.14
WH3 eWH3
.71
WH2 eWH2
.38
WH1 eWH1
.19
WH5 eWH5
.84
.62
.37
.44
Job itself .59
JIN2
.71
JIN3
.51
JIN4
eJIN2
eJIN3
eJIN4
.65
JIN1 eJIN1
.81
.71
.84
.77

221
Figure 4.20: Measurement Model for Challenge of work
Figure 4.21: Measurement Model for Work setting issues
Challenge of work
.46
CW1 eCW1
.20
CW5 eCW5
.49
CW3 eCW3
.44
CW2 eCW2
.68
.66
.70
.45
Work setting issues
.60
WSN2
.58
WSN3
.58
WSN4
eWSN2
eWSN3
eWSN4
.64
WSN5 eWSN5
.54
WSN6 eWSN6
.69
WSN1 eWSN1
.74
.80
.76
.83
.78
.76
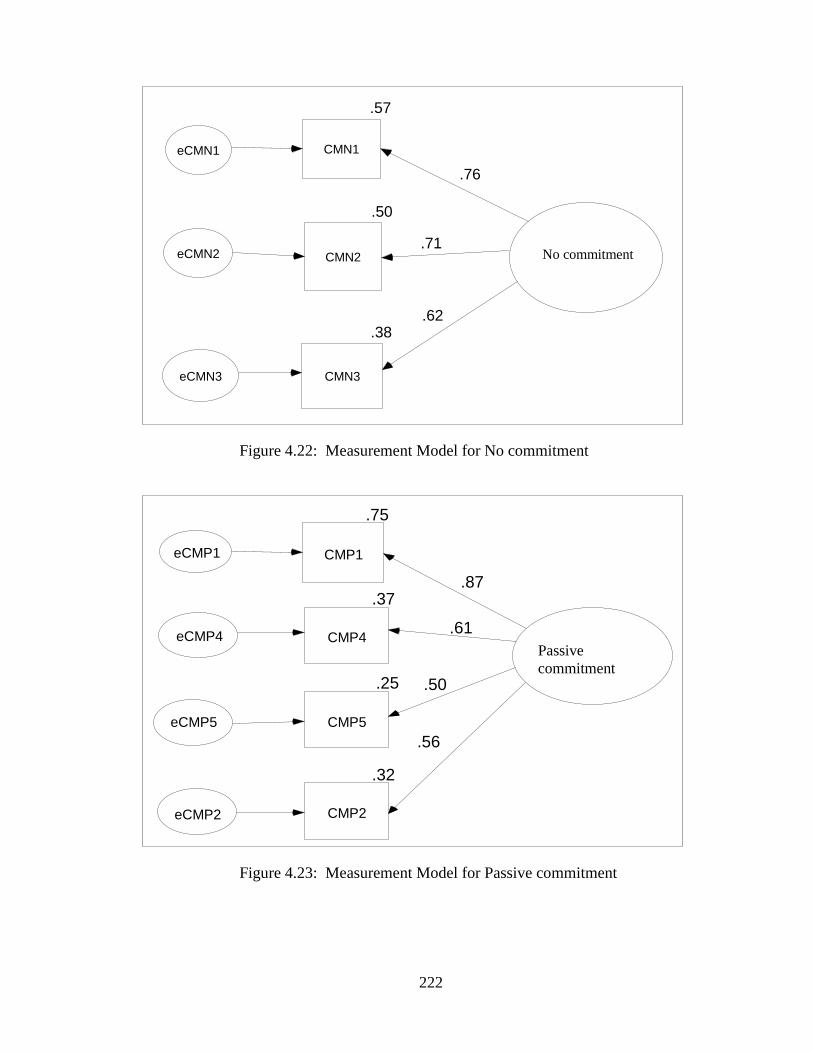
222
Figure 4.22: Measurement Model for No commitment
Figure 4.23: Measurement Model for Passive commitment
No commitment
.38
CMN3 eCMN3
.50
CMN2 eCMN2
.57
CMN1 eCMN1
.71
.76
.62
Passive
commitment
.37
CMP4 eCMP4
.75
CMP1 eCMP1
.25
CMP5 eCMP5
.32
CMP2 eCMP2
.61
.50
.56
.87
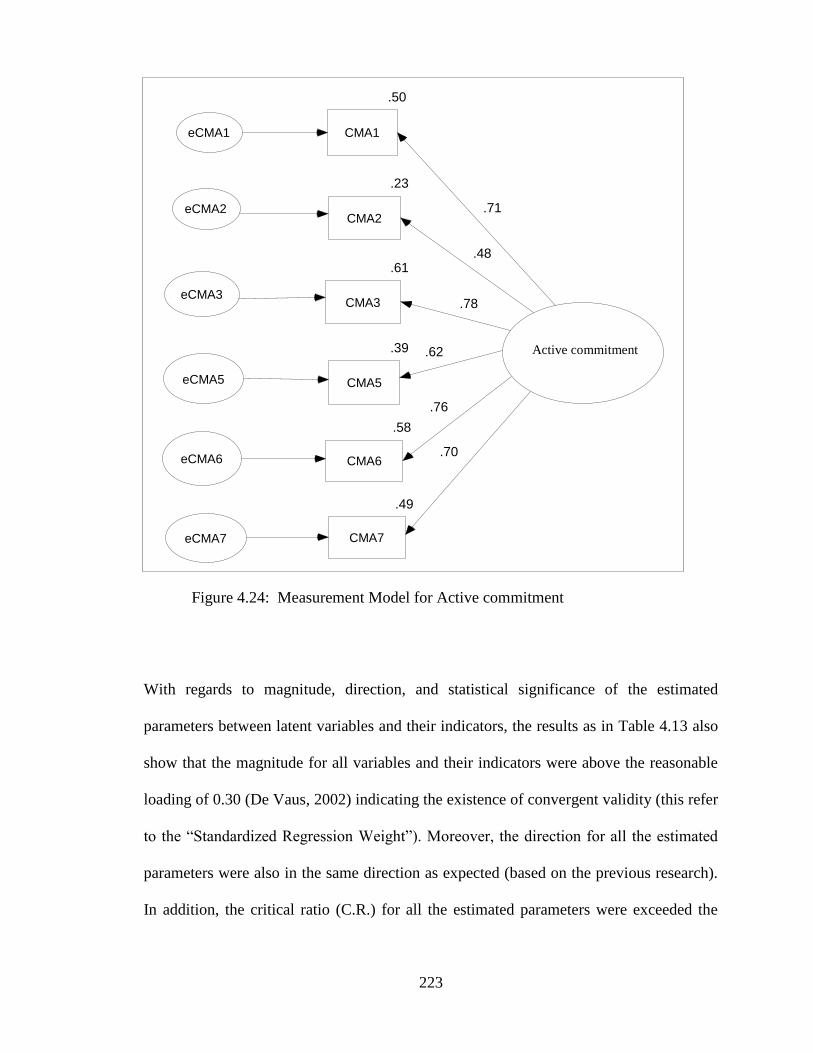
223
Figure 4.24: Measurement Model for Active commitment
With regards to magnitude, direction, and statistical significance of the estimated
parameters between latent variables and their indicators, the results as in Table 4.13 also
show that the magnitude for all variables and their indicators were above the reasonable
loading of 0.30 (De Vaus, 2002) indicating the existence of convergent validity (this refer
to the “Standardized Regression Weight”). Moreover, the direction for all the estimated
parameters were also in the same direction as expected (based on the previous research).
In addition, the critical ratio (C.R.) for all the estimated parameters were exceeded the
Active commitment
.58
CMA6 eCMA6
.39
CMA5 eCMA5
.61
CMA3 eCMA3
.23
CMA2 eCMA2
.50
CMA1 eCMA1
.49
CMA7 eCMA7
.76
.78
.62
.48
.71
.70
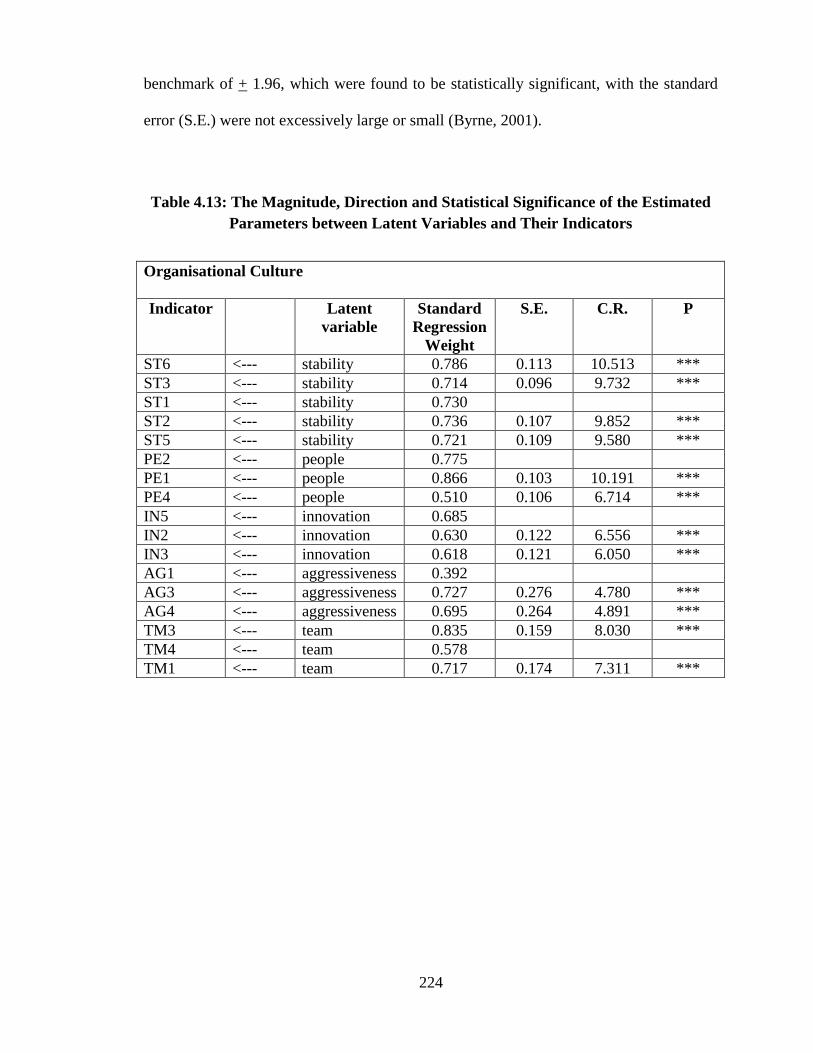
224
benchmark of + 1.96, which were found to be statistically significant, with the standard
error (S.E.) were not excessively large or small (Byrne, 2001).
Table 4.13: The Magnitude, Direction and Statistical Significance of the Estimated
Parameters between Latent Variables and Their Indicators
Organisational Culture
Indicator Latent
variable
Standard
Regression
Weight
S.E. C.R. P
ST6 <--- stability 0.786 0.113 10.513 ***
ST3 <--- stability 0.714 0.096 9.732 ***
ST1 <--- stability 0.730
ST2 <--- stability 0.736 0.107 9.852 ***
ST5 <--- stability 0.721 0.109 9.580 ***
PE2 <--- people 0.775
PE1 <--- people 0.866 0.103 10.191 ***
PE4 <--- people 0.510 0.106 6.714 ***
IN5 <--- innovation 0.685
IN2 <--- innovation 0.630 0.122 6.556 ***
IN3 <--- innovation 0.618 0.121 6.050 ***
AG1 <--- aggressiveness 0.392
AG3 <--- aggressiveness 0.727 0.276 4.780 ***
AG4 <--- aggressiveness 0.695 0.264 4.891 ***
TM3 <--- team 0.835 0.159 8.030 ***
TM4 <--- team 0.578
TM1 <--- team 0.717 0.174 7.311 ***
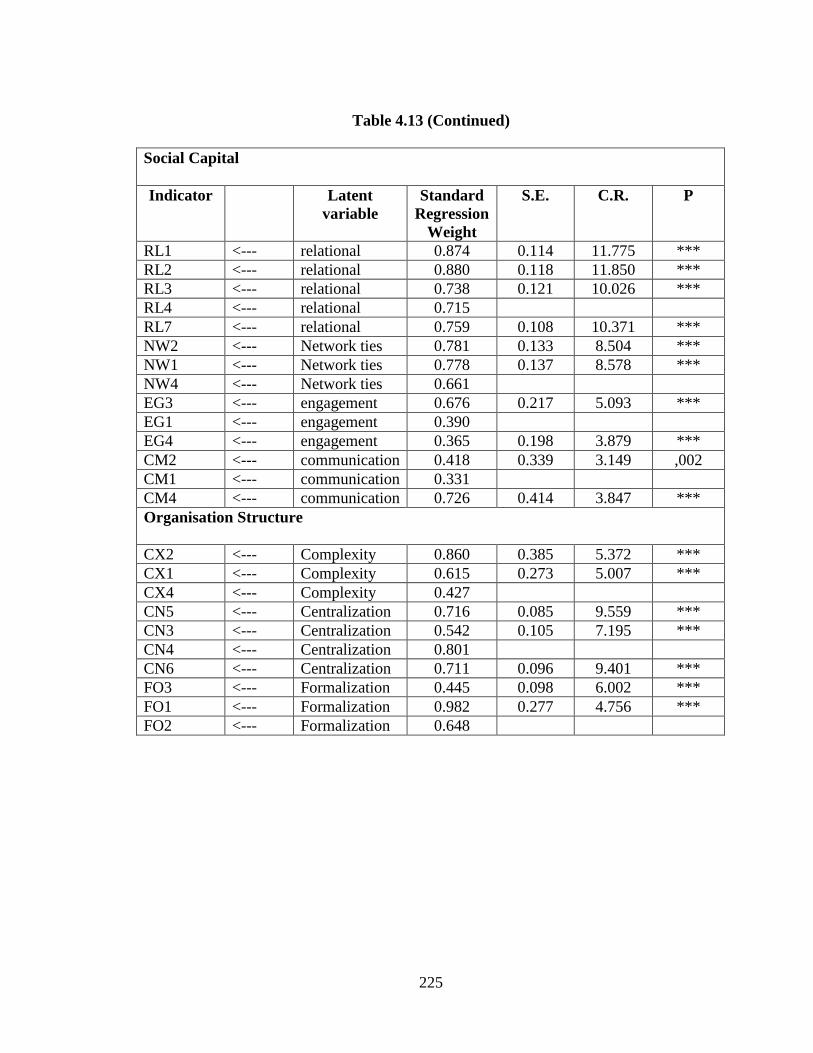
225
Table 4.13 (Continued)
Social Capital
Indicator Latent
variable
Standard
Regression
Weight
S.E. C.R. P
RL1 <--- relational 0.874 0.114 11.775 ***
RL2 <--- relational 0.880 0.118 11.850 ***
RL3 <--- relational 0.738 0.121 10.026 ***
RL4 <--- relational 0.715
RL7 <--- relational 0.759 0.108 10.371 ***
NW2 <--- Network ties 0.781 0.133 8.504 ***
NW1 <--- Network ties 0.778 0.137 8.578 ***
NW4 <--- Network ties 0.661
EG3 <--- engagement 0.676 0.217 5.093 ***
EG1 <--- engagement 0.390
EG4 <--- engagement 0.365 0.198 3.879 ***
CM2 <--- communication 0.418 0.339 3.149 ,002
CM1 <--- communication 0.331
CM4 <--- communication 0.726 0.414 3.847 ***
Organisation Structure
CX2 <--- Complexity 0.860 0.385 5.372 ***
CX1 <--- Complexity 0.615 0.273 5.007 ***
CX4 <--- Complexity 0.427
CN5 <--- Centralization 0.716 0.085 9.559 ***
CN3 <--- Centralization 0.542 0.105 7.195 ***
CN4 <--- Centralization 0.801
CN6 <--- Centralization 0.711 0.096 9.401 ***
FO3 <--- Formalization 0.445 0.098 6.002 ***
FO1 <--- Formalization 0.982 0.277 4.756 ***
FO2 <--- Formalization 0.648

226
Table 4.13 (Continued)
Leadership Behaviour
Indicator Latent
variable
Standard
Regression
Weight
S.E. C.R. P
LRN2 <--- Relation 0.901 0.048 20.285 ***
LRN3 <--- relation 0.906 0.045 20.577 ***
LRN4 <--- relation 0.900
LRN5 <--- relation 0.863 0.050 18.235 ***
LRN6 <--- relation 0.826 0.054 16.580 ***
LRN7 <--- relation 0.910 0.045 20.844 ***
LRN8 <--- relation 0.876 0.048 19.031 ***
LT6 <--- task 0.818 0.072 12.166 ***
LT4 <--- task 0.761
LT3 <--- task 0.787 0.075 11.649 ***
LT2 <--- task 0.841 0.071 12.628 ***
LT1 <--- task 0.758 0.069 11.133 ***
QWL Orientation
WSN4 <--- Work set 0.757 0.095 10.948 ***
WSN2 <--- Work set 0.771
WSN1 <--- Work set 0.819 0.086 12.085 ***
WSN3 <--- Work set 0.751 0.079 11.093 ***
WSN5 <--- Work set 0.820 0.086 12.106 ***
CW1 <--- challenge 0.693
CW2 <--- challenge 0.698 0.178 5.869 ***
CW5 <--- challenge 0.449 0.164 4.900 ***
JIN1 <--- Job itself 0.819 0.074 12.468 ***
JIN2 <--- Job itself 0.793 0.085 11.838 ***
JIN3 <--- Job itself 0.803
FW1 <--- Feeling 0.896 0.630 3.192 ,001
FW2 <--- Feeling 0.448 0.253 4.332 ***
FW3 <--- Feeling 0.424
WH1 <--- Work/home 0.642 0.139 6.243 ***
WH2 <--- Work/home 0.770
WH5 <--- Work/home 0.492 0.120 5.176 ***
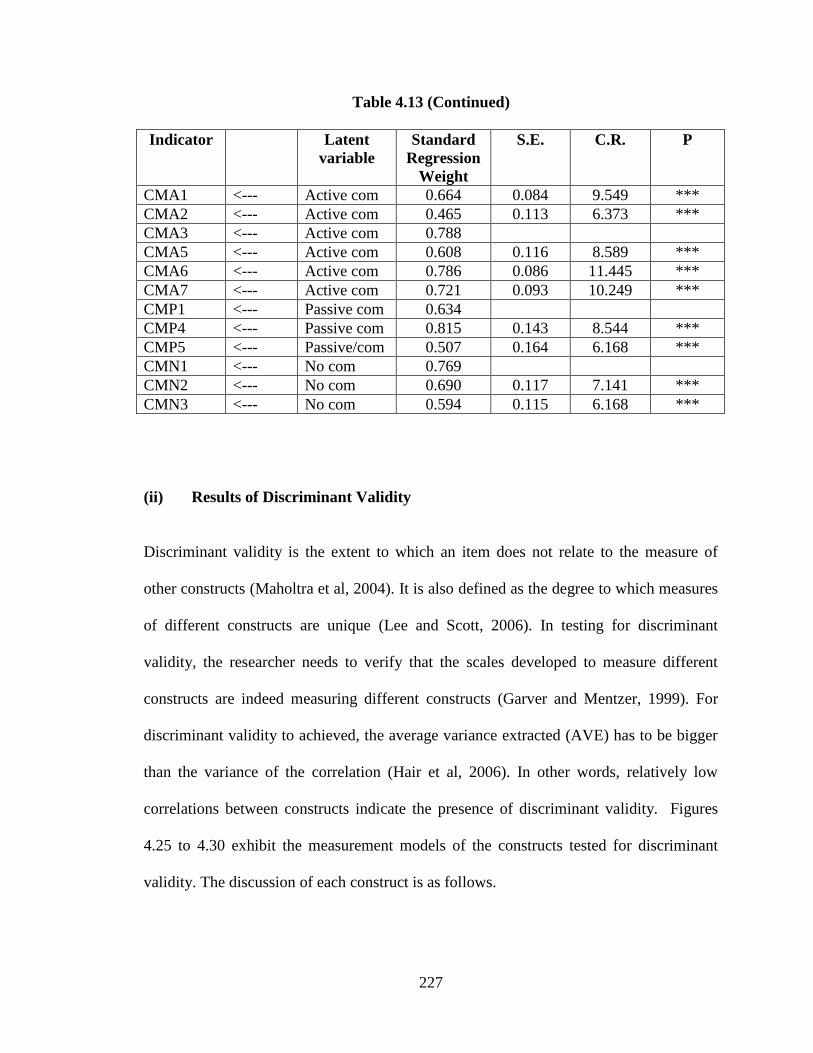
227
Table 4.13 (Continued)
Indicator Latent
variable
Standard
Regression
Weight
S.E. C.R. P
CMA1 <--- Active com 0.664 0.084 9.549 ***
CMA2 <--- Active com 0.465 0.113 6.373 ***
CMA3 <--- Active com 0.788
CMA5 <--- Active com 0.608 0.116 8.589 ***
CMA6 <--- Active com 0.786 0.086 11.445 ***
CMA7 <--- Active com 0.721 0.093 10.249 ***
CMP1 <--- Passive com 0.634
CMP4 <--- Passive com 0.815 0.143 8.544 ***
CMP5 <--- Passive/com 0.507 0.164 6.168 ***
CMN1 <--- No com 0.769
CMN2 <--- No com 0.690 0.117 7.141 ***
CMN3 <--- No com 0.594 0.115 6.168 ***
(ii) Results of Discriminant Validity
Discriminant validity is the extent to which an item does not relate to the measure of
other constructs (Maholtra et al, 2004). It is also defined as the degree to which measures
of different constructs are unique (Lee and Scott, 2006). In testing for discriminant
validity, the researcher needs to verify that the scales developed to measure different
constructs are indeed measuring different constructs (Garver and Mentzer, 1999). For
discriminant validity to achieved, the average variance extracted (AVE) has to be bigger
than the variance of the correlation (Hair et al, 2006). In other words, relatively low
correlations between constructs indicate the presence of discriminant validity. Figures
4.25 to 4.30 exhibit the measurement models of the constructs tested for discriminant
validity. The discussion of each construct is as follows.
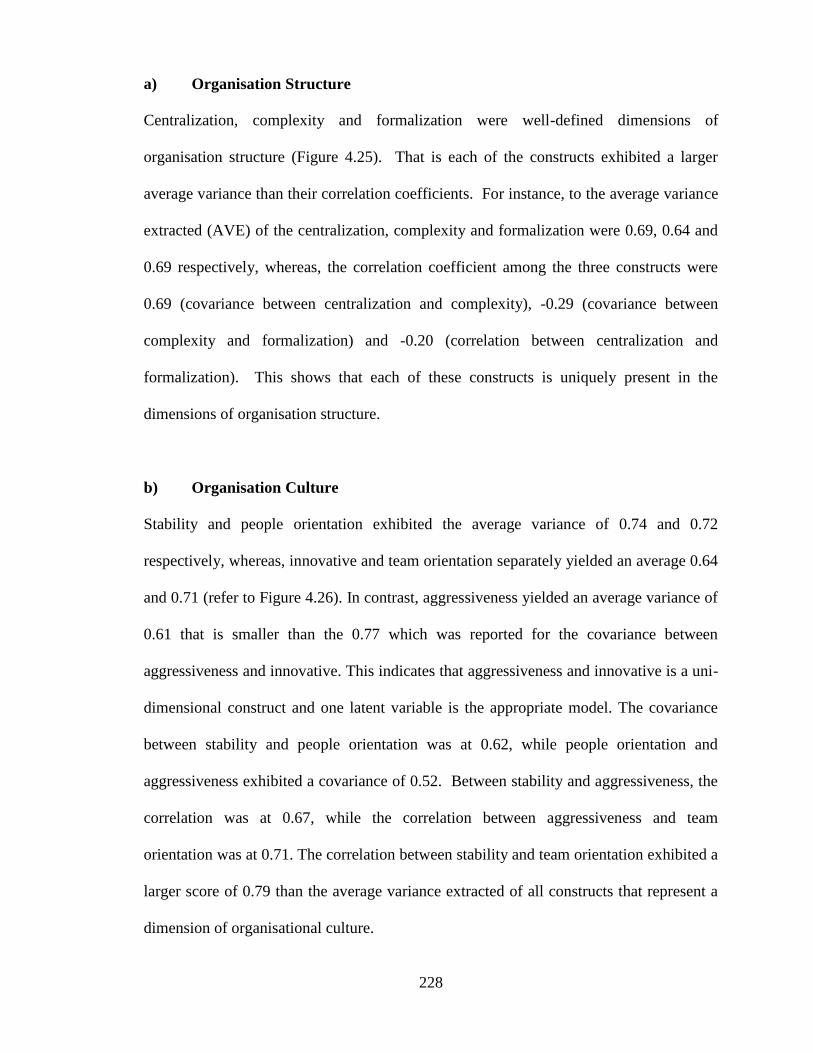
228
a) Organisation Structure
Centralization, complexity and formalization were well-defined dimensions of
organisation structure (Figure 4.25). That is each of the constructs exhibited a larger
average variance than their correlation coefficients. For instance, to the average variance
extracted (AVE) of the centralization, complexity and formalization were 0.69, 0.64 and
0.69 respectively, whereas, the correlation coefficient among the three constructs were
0.69 (covariance between centralization and complexity), -0.29 (covariance between
complexity and formalization) and -0.20 (correlation between centralization and
formalization). This shows that each of these constructs is uniquely present in the
dimensions of organisation structure.
b) Organisation Culture
Stability and people orientation exhibited the average variance of 0.74 and 0.72
respectively, whereas, innovative and team orientation separately yielded an average 0.64
and 0.71 (refer to Figure 4.26). In contrast, aggressiveness yielded an average variance of
0.61 that is smaller than the 0.77 which was reported for the covariance between
aggressiveness and innovative. This indicates that aggressiveness and innovative is a uni-
dimensional construct and one latent variable is the appropriate model. The covariance
between stability and people orientation was at 0.62, while people orientation and
aggressiveness exhibited a covariance of 0.52. Between stability and aggressiveness, the
correlation was at 0.67, while the correlation between aggressiveness and team
orientation was at 0.71. The correlation between stability and team orientation exhibited a
larger score of 0.79 than the average variance extracted of all constructs that represent a
dimension of organisational culture.

229
c) Social Capital
The average variance extracted (AVE) of relational, network ties, communication and
engagement was at 0.79, 0.74, 0.49 and 0.48 respectively (refer to Figure 4.27). The
covariance between relational and network ties was at 0.64, while the covariance between
network ties and communication was at 0.74. The covariance between communication
and engagement was at 0.76 which was larger than the average variance of
communication and engagement. This also suggests that communication and engagement
are unidimensional construct.
d) Leadership Behaviour
The average variance for relation-oriented was 0.88, whereas, for task oriented it was
0.79. These scores were smaller than the 0.92 that was reported for the covariance
between relation-oriented and task-oriented. This indicates that relation-oriented and
task-oriented is a uni-dimensional construct and one latent variable is the appropriate
model (refer Figure 4.28).
e) Quality of Work Life
The average variance for all dimensions of quality of work life exhibited a larger score
than the correlation coefficient. The average variance extracted (AVE) of work setting
issues, challenge of work, job itself, work home life interaction and feeling about work
was at 0.78, 0.61, 0.80, 0.63 and 0.59 respectively (refer to Figure 4.29). The correlation
coefficients this shows that each of these constructs that represent a dimension of quality
of work life orientation were mutually distinctive.
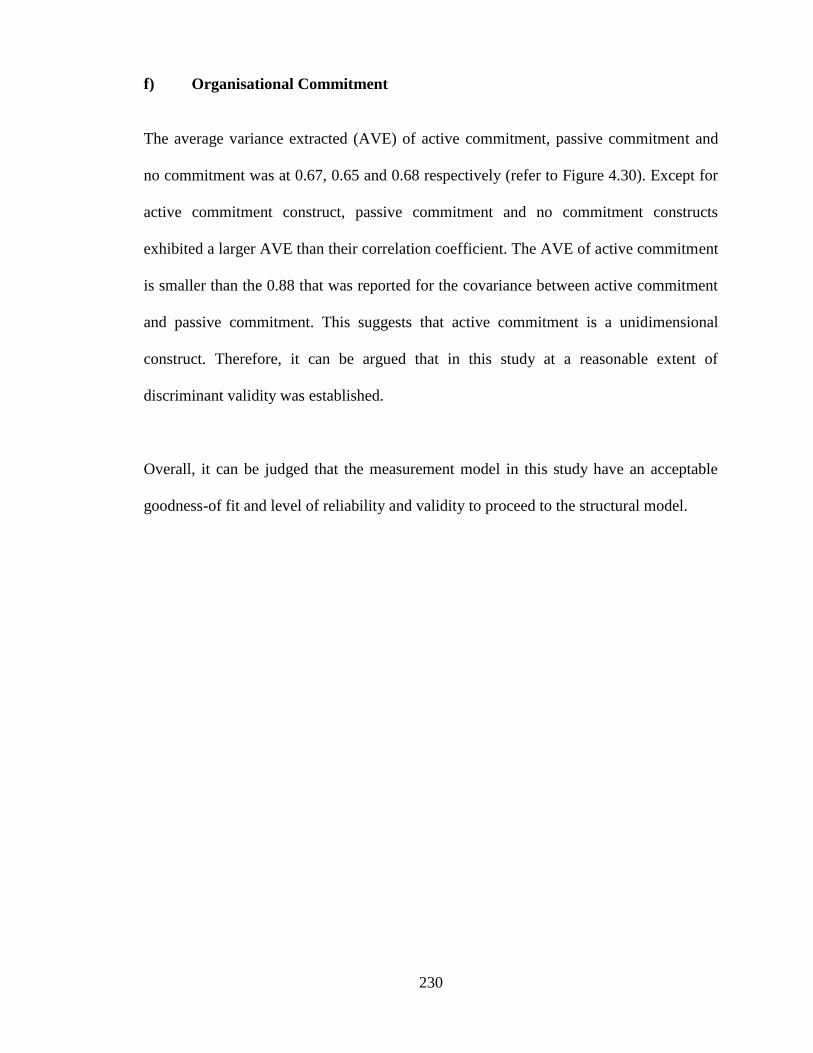
230
f) Organisational Commitment
The average variance extracted (AVE) of active commitment, passive commitment and
no commitment was at 0.67, 0.65 and 0.68 respectively (refer to Figure 4.30). Except for
active commitment construct, passive commitment and no commitment constructs
exhibited a larger AVE than their correlation coefficient. The AVE of active commitment
is smaller than the 0.88 that was reported for the covariance between active commitment
and passive commitment. This suggests that active commitment is a unidimensional
construct. Therefore, it can be argued that in this study at a reasonable extent of
discriminant validity was established.
Overall, it can be judged that the measurement model in this study have an acceptable
goodness-of fit and level of reliability and validity to proceed to the structural model.
231
Figure 4.25: Measurement Model for Organisation Structure
Central
Complex
Formal
.64
CN4
.74
CX2
.18
CX4
.96
FO1
.42
FO2
.20
FO3
eCN4
eCX2
eCX4
eFO1
eFO2
eFO3
.38
CX1 eCX1 .62
.51
CN6 eCN6
.51
CN5 eCN5 .72
.71
.80
.43
.86
.65
.69
-.29
-.20
.29
CN3 eCN3
.54
.45
.98

232
Figure 4.26: Measurement Model for Organisational Culture
Stability
.53
ST1
.54
ST2
.51
ST3
eST1
eST2
eST3
People
.60
PE2 ePE2
ePE4
Aggressive
.48
AG4
.53
AG3
eAG4
eAG3
Innovative
.47
IN5
.40
IN2
.38
IN3
eIN5
eIN2
eIN3
Team
.33
TM4
.70
TM3
.51
TM1
eTM4
eTM3
eTM1
.62
ST6
.52
ST5
.26
PE4
.75
PE1
eST6
eST5
ePE1
.15
AG1 eAG1
.62
.52
.77
.42
.67
.71
.43 .79
.41
.55
.71
.70
.63
.73
.74
.72
.79
.78
.51
.87
.73
.39
.62
.68
.58
.72
.84
233
Figure 4.27: Measurement Model for Social Capital
Relational
.55
RL3 eRL3
Network
ties
.61
NW1
.61
NW2 eNW2
eNW1
Communicate
.53
CM4
.17
CM2
eCM4
eCM2 .42
.73
Engagement
.15
EG1
.46
EG3
.13
EG4
eEG1
eEG3
eEG4
.64
.74
.76
.57
1.03
.71
.44
NW4 eNW4
.76
RL1 eRL1
.11
CM1 eCM1 .33
.51
RL4 eRL4
.58
RL7 eRL7
.66
.77
RL2 eRL2
.88
.87
.74
.72
.76
.78
.78
.39
.68
.37
234
Figure 4.28: Measurement Model for Leadership Behaviour
Relation-oriented
.81
LRN4
.83
LRN7
eLRN4
eLRN7
eLRN6
.68
LRN6
.81
LRN2 eLRN2
.74
LRN5 eLRN5
Task-oriented
.58
LT4 eLT4
eLT6
.67
LT6
.71
LT2 eLT2
.58
LT1 eLT1
.62
LT3 eLT3
.92
.82
LRN3 eLRN3
.77
LRN8 eLRN8
.83
.91
.88
.91
.90
.86
.90
.84
.82
.76
.79
.76

235
Figure 4.29: Measurement Model for Quality of Work Life
Work set
.67
WSN5 eWSN5
Challenge
Job
.65
JIN3 eJIN3
Workhome
.59
WH2 eWH2
Feeling
.49
CW2 eCW2
.63
JIN2 eJIN2
.18
FW3 eFW3
.79
.67
WSN1 eWSN1
.20
CW5 eCW5
.77
.39
.49
.43
-.30
.83
-.39
.36
-.31
-.24 .02
.57
WSN4 eWSN4
.56
WSN3 eWSN3
.59
WSN2 eWSN2
.67
JIN1 eJIN1
.70
.80
.41
WH1 eWH1
.20
FW2 eFW2
.77
.45
.64
.42
.80
FW1 eFW1
.24
WH5 eWH5 .49
.48
CW1 eCW1 .69
.90
.45
.75
.76
.82
.82
.82
236
Figure 4.30: Measurement Model for Organisational Commitment
Active com
.62
CMA3
.37
CMA5
eCMA3
eCMA5
Passive com
.40
CMP1 eCMP1
No com .59
CMN1 eCMN1
.44
CMA1 eCMA1
.22
CMA2 eCMA2
.35
CMN3 eCMN3
.48
CMN2 eCMN2
.77
.69
.59
.47
.61
.40
.66
CMP4 eCMP4
.62
CMA6 eCMA6 .79
.88
.23
.26
CMP5 eCMP5
.63
.82
.51
.66
.52
CMA7 eCMA7
.79
.72
237
4.15.3 Criterion Validity
The last test of validity that was performed on the data is criterion validity. It specifies
“whether a scale performs as expected in relation to other variables selected (criterion
variables) as meaningful criteria” (Malhotra, 2004: 269). It emphasises the importance of
comparing the scale used with criterion variables. In fact, criterion validity enables
researchers to anticipate or predict any relationship between the measure and the
behavioural outcomes. It can be divided into two forms, concurrent and predictive
validity, which differ from each other on the basis of the time dimension. That is,
concurrent validity is a method of assessment where data on scales and criterion variables
are collected simultaneously. In contrast, predictive validity, data on scale and criterion
variables are collected at different times. In this study, concurrent validity was applied
and correlation analysis was used to examine the criterion validity.
Pearson correlation analysis was conducted among all the main constructs in order to
understand the relationship between the major constructs as well as the multicollinearity
of the independent variables of the study. The results were also beneficial to further
elabourate on the findings of the hypotheses testing later. In interpreting the correlation
coefficients for this study, the correlation values of + 0.50 and above reflect strong
correlation between two variables. According to Burns and Bush (2000), correlation
coefficients that fall between + 1.00 and + 0.81 are generally considered to be “very
high”, which in turn will create multicollinearity, i.e. a problem where very high
correlation among clustering variables may overweight one or more underlying
constructs. The remaining correlation coefficient values were found to be not significant.
238
Table 4.14:Corrélation Coefficient Matrix – Dimensions of Main Variables
Variables 1 2 3 4 5 6 7 8 9 10 11 12 13 14 15 16 17 18 19 20 21 22
1.Centralization 1.00
2.Complexity . 52 1.00
3.Formalization . 02 . 12 1.00
4.Stability -. 19 -. 19 . 47 1.00
5.People orientation -. 29 -. 20 . 39 . 65 1.00
6.Innovation -. 11 . 02 . 23 . 35 . 32 1.00
7.Aggressiveness -. 11 .15 . 40 . 45 . 32 . 58 1.00
8.Team orientation -. 23 -. 12 . 54 . 71 . 59 . 33 . 45 1.00
9.Relational -. 33 -. 30 . 36 . 74 . 76 . 31 . 30 . 65 1.00
10.Network ties -. 19 -. 09 . 46 . 69 . 52 . 32 . 43 . 68 . 61 1.00
11.Engagement -. 16 -. 11 . 34 . 50 . 45 . 31 . 36 . 51 . 52 . 61 1.00
12.Communication -. 28 -. 22 . 26 . 54 . 44 . 50 . 46 . 49 . 54 . 52 . 49 1.00
13.Relation -
oriented
-. 29 -. 22 . 36 . 62 . 67 . 39 . 39 . 61 . 74 . 59 . 54 . 53 1.00
14.Task-oriented -. 22 -. 18 . 29 . 54 . 60 . 35 . 32 . 52 . 62 . 50 . 49 . 48 . 86 1.00
15.Work Setting
issues
-. 40 -. 29 . 36 . 70 . 77 . 31 . 29 . 61 . 85 . 63 . 52 . 54 . 75 . 66 1.00
16.Challenge of
work
-. 05 . 08 . 32 . 46 . 23 . 45 . 47 . 44 . 32 . 51 . 38 . 42 . 42 . 36 . 35 1.00
17.Job itself -. 47 -. 31 . 24 . 57 . 58 . 43 . 33 . 55 . 67 . 56 . 46 . 53 . 67 . 54 . 72 . 50 1.00
18.Work/home
interaction -. 47 -. 26 . 16 . 24 . 23 . 02 . 14 . 27 . 29 . 26 . 26 . 20 . 16 . 08 . 31 . 10 . 42 1.00
19.Feeling about
work . 35 . 31 -. 05 -. 17 -. 18 -. 14 -. 11 -. 17 -. 23 -. 16 -. 15 -. 16 -. 19 -. 16 -. 24 -. 11 -. 38 -. 51 1.00
20.Active
commitment -. 25 -. 15 . 26 . 57 . 54 . 39 . 36 . 56 . 60 . 57 . 64 . 53 . 57 . 51 . 63 . 40 . 56 . 29 -. 21 1.00
21.Passive
commitment -. 38 -. 37 . 21 . 48 . 49 . 23 . 22 . 47 . 60 . 48 . 55 . 45 . 51 . 41 . 60 . 17 . 54 . 49 -. 38 . 66 1.00
22.No commitment -. 10 -. 09 -. 04 . 00 . 05 -. 06 -. 03 . 02 . 07 . 09 . 35 . 02 -. 00 . 04 . 08 -. 02 . 09 . 39 -. 32 . 23 . 38 1.00
Figures in bold – Correlation is significant at 0.01 level; Figure in italic – Correlation is significant at 0.05 level

239
From Table 4.14 the results of the correlation revealed that there is no very strong
correlation (above 0.90) (Hair et al, 2006) between any pairs of the 22 variables of this
study. Most of the correlation coefficient values of the studied variables were significant
at 0.01 levels, and fourteen correlation coefficient values were significant at 0.05 levels.
The findings point out that collinearity was not a serious problem to the regression
analysis in this context of the study. In sum, the results of the correlation exhibit the
existence of significant relationships among constructs and they are congruent with the
hypotheses of this study.
4.16 Reliability
Reliability is defined as the extent to which measures are free from random or unstable
error and therefore yield consistent results (Maholtra, 2004). A perfectly reliable measure
is when the random error is zero (XR = 0). Reliable instruments can be used with
confidence as they are robust and work well at different times under different conditions
(Cooper and Schindler, 2006). Several approaches are used to assess reliability and
among the methods used include the test-retest, alternative forms and internal
consistency.
In test-retest method, the reliability coefficient obtained with a repetition of the same
measure to the same respondents at two different times in almost the same conditions as
the first test (Sekaran, 2003). Results from the correlation coefficient indicate that the
higher the correlation coefficient, the greater the reliability and consequently, the stability
of the measure across time (Maholtra, 2004). In contrast, the alternative forms method is

240
where two equivalent forms of the scale are constructed and administered to the same
respondent at two different times. The correlation coefficient is tested and the higher the
result, the greater the reliability. However, the major problems with this approach it is
expensive and time consuming (Malhotra, 2004). One reason is that it is difficult to have
a similar content in two different forms.
Conversely, the third approach uses only one administration of an instrument to assess
the internal consistency among the items. The split-half technique can be used to measure
the indicators that has many similar statements or questions (Cooper and Schindler,
2006), meaning that the statements are divided randomly into two halves. If the
correlation gives a high result, the internal consistency is also high.
A most widely approach use to test the reliability of the internal consistency is the
Cronbach‟s Coefficient Alpha (Maholtra, 2004). The coefficient alpha is the average of
all possible split-half coefficients resulting from different ways of splitting the scales
items. In fact, it is widely used in study that uses multi-items scales. As a result, internal
consistency using Cronbach‟s Alpha was applied to test the reliability of the scales
adopted in this study.
(a) Internal Consistency Reliability Tests - Cronbach‟s Coefficient Alpha
Cronbach‟s coefficient alpha (α) or the reliability coefficient, measures how well a set of
items (or variables) measures a single unidimensional latent construct. According to
Nunnally (1967: 206) reliability is define as “the extent to which (measurements) are
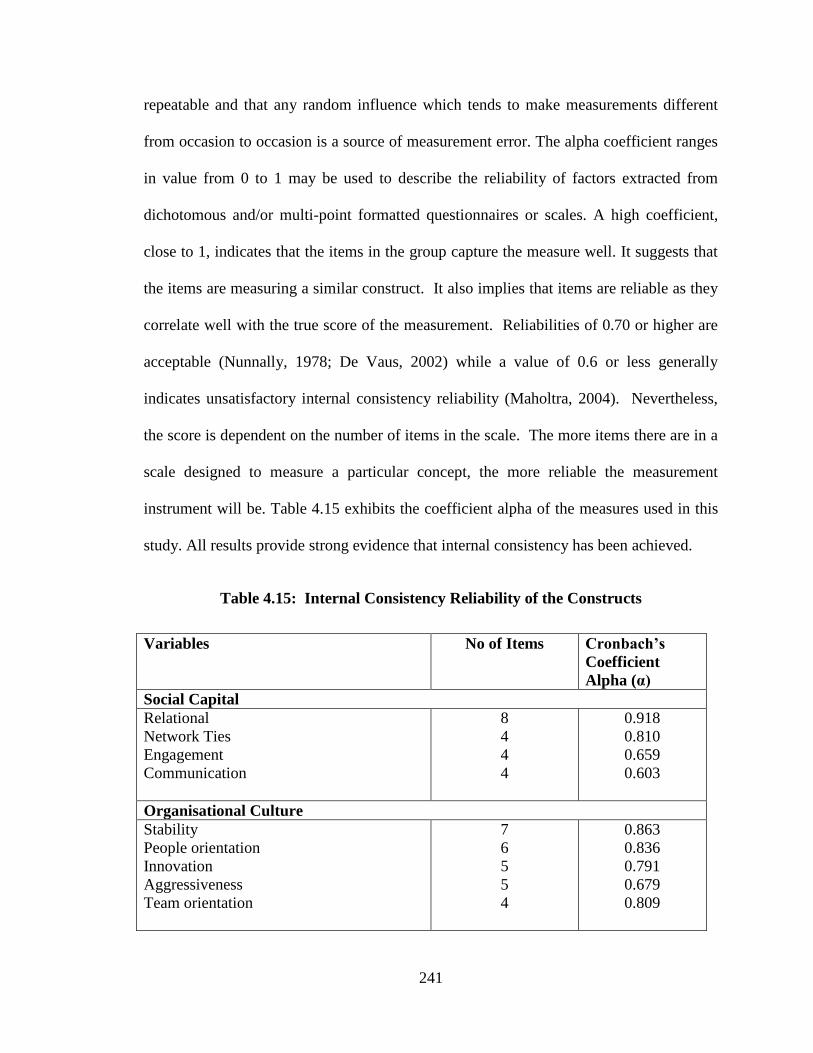
241
repeatable and that any random influence which tends to make measurements different
from occasion to occasion is a source of measurement error. The alpha coefficient ranges
in value from 0 to 1 may be used to describe the reliability of factors extracted from
dichotomous and/or multi-point formatted questionnaires or scales. A high coefficient,
close to 1, indicates that the items in the group capture the measure well. It suggests that
the items are measuring a similar construct. It also implies that items are reliable as they
correlate well with the true score of the measurement. Reliabilities of 0.70 or higher are
acceptable (Nunnally, 1978; De Vaus, 2002) while a value of 0.6 or less generally
indicates unsatisfactory internal consistency reliability (Maholtra, 2004). Nevertheless,
the score is dependent on the number of items in the scale. The more items there are in a
scale designed to measure a particular concept, the more reliable the measurement
instrument will be. Table 4.15 exhibits the coefficient alpha of the measures used in this
study. All results provide strong evidence that internal consistency has been achieved.
Table 4.15: Internal Consistency Reliability of the Constructs
Variables No of Items Cronbach‟s
Coefficient
Alpha (α)
Social Capital
Relational
Network Ties
Engagement
Communication
8
4
4
4
0.918
0.810
0.659
0.603
Organisational Culture
Stability
People orientation
Innovation
Aggressiveness
Team orientation
7
6
5
5
4
0.863
0.836
0.791
0.679
0.809
242
Table 4.15 (Continued)
Variables No of Items Cronbach‟s
Coefficient
Alpha (α)
Organisation Structure
Centralization
Complexity
Formalization
7
4
4
0.873
0.634
0.734
Leadership Behaviour
Relation-oriented
Task-oriented
18
6
0.970
0.908
Quality of Work Life Orientation
Work setting issues
Challenge of work
Job itself
Work home life interaction
Feeling about work
15
5
9
5
5
0.920
0.730
0.882
0.684
0.809
Organisational Commitment
Active commitment
Passive commitment
No commitment
7
5
3
0.856
0.769
0.871
b) Reliability Test – Using Structural Equation Modelling
Reliability is also an indicator of convergent validity (Hair et al., 2006). As recommended
by Baumgarter and Homburg (1996), researchers should report at least one measure of
construct reliability which is based on estimated model parameters (e.g. composite
reliability, average variance extracted). This is because coefficient alpha is generally an
inferior measure of reliability since in most practical cases it is only the lower bound on
reliability.

243
Hair et al. (2006) also stated that coefficient alpha remains a commonly applied estimate
although it may understate reliability. Therefore, in this study, the results of construct
reliability, which is often used in conjunction with SEM models, are also presented in
order to prove that convergent validity exist for the constructs of study. It is computed
from the squared sum of factor loading ( i ) for each construct and the sum of the error
variance terms for a construct ( i ) whereby the measurement error is one minus the
square of the indicator‟s standardised parameter estimate, as:
∑ i
Construct Reliability = _______________________
∑ i + ∑1- i2
Source: Hair, J.F.Jr., Black, W.C., Babin, B.J., Anderson, R.E., and Tatham, R.L.
(2006:777)
The rule of thumb for the reliability estimates is that 0.7 or higher. This suggests a good
reliability (Hair et al., 2006). However, Hatcher (1994) asserts that the reliability
estimates of 0.6 and above are considered reasonable for exploratory study. Table 4.16
presents the result of the construct reliability for all construct in the study.
n 2
i = 1
n 2 n
i = 1 i = 1

244
Table 4.16: Construct Reliability (CR) and Variance Extracted (VE)
Variable CR VE
Organisational Commitment 0.909 0.46
Quality of Work Life 0.944 0.51
Organisation Structure 0.898 0.48
Organisational Culture 0.940 0.49
Social Capital 0.916 0.46
Leadership Behaviour 0.968 0.72
The results exhibit that the construct reliability value for all latent variables or factors in
this study were above 0.6, as suggested by Hatcher (1994). This is to prove for the
existence of reliability.A complementary measure of construct reliability is the variance
extract measure (Hair et al., 2006). It measures the total amount of variance in the
indicators accounted for by the latent variable, and higher values occur when the
indicators are truly representative of the latent construct. The formula is comparable to
construct reliability, except that the numerator is equal to the standardised parameter
estimates ( ) between the latent variable and its indicators squared, and then summed.
The denominator equals the numerator plus the added measurement error for each item.
The measurement error is one minus the square of the indicator‟s standardised parameter
estimate.
∑λ2
Variance Extract = ________________________
∑ λ2
+ ∑ (1- λ i2
)
i = 1
i = 1 i = 1
245
By using the same logic, a variance extracted which is less that 0.5 indicates that, on
average, more error remains in the items than the variance explained by the latent factor
structure in the measurement model (Hair et al., 2006). Table 4.16also shows the results
of the variance extract. Some of the variance extract estimates of that constructs were
below 0.5. However, Hatcher (1994) posits that this situation did not cause concern since
previous studies show that it is quite frequent to find estimates below 0.50 even when the
construct reliability is acceptable.
4.17 Chapter Summary
The chapter was divided into three parts. In the first part the research methodology was
discussed, including the research design, key informant, sampling procedures and
processes taken to administer the questionnaire. The second part included a description of
measurement where the issues of measurement scales used were further discussed as well
as a detailed outline of the scales used. The final part of the chapter discussed on the
assessment of validity and reliability measurement.The validity and reliability assessment
was presented to ensure the validity and reliability of the scale used in the research. The
tests used were also outlines to examine the validity of each construct, and the methods of
assessment which included exploratory and confirmatory factors analysis were then
described.