chapter 4 software process and project metrics
DESCRIPTION
Chapter 4 Software Process and Project Metrics. Software metrics refers to a broad range of measurements for computer software. Measurement can be applied to the software process with the intent of improving it on a continuous basis. - PowerPoint PPT PresentationTRANSCRIPT
Chapter 4Software Process and Project
Metrics

Software metrics refers to a broad range of measurements for computer software.
Measurement can be applied to the software process with the intent of improving it on a continuous basis.
Measurement can be used throughout a software project to assist in estimation, quality control, productivity assessment, and project control.
Measurement can be used by software engineers to help assess the quality of technical work products and to assist in tactical decision making as a project proceeds.

Why do we Measure?
• To characterize• To evaluate• To predict• To improve

Measures, Metrics, and Indicators
A measure provides a quantitative indication of the extent, amount, dimension, capacity, or size of some attribute of a product or process.
Metrics is a quantitative measure of the degree to which a system, component, or process possesses a a given attribute.
Measures, Metrics, and Indicators
An indicator is a metric or combination of metrics that provide insight into the software process, a software project, or the product itself. An indicator provides insight that enables the project manager or software engineers to adjust the process, the project, or the process to make things better.

Metrics in the Process and Project Domains
Process indicators enable a software engineering organization to gain insight into the efficacy of an existing process (I.e., the paradigm, software engineering tasks, work products, and milestones).
They enable managers and practitioners to assess what works and what doesn’t.

Metrics in the Process and Project Domains
Project indicators enable a software project manager to
1) assess the status of an ongoing project2) track potential risks3) Uncover problem areas before they go
“critical”4) Adjust work flow or tasks, and5) Evaluate the project team’s ability to control
quality of software work products

4.2.1 Process Metrics and Software Process Improvement
• Fig 4.1• We measure the efficacy of a software
process indirectly; we derive a set of metrics based on the outcomes that can be derived from the process.

Process Metrics and Software Process Improvement
A software metrics etiquette:• Use common sense an organizational sensitivity when
interpreting metrics data• Provide regular feedback to the individuals and teams
who collect measures and metrics• Don’t use metrics to appraise individuals• Work with practitioners and teams to set clear goals
and metrics that will be used to achieve themCont..

Process Metrics and Software Process Improvement
A software metrics etiquette (cont.):• Never use metrics to threaten individuals or
teams• Metrics data that indicate a problem area
should not be considered “negative.” These data are merely an indicator for process improvement.
• Don’t obsess on a single metric to the exclusion of other important metrics.

Process Metrics and Software Process Improvement
A more rigorous approach: statistical software process improvement (SSPI):
1. All errors and defects are categorized by origin (flaw in spec, flaw in logic, nonconformance to standards).
2. The cost to correct each error and defect is recorded.
3. The number of errors and defects in each category is counted and ranked in descending order. Cont..

Process Metrics and Software Process Improvement
SPPI (cont.):4. The overall cost of errors and defects in each
category is computed.5. Resultant data are analyzed to uncover the categories
that result in the highest cost to the organization.6. Plans are developed to modify the process with the
intent of eliminating (or reducing the frequency of) the class of errors and defects that is most costly.
Fig 4.2 and Fig 4.3

4.2.2 Project Metrics
• Project metrics are used by a project manager and a software team to adapt project work flow and technical activities.
• Occurred during: – estimation monitor and control progress.– production rates: pages of documentation,
review hours, function points, and delivered source lines.
– errors– technical metrics quality

Project Metrics
The intent of project metrics are two folds:- to minimize the development schedule by
making the adjustments necessary to avoid delays and mitigate potential problems.
- to assess product quality on an ongoing basis and, when necessary, modify the technical approach to improve quality.

Project Metrics
Another model of project metrics suggests that every project should measure:
• Inputs – measures of the resources required to do the work
• Outputs – measures of the deliverables or work products created during the software engineering process
• Results – measures that indicate the effectiveness of the deliverables

Software Measurement
• Direct measures of SE process include cost and effort. Direct measures of product include LOC produced, execution speed, memory size, and defects reported over some set period of time.
• Indirect measures of product include functionality, quality, complexity, efficiency, reliability, maintainability, and many other “-abilities”

4.3.1 Size-oriented Metrics
• Derived by normalizing quality and/or productivity measures by considering the size of the software that has been produced.
• Fig 4.4• For example: choose LOC as normalization
value.

Size-oriented Metrics
Then we can develop a set of simple size-oriented metrics:
• Errors per KLOC• Defects per KLOC• $ per LOC• Page of documentation per KLOCAnd other interesting metrics can be computed:• Errors per person-month, LOC per person-
month, $ per page of documentation.

4.3.2 Function-Oriented Metrics
• Use a measure of the functionality delivered by the application as a normalization value.
• Functionality can not be measured directly, it must be derived indirectly using other direct measures.
• A measure called the function point.
Function-Oriented Metrics
Function points are derived using an empirical relationship based on countable (direct) measures of software's information domain and assessments of software complexity.
Function points are computed by completing the table shown in Fig 4.5.

Computing Function PointsAnalyze information
domain of the application and develop counts
Weight each count by assessing complexity
Assess influence of global factors that affect the application
Compute function points
Establish count for input domain and system interfaces
Assign level of complexity or weight to each count
Grade significance of external factors, F such as reuse, concurrency, OS, ...
degree of influence: N = Fi
complexity multiplier: C = (0.65 + 0.01 x N)
function points = (count x weight) x C
where:
i
Function-Oriented Metrics
To compute function points (FP), the following relationship is used:
FP = count total x [0.65+0.01x(Fi)]

Analyzing the Information Domain
complexity multiplier
function points
number of user inputs number of user outputs number of user inquiries number of files number of ext.interfaces
measurement parameter
3 4 3 7 5
countweighting factor
simple avg. complex
4 5 4 10 7
6 7 6 15 10
= = = = =
count-total
X X X X X

Taking Complexity into AccountFactors are rated on a scale of 0 (not important)
to 5 (very important):
data communications distributed functions heavily used configuration transaction rate on-line data entry end user efficiency
on-line update complex processing installation ease operational ease multiple sites facilitate change
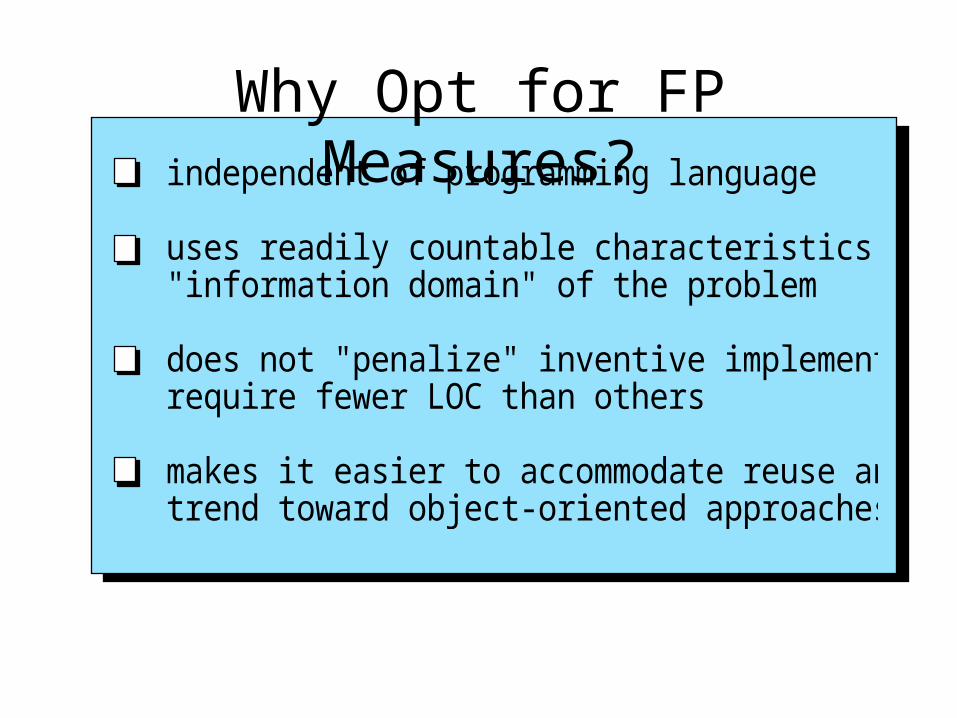
Why Opt for FP Measures?independent of programming language
uses readily countable characteristics of the "information domain" of the problem does not "penalize" inventive implementations that require fewer LOC than others makes it easier to accommodate reuse and the trend toward object-oriented approaches

Typical Function-Oriented Metrics
• errors per FP• defects per FP• $ per FP• pages of documentation per FP• FP per person-month
4.4.3 Extended Function Point Metrics
• Function point was inadequate for many engineering and embedded systems.
• A function point extension called feature points, is a superset of the function point measure that can be applied to systems and engineering software applications.
• Accommodate applications in which algorithmic complexity is high.

Extended Function Point Metrics
• The feature point metric counts a new software characteristic – algorithms.
• Another function point extension – developed by Boeing integrate data dimension of software with functional and control dimensions. “3D function point”.– “Counted, quantified, and transformed”

Extended Function Point Metrics
Function points, feature points, and 3D point represent the same thing – “functionality” or “utility” delivered by software.

4.4 Reconciling Different Metrics Approaches
• Attempt to relate FP and LOC measures. Table in page 94

4.5 Metrics for Software Quality
• Must use technical measures to evaluate quality in objective, rather than subjective ways.
• Must evaluate quality as the project progresses.
• The primary thrust is to measure errors and defects metrics provide indication of the effectiveness software quality assurance and control activities.
Measuring Quality
• Correctness: defects per KLOC• Maintainability: the ease that a program
can be corrected, adapted, and enhanced. Time/cost. – Time-oriented metrics: Mean-time-to-change
(MTTC)– Cost-oriented metrics: Spoilage – cost to
correct defects encountered.

Measuring Quality
• Integrity: ability to withstand attacks– Threat: the probability that an attack of a
specific type will occur within a given time.– Security: the probability that the attack of a
specific type will be repelled.
Integrity = sum [(1 – threat)x(1 – security)]

Measuring Quality
• Usability: attempt to quantify “user-friendliness” in terms of four characteristics:
1) The physical/intellectual skill to learn the system2) The time required to become moderately
efficient in the use of the system3) The net increase of productivity4) A subjective assessment of user attitude toward
the system (e.g., use of questionnaire).

Defect Removal Efficiency
• A quality metric that provides benefit at both the project and process level.
• DRE is a measure of filtering ability of quality assurance and control activities as they applied throughout all process framework activities.
Defect Removal Efficiency
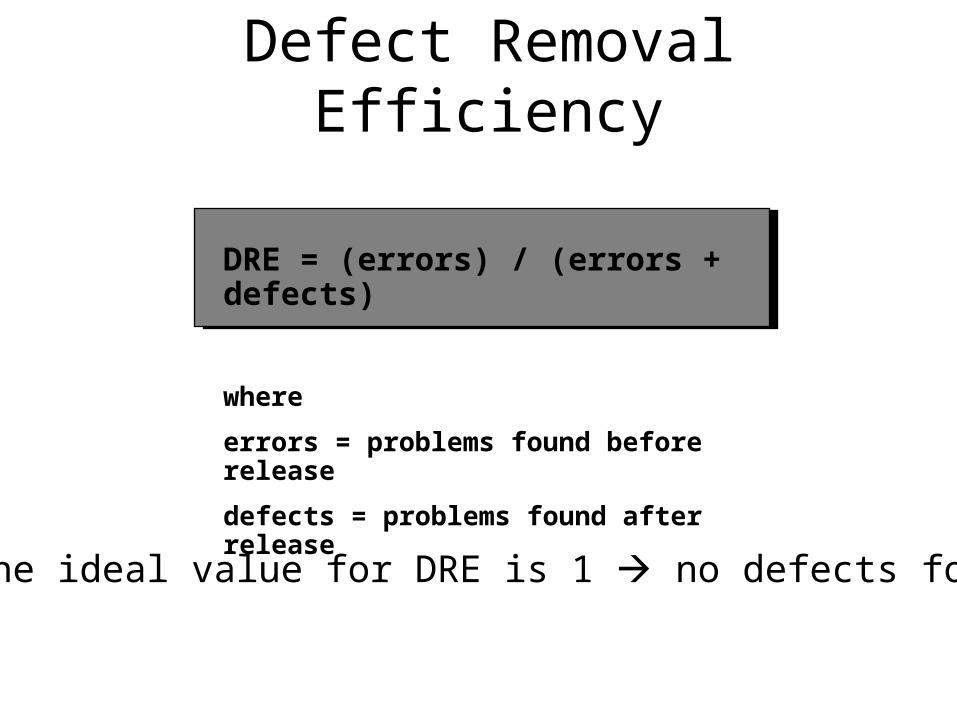
DRE = (errors) / (errors + defects)
where errors = problems found before releasedefects = problems found after release
The ideal value for DRE is 1 no defects found.

4.6 Integrating Metrics Within the Software Process
Arguments for Software Metrics:• Why is it so important to measure the
process of software engineering and the product (software) that it produces?
4.7 Managing Variation: Statistical Process Control
• How can we compare a variety of different projects?
– Use of Control Chart: to determine whether the dispersion (variability) and “location” (moving average) of process metrics are stable or unstable.
1) The moving average control chart2) The individual control chart
Fig. 4.8 Page102

Moving Range (mR) Control Chart
1. Calculate the moving ranges (mR)2. Calculate the mean of the moving ranges3. Multiply the mean by 3.268 upper control
limit (UCL)Fig. 4.8 4.9- Are all moving range values inside the
UCL?- If “yes” stable

Individual Chart Control
1. Plot individual metrics values as shown in Fig 4.82. Compute the average value, Am3. Multiply the mean of the mR value by 2.660 and
add Am in (2) plot the upper natural process limit (UNPL)
4. Multiply the mean of the mR value by 2.660 and subtract Am in (2) plot the lower natural process limit (LNPL)
5. Compute the SD as (UNPL – Am)/3. Plot lines one and two SD above and below Am.
Individual Chart Control
Zone rules: If any of the following conditions is true, the metrics data is out of control:
1. A single metrics value lies outside the UNPL2. Two out of three successive metrics values
lie more than two SD away from Am3. Four out of five successive metric values lie
more than one SD away from Am4. Eight consecutive metrics values lie on one
side of Am.

4.8 Metrics for Small Organizations
“Keep it simple”:• Time• Effort• Errors• Defects

Homework #2
• Problem# 4.9, 4.11, 4.13, 4.17, and 4.18• Due Mon 15 July 2002