chapter 4 variability. variability in statistics, our goal is to measure the amount of variability...
TRANSCRIPT

Chapter 4Chapter 4
VariabilityVariability

VariabilityVariability
In statistics, our goal is to measure the In statistics, our goal is to measure the amount of variability for a particular set of amount of variability for a particular set of scores, a distribution.scores, a distribution. If all the scores are the same no variabilityIf all the scores are the same no variability If small difference, variability is smallIf small difference, variability is small If large difference, variability is largeIf large difference, variability is large

VariabilityVariability
Variability provides a quantitative measure Variability provides a quantitative measure of the degree to which scores in a of the degree to which scores in a distribution are spread out or clustered distribution are spread out or clustered together.together.
Goal: to describe how spread out the Goal: to describe how spread out the scores are in a distributionscores are in a distribution

Figure 4.1Figure 4.1
Population distributions of heights and weightsPopulation distributions of heights and weights
Cop
yrig
ht ©
200
2 W
adsw
orth
Gro
up. W
adsw
orth
is a
n im
prin
t of t
he
Wad
swor
th G
roup
, a d
ivis
ion
of T
hom
son
Lear
ning

Variability (cont.)Variability (cont.)
Variability will serve two purposesVariability will serve two purposesDescribe the distributionDescribe the distribution
Close togetherClose togetherSpread out over a large distanceSpread out over a large distance
Measure how well an individual score (or Measure how well an individual score (or group of scores) represents the entire group of scores) represents the entire distributiondistribution

Variability (cont.)Variability (cont.)
Variability provides information about how Variability provides information about how much error to expect when you are using a much error to expect when you are using a sample to represent a population.sample to represent a population.
Three measures of variabilityThree measures of variabilityRangeRange Interquartile rangeInterquartile rangeStandard deviationStandard deviation

RangeRange
The range is the difference between the The range is the difference between the upper real limit of the largest (maximum) X upper real limit of the largest (maximum) X value and the lower real limit of the value and the lower real limit of the smallest (minimum) X value.smallest (minimum) X value.
Range is the most obvious way to Range is the most obvious way to describe how spread out the scores are.describe how spread out the scores are.

Range (cont.)Range (cont.)
Problem: Completely determined by the Problem: Completely determined by the two extreme values and ignores the other two extreme values and ignores the other scores in the distribution.scores in the distribution.
It often does not give an accurate It often does not give an accurate description of the variability for the entire description of the variability for the entire distribution.distribution.
Considered a crude and unreliable Considered a crude and unreliable measure of variabilitymeasure of variability

Interquartile Range and Interquartile Range and Semi-Interquartile RangeSemi-Interquartile Range
Divide the distribution into four equal partsDivide the distribution into four equal partsQ1, Q2, Q3Q1, Q2, Q3The interquartile range is defined as the The interquartile range is defined as the
distance between the first quartile and the distance between the first quartile and the third quartilethird quartile

Interquartile RangeInterquartile Range
Q1 Q2 Q3
25% 25% 25% 25%
Semi-interquartile RangeSemi-interquartile Range

Figure 4.2Figure 4.2
The interquartile rangeThe interquartile range
Cop
yrig
ht ©
200
2 W
adsw
orth
Gro
up. W
adsw
orth
is a
n im
prin
t of t
he
Wad
swor
th G
roup
, a d
ivis
ion
of T
hom
son
Lear
ning
Interquartile Range (cont.)Interquartile Range (cont.)
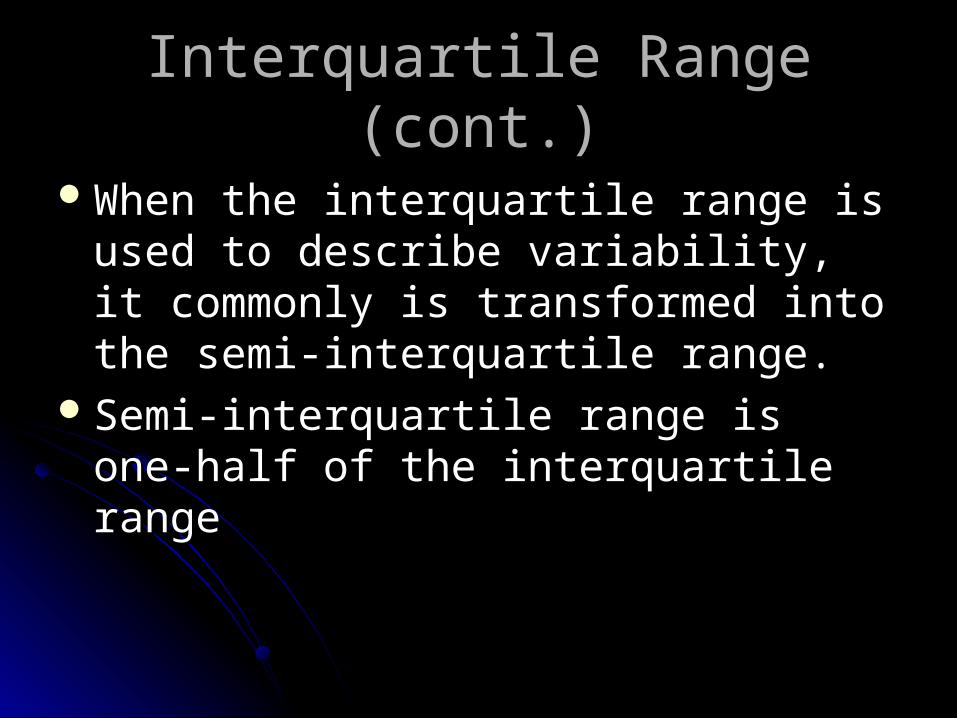
When the interquartile range is used to When the interquartile range is used to describe variability, it commonly is describe variability, it commonly is transformed into the semi-interquartile transformed into the semi-interquartile range.range.
Semi-interquartile range is one-half of the Semi-interquartile range is one-half of the interquartile rangeinterquartile range

Interquartile Range (cont.)Interquartile Range (cont.)
Because the semi-interquartile range is Because the semi-interquartile range is derived from the middle 50% of a derived from the middle 50% of a distribution, it is less likely to be influenced distribution, it is less likely to be influenced by extreme scores and therefore gives a by extreme scores and therefore gives a better and more stable measure of better and more stable measure of variability than the range.variability than the range.

Interquartile Range (cont.)Interquartile Range (cont.)
Does not take into account distances Does not take into account distances between individual scoresbetween individual scores
Does not give a complete picture of how Does not give a complete picture of how scattered or clustered the scores are.scattered or clustered the scores are.

Standard DeviationStandard Deviation
Most commonly usedMost commonly usedMost important measure of variabilityMost important measure of variabilityStandard deviation uses the mean of the Standard deviation uses the mean of the
distribution as a reference point and distribution as a reference point and measures variability by considering the measures variability by considering the distance between each score and the distance between each score and the mean.mean.

Standard Deviation (cont.)Standard Deviation (cont.)
Are the scores clustered or scattered?Are the scores clustered or scattered?Deviation is the average distance and Deviation is the average distance and
direction from the mean.direction from the mean.

Standard Deviation (cont.)Standard Deviation (cont.)
Goal of standard deviation is to measure Goal of standard deviation is to measure the standard, or typical, distance from the the standard, or typical, distance from the mean.mean.
Deviation is the distance and direction Deviation is the distance and direction from the meanfrom the mean
deviation score = X - deviation score = X -

Standard Deviation (cont.)Standard Deviation (cont.)
Step 1Step 1Determine the deviation or distance from the Determine the deviation or distance from the
mean for each individual score.mean for each individual score.
IfIf X = 53X = 53
deviation score = X – deviation score = X –
= +3= +3

Standard Deviation (cont.)Standard Deviation (cont.)
IfIf X = 45X = 45
deviation score = X – deviation score = X –
= -5= -5

Standard Deviation (cont.)Standard Deviation (cont.)
Step 2: Calculate the Step 2: Calculate the meanmean of the of the deviation scoresdeviation scoresAdd the derivation scoresAdd the derivation scoresDivide by NDivide by N

Standard Deviation (cont.)Standard Deviation (cont.)
XX X – X –
88 +5+5
11 -2-2
33 00
00 -3-3
X – X – Deviation scores must add up to zero
Standard Deviation (cont.)Standard Deviation (cont.)
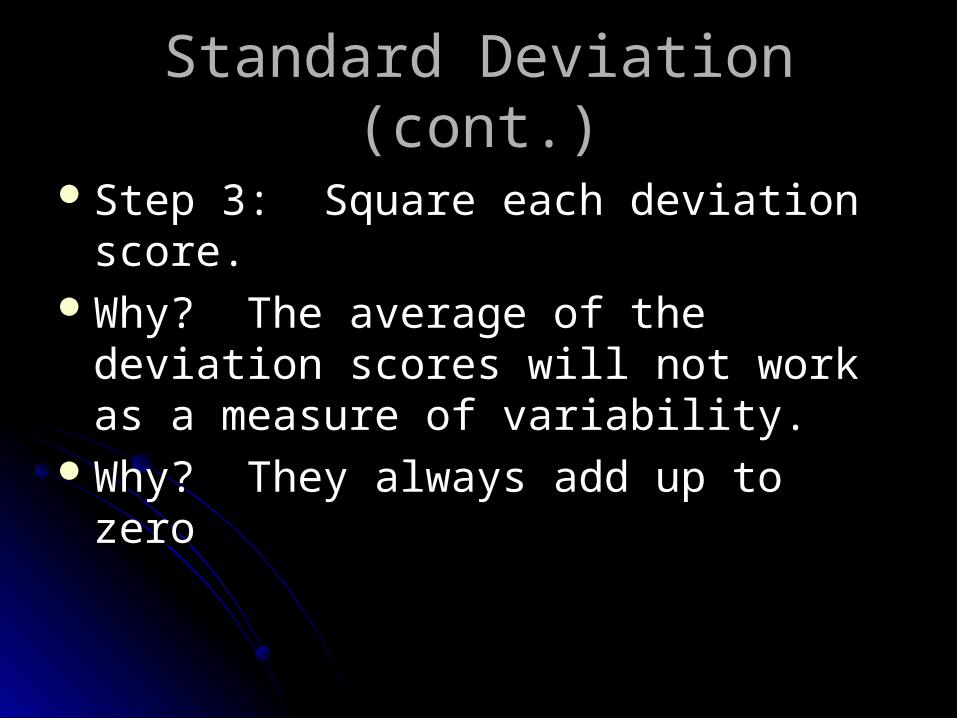
Step 3: Square each deviation score.Step 3: Square each deviation score.Why? The average of the deviation Why? The average of the deviation
scores will not work as a measure of scores will not work as a measure of variability.variability.
Why? They always add up to zeroWhy? They always add up to zero

Standard Deviation (cont.)Standard Deviation (cont.)
Step 3 cont.: Step 3 cont.: Using the squared values, you can now Using the squared values, you can now
compute the mean squared deviationcompute the mean squared deviationThis is called This is called variancevariance
Variance = mean squared deviationVariance = mean squared deviation

Standard Deviation (cont.)Standard Deviation (cont.)
By squaring the deviation scores:By squaring the deviation scores:You get rid of the + and –You get rid of the + and –You get a measure of variability based on You get a measure of variability based on
squared distancessquared distancesThis is useful for some inferential statisticsThis is useful for some inferential statisticsNote: This distance is not the best descriptive Note: This distance is not the best descriptive
measure for variabilitymeasure for variability

Standard Deviation (cont.)Standard Deviation (cont.)
Step 4: Make a correction for squaring the Step 4: Make a correction for squaring the distances by getting the square root.distances by getting the square root.
Standard deviation = varianceStandard deviation = variance
Sum of Squared Deviations (SS)Sum of Squared Deviations (SS)
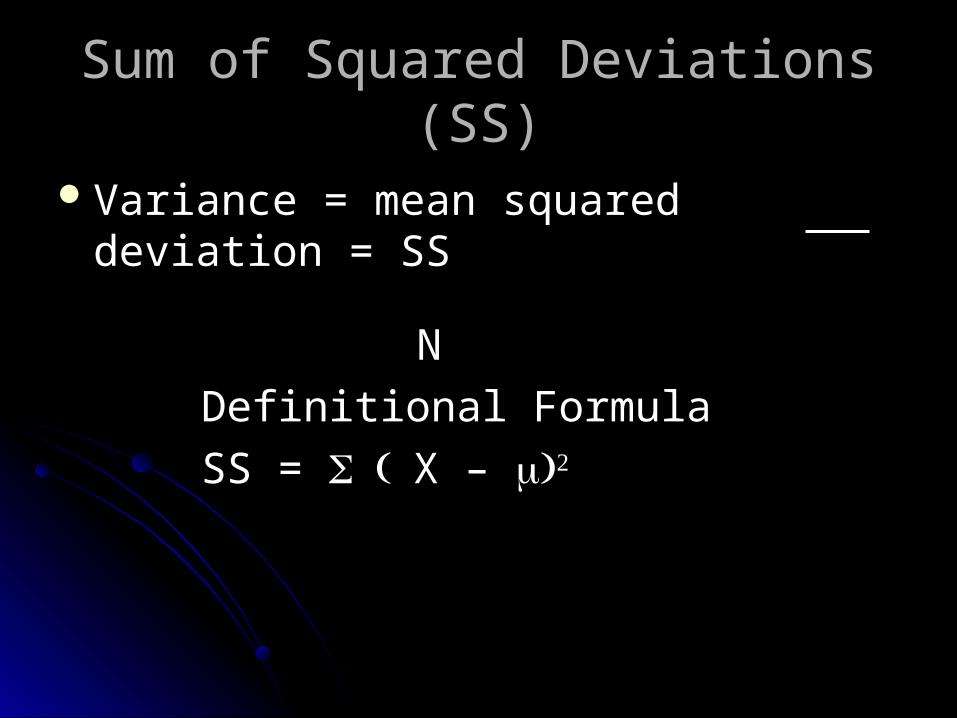
Variance = mean squared deviation = SSVariance = mean squared deviation = SS
NN
Definitional FormulaDefinitional Formula
SS = SS = X – X –

Sum of Squared Deviations (SS) Sum of Squared Deviations (SS) Definitional FormulaDefinitional Formula
XX X – X – X – X – = 8= 8
11 -1-1 11
00 -2-2 44
66 +4+4 1616
11 -1-1 11
2222 = = X X – – ))22

Computational FormulaComputational Formula
SS = SS = XX22 – ( – (XX
NN

Computational Formula for SSComputational Formula for SS
XX XX22
11 11
00 00
66 3636
11 11
X = 8X = 8 XX22 = 38 = 38
SS = XX2 2 – (– (X)X)22
NN
= 38 – (8)= 38 – (8)22
44
= 38 – 64= 38 – 64
44
= 38 – 16= 38 – 16
= 22= 22

Definitional vs. Computational?Definitional vs. Computational?
Definitional is most direct way of Definitional is most direct way of calculating the sum of squarescalculating the sum of squares
However if you have numbers with However if you have numbers with decimals, it can become cumbersomedecimals, it can become cumbersome
Computation is most commonly usedComputation is most commonly used

FormulasFormulas
Variance = SSVariance = SS
NNStandard deviation = variance = SSStandard deviation = variance = SS
NN

Formulas (cont.)Formulas (cont.)
Variance and standard deviation are Variance and standard deviation are parameters of a population and will be parameters of a population and will be identified with a Greek letter – identified with a Greek letter – ororsigmasigma
Population standard deviation = Population standard deviation = SSSS
NN
Population variance = Population variance = SSSS
NN

Figure 4.4Figure 4.4
Graphic presentation of the mean and standard deviationGraphic presentation of the mean and standard deviation
Cop
yrig
ht ©
200
2 W
adsw
orth
Gro
up. W
adsw
orth
is a
n im
prin
t of t
he
Wad
swor
th G
roup
, a d
ivis
ion
of T
hom
son
Lear
ning

Figure 4.5Figure 4.5
Variability of a sample selected from a populationVariability of a sample selected from a population
Cop
yrig
ht ©
200
2 W
adsw
orth
Gro
up. W
adsw
orth
is a
n im
prin
t of t
he
Wad
swor
th G
roup
, a d
ivis
ion
of T
hom
son
Lear
ning

Figure 4.6Figure 4.6
Largest and smallest distance from the meanLargest and smallest distance from the mean
Cop
yrig
ht ©
200
2 W
adsw
orth
Gro
up. W
adsw
orth
is a
n im
prin
t of t
he
Wad
swor
th G
roup
, a d
ivis
ion
of T
hom
son
Lear
ning

Example (pg. 94)Example (pg. 94)
XX X – X – X – X –
X = 35X = 35
11 -4-4 1616
66 11 11 n=7n=7
44 -1-1 11
33 -2-2 44
88 33 99
77 22 44
66 11 11
3636
= = X X – – ))2 2 = SS= SS

Degrees of FreedomDegrees of Freedom
Degrees of freedom, useDegrees of freedom, use for for samplesample variance variance
where n is the number of scores in the where n is the number of scores in the samplesample..
With a sample of n scores, the first n-1 With a sample of n scores, the first n-1 scores are free to varyscores are free to vary
but the final score is restricted.but the final score is restricted.As a result, the sample is said to have As a result, the sample is said to have
n-1 degrees of freedomn-1 degrees of freedom

Degrees of FreedomDegrees of Freedom
Degrees of freedom, or Degrees of freedom, or df, df, for sample for sample variance are defined as variance are defined as
df = n – 1df = n – 1
where n is the number of scores in the where n is the number of scores in the sample.sample.

Table 4.2Table 4.2
Reporting the mean and standard deviation in APA formatReporting the mean and standard deviation in APA format
Cop
yrig
ht ©
200
2 W
adsw
orth
Gro
up. W
adsw
orth
is a
n im
prin
t of t
he
Wad
swor
th G
roup
, a d
ivis
ion
of T
hom
son
Lear
ning