chapter 4 - welcome to store - store - staffordshire ...eprints.staffs.ac.uk/2603/1/export behaviour...
TRANSCRIPT
Export Behaviour of SMEs in TCs
Export Behaviour of SMEs in Transition Countries
Petrit Gashia, Iraj Hashib and Geoff Pughc
a Corresponding author. Faculty of Economics, University of Prishtina, St. Ramiz Sadiku, nn.10000 Prishtina, Kosovo. [email protected]; +377 (0)44 425 426.
b Staffordshire University Business School, Leek Road, Stoke-on-Trent, ST4 2DF, UK. [email protected];
c Staffordshire University Business School, Leek Road, Stoke-on-Trent, ST4 2DF, UK. [email protected]
1

Export Behaviour of SMEs in TCs
Export Behaviour of SMEs in Transition Countries*
Abstract
Melitz’s dynamic model of export participation is the basis of our empirical specification that accounts for a
wide range of internal and external factors affecting the export behaviour of SMEs in Transition Countries
(TCs). Using firm-level data, our estimates highlight the particular importance of the human and technology-
related factors to the export behaviour of SMEs in TCs. Other important factors for SME exporting activities are
productivity-enhancing spillovers from industry – especially vertical - linkages, firm size, ownership type, type
of activity, the availability of external finance, networking through business associations, and market share. In
addition, significant period and country differences are identified. This paper contributes to the transition
literature by filling an important gap in the understanding of the SME internationalisation process and by
identifying a comprehensive set of variables to explain firms’ export behaviour in TCs.
Key words: Export behaviour • SMEs • Transition countries • Melitz’s dynamic model • Spillovers • Multiple imputation.
JEL classifications: F 14 • F23 • M16 • P33
* Acknowledgements. The authors thank Joseph Brada for his many helpful suggestions on an earlier version. In addition, three anonymous referees have helped to greatly improve this paper. The usual disclaimer applies.
2
Export Behaviour of SMEs in TCs
1 Introduction
It is now well established that small and medium sized enterprises (SMEs) play a vital role in the process of
transition to a market economy. As the large firm sector, the prevalent form of organisation under central planning,
underwent restructuring and decline, thousands of new SMEs took advantage of liberalised entry conditions and
entered the market.1 They responded rapidly to systemic shocks, produced goods and services demanded by the
population and, in the process, contributed to the generation of new jobs and incomes.2 While the contribution of
SMEs to domestic output and employment has been studied by many authors, and for many TCs, their role in
cross-border trade and their contribution to exports has not been studied widely. The aim of this paper is to develop
the research in this area by investigating the factors influencing the export behaviour of SMEs and by providing
empirical evidence for TCs.3
An important constraint on our analysis is the absence of a well-developed theory on the behaviour of SMEs
and, in particular, on SMEs and international trade (Brock and Evans, 1989, Dunning, 1988; 1993; 2001; Axinn
and Matthyssens, 2002; and others). However, a recent strand of the international trade literature linking firm
heterogeneity and participation in foreign markets has been developed. This approach, initiated by the
pioneering work of Melitz (2003), argues that firm’s export entry and exit decisions are determined by
the interplay of two factors: firm-level variation in productivity; and sunk costs. As Greenaway and Kneller
(2007) explain, as a result of the interaction between these two factors, high productivity firms self-select into
export markets compared to less productive firms, which resort to the domestic market. Because of capacity
constraints, SMEs may be expected to be less represented in export markets relative to their large counterparts
due to economies of scale and the fixed costs involved in exporting activities. Furthermore, as a result of the
latter, there is a high level of persistence in firms’ exporting activities, which additionally leads to a higher
representation of larger firms in exporting activities.
Many of the variables we employ in our empirical investigation fall within the Melitz framework. Factors related to
higher quality labour, physical capital, R&D and innovation activities, learning-by-doing, firm and industry
spillovers, and others, are all productivity enhancing factors (for a comprehensive survey on the sources of
productivity see Syverson, 2011). However, the concerns noted earlier with regards to the limitations of the
existing theories of the firm’s internationalisation process still echo within academic circles (see Spence and Crick,
2006). Hence, we draw upon a number of additional strands of thought either to substantiate or to complement
Melitz’s approach to internationalisation.
Although the core of our theoretical framework is based on the Melitz (2003) approach, it is augmented with a
variety of supplementary hypotheses in order to allow for other influences that may be important in the
transition process or derived from the empirical literature. Transition is a process whereby countries increasingly
1 The SME definition follows the European Community definition, based on the number of employees: small firms (including micro firms) have up to 50 employees; and medium firms have up to 250 employees. 2 See, for example, Bartlett and Prasnikar (1995); Futo et al. (1997); Scase (1998); McMillan and Woodruff (2002); Hoshi et al. (2003); Iakovleva (2005); and Estrin et al. (2006) among many other contributions.3 We conceptualise firms’ export behaviour by taking into account not only the level of export activity but also the likelihood that firms will export at all.
3

Export Behaviour of SMEs in TCs
acquire the institutional and economic characteristics of market economies. In addition the passage from
central planning to market system requires a change and upgrading of human capital and investment in
physical capital as well as technology. The technology spillovers resulting from FDI were crucial in
speeding up the transition process in these countries. Although these factors are important in all
countries, the transition process was heavily reliant on these factors. In principle, we expect firms’ export
behaviour in TCs to be mainly and increasingly influenced by similar variables to those that influence firms’
export behaviour in developed market economies. However, the study also draws on the literature in transition
economics by including a number of variables to address transition specific influences and the institutional and
cultural heterogeneity amongst transition countries: ownership variables (especially foreign ownership); capital
city effects, which may be more important in TCs; and country dummies.
This paper employs large firm-level datasets drawn from the Business Environment and Enterprise Performance
Surveys (BEEPS) conducted jointly by the World Bank and EBRD, which have remained underutilised in the
area of cross-border trade.4 Tobit estimation is used to account for influences both on the likelihood that firms
will decide to export (propensity) and on the export decisions of existing exporters (intensity). Three features of
our empirical strategy help to ensure the robustness of the results and subsequent inferences. First, we
investigate six datasets with corresponding variations in model specification: each of the three comparable
rounds of BEEPS separately; the three waves pooled; a panel of firms surveyed in all three rounds; and a two-
year panel of firms surveyed in the final two waves. Secondly, we compare the results from alternative – cross-
section and panel - estimators. Thirdly, as a robustness check on each of the corresponding models estimated,
we re-estimate the models using each of the six datasets made complete by the imputation of missing values.
Our estimates show, ceteris paribus, that the accumulation of human capital and technology are important
sources of international competitiveness for SMEs. Consistent with this, companies with a greater percentage of
highly educated workers in the workforce export more, while gross investment and new and upgraded
technologies also promote exports. In addition, we find some evidence that productivity-enhancing spillovers
promote SME exports. With regards to the firm-specific variables, the bigger the size of the firm the larger the
share of sales generated in export markets. Companies with a foreign capital share have better prospects for
exports; the same applies to firms engaging in production activities, who are more proficient in foreign markets
than are non-production companies. The availability of external finance appears to be a significant determinant
of the export behaviour of SMEs in TCs. So does membership in business associations, which enhances the
networking ability of firms. Finally, period dummies highlight 2005 as the best performing year in terms of
export performance; and, as expected, country dummies capture major differences in firms’ export behaviour in
transition countries.
Using Jones and Coviello’s (2005) language, our study puts in place a few ‘pieces of the puzzle’ in the firm’s
internationalisation process in TCs. The contribution of this study can be viewed from different perspectives.
First, we fill an important gap in SME internationalisation literature by studying SME export behaviour – by
which we mean both export propensity and export intensity - in TCs. Although there are many studies of
4 Studies using BEEPS data include Carlin et al., 2001b; Vagliasindi, 2001; 2006; Svejnar and Commander, 2007; Gorodnichenko et al., 2010; and Transition Report 2005.
4

Export Behaviour of SMEs in TCs
internationalisation of firms’ entrepreneurial activities, those relating to international activities of SMEs in
transition are very scarce5, and lagging well behind investigations linking SMEs with other developments in the
economy, such as growth and employment. The second contribution relates to the large number of mainly
supply-side factors included in the analysis, reflecting a comprehensively specified model of export behaviour.
The third contribution concerns research practice. We apply multiple imputation techniques to the BEEPS
datasets, because – we argue - this enables us to utilize this data more fully, which is an issue ignored by
previous authors using these surveys.6
The paper proceeds with section 2 where we present the theoretical reasoning informing the investigation.
Section 3 presents our empirical strategy and the datasets. Section 4 reports and discusses the econometric
results. The final section concludes.
2 Determinants of export behaviour
An important constraint on our analysis is the lack of well-established theories explaining the behaviour of
SMEs in the economy, specifically their internationalisation decisions. In a series of studies, Dunning (1988,
1993, 1995, and 2001) argues that there is no single theory of international trade able to fully explain a firm's
international expansion. Dunning explains (1995, p.165):
… the nature and character of international transactions have so much changed in recent years, that the
traditional intellectual apparatus of the international economist is, by itself, no longer adequate to explain
real-world phenomena, and only by drawing upon the tools of other branches of economics, notably,
industrial, institutional, and techno-growth economics, can contemporary cross-border flow of goods,
services, and assets be properly understood.
Dunning’s position on the incompleteness of international trade theory continues to resonate with his peers to
this day. More recent studies (Axinn and Matthyssens, 2002; Jones and Coviello, 2005; Crick and Spence, 2005;
Spence and Crick, 2006; Thai and Chong, 2011) share the same concerns. Axinn and Matthyssens (2002)
provide a review of the existing theories of internationalisation, which include: industrial organization theory;
the resource based view; transaction costs theory; the amalgamation of these three in the form of Dunning’s
eclectic paradigm; the Uppsala model of internationalization; innovation-based models; network theory; and
other approaches. In the same vein as Dunning, they argue that current internationalisation theories fail to
explain and predict the behaviour of firms in the global marketplace, primarily because theoretical developments
have been unable to keep pace with the rapidly changing, hyper-competitive global environment. Further, it is
argued that each theory explains a specific aspect of firm behaviours in a specific environmental context. If the
latter holds true, then attempts to develop an approach to explain and predict firms’ internationalisation process
5 A detailed analysis of two recent large-scale surveys (Keupp and Gassmann, 2009, surveying 179 papers; and Terjesen and Hessels, 2010, surveying 200 papers) shows that very few of them were related to transition countries; and none of them employed the large BEEPS databases, Melitz’s theoretical framework, or the methodology employed in this paper.6 For any missing value in the dataset we lose all other information related to a surveyed entity (as we have to drop the entire observation). This fact is usually ignored in empirical investigations.
5

Export Behaviour of SMEs in TCs
in the transition context, the subject of this study, are virtually non-existent. Yet, a transition country setting,
according to Thai and Chong (2011), provides a unique backdrop characterized by distorted information, weak
market structures, poorly specified property rights and institutional uncertainty, making existing explanations of
firms’ internationalisation process less convincing.
However, a stream of recent studies (Melitz, 2003; Melitz and Ottaviano, 2003; Bernard et al., 2003, Helpman et
al. (2004); Arnold and Hussinger, 2005; Aw et al., 2007; Aw et al., 2008; among others) on firm heterogeneity
and participation in international markets has provided a comprehensive framework for analysing factors
influencing firms’ decisions to internationalize.7 According to this line of thinking, export entry and exit
decisions are determined by differences in firm productivity levels and incurred sunk costs. According to
Melitz’s (2003) dynamic industry model of heterogeneous firms, high-productivity firms self-select into export
markets. An important ingredient of the theory is the recognition that entering export markets incurs sunk costs.
As Greenaway and Kneller (2007) explain, firms have to engage in market research, train people, modify
products to respond to local requirements, establish new distribution networks, etc. The importance of sunk
costs has been recognised for some time (see Dixit, 1989; Dixit and Pindyck, 1994), and their effect on export
entry has been demonstrated empirically (Roberts and Tybout, 1997; Bernard and Jensen, 2004; etc.). These
studies argue that the presence and the magnitude of sunk costs generate large hysteresis effects.
To guide the specification of the empirical model, we draw upon the Melitz dynamic model of export
participation as well as on other lines of thought arguing for the inclusion of human-related factors; technology-
related factors; and other firm characteristics. Most variables included in the empirical model share a common
characteristic; namely, that they are supply-side variables in that they relate directly to the ability of firms to
produce. In line with previous research, we use export intensity (foreign sales as a percentage of total sales) to
measure the degree of firms’ involvement in foreign markets (Bonaccorsi, 1992; Calof, 1993; Wakelin, 1998;
White et al., 1998; Becchetti and Rossi, 2000; Wagner, 2001; Gorodnichenko et al., 2010; and others). The
theory that export behaviour is determined essentially by the interplay of productivity levels and the fixed costs
of exporting suggests that the same factors will affect both the firm’s propensity to export and, if it exports at
all, the firm’s export intensity (see Melitz, 2003, pp.1695-96 and Greenaway and Kneller, 2007). This
influences our empirical strategy discussed below. To anticipate, the estimated effects of our independent
variables represent the combined effects of two channels of influence on our dependent variable: namely,
influences on the likelihood that firms will decide to export (propensity); and influences on the export decisions
of existing exporters (intensity). We refer to these estimates as influences on export behaviour. We do not refer
to export performance, because our dependent variable does not directly correspond to conventional efficiency
measures.8
7 For an extensive survey of this literature see Greenaway and Kneller (2007).8 There are other measures of assessing firm’s involvement in export markets. For instance, White et al. (1997) use three measures of export performance other than export intensity: number of foreign countries served by a firm; management’s perceptions of export profitability; and management’s satisfaction with export performance. Their discussion is inconclusive with regards to the best export performance measure. In their empirical investigation they are rather pragmatic; they apply all four indicators to measure export performance in a sample of US service firms. Unfortunately, the dataset BEEPS is not so generous with information on export performance: the export intensity variable is the only information provided in all three rounds of BEEPS. Of course, export profitability also has its own additional drawbacks as a measure of export performance.
6

Export Behaviour of SMEs in TCs
2.1 Human capital related factors
The importance of human resources has been extensively examined at the country and firm level. These studies
systematically highlight the supremacy of human capital for the sustained comparative and competitive
advantage of nations and firms. Human capital is at the core of the New Growth Theory, which argues that the
creation and diffusion of knowledge is the primary engine of economic growth (Grossman and Helpman, 1994).
At the micro level, human capital factors affect firms’ export propensity and intensity through increases in
productivity (Arnold and Hussinger, 2005; Bryan, 2006; Kleynhans, 2006; Kagochi and Jolly, 2010). The
connection between the quality of labour variables such as education, training, overall experience, and tenure at
the firm and the firm’s productivity has been investigated in a growing body of work (see Syverson, 2011). For
instance, Chevalier et al. (2004) and Carlin et al. (2001a) argue that higher levels of education or skill
acquisition signal or enhance productivity. In addition, according to Bryan (2006), training helps to sustain
higher levels of productivity. In our model of export behaviour we measure the impact of human capital
accumulation through several proxies: [i] the education of the workforce; [ii] on-the-job-training; [iii] the
presence of highly skilled workers within the firm, which includes also the managerial staff and other
professionals; [iv] changes in organisational structure9; and [v] the general manager’s education.
First, a number of studies (Keeble et al., 1991; Wood, 1991; Dex and Scheibl, 2001, 2002; Power and Reid,
2005; etc.) argue that SMEs are more inclined to have flexible organisational arrangements than are larger firms,
because of their limited scope of operations, well-understood relationships within the firm, relatively simple
organisational structures, ease of accessing networks of firms, etc. Conversely, Meijaard et al. (2005) argue that
organisational structures within SMEs are much more complex than is argued by transaction costs and agency
costs theories. We investigate whether or not organisational flexibility translates into higher export intensity and
propensity by introducing a dummy variable indicating whether or not a firm underwent any organisational
transformation (from minor reallocations to adoption of completely new organisational arrangements) in the
previous three-year period. Second, the link between firm management and firm productivity is well-established.
However, as Syverson (2011) argues, the literature has yet to dig deeper into the role of managers in
productivity gains. This study aims to shed some light on this question by employing a variable that depicts the
level of education of the general manager and its influence on firm’s export behaviour. The above discussion
leads us to the following hypothesis:
Hypothesis 1: The quality of labour in SMEs in transition countries is positively related both to the
propensity of firms to export (i.e., the likelihood of exporting at all) and to the intensity of exports by
those firms that do export.
9 Changes in the organisational structure indicate organisational innovations. As these changes have at their core the human factor and its better utilisation, we have decided to place them within this category of factors.
7
Export Behaviour of SMEs in TCs
2.2 Technology-related factors
A significant body of literature has concentrated on explaining the productivity–export relationship through
firm-level investments in productivity enhancing activities. Most of these studies have focused on R&D
investment (Aw et al., 2007; 2008; 2011; Esteve-Perez and Rodriguez, 2012; among others). Less attention has
been paid to the impact of investment in physical capital on increasing firm’s productivity levels (see Syverson,
2011). We start with the latter; firstly, following Carlin et al. (2001a), we use gross investment in capital goods
as a proxy for embodied technological change, and expect it to have a positive impact on the firm’s productivity,
leading to better export behaviour of the firms under consideration. Secondly, R&D expenditure can be used as
an indicator of innovation activities (an input measure of innovation) to investigate its effect on the export
behaviour of firms.10 Thirdly, the introduction of new or upgraded technology or new or upgraded products can
be used as another, broader indicator of the innovation process, expected to have positively affected the firm’s
export behaviour. Finally, a firm’s level of technology relative to its main rivals may also be used as an
indication of technological progress, with positive impact on export behaviour. These indicators are expected to
translate into similar changes in export behaviour, i.e. a higher propensity to export and a greater intensity of
exporting.
The estimated relationship between the technology-related variables and export behaviour is potentially flawed
by endogeneity, caused by reverse causation. Aw et al. (2011) summarises recent work on the firm’s
investments in technology adaptation and the latter’s impact on the productivity-export link. Their survey shows
that exporting and technology-related investments are interdependent firm decisions, and both may
endogenously affect the firm’s future productivity. In our case, because of the way in which the above variables
are defined in some waves of the survey, such endogeneity would be precluded.11 We hypothesise that past
technical progress may influence current export intensity. However, we have no such reasons for hypothesising
that current export intensity could affect past technical progress (see Table 1 for the description of variables). In
such cases, the activities captured by these questions substantially lag current export intensity, our dependent
variable. Finally, the dummy variable modelling the firm’s technology level relative to its competitors reflects
repondents’ judgements that can only arise from past experience and corresponding accretion of knowledge. In 10 For reasons that will be explained below, investment in R&D and gross investment can be used only in estimations from the 2005 dataset. 11 The three surveys are not consistent regarding the years or periods in which technology related variables are measured, thus causing confusion. We summarise the situation as follows.
i. In all three rounds, the definition of the dependent variable, the export intensity, refers to the year of the survey (2002, 2005 and 2008/09).
ii. In all three rounds, the variable for innovation activities - i.e., the introduction of new or upgraded products and processes - always refers to a period before the year of the survey (4 years before in 2002 and 3 years before in 2005 and 2008/09).
iii. Conversely, for the variables ‘gross investment’ and ‘investment in R&D’, the definition changed in each round of the survey. In 2002, the variables are recorded for the previous four years (‘since 1998’, Question Q.83); in 2005, the variables are recorded for ‘2004’ (Question Q.85) (which might be the same year as the export intensity variable); and in 2008/09, the variables gross investment (question K.4) and investment in R&D (question O.3) refer to 2007 (Questions K.4 and O.3) (the same year as the export intensity variable). Accordingly, these variables are excluded from the models estimated on the 2005 and 2008/09 datasets, because they would be potentially endogenous by virtue of their definition.
The use of the variable indicating the introduction of new or upgraded products and processes (in all three surveys) and the variables ‘gross investment’ and ‘investment in R&D’ for 2002 do not cause any endogeneity problem; these will have some effect on export intensity in a later period, but the current value of export intensity cannot affect the previous values of these variables. In cases where these variables and export intensity are measured contemporaneously, the problem of endogeneity precludes using those variables in the estimation process.
8

Export Behaviour of SMEs in TCs
this case, this variable too refers to a period preceding the one in which respondents estimate their current export
intensity.
The above discussion informs the following hypothesis:
Hypothesis 2: The physical capital, technological capabilities – R&D expenditures and innovativeness
– and technological sophistication of SMEs in transition countries are positively related both to the
decision to export and to the intensity of exporting.
2.3 Productivity-enhancing spillovers
We investigate two types of productivity-enhancing spillovers that occur when the activities of a firm lead to
improvements in the technology or productivity of other firms: namely, economic externalities that may arise from
agglomeration; and/or industry linkages, especially vertical linkages through input-markets in intermediate goods
(see World Bank, 2009).12 We consider these in turn.
We start from the view that localisation and urbanisation economies generated by the concentration of firms in
cities play an important role in the overall performance of firms, including their export activities (Audretsch and
Stephan, 1999, Fujita and Thisse, 2002; Fujita et al. 1999; etc.). In our specifications, we concentrate on the impact
of the location of SMEs in capital cities on firms’ export behaviour. The process of transition can be most
markedly observed in the capital cities, which have by far overtaken other parts of these countries (even in those
countries that have joined the EU). Therefore, we expect firms located in these cities to be able to benefit from
agglomeration economies (specifically resulting from a favourable environment for identifying and exploiting
synergies between previously unrelated industries, knowledge spillovers, university and research institutions,
access to the pool of higher quality work force, etc.).13
We also investigate the impact of industry spillovers derived from sales to multinationals and large domestic
firms. The recent literature, including those on TCs, has emphasised the positive effects of knowledge spillovers
from MNEs on domestic firms (Greenaway et al., 2004; Kneller and Pisu, 2007; Sutton, 2007). Greenaway et al.
(2004) is the first study to empirically test export spillover effects from MNEs to domestic firms. Among the
channels of export spillovers they identify are two that might be facilitated by relationships arising from sales to
MNEs; namely: [a] information externalities – a transfer of knowledge and experience from MNEs operating in
the host market; and [b] demonstration and imitation effects – domestic firms acquiring new technologies and
management techniques used by MNEs. However, little attention, especially in the transition literature, has been
given to the spillovers from large domestic companies to SMEs and import-export transformation. With regards
to the connection between export behaviour and spillovers from large domestic companies, we rely on the same
reasoning as that used for sales to MNEs due to a number of theoretical and empirical considerations related to
12 Of course, as Syverson (2011) explains, spatial proximity is not a prerequisite for generating productivity spillover effects. According to him (p. 349), ‘producers are likely to attempt to emulate productivity leaders…regardless of whether they share a common input market’.13 We acknowledge that a dummy variable for location in a capital city cannot capture the full range and richness of agglomeration hypotheses. However, this variable does relate to the marked development of capital cities under transition. Unfortunately, the BEEPS dataset does not support more comprehensive proxies for agglomeration.
9

Export Behaviour of SMEs in TCs
large firms, domestic or foreign. First, there is overwhelming evidence that large firms are more export oriented
than small firms (see the discussion on firm size below); hence, any form of linkage between SMEs and large
firms is likely to produce information spillovers. Linked to the first, a second observation is that larger firms are
better resource endowed than SMEs, meaning that they are more likely to be at the frontier of technology
adoption and adaptation. As a result, there is a likelihood that SMEs will benefit from imitation and
demonstration effects also from large domestic firms.
In addition, the literature on international trade establishes the importance of imports for the development of
domestic firms and industries through a number of channels. One channel concerns the importance of imports for
firms’ capital formation. Firms benefit from imported technology, but also from the possibility that firms will make
simultaneous investment to assimilate this technology (see Aw et al., 2007). Second, imports are used as inputs in
export production processes (Arize, 2002). Accordingly, we integrate the import intensity factor as one of the
determinants of exports.
Hence, in the context of productivity spillovers, the hypothesis states:
Hypothesis 3: The propensity as well as the intensity of exporting of SMEs in transition countries are
positively affected by: (Hypothesis 3a) agglomeration induced externalities, and (Hypothesis 3b)
industry linkages, especially vertical linkages through input-markets.
In practice, it is difficult to identify the separate effects of externalities associated in large part with,
respectively, geographic proximity and vertical linkages; for example, both may be promoted by institutions
promoting workforce (re)training and/or knowledge creation and transfer. To capture as distinctly as possible –
given the available data - the influence of these two different types of externalities, we use different indicators
for the two types of externality. To capture spillover effects arising from industrial linkages, especially vertical
linkages through input markets in intermediate goods, we estimate the influence of sales to MNEs and large
domestic firms as well as of import intensity (Hypothesis 3b). Within the framework of our multivariate model,
the inclusion of these three variables should minimize the extent to which our capital city variable also captures
spillover effects arising from vertical links, thereby maximizing the extent to which the estimated capital city
effect captures agglomeration economies (Hypothesis 3a).
2.4 Other firm characteristics
Discussion on the firm size–export relationship has produced a number of hypotheses. First of all, the literature
mainly supports the export proficiency of larger firms relative to smaller firms on the grounds of resource
availability and lower transaction costs (Brock and Evans, 1989; Kim et al. 1997; Acs et al. 1997; Wakelin,
1998; Bleaney and Wakelin, 2002; etc.). However, a number of studies support the idea that smaller firms
perform better in export markets due to their inherent flexibility (Mills, 1984; Mills and Schumann, 1985; etc.).
Moreover, firm size as measured by the number of employees may be potentially endogenous. As a result, we
10

Export Behaviour of SMEs in TCs
use a lagged size variable, that is, the number of employees working for the company three years earlier.
Finally, the size variable may have non-linear effects on the degree of a firm’s export involvement. Accordingly,
we transform the model into a quadratic form, by including both the natural logarithm of the total number of
employees for each firm and its squared value.
Firms’ business experience influences their productivity level (learning-by-doing effects). Syverson (2011, p. 344)
argues that ‘experience allows producers to identify opportunities for process improvements’. The importance of
firm experience in export markets has been widely acknowledged. To test for the latter, we rely on Learning
Theory – rooted in the behavioural theory of the firm – which argues that development of knowledge may have an
impact on perceptions of opportunities offered by greater internationalisation (Clercq et al., 2005). In addition,
studies have identified a non-linear relationship between business experience and export growth, which we also
test. Everett and Watson (1998) argue that the rate of failure among younger firms is higher than among
experienced ones, due to the greater variability in their cost functions when they begin operations. Everett and
Watson (1998) concentrate on firms’ experience in the domestic market. However, this effect may be more
pronounced in foreign markets, where cost variability is likely to be higher to the extent that foreign markets are
unfamiliar and entrepreneurs face lack of information and different systems as well as different languages and
cultures. In a similar vein, Arnold and Hussinger (2005) argue that experience may be important for younger firms
but not for older ones. They argue that there is a certain threshold age, beyond which a firm is unlikely to gain
more experience. To test for this non-linear effect, we specify our models with both firm age and its squared value.
The Industrial Economics literature and the literature on transition economies have established the impact of
ownership structure on firm performance. Demsetz (1997, p. 429), for example, argues that wealth and its
distribution among different stakeholders matters to society’s productivity. In this paper, ownership structure
refers to the ‘type of dominant owner’ of a company. The BEEPS dataset allows us to identify the largest
shareholder of a company (thus the dominant shareholder) as a foreign entity, the state or a private (domestic)
individual or company. There is already a well-established literature on the importance of ownership structure for
firm performance in transition economies. There is almost complete unanimity in the transition literature that
dominant foreign ownership has a positive and significant impact on the performance of firms. Private (domestic)
ownership is expected to be the next, i.e., it is also expected to have a positive effect on the performance of firms.
Firms owned by the state are expected to be least well performing given the problems of state ownership and the
shortage of resources needed to restructure state owned companies. Yet the empirical work on the impact of private
ownership is rather mixed. Private ownership does not immediately improve the performance of privatised firms; it
takes time for the new owners to be able to engage in strategic restructuring and gradually improve the firm’s
performance. Private owners taking over in the course of privatization do not always find it easy to obtain the
necessary credit to finance strategic restructuring and invest in new technology. For a while, therefore, the
difference between firms with dominant private ownership and state ownership, particularly over a short period of
time, may not be significant.
Search and information costs take a central position in the transaction cost theory. For successful export activities,
primarily a systematic collection of information is required, since it can act as a catalyst to reduce the uncertainties of
11

Export Behaviour of SMEs in TCs
the international environment (Leonidou and Adams-Florou, 1999). Due to their resource constraints, SMEs appear to
be more dependent than large firms on services, information and contacts generated through business associations
(Bennett, 1998). Hence, we investigate the impact of membership in business associations on SME export behaviour.
Many country-level studies have demonstrated the importance of the development of financial markets for firms’
export activities (Beck, 2002 and 2003; Manova, 2006; etc.). SMEs have even greater need for credit relative to large
firms due to their limited capital resources. Moreover, SMEs face greater difficulties in obtaining external finance
(due to information asymmetries and/or institutional factors), which may be reflected in their overall performance,
including international activities (Beck et al. 2006 and 2008; Hutchinson and Xavier, 2006). Hence, we investigate the
export effect of the availability of external finance.
Two additional firm-related factors that we investigate are the level of capacity utilisation (facilities and
manpower) and market share. Conventionally, capacity utilisation is treated as a simple proxy for pressure of
demand. However, more recent literature suggests a more subtle supply-side interpretation. Drawing on Bansak
et al. (2007), capacity utilisation may reflect the possibility that new and relatively cheap technologies available to
firms allow them to hold excess capacities to respond to increases in demand. In other words, when there is a boost
in export demand then SMEs use their excess capacities to respond. They explain as follows (p.633): ‘…new
technologies may make it easier to ramp production up and down. Combined with falling prices of high-tech
equipment, this may encourage firms to install a broader margin of excess capacity – operating at lower average
utilization – to be able to handle upswings in demand.’ These alternative approaches imply different signs on the
estimated effect of capacity utilisation: a positive relationship with export activity in the case of the demand-side
interpretation; a negative one in the case of the supply-side interpretation; and an insignificant effect in the event
either that neither effect is present in the data or that both are and offset one another. The demand-side explanation
raises a further issue; namely, because greater exports may increase demand pressure and thus capacity
utilisation, there may be simultaneity and thus potential endogeneity. However, as with the technology
variables, the potential endogeneity of capacity utilisation is addressed by using the question on the level of
capacity utilisation that refers to a period before the current one to which export intensity refers.14 Second, we
assume that firms with a greater share of the domestic market would have an incentive to try to expand their
activity across borders to take advantage of additional demand in foreign markets. Accordingly, we anticipate
that the likelihood of exporting would be higher for firms that have a larger share of the domestic market.
Finally, we control for differences in the exporting behaviour of firms for each individual country and over time.
Regarding the former, we introduce country dummies to take into account that there are significant institutional,
cultural, and other differences among TCs. Moreover, the country dummies play an important role in our
estimation strategy by controlling for influences that otherwise would be difficult to address. 15 On the other
14 There are two questions on capacity utilisation in BEEPS: (1) In your judgement, what is your firm’s current output in comparison with the maximum output possible using its facilities/man power at the time? (2) What was the capacity utilisation 36 months ago? We use the second, backward-looking measure.15 Our firm-level investigation and modeling strategy is not the appropriate platform for estimating the effects of national-level influences on firms’ export behavior such as free-trade agreements, macroeconomic developments (including policy) and institutional influences. Even a minimal specification to this end would require country (country-group) dummies, period dummies, and country (country-group)-period dummies to model political developments such as regional free-trade associations (especially where such developments come into force during the period of the sample). However, observations on these variables are available only in small numbers (there are 25 countries in our panel samples) and would be collinear with one another by construction, thereby precluding estimation with any useful degree of precision.
12

Export Behaviour of SMEs in TCs
hand, the three rounds of the survey have taken place in three different periods with different external
environments, covering almost a decade of varying conditions affecting the export behaviour of firms across the
sample (such as rates of growth in the EU). Whether and how these changes were reflected in the firm’s export
propensity and intensity we aim to capture through period dummies.
3 Empirical strategy
3.1 Methodology
As the BEEPS database contains information on exporters and non-exporters, the dependent variable (y) –
percentage share of export sales in total sales – is zero in a significant number of cases (i.e. for non-exporters), and
the observations for exporters are roughly continuous over the positive range of values. This type of data is
addressed by the generalised tobit model (Wooldridge, 2006, p.587). In tobit estimation, zero-value observations
are incorporated into the model as the outcome of a decision-making process. In effect, tobit estimation models a
dual decision making process: in our case, firms’ decisions as to whether or not to export; and, if so, how much to
export. In this way, tobit estimation addresses the potential endogeneity of our independent variables that would
arise if the self-selection of firms into the export market were to be omitted from the model. This differs from two-
step models that estimate first the determinants of the decision as to whether to export or not and then, in a second-
stage regression, the determinants of firms’ exports conditional upon the probability of exporting at all. Which
approach is the more appropriate depends upon whether or not the two parts of firms’ export decisions have the
same or different determinants. The theory informing our empirical specification suggests that the same factors
affect both the firm’s propensity to export and, if it exports at all, the firm’s export intensity (see Section 2,
above). Moreover, diagnostic assessment of these alternatives – i.e. the same or different determinants – also
endorses the tobit model as a valid estimator for our data (reported below). Finally, an additional complication is
suggested by the dependent variable being defined as a proportion, therefore bounded by zero and one. However,
this should not be a problem in our samples, because few firms export all or even nearly all of their output.
Moreover, robustness checks using estimators capable of directly addressing this problem yield estimates fully
consistent with those reported below. 16
Instead, we attempt to control for such influences in order to address potential sources of omitted variables bias. Here, our strategy rests on the ability of the firm-level fixed (i.e. time invariant or constant) effects in our model (see Section 3.1 below) to capture the influence not only of time-invariant variables (such as geographical characteristics) but also of “slowly moving variables”. Here we follow Plümper and Troeger (2007, pp.126), who cite Beck (2001): “ … although we can estimate (…) with slowly changing independent variables, the fixed effect will soak up most of the explanatory power of these slowly changing variables.” This applies, in particular, to “politically relevant variables” such as trade agreements, macroeconomic policies and institutions. Even if such variables were not formally in force for the whole of the sample period, anticipated (leading), current and lagged effects – recognized, for example, in the literatures on trade agreements and macroeconomic policy – suggest that it is reasonable to think of their effects as sufficiently “slow-moving” over the sample period to be aggregated by time invariant effects at firm and/or country level. Accordingly, our panel estimates control for otherwise unmodelled systematic influences on the dependent variable at the firm level, which is the appropriate level for our investigation; in addition, country dummies control for any remaining systematic influences that vary between countries; and period dummies control for any remaining systematic influences that are common across all firms in the sample in a particular period. In the cross-section estimates, the country dummies control for otherwise unmodelled systematic influences on the dependent variable that occur in the period covered by the sample. 16 Maddala (1977, 162-63) and Wooldridge (2002, pp.518-19) discuss the use of tobit models to estimate models where the dependent variable is generated by, in effect, a dual decision making process: in our case, firms’ decisions as to whether or not to export and, if so, how much to export. The advantage of tobit estimation is that zero observations, which potentially yield useful information, are incorporated into the model as the outcome of a decision-making process. Moreover, truncation at one is unlikely to affect our estimates in a substantial manner: in our pooled sample, for example, only 1.35 percent of firms generate 100 percent of their sales from exports (four percent when the upper limit is set at 95 percent). Nonetheless, we implemented two robustness checks to address residual concerns on this issue. We replicated our preferred model
13

Export Behaviour of SMEs in TCs
The model for cross-section data has the following form:
)0(
exporters-nonfor 0exportersfor 0
2, σ~Nε
εβxy
i
iii
where i = 1, 2,…, N firms; xi is a 1(k+1) vector containing the k variables of interest discussed in Section 2 together
with an intercept term, and β is the corresponding (k+1)1 vector of coefficients to be estimated; and εi are
independently and individually distributed (iid) over the whole sample with mean zero and variance σ2. And, for panel
data:
)0(
)0(
exporters-nonfor 0 exportersfor 0
2
2
εit
ai
itiitit
, σ~Nε
, σ~Nα
εαβxy
where, in addition, t = 2002, 2005 and 2008/9; xit is a 1(k+1) vector containing the k variables of interest
together with an intercept term; the ai are time invariant (fixed) effects distributed iid over the firms with mean
zero and variance σ2a; and the εit are iid over the whole sample with variance σ2
ε.
Although a 2-year or 3-year panel sample may not be sufficient to identify any dynamics in the data, it is
sufficient to estimate a tobit model, which accounts for unobserved effects that are constant (fixed) over time
but vary between firms by means of the firm-specific error term i.17
Further, we follow Wooldridge (2002, pp. 521-524) who distinguishes between two types of marginal effects: the
‘conditional’ marginal effects, which account for changes in the expected (or predicted) value of exports (y) for the
subpopulation of firms for which exporting activity is observed (y>0); and the ’unconditional’ marginal effects that
account, in addition, for the effect of changing values of the independent variables on the probability that exporting
will take place at all (i.e., will change from zero to positive and, hence, be observed). For dummy variables, both
conditional and unconditional marginal effects are calculated as the discrete change in the expected value of the
dependent variable as the dummy variable changes from zero to one.
using our pooled sample: firstly, we implemented tobit estimation with censoring at both zero and one; secondly, we implemented the generalized linear model recommended by Baum (2008, p.301) for modelling ‘proportions data in which zeros and ones may appear as well as intermediate values’. In neither case were the estimates substantially different from those reported below. Finally, we note that in Tobin’s (1956) original presentation of what came to be known as the tobit model, his dependent variable is a proportion. For these reasons we disagree with Hobdari et al. (2009, p.12) who criticise the tobit estimation of export intensity because this variable is “bounded by definition”. In our view, this neglects the dual decision making process that informs the construction of the tobit estimator. 17 Random effects (RE) estimation is defined by the assumption that the independent variables are exogenous with respect to the group-specific (time invariant or fixed) effects. To minimize potential endogeneity of this kind, we specify a model in line with a wide range of theoretical influences in order to include in the estimated part of the model as many time-invariant determinants of firms’ export intensity as possible (Wooldridge, 2006, pp.481 and 493). However, we have stressed the limitations of theory, which suggests that we might not have captured all possible influences. Yet, many of our variables of interest are dummy variables; and these, according to investigation by Monte Carlo methods, may be estimated with correct coefficients and standard errors. Greene (2003a, p.26) finds that: ‘In spite of the high intercorrelation of the (group-specific) effects and the regressors, the dummy variable coefficient and its standard error are estimated essentially correctly ... Surprisingly, the marginal effect of the dummy variable is also well estimated ...’ Table 2 establishes that the panel model includes 17 dummy variables and 10 continuous variables. Moreover, the groups of variables of particular interest – human capital and innovation/technology – both contain dummy variables, so that analysis does not depend only on continuous variables. There are, of course, remaining doubts concerning the validity of RE estimation. For this reason, we do not rely only on panel analysis, but also report cross-section estimates for three individual waves as well as for a pooled dataset.
14

Export Behaviour of SMEs in TCs
3.2 The data18
The data used in this investigation are from BEEPS, an extensive survey targeting the business environment and
the performance of enterprises in TCs (see Appendix Table 5 for a two-way table showing the countries and
number of observations for each country in each round of the survey). We employ data for 2002 including 5,330
firms; 2005 with 5,385 firms; and 2008/9 with 7,247.19 As our study concentrates on the SME sector, we utilize
these datasets by estimating six specifications of the econometric model on five samples of SMEs: namely, three
for the individual years 2002, 2005 and 2008/9; a pooled dataset; a panel of companies surveyed in 2005 and
2008/09; and, a panel of companies surveyed in all three rounds.20,21 The definition of our variables and their
summary statistics are provided in Table 1 and in the Appendix, Table 6.22
Table 1 Description of variables used in the econometric specifications
Dependent variable Description
expint Export intensity – the share of total sales generated by exports (%)Independent variables Description
ftwor_edu Education of the workforce – the share of the workforce with some university or higher education (%)
training Dummy for firms which have conducted on-the-job-training
skilled The share of skilled workers (including also the managerial staff and other professionals) in a firm’s current total full-time workforce (%)
ceo_edu Dummy for firms whose general manager has superior education
org_str Dummy for firms which underwent changes in organisational structures
gross_inv Investment in new buildings, machinery and equipment. For 2002, the data refers to spending since 1998 as a share of the firm’s sales over the same period (%). For 2005, the data refers to spending in 2004 (in $1,000). For 2008/9, the variable is a dummy variable taking the value of 1 if the firm has spent any money on R&D in 2007.
inv_rd Investment in R&D by each firm (including wages and salaries of R&D personnel, materials, R&D related education and training costs). The reference year for this variable is the same as that for the variable ‘gross investment’ (the previous item). The variable is
18 Only a short description of the content of the BEEPS dataset is provided here. Various sample specific information – general and country specific - are provided in the reports accompanying the survey and datasets (see shttp://www.ebrd.com/pages/research/analysis/surveys/ beeps.shtml; accessed February, 2011). See also the EBRD 2005 Transition Report. 19 BEEPS was conducted also in 1999, but this survey is omitted from our analysis as nonconformities with later rounds are too great; many variables covered in the later rounds were not included in the 1999 round. 20 From the dataset we have dropped firms with over 250 employees (i.e. large firms). In addition, to preserve the randomness of the sample, we have dropped also the panel component of firms for 2005 and 2008/9 and the so-called ‘manufacturing overlay’ (a group of additional companies surveyed outside the normal sample stratification in several countries in order to increase the weight of their manufacturing sectors). The SME component for different countries ranges from 80 to 85 percent. 21 With regards to the panel sample, we employ only the “balanced panel component”, as imputing the unbalanced panel would mean violating the Missing Completely at Random assumption, crucial to the Multiple Imputation technique. 22 In addition to the usual descriptive statistics, we also examined the correlation matrix between our variables, paying particular attention to those related variables grouped together as “human capital”, “technology” or productivity-enhancing “spillover” variables. On conventional criteria (Taylor, 1990, p.37), only one correlation coefficient across all of our samples, and across all categories of interest, can be characterised as a “modest or moderate” correlation (i.e. between 0.36 and 0.67); otherwise, the largest correlations in each category are all “low or weak” (i.e. 0.35).
15

Export Behaviour of SMEs in TCs
continuous for 2002 and 2005 and a dummy for 2008/9 (as for the previous variable).
prli_tech Dummy for firms which introduced new products or upgraded existing products or introduced new technology over the last 36 months
tech Dummy for firms who consider that their technology is more advanced than that of their main competitors
location Dummy for firms located in the capital city
mne_sal The share of the company’s domestic sales to multinationals located in their country (%)
large_sal The share of the company’s domestic sales to large domestic firms (%)
impint Imported material inputs as a share of total material inputs (%)
size Number of full time employees at the firm three years earlier
age Business experience – years since establishment
entact For the panel sample, a dummy for companies operating in production activitiesFor cross-sectional samples the share of sales generated by production activities
foreign The percentage share of the firm’s assets owned by foreign shareholder(s)
soe For panel, the percentage share of the firm’s assets owned by the stateFor cross-sectional samples, a dummy for state owned companies (companies with over 50 percent of the firm’s assets belonging to the state)
credit Dummy for companies who have a credit line or a loan from a financial institution
bus_assoc Dummy for membership in business associations
mark_shar Dummy for companies with more than 5 percent of total domestic market sales
cap_util Capacity utilisation of facilities or manpower three years ago (%)
Country dummies
The reference category in each sample is the country with the lowest average export intensity.
Year dummies The reference category is 2008/9.
The summary statistics (Appendix, Table 5) show a fairly low involvement of SMEs in export activities; data
from the sample specifications show that only around 20 percent of SMEs in the TCs engage in export activities.
In addition, as expected, the calculations also show that export markets are not the domain of SMEs, with the
average share of export sales in total sales at around 7 percent. However, SMEs in TCs seem fairly well
endowed with human capital, in terms of the education of their workforce and the skills that they possess.
Moreover, sample companies have continuously invested in new infrastructure and technology. With regards to
the latter, over 65 per cent of companies in the pooled sample have introduced new product lines (as well as
upgrading old ones) and new technologies during the last decade.
Other firm specific data show that, on average, sample firms have just over 40 employees, and are overwhelmingly
privately (around 95 percent) and domestically owned (on average around 90 percent). Less than one third are
located in the capital city, generally engaging in trade and services. Data show that imports are a significant source
of inputs and other supplies, while large domestic firms are an important market for SMEs, more than are foreign
MNEs. Finally, over one third of sample companies are members of business associations.
3.3 Robustness checking - handling missing data16

Export Behaviour of SMEs in TCs
The proportion of missing data for most variables in the samples is fairly low (see Appendix, Table 6). 23
However, both the gross investment and spending on R&D variables have a high percentage of missing
responses. Given the prominence of these variables in our discussion (Section 2 above), we do not want to drop
them entirely from our estimated models: first, because their particular effects are of interest; and, second,
because we want to demonstrate that the estimates of our other variables of interest are not greatly affected by
the inclusion or omission of these two variables. Moreover, we argue that it is not an entirely satisfactory option
to drop observations with missing values of these variables. This is for two reasons. First, because we would
then be unable to utilize fully the data available for other variables. Secondly, because dropping observations
with missing values (“listwise deletion”) is justified only on the strong assumption that these values are ‘missing
completely at random’ (MCAR); otherwise, the consequence is again inefficient and biased coefficient estimates
(Schafer and Graham, 2002), arising from differences between the distribution of the missing observations and
the distribution of the observed items. We conclude that it is not satisfactory to drop either variables or
observations. Consequently, we imputed the missing values (the percentage of imputed values for each variable
corresponds to the percentage of missing values detailed in Appendix, Table 6). To this end, we applied multiple
imputation (MI) as the technique most favoured in the statistical literature on analysing survey data with missing
values.
Rubin (1987, p.2) defines MI as a ‘technique that replaces each missing or deficient value with two or more
acceptable values representing a distribution of possibilities’. The MI procedure first estimates an imputation
model on the observed data m times to create m complete datasets (i.e. datasets in which the observed data is
completed by the imputed values). To preserve the features of the joint distribution in the imputed values the
imputation model includes both factors known to be associated with missingness and factors that explain the
variation of the target variables (Schafer and Graham, 2002; Van Buuren et al., 1999). Then, each dataset is
analysed by an estimation method specified by the researcher. Finally, the results obtained from the m analyses -
one for each dataset - are combined to produce parameter estimates and standard errors that fully reflect
missing-data uncertainty. The particular feature of MI is that it allows for both within-imputation and between-
imputations dimensions of randomness - hence, errors - in estimating parameters, which are reflected in the
accompanying standard errors. This procedure yields valid estimates from imputed datasets of the standard
errors in addition to approximately unbiased estimates of all parameters. This is the most significant advantage
of the MI technique.24 Moreover, MI rests on the assumption that values are “missing at random” (MAR), which
is a weaker assumption than the MCAR assumption entailed by analysing a dataset with missing values.25
Accordingly, in all six datasets used for estimation – i.e., the two- and three-year panels, the pooled, and the
cross-section samples for 2008/9, 2005 and 2002 – all the missing values are imputed, regardless of the number
of missing values for individual variables. Consequently, the sample sizes have increased substantially in
23 The missing values in our case are treated as non-response items, resulting from two sources: first, the interviewee did not know the answer or refused to reply; and, second, the interviewer neglected to ask the question or did not record the answer. 24 Rubin (1987, p. 2) suggests m in a range of 2 to 10. However, Kenward and Carpenter (2007, p. 208) show that in some cases a larger m is required for reliable estimation and inference, especially in cases when the proportion of missing data is high. Because the percentage of missing data for some of our variables is relatively large, we apply m=20. For practical implementation of MI, we use the routines written for STATA (see Royston, 2005a, 2005b, 2007; and, Carlin et al., 2008). The syntax written to implement MI for this paper is available on request. 25 Although this assumption cannot be tested, Schafer and Graham (2002) show that small violations of MAR usually have only a minor impact on estimates and standard errors.
17

Export Behaviour of SMEs in TCs
relation to the non-imputed samples: the longitudinal datasets by 14 and140 percent, respectively; the pooled
dataset by 7 percent; and the 2008/9, 2005 and 2002 datasets by, respectively, 13.5 percent, 25 percent and 330
percent.26 This large increase in the size of the datasets is reflected in the results. Although the signs on the
estimated effects in the imputed and non-imputed samples are remarkably consistent, some estimates differ in
their statistical significance and in their magnitude. For survey datasets with the typical characteristics displayed
by BEEPS, we propose that results from imputed datasets should be taken to complement, rather than substitute
for, the results from non-imputed datasets. Accordingly, the results from MI serve as a robustness check of the
non-imputed results.
4 Results and discussion
We analyse a range of datasets and apply different specifications (reflecting nonconformities between the surveys).
The consistency of estimates across the different datasets, both imputed and non-imputed, and the correspondingly
different specifications suggests robustness of the reported results. The results are overwhelmingly consistent in
terms of the direction of the estimated effects. Moreover, most of the estimated coefficients are consistent across
different specifications in terms of statistical significance. There are slight differences in the magnitude of the
coefficients, albeit not worth dwelling upon as they do not imply any change in our conclusions.
Tables 2 and 3 report the unconditional marginal effects and their respective standard errors from estimating tobit
models on the six samples, in each case both non-imputed and imputed. We comment in detail only on the
unconditional marginal effects, because these refer to the whole population of firms (i.e. both potential exporters and
those that are exporting), and are therefore the effects most relevant for our discussion.27 To adopt a conservative
approach to inference, we report cluster-robust standard errors for the cross-section estimates (clustered on country).
For the panel estimates the standard maximum likelihood estimates are compared to bootstrap estimates, with no
noteworthy difference in the corresponding levels of statistical significance.28
26 When, for example, we write that imputation increases our “pooled dataset by seven percent”, we do not mean that we have imputed seven per cent of our entire dataset. Rather, by imputing a relatively few missing observations for many variables we retrieve relatively many observations. For example, if a variable has one missing value then we lose the corresponding observation, which may have complete data on, say, 19 other variables. By imputing the one missing value for one variable, we retrieve the observation and thus the observed data on the other 19 variables.27 The corresponding estimated conditional marginal effects are available on request.28 Because of limited space in the table, the bootstrapped standard errors (using 50 replications) are not reported; they are available on request.
18

Export Behaviour of SMEs in TCs
Table 2. Unconditional marginal effects: panel tobit estimation of the determinants of SME export behaviour in transition countries a), b)
Estimations for non-imputed samples Estimations for imputed samplesVARIABLES 3-year panel 2005 & 2008 panel 3-year panel 2005 & 2008 panel
HUMAN-RELATED FACTORS
Edu. of workforce (ftwor_edu)
0.043*** 0.064** 0.043*** 0.026(0.015) (0.027) (0.014) (0.016)
TECHNOLOGY-RELATED FACTORS
Gross investments (gros_inv)c)
- -2.560 - -0.332(3.143) (2.023)
Spending on R&D (inv_rd) c) - -1.049 - 1.494(1.666) (1.451)
New or upgraded product/new tech. (prli_tech)
1.336* 1.932 1.288** 2.000**(0.693) (1.391) (0.636) (0.878)
PRODUCTIVITY SPILLOVERS
Firm location (entres) 2.022* 4.135* 2.102* 3.112**(1.217) (2.327) (1.217) (1.555)
CONTROL VARIABLES
Lagged firm size (lnsize) d) 1.680*** 1.541** 1.702*** 2.098***(0.377) (0.662) (0.360) (0.494)
Firm activity (entact) c) 9.785*** 13.090*** 9.816*** 7.675***(2.198) (3.747) (2.204) (2.200)
Share of foreign capital (foreign)
0.030** 0.034 0.026** 0.045***(0.012) (0.023) (0.011) (0.015)
State controlled companies (soe)c)
-0.035 -0.000 -0.019 -0.014(0.026) (0.055) (0.021) (0.032)
Access to credit (credit) 0.451 2.648* 0.492 1.393(0.696) (1.519) (0.638) (0.944)
Year dummy for 2002 (year_2002)
0.262 - 0.803 -(0.691) (0.624)
Year dummy for 2005 (year_2005)
1.005 2.374 1.200* 0.488(0.661) (1.763) (0.634) (1.132)
Country dummies e) Yes Yes Yes Yes
Observations 856 272 975 650Number of panelid 325 208 325 325
Notes: a) Standard errors in parentheses. We report oim standard errors (i.e. derived from the observed information matrix). Levels of significance are indicated as follows: *** p<0.01, ** p<0.05, * p<0.1.b) The 2008-09 survey did not include a number of variables, which had been included in the previous rounds (e.g., training, skilled, org_str, ceo_edu, tech, mne_sal, large_sal, impint, bus_assoc, mark_share and cap_util). Hence, these variables are missing from the panel sample. In addition, we had to drop the age variable as the varying definitions were incompatible over the years.c) See Table 1 for the different definitions of this variable in different samples.d) Squared values for the size variable were included in the initial specification but then dropped) following F-tests of joint significance.e) The estimated conditional marginal effects for the country dummies are available on request.
19

Export Behaviour of SMEs in TCs
Table 3. Unconditional marginal effects: tobit estimation of the determinants of SME export behaviour in transition countries a)
Estimations for non-imputed samples Estimations for non-imputed samplesVARIABLES Pooled 2008/9 b) 2005 2002 Pooled 2008/9 b) 2005 2002
HUMAN-RELATED FACTORSEdu. of workforce (ftwor_edu) 0.052*** 0.037*** 0.034*** 0.062*** 0.051*** 0.034*** 0.038*** 0.030***
(0.007) (0.007) (0.007) (0.017) (0.007) (0.008) (0.008) (0.009)
Training (training) - - -0.072 -1.289 - - -0.076 -0.206(0.383) (1.090) (0.426) (0.525)
Skilled workforce (skilled) - - -0.002 0.026 - - 0.002 -0.004(0.006) (0.017) (0.007) (0.006)
Changes in org. structure (org_str) - - 0.228 1.526 - - 0.196 0.258(0.409) (1.151) (0.387) (0.317)
CEO education (ceo_edu) - - - -0.502 - - - 0.981**(1.283) (0.463)
TECHNOLOGY-RELATED FACTORS
Gross investments (gros_inv) c) - - - 0.024 - - - 0.075***(0.053) (0.027)
Spending on R&D (inv_rd) c) - - - 0.035 - - - 0.004(0.066) (0.035)
New or upgraded product/new tech. (prli_tech) 1.491*** 1.005** 0.850** 2.981*** 1.500*** 1.045** 0.991** 1.000**(0.277) (0.450) (0.425) (0.720) (0.290) (0.439) (0.434) (0.486)
Technology level relative to competition (tech) - - - 0.072 - - - 0.810*(1.079) (0.452)
PRODUCTIVITY SPILLOVERS
Firm location (entres) -0.082 -0.448 0.105 -0.169 0.033 -0.260 -0.239 0.046(0.317) (0.357) (0.419) (0.628) (0.308) (0.359) (0.480) (0.506)
Sales to MNEs (mne_sal) - - 0.075*** 0.080*** - - 0.087*** 0.090***
20

Export Behaviour of SMEs in TCs
(0.016) (0.022) (0.015) (0.015)
Sales to large firms (large_sal) - - 0.031*** 0.073*** - - 0.039*** 0.047***(0.006) (0.011) (0.007) (0.008)
Import intensity (impint) - - 0.019*** 0.028** - - 0.027*** 0.023***(0.007) (0.013) (0.007) (0.007)
CONTROL VARIABLES
Lagged firm size (lnsize) 2.131*** 1.260* 1.069** 3.071** 2.040*** 1.196* 1.413*** 1.776**(0.352) (0.652) (0.426) (1.199) (0.351) (0.632) (0.331) (0.739)
Lagged firm size squared (lnsizesq) d) -0.025 0.065 0.034 -0.118 -0.019 0.066 0.002 -0.031(0.055) (0.099) (0.066) (0.192) (0.053) (0.093) (0.054) (0.106)
Age of the firm (lnage) -0.262 -0.585*** 0.150 -0.643 -0.267 -0.608*** -0.068 -0.193(0.197) (0.227) (0.292) (0.624) (0.184) (0.232) (0.302) (0.245)
Firm activity (entact) c) 0.040*** 0.065*** 0.016*** 0.008 0.042*** 0.065*** 0.021*** 0.015**(0.004) (0.004) (0.004) (0.011) (0.004) (0.004) (0.004) (0.006)
Share of foreign capital (foreign) 0.066*** 0.044*** 0.035*** 0.055*** 0.065*** 0.045*** 0.046*** 0.048***(0.005) (0.005) (0.006) (0.013) (0.004) (0.005) (0.008) (0.006)
State controlled companies (soe) c) -0.839* 0.829 -0.331 0.222 -0.762 0.864 -0.532 0.036(0.500) (1.057) (0.535) (1.397) (0.474) (1.127) (0.579) (0.797)
Access to credit (credit) 1.871*** 1.506*** 0.907*** -1.313* 1.929*** 1.660*** 0.963*** 1.226***(0.234) (0.369) (0.333) (0.739) (0.220) (0.349) (0.344) (0.429)
Member. in business assoc. (bus_assoc) - - 2.038*** 1.367 - - 2.607*** 2.469***(0.760) (1.142) (0.810) (0.506)
Market share (mark_share) - - - 2.934** - - - 1.749***(1.250) (0.555)
Capacity utilization (cap_util) - - -0.010 -0.035** - - -0.012 -0.024***(0.009) (0.016) (0.009) (0.008)
Year dummy for 2002 (year_2002) 0.830 - - - 0.873* - - -(0.521) (0.473)
Year dummy for 2005 (year_2005) 0.703* - - - 0.655 - - -(0.422) (0.404)
21

Export Behaviour of SMEs in TCs
Country dummies e) Yes Yes Yes Yes Yes Yes Yes Yes
Observations 16,753 6,384 4,323 1,238 17,962 7,247 5,385 5,330Pseudo R-squared 0.0630 0.0904 0.0771 0.0733 0.0627 0.0890 0.0721 0.0764
Notes: a) In the cross-section samples, we report (in parentheses) cluster-robust standard errors to control for intra country correlations. Levels of significance are indicated as follows: *** p<0.01, ** p<0.05, * p<0.1.b) The 2008-09 survey did not include a number of variables, which had been included in the previous rounds (e.g., training, skilled, org_str, ceo_edu, tech, mne_sal, large_sal, impint, bus_assoc, mark_share and cap_util). Hence, these variables are missing from the 2008-09, pooled, and panel samples.c) See Table 1 for the different definitions of this variable in different samples.d) Squared values for size and age variables have been included (or dropped) following F-tests of joint significance.e) The estimated conditional marginal effects for the country dummies are available on request.
22

Export Behaviour of SMEs in TCs
To assess the validity of tobit estimation there is a diagnostic check suggested by Greene (2003b, p. 768) and
Wooldridge (2002, p. 534), which evaluates the appropriateness of the tobit model. As this check requires, we
find that the probit and tobit coefficient estimates are consistent after appropriate transformations.29,30 This
diagnostic check suggests that, for each of the six regressions on the non-imputed samples reported in Tables 2
and 3, the determinants are similar for both the propensity of firms to export in a particular period and the
intensity of exports by those firms that do export in a particular period. This finding is consistent with the theory
informing our empirical specification and has useful policy implications, which are developed in the conclusion
to this paper. Here, the import of these checks is to suggest that, in each case, the tobit models provide
consistent and unbiased estimates.
For ease of interpretation, Table 4 provides a summary of the outcomes for each econometric model estimated for
the TCs. To provide a robustness check, Table 4 also summarises the effects of MI, by providing information on
the results from the imputed datasets as well as highlighting differences with the estimates arising from the non-
imputed datasets. These results take the empirical analysis as far as is permitted by the available data, which is
restricted to cross-section samples together with the two- and three-year panels. Nonetheless, our results do
indicate the importance of various factors influencing the export behaviour of firms.
29 Greene and Wooldridge suggest that tobit estimates should be divided by the estimated standard error of the regression and then compared with the respective parameters of the probit model. If the tobit model is valid then the ratios should be close – they cannot be equal due to sampling error – to the corresponding coefficient estimates in the probit model; otherwise the tobit estimates might be unreliable. 30 The detailed comparisons of tobit and probit estimates are reported for the panel and pooled samples in the Appendix, Tables 7 and 8. For reasons of space, these comparisons are not reported for the other three samples, but are available on request. Henceforth, the same applies to all empirical results referred to but not reported in detail.
23

Export Behaviour of SMEs in TCs
Table 4. Summary of estimation results for SME export behaviour in TCs
Dependent variable: Export intensity – percentage of total sales generated by export sales
Variables Expected sign Outcomes (non-imputed samples) Outcomes (imputed samples)
Human capital resources: education of the workforce; on-the-job-training; skilled employees; education of CEO; changes in the organisational structure.
+ Coefficient on the education variable positive and highly statistically significant across samples.
Similar outcomes after MI, except for the 2-year panel. In addition, CEO education positive at the 5 percent level of significance.
Technology-related factors: investment-sales ratio; R&D intensity; introduced new or upgraded products or new technology; technology relative to competition
+ Introduction and upgrade of new products and technologies highly significant and positive, except in the 2-year panel.
Similar results after MI with regards to the introduction and upgrade of new products and technologies. Gross investment and variable describing the level of firm’s technology relative to their competitors significant for 2002.
Productivity spillovers + Location is insignificant throughout the cross-section samples. Conversely, the panel estimates show a significant and positive relationship. Industry linkages are positive for 2002 and 2005. The results indicate that the greatest effect is produced by interacting with MNEs.
Results similar to those from the non-imputed samples.
Firm size Positive with the possibility of a
quadratic relationship
No indication of a quadratic relationship. Natural logarithm of lagged firm size positive and highly significant for all the samples.
Results similar to those from the non-imputed samples.
Business experience Positive with the likelihood of a
quadratic relationship
Insignificant throughout, except for the 2008/9 sample.
Results similar to those from the non-imputed samples.
Sector of activity (firm activity) + Highly significant and positive, except in the 2002 estimates.
Highly significant and positive throughout.
24

Export Behaviour of SMEs in TCs
Foreign capital share + Highly significant and positive throughout, except for the 2-year panel.
Highly significant and positive throughout.
State ownership - Statistically insignificant, except for the pooled sample.
Statistically insignificant in all samples.
Access to external finance + Positive and significant, except for the 3-year panel.
Positive and significant, except for both panel samples.
Membership in business associations + Highly significant and positive for 2005, but insignificant for 2002.
Highly significant and positive for both 2002 and 2005.
Market share + Highly significant and positive for 2002. Results similar to those from the non-imputed samples.
The level of capacity utilisation +/- Statistically significant and negative for 2002; negative but insignificant for 2005.
Results similar to those from the non-imputed samples.
Time variations +/- Higher propensity and intensity of firms identified for 2005 relative to 2009 only in the pooled sample. No significant differences between 2002 and 2009.
Higher propensity and intensity identified for 2005 relative to 2009, in the pooled and in the 3-year panel samples. No significant differences between 2002 and 2009.
25

Export Behaviour of SMEs in TCs
First, the human capital measures affect positively firms’ export behaviour. The hypothesised positive
relationship between human resources and exporting – Hypothesis 1 - has been confirmed by the estimated
effects of the education of the workforce (ftwor_edu), which shows that the greater the percentage of employees
with higher education the higher the expected percentage share of exports in a firm’s sales. The unconditional
marginal effects for the samples indicate, ceteris paribus, that a one percent increase in the pool of employees
with higher education will increase the percentage share of exports in a firm’s turnover, within a range of
between 0.030 and 0.064 per cent. This indicates that better quality of human resources at the firm level may
produce lower unit costs and/or higher quality of production, enabling firms to trade higher quality products at
lower prices in international markets.
However, association between export behaviour and the other human related variables is weak at best. The
estimates of on-the-job training (training) are statistically insignificant. The explanation for this result can be
viewed from the resource based perspective. The literature on human resources supports the view that large
firms commit greater resources to training than do small firms (Bryan, 2006; Colombano and Krkoska, 2006;
etc.). Bryan (2006, p. 635) explains that ‘small firms are less likely to train employees than larger firms, because
they suffer higher labour turnover and higher failure rates, and they tend to have shallow hierarchies that limit
long-term career prospects’. Flexibility of SMEs with regards to organisational structure (org_str) has no
significant effect on export behaviour either. As we pointed out, the literature hails SMEs for their ability to
change and adapt, treating this as source of their competitiveness. Especially in the transition context, with many
countries with unstable business environments, we assumed that this factor would come into play. However, the
resulting insignificant coefficient should not be viewed as a complete story. The lack of data made it impossible
to investigate any other form of flexibility - such as price, product or technology - in relation to the export
behaviour of firms. Finally, education of the CEO (ceo_edu) produces a positive relationship with the export
behaviour of firms. In the imputed dataset for 2002, the coefficient is significant at the five per cent level. As
pointed out, the evidence on the education of managers and its impact on firms’ behaviour is scarce. Gottesman
and Morey (2006) believe that managers with higher educational attainment will be more adaptive and
innovative, and more likely to possess other characteristics that may improve firm’s export propensity and
intensity. Following the discussion of firm flexibility, we can argue that being adaptive and innovative is crucial
for a successful manager in the highly uncertain transition environment.
We argued that the accumulation of technology (through investments in capital goods and innovation) will
lower costs, enhance the quality characteristics of products and determine the emergence of new products. These
are routes for increasing firms’ productivity and, thereby, increasing competitiveness in the market. The
hypothesised positive relationship between technological and innovation capabilities and exporting – Hypothesis
2 - has been confirmed by the consistently positive and significant coefficients on the dummy variable capturing
whether or not the firm has “established new, upgraded a product line or introduced a new technology” in the
recent past (prli_tech). The estimated unconditional marginal effect ranges from around one to three, meaning
that firms reporting recent product or process innovation export up to three per cent more of their output than
firms that do not. The other three technology related variables, namely, the investment-sales ratio (gross_inv);
R&D intensity (inv_rd); and the assessment of the firm’s technology relative to its competitors (tech) generally
yield insignificant results, especially the R&D intensity variable. Gross investments and firm’s technology
26

Export Behaviour of SMEs in TCs
relative to its competitors appear significant for the imputed 2002 sample. For the 2002 sample, gross
investment is reported as percentage of average annual sales in a previous period: hence, the statistically
significant estimated coefficient for gross investment in the imputed sample means that a one percentage point
increase in the share of gross investment in sales leads to an increase in the export share in sales of 0.075 of a
percentage point. With regards to the firm’s assessment of its technology level, a discrete change from 0 to 1 –
signifying better technology relative to firm’s competitors - increases the export share in total sales by up to 0.8
of the percentage point.
Among the variables included to capture productivity-enhancing spillover effects, we find a suggestive contrast
between the capital city effect (entres) estimated from those samples in which the three variables measuring
industry - especially vertical - linkages (sales to MNEs - mne_sal, sales to domestic large firms - large_sal, and
import intensity – impint) are absent and the capital city effect estimated from those samples in which the
vertical linkages effects are present:
two of the samples in which the industry (vertical) linkages variables are absent (the three- and two
year panel samples) yield a statistically significant capital city effect; yet
both samples in which the industry (vertical) linkages variables are present (the 2002 and 2005
samples) yield insignificant capital city effects.
This contrast suggests that when the capital city indicator is the only variable able to capture productivity
externalities, whether arising from agglomeration or industry (vertical) linkages, then it may capture all such
effects. This is informative about such effects in general but cannot tell us anything about the origins of such
effects. However, the 2002 and 2005 samples, which contain both the capital city effect and the three variables
measuring industry (vertical) linkage effects, yield highly significant linkage effects of the anticipated sign but
utterly insignificant capital city effects. Together, these results are consistent with Hypothesis 3b (that industry,
- especially vertical - linkages positively influence export behavior in TCs) but tend to refute Hypothesis 3a (that
agglomeration effects associated with capital cities positively influence export behavior in TCs).
On this interpretation, no capital city effect on the exporting of SMEs in TCs has been identified (location),
although one would anticipate such a relationship from the prominence given to informal networks and
communication in studies of firms’ performance in TCs as productivity-enhancing mechanisms (see Smallbone
and Welter, 2001). In contrast, statistically significant results are found for the effects of sales to MNEs (mne_sal)
and large domestic companies (large_sal) as well as import intensity (impint). These mirror the productivity
spillovers derived from industry linkages. With regards to the interactions with MNEs and large domestic companies,
our findings are in line with the outcomes in Konings (2001), Yudaeva et al. (2003), Javorcik, (2004) and
Gorodnicenko et al. (2010), among others, linking knowledge transfers from MNEs to domestic firms. The
unconditional marginal effects for non-imputed samples in 2002 and 2005 indicate, ceteris paribus, that a one
percent increase in the share of sales to multinationals will increase the percentage share of exports in a firm’s
turnover by 0.075 and 0.080 per cent, respectively. A novelty of our investigation is the indication that that the
same effect is produced by interaction with large domestic firms. Here too, the unconditional marginal effects for non-
imputed samples indicate, ceteris paribus, a one percent increase in firms’ sales to large domestic companies will
increase the percentage share of exports in total sales by 0.031 and 0.073 percent, respectively. It is logical to
assume that within industries there is no single source of spillovers, but rather all gain from interactions with each
27

Export Behaviour of SMEs in TCs
other. With regards to the final industry-linkage variable, the higher the share of imported inputs, all things being
equal, the greater the propensity to engage in exporting as well as to export more. Damijan et al. (2004) argue that
firms can exhibit significant productivity gains especially from serving advanced markets. Following this logic, we
believe that not only exporting to advanced countries but also importing (or any other form of international
interactions) will induce productivity increases in SMEs in TCs. This is what the import intensity variable (impint)
indicates in our case; a one percent increase in the share of imported material input relative to the total leads to an
increase in the percentage share of exports in total sales by 0.019 and 0.028 percent, respectively. In this context,
we should point out the reorientation of the international trade of TCs towards developed countries after the
breakdown of socialism; this pattern still persists, with the European Union being the main trading partner for the
majority of TCs.
The other firm specific variables included in our specifications are in line with what SME literature generally
predicts, including empirical investigations for TCs. With regards to the controlling variables, as the
unconditional marginal effects show, size (size) is an important factor in the exporting behaviour of SME sector
in TCs. This result is consistent with other studies pointing out the significance of size in foreign markets. The
results indicate that as firms grow in size there is a higher propensity for non-exporters to export as well as for
exporters to export more. However, the size variable does not reveal non-linear effects on the degree of export
involvement. In addition, the estimated coefficient on the age variable is generally statistically insignificant,
indicating no obvious role of experience in firms’ export behaviour (age).
As far as the ownership variables (foreign vs. domestic owned and state vs. private owned) are concerned, the results
are generally as expected. The effect of foreign ownership on the export behaviour of SMEs is positive and consistent
across the various datasets (foreign). The unconditional marginal effects estimated across the various samples indicate
that a one per cent increase in the foreign ownership of SMEs increases the percentage of export sales in total sales by
between 0.03 and 0.07 per cent (rounded).31 Our results confirm what has been already found in many studies
regarding TCs that highlight the superior performance of foreign firms vis-à-vis domestic firms on the grounds of the
productivity gap between these two categories of firms.32 Although it was expected that state ownership would have a
negative and significant effect on firm performance in general, and on export behaviour in particular, the empirical
evidence is rather weak. The results for state owned companies (soe) indicate statistically insignificant effects on
export behaviour throughout the samples, except for the pooled estimates which is negative and statistically
significant at 10 percent. This is consistent with some of the earlier studies of the impact of privatisation, which also
failed to show the negative relationship between state ownership and firms’ performance (see Bevan et al., 1999).
Furthermore, this result can be explained by the fact that the sample contained only a small number of state owned
firms (ranging from a maximum of 10.73 percent in 2002 to 1.41 percent in 2008/9), and that a large number of firms
(almost 20 per cent of the total in 2008/9 sample), were privatised in the 2002-2008 period, and therefore did not have
31 In an attempt to find out whether majority foreign ownership has a different effect from any foreign ownership, the model was respecified using a dummy variable for majority foreign ownership, taking a value of one for companies with 50+1 percent foreign capital and zero otherwise. The models in Table 2 were then reestimated. The results were similar to those reported in Table 2, where foreign ownership is measured by a continuous variable. (These additional results are available on request.)32 See for instance Yudaeva et al. (2003) in the case of Russia; Konings (2001) for Bulgaria, Poland and Romania; and Djankov and Hoekman (2000) for the Czech Republic.
28
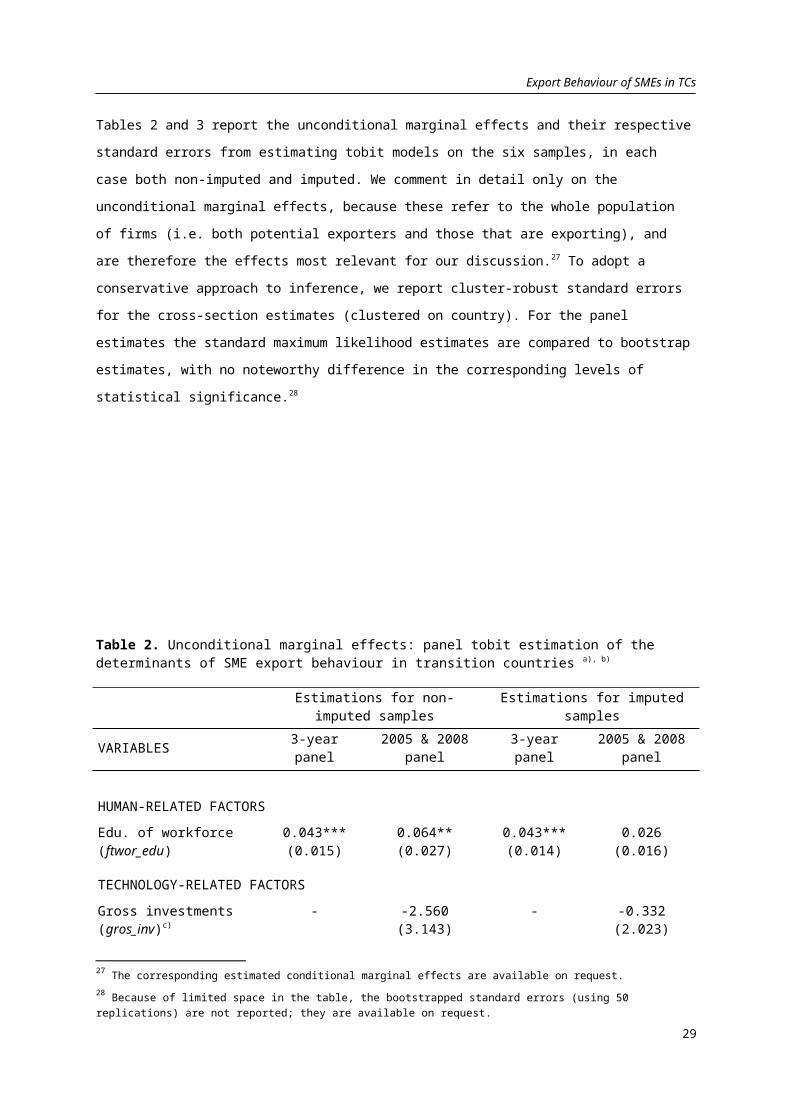
Export Behaviour of SMEs in TCs
enough time to adjust to market based conditions.
The sector of activity variable (entact) indicates, ceteris paribus, that companies involved in production activities
engage more in exporting relative to trade and service companies (the result appears in all samples, apart from the
imputed 2002 sample). The difference in the magnitude of the marginal effect for the panel samples relative to
other samples is a product of the difference in the definition of the variable. For the panel sample, a discrete change
from 0 to 1 – signifying production activities in relation to other activities - increases the export share in total sales
by up to 13 per cent. For other samples, a one percent increase in the share of production in total sales increases the
export share in total sales in a range from 0.015 to 0.065 per cent. Although the service sector is rapidly gaining in
importance in many emerging markets (Kandilov and Grennes, 2010), it seems that production activities of the
SME sector in TCs have an edge compared to service activities when it comes to exporting.
Other important outcomes of our estimations relate to access to external finance, market share, membership in
business organisations, and capacity utilisation. Our results demonstrate that access to finance (credit) is indeed an
important factor that enhances an SME’s competitive edge. The results overwhelmingly confirm the positive
relationship between availability of finance and export behaviour. In addition, in line with other studies on TCs
(see Hobdari et al., 2009), the estimated effect of market share (mark_shar) indicates that SMEs with greater share
of domestic market tend to take advantage of greater demand in foreign markets. Furthermore, the results are
consistent with the suggestion that business associations (buss_assoc) are an invaluable source of export
information for SMEs in TCs and provide a route for SMEs to engage in international business networks. Finally,
the results for capacity utilisation are generally too weak to be conclusive. However, the estimates for the 2002
sample – imputed and non-imputed – yield a negative rather than a positive relationship with exporting, which is in
line with a supply-side rather than the conventional demand-side interpretation. Should this supply-side
interpretation be supported by future studies, then researchers may need to reconsider the routine use of capacity
utilisation as a simple proxy for demand pressure. For, in this case, capacity utilisation may reflect a more subtle
supply side strategy, whereby firms carry excess capacity in order to increase their flexibility to respond to the
uncertain opportunities of export markets.
Two final groups of variables attempt to identify country and period disparities in the export behaviour of firms in
TCs. In the cross-section tobit estimates, the country dummies are generally significant (of the 201 estimated
country fixed effects, only three are not highly significant). This is consistent with our assumption that the former
communist legacy, the pace of reforms, institutions, culture, and varying macroeconomic conditions may have had
an impact on the export behaviour of firms. In contrast, in the panel estimates, of the 87 estimated country fixed
effects only two are significant. Together, these results suggest that the firm-level time invariant (fixed) effects
in our panel models and the country fixed effects in our cross-section models play a similar role with respect to
controlling for otherwise unmodelled systematic influences on the dependent variable. In addition, the year
dummies control for otherwise unobserved period-specific but group-invariant influences. We see higher export
intensity and propensity of firms surveyed in 2005 than in 2008/9 (no significant difference is found for 2002). We
should note that TCs have suffered greatly during the 2008/9 financial crisis, especially primary commodity
29
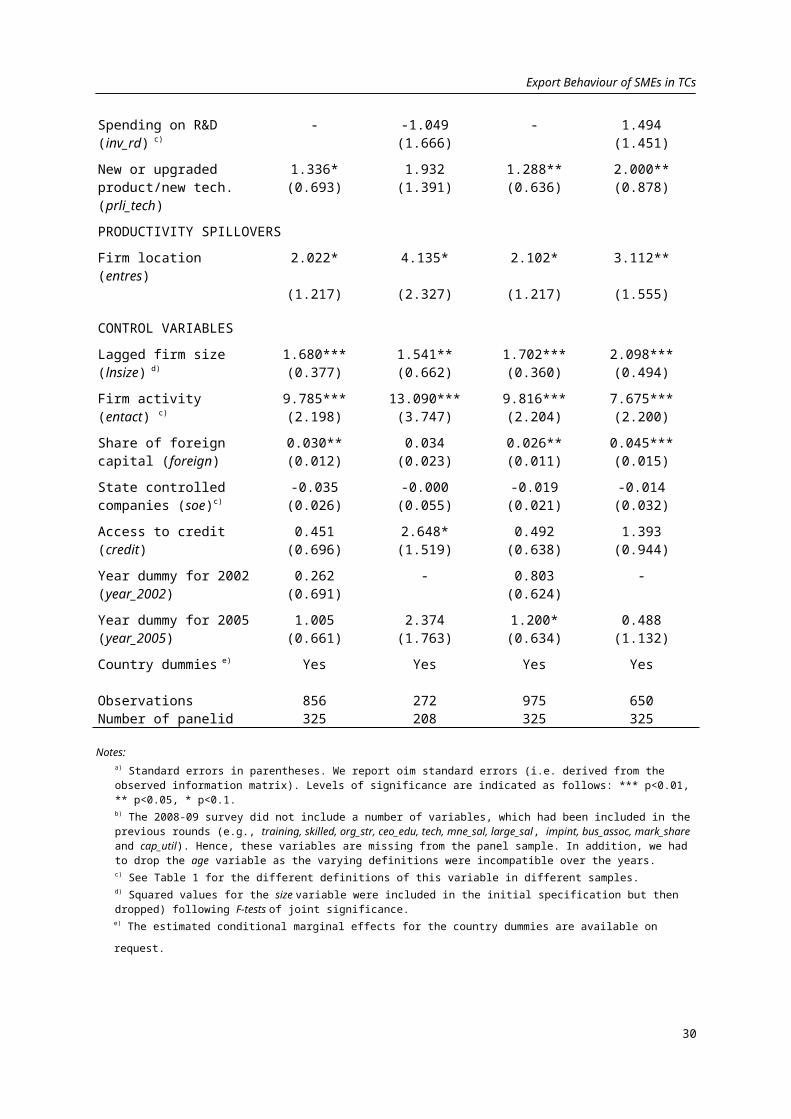
Export Behaviour of SMEs in TCs
producing countries in the CIS. In addition, highly financially integrated countries in CEB and SEE also felt
heavily the brunt of the crisis. Hence, the results for the period variables partially confirm these claims.33
5 Conclusions
This paper investigates the determinants of the export behaviour of SMEs in transition countries (TCs), using
cross-sectional and panel SME samples from the World Bank/EBRD Business Environment and Enterprise
Performance Survey (BEEPS) carried out in 2002, 2005, and 2008/9. We were concerned, in particular, with the
impact of human capital and technology related factors, as productivity-enhancing factors, on the export
behaviour of firms. In the same light we investigated two potential channels of productivity-enhancing spillovers:
namely, beneficial externalities arising, respectively, from location in the capital city and from industry – especially
vertical - linkages. We also investigated the effects of firm-size, experience-related factors, location, type of
ownership, sector of activity, financial constraints, and membership in business associations. Tobit models were
employed to analyse the relationship between firms’ export behaviour (measured by the share of total sales
generated by exports) and these potential factors. This econometric approach enabled us to differentiate between
exporters and non-exporters, while including both in our investigation. Hence, we have analysed firms’ export
behaviour by taking into account the likelihood that firms will export at all as well as the level of export activity.
A recent strand of international trade literature argues that firm’s export entry and exit decisions are determined
by the interplay of firm-level variation in productivity and sunk costs. We draw largely on Melitz’s dynamic
model of export participation for the core of our empirical model. We augment this with a number of additional
strands of thought, which either substantiate or complement Melitz’s approach, to specify our empirical model of
the export behaviour of SMEs in TCs. Although confined to broadly supply-side factors, the scope of our model
specification – the large number of factors included – contributes to a greater understanding of SME behaviour
in international markets.
Missing values are endemic to survey analysis, and thus a common problem in empirical SME research. Missing
values entail the possibility of sample bias induced by non-random “missingness”. Accordingly, we re-estimated each
model on samples completed by imputed values. We propose this is a robustness check on our estimates in addition to
estimating variant model specifications on six different samples (two- and three-year panels, and the three waves
individually and pooled). The following results are robust in that they appear not only with the same sign but also
with similar size and statistical significance across the majority of estimates – i.e. over variant model
specifications estimated on different samples using both non-imputed and imputed datasets.
Under the ceteris paribus condition, we find that both human capital and technology-related factors are
important sources of international competitiveness for small firms in TCs. Companies with a larger share of
educated workers have higher export propensity and intensity. Similarly positive effects are identified for the
introduction or upgrading of products and technologies (i.e. product and process innovation). Three variables
included in the analysis indicate the importance of industry – especially vertical - linkages for the export
33 For a detailed discussion of the effects of financial crisis in TCs see EBRD Transition Report (2009). A collection of papers in Bartlett and Monastiriotis (2010) concentrate on the effects of the crisis on SEE countries.
30

Export Behaviour of SMEs in TCs
behaviour of SMEs: sales to multinationals; sales to large domestic companies; and import intensity. Moreover,
we find the following positive influences on the propensity and intensity of SMEs to export: firm size; foreign
capital share; sector of activity (i.e. production); the availability of external finance; and, membership in a
business association.
The policy implications are three-fold: export promotion may best be targeted at potential rather than existing
exporters; the same policies may both encourage potential exporters to export and existing exporters to export
more; and a wide-range of complementary supply-side measures are necessary to make a substantial impact on
firms’ export behaviour.
Following Melitz, the premise of our discussion is that high-productivity firms self-select into export markets.
The implication is that policy makers should target potential exporters rather than actual exporters as, by
definition, the latter do not require policy intervention to enter foreign markets. As López (2004, 2005) argues,
notably in the context of developing countries, firms ‘consciously’ increase their productivity levels in order to
serve export markets. In other words, firms make productivity-enhancing investments with the aim of
penetrating foreign markets. Policy makers can support this process by developing appropriate policy
instruments to facilitate productivity enhancement: in particular, support for innovation; technology
improvement; R&D spending; and development of human capital. As Greenaway and Kneller (2007, p. 157)
explain, intervention may ‘stimulate more conscious self-selection and deliver a productivity boost’.
It has already been mentioned that the probit estimations (conducted as a diagnostic check) show the factors that
influence the firms' propensity to export. A comparision of the probit and tobit estimates indicate that the same
set of variables influence – with the same sign – both decisions as to whether or not to export (propensity) and, if
so, how much to export (intensity). These results suggest that the same policies can increase both the probability
that potential exporters will decide to export and the export efforts of existing exporters. In other words, policy
prescriptions can be focused on the same areas for both potential exporters and actual exporters.
The results presented in this paper show that the marginal effects are generally rather small. This suggests that
no single policy can transform the export activity of SMEs. Rather, a wide range of well-designed and
consistently implemented policies will be required to boost SME exporting and, indeed, to promote the sector
more generally. According to this study, such policies could usefully embrace: education; support for SME
investment in technology and R&D; foreign participation in SME ownership; support for integration into the
supply chains of larger firms, especially MNEs; measures to increase banking sector competitiveness, which
improve the availability of finance for SMEs; and measures to promote membership of business associations
(and, perhaps, by implication, SME networking in general).
31

Export Behaviour of SMEs in TCs
Appendix
Table 5. Number of observations for each country in the each year of survey
2002 2005 2008/9
CountryTota
l %Tota
l %Tota
l %Albania 155 2.91 132 2.45 140 1.93Armenia 148 2.78 139 2.58 202 2.79Azerbaijan 144 2.70 120 2.23 235 3.24Belarus 216 4.05 255 4.74 165 2.28Bosnia and Herzegovina 154 2.89 142 2.64 268 3.70Bulgaria 217 4.07 193 3.58 154 2.13Croatia 158 2.96 148 2.75 95 1.31Czech Republic 229 4.30 285 5.29 197 2.72Estonia 147 2.76 135 2.51 183 2.53FYROM 146 2.74 152 2.82 224 3.09Georgia 157 2.95 130 2.41 271 3.74Hungary 208 3.90 229 4.25 196 2.70Kazakhstan 214 4.02 220 4.09 389 5.37Kosovo - - - - 263 3.63Kyrgyzstan 156 2.93 143 2.66 151 2.08Latvia 151 2.83 139 2.58 173 2.39Lithuania 175 3.28 140 2.60 190 2.62Moldova 154 2.89 155 2.88 191 2.64Mongolia - - - - 324 4.47Montenegro - - - - 102 1.41Poland 441 8.27 460 8.54 323 4.46Romania 222 4.17 229 4.25 388 5.35Russia 444 8.33 497 9.23 712 9.82Serbia and Montenegro - - 226 4.20 - -Serbia - - - - 235 3.24Slovakia 144 2.70 171 3.18 198 2.73Slovenia 170 3.19 127 2.36 180 2.48Tajikistan 151 2.83 159 2.95 257 3.55Ukraine 399 7.49 412 7.65 606 8.36Uzbekistan 226 4.24 247 4.59 235 3.24Yugoslavia 204 3.83 - - - -Total 5300 100.00 5385 100.00 7247 100.00
32

Export Behaviour of SMEs in TCs
Table 6. Summary statistics for the variables used in the econometric specifications a)
Variable DatasetsFractions
Mean Std. dev. Min Max% of
missing data1 0
expint 3-year average - - 7.13 20.61 0 100 0.30ftwor_edu 3-year average - - 29.64 29.83 0 100 2.17training 2-year average 42.55 57.46 - - - - 6.25skilled 2-year average - - 45.65 31.79 0 100 1.35org_str 2-year average 45.11 54.90 - - - - 0.80ceo_edu 2002 68.04 31.96 - - - - 0.60gross_inv 2002 - - 7.73 7.04 0 99 34.40inv_rd 2002 - - 5.38 18.16 0 80 63.60prli_tech 3-year average 66.83 33.17 - - - - 0.20tech 2002 85.35 14.65 - - - - 6.80location 3-year average 30.26 69.74 - - - - 0.00impint 2-year average - - 30.95 38.82 0 100 4.70mne_sal 2-year average - - 3.59 13.09 0 100 3.25large_sal 2-year average - - 12.94 24.38 0 100 3.25lnsize 3-year average - - 2.83 1.33 0 6.82 3.57lnage 3-year average - - 2.32 0.69 0.82 5.23 0.53entact Panel 25.23 74.77 - - - - 0.00
3-year average - - 34.61 44.69 0 100 0.30foreign 3-year average - - 8.78 25.74 0 100 0.33soe Panel - - 3.43 16.15 0 100 3.00
3-year average 6.44 93.56 - - - - 0.33credit 3-year average 41.08 58.92 - - - - 0.40bus_assoc 2-year average 34.57 65.44 - - - - 0.00mark_shar 2002 28.96 71.04 - - - - 2.90cap_util 2-year average - - 79.50 21.17 3 100 3.15year_2008/9 2-year average 36.84 63.16 - - - - 0.00year_2005 2-year average 31.66 68.35 - - - - 0.00year_2002 2-year average 31.50 68.50 - - - - 0.00
Note:a) For details on the country dummies see Appendix, Table 4.
33

Export Behaviour of SMEs in TCs
Table 7. Diagnostic check:
comparison between the
transformed tobit coefficients and
the corresponding probit
coefficients in the 3-year panel
sample
Note: Asterisks correspond to the following levels of significance *** p<0.01, ** p<0.05, * p<0.1
VariablesPanel non-imputed sample Panel imputed sample
Tobit estimates j/ Probit estimates Tobit estimates j/ Probit estimates
ftwor_edu 0.294*** 0.010 0.011*** 0.242*** 0.009 0.007**prli_tech 9.621* 0.330 0.415** 11.331*** 0.407 0.474***entres 12.572** 0.431 0.294 12.092* 0.435 0.311lag_lnsize 11.583*** 0.397 0.358*** 10.347*** 0.372 0.333***entact 45.048*** 1.544 1.406*** 40.954*** 1.472 1.280***foreign 0.207** 0.007 0.011*** 0.197** 0.007 0.011***soe -0.242 -0.008 -0.006 -0.162 -0.006 -0.004credit 3.087 0.106 0.177 8.831 0.317 0.418**d_2002 1.781 0.061 0.047 5.900 0.212 0.188d_2005 6.719 0.230 0.243 7.828* 0.281 0.311*alb 37.093 1.272 1.180 -24.670 -0.887 -0.897arm -3.598 -0.123 -0.513 0.621 0.022 -0.249aze -20.650 -0.708 -0.754 -2.093 -0.075 -0.278bel 40.900 1.402 1.005 -22.548 -0.810 -1.038bul 46.015 1.578 1.164 1.382 0.050 -0.300cro 37.827 1.297 1.198 -5.995 -0.215 -0.482czech 67.120 2.301 2.263** -5.390 -0.194 -0.361est 37.735 1.294 0.979 -11.951 -0.429 -0.620geo 25.461 0.873 0.326 3.341 0.120 -0.213hun 1.424 0.049 0.146 -12.381 -0.445 -0.613kaz 7.828 0.268 0.115 -54.433 -1.956 -1.711kyr 2.831 0.097 -0.107 -13.408 -0.482 -0.538lat 36.382 1.247 1.527* -13.705 -0.493 -0.615lith 32.790 1.124 0.910 -0.399 -0.014 -0.206mac 48.307 1.656 1.354* 8.692 0.312 -0.210pol 47.841 1.640 1.774** -16.063 -0.577 -0.276rus 56.941 1.952 1.967** -6.583 -0.237 -0.657ser 51.186 1.755 2.041** -14.290 -0.514 -0.244slk 60.177 2.063 1.564 -8.016 -0.288 0.007slo 71.997 2.468 2.361*** 5.353 0.192 -0.379taj -7.601 -0.261 -0.230 -4.589 -0.165 -0.595ukr 35.285 1.210 0.870 -10.676 -0.384 -0.909uzb -6.797 -0.233 -0.240 -20.333 -0.731 -1.004mol 37.264 1.278 1.028 -23.052 -0.828 -0.654Constant -143.273 -4.912 -4.510 -104.480 -3.755 -3.317Overall variance 27.826 / / 27.826 / /
34

Export Behaviour of SMEs in TCs
Table 8. Diagnostic check: comparison between the transformed tobit coefficients and the corresponding probit coefficients in the pooled sample
Pooled non-imputed sample Pooled imputed sample
Variables Tobit estimates j/ Probit estimates Tobit estimates j/ Probit estimates
ftwor_edu 0.363*** 0.006 0.007*** 0.358*** 0.006 0.007***prli_tech 10.877*** 0.180 0.239*** 10.994*** 0.181 0.255***entres -0.570 -0.009 0.045 0.228 0.004 0.059lag_lnsize 14.801*** 0.245 0.244*** 14.232*** 0.235 0.235***lag_lnsizesq -0.174 -0.003 -0.001 -0.129 -0.002 0.000lnage -1.817 -0.030 0.009 -1.860 -0.031 0.010entact 0.280*** 0.005 0.005*** 0.293*** 0.005 0.005***foreign 0.458*** 0.008 0.007*** 0.452*** 0.007 0.007***soe -6.265 -0.104 -0.117* -5.675 -0.094 -0.107*credit 12.598*** 0.209 0.252*** 13.037*** 0.215 0.260***d_2002 5.599 0.093 0.151** 5.899* 0.097 0.145***d_2005 4.769* 0.079 0.100** 4.466* 0.074 0.102***alb 64.664*** 1.072 0.980*** 64.165*** 1.059 0.967**arm 32.898*** 0.545 0.443*** 34.923*** 0.576 0.482***aze 15.742*** 0.261 0.179*** 12.933*** 0.213 0.142***bel 49.103*** 0.814 0.768*** 49.209*** 0.812 0.779***bul 55.031*** 0.912 0.858*** 57.318*** 0.946 0.900***bih 64.362*** 1.067 1.101*** 63.699*** 1.051 1.080***cro 68.714*** 1.139 1.267*** 68.306*** 1.127 1.196***czech 71.086*** 1.178 1.294*** 70.718*** 1.167 1.275***est 67.132*** 1.113 1.127*** 66.905*** 1.104 1.135***geo 28.409*** 0.471 0.376*** 29.584*** 0.488 0.377***hun 60.656*** 1.005 1.082*** 60.926*** 1.006 1.082***kos 45.340*** 0.751 0.768*** 45.540*** 0.752 0.786***kyr 18.853*** 0.312 0.254*** 18.847*** 0.311 0.239***lat 61.724*** 1.023 1.022*** 62.956*** 1.039 1.037***lith 64.632*** 1.071 1.085*** 65.805*** 1.086 1.110***mac 74.304*** 1.232 1.195*** 73.991*** 1.221 1.198***mol 53.332*** 0.884 0.800*** 52.790*** 0.871 0.797***mon 17.749*** 0.294 0.140*** 17.263*** 0.285 0.137***pol 52.589*** 0.872 0.908*** 52.938*** 0.874 0.925***rom 40.904*** 0.678 0.614*** 40.800*** 0.673 0.594***rus 13.729*** 0.228 0.249*** 14.733*** 0.243 0.256***slk 74.343*** 1.232 1.346*** 73.102*** 1.207 1.311***slo 96.482*** 1.599 1.778*** 97.347*** 1.607 1.802***taj 20.929*** 0.347 0.265*** 21.883*** 0.361 0.278***ukr 30.318*** 0.503 0.480*** 30.949*** 0.511 0.486***uzb 19.217*** 0.319 0.299*** 19.729*** 0.326 0.263***
35

Export Behaviour of SMEs in TCs
References
Acs, Z. J., Morck, R., Shaver, J. M. and Yeung, B. (1997), The Internationalisation of Small and Medium – Sized Enterprises: A Policy Perspective, Small Business Economics 9: 7 – 20.
Arize, A. C. (2002), Imports and Exports in 50 Countries – Test of Cointegration and Structural Breaks. International Review of Economics and Finance 11:101-115.
Audretsch, D. B. and Stephan, P. (1999), How and Why does Knowledge Spill-over in Biotechnology. In Audretsch, D. B. and Thurik, R. A. (eds.), Innovation, Industry Evolution, and Employment, Cambridge: Cambridge University Press.
Arnold, J. M. and Hussinger, K. (2005), Export Behaviour and Firm Productivity in German Manufacturing, Review of World Economics 141(2): 219-243
Aw, B. Y., Roberts, M. J. and Winston, T. (2007), The Complementary Role of Exports and R&D Investments as Sources of Productivity Growth, The World Economy 14(1): 83-104.
Aw, B. Y., Roberts, M. J. and Xu, D. Y. (2008), R&D Investments, Exporting, and the Evolution of Firm Productivity, American Economic Review 98(2): 451–56.
Aw, B. Y., Roberts, M. J. and Xu, D. Y. (2011), R&D Investment, Exporting, and Productivity Dynamics, American Economic Review 101(4): 1312-1344.
Axinn, C. N. and Matthyssens (2002), Limits of Internationalization Theories in an Unlimited World, International Marketing Review 19(5): 436-449.
Baldwin, R and D. Taglioni (2007). “Trade Effects of the Euro: A Comparison of Estimators,” Journal of Economic Integration, 22(4): 780-818.
Bansak, Morin, N. and Starr, M (2007), Technology, Capital Spending, and Capital Utilisation, Economic Inquiry 45(3): 631–645
Beck, N. and Katz, J. (2001). Throwing Out the Baby with the Bath Water: A Comment on Green, Kim, and Yoon, International Organization 55(2): 487-495.
Bartlett, W. and Monastiriotis, V. (2010), South Eastern Europe after the Crisis: a New Dawn or back to Business as Usual? London: LSE Reprographics
Bartlett, W. and Prasinkar, J. (1995). Small Firms and Economic Transformation in Slovenia, Communist Economies and Economic Transformation 7 (1): 81-101.
Baum, C. (2008). Stata tip 63: Modelling proportions, The Stata Journal, 8 (2): 299–303.
Becchetti, L. and Rossi, P. S. R (2000), The Positive Effects of Industrial District on the Export Performance of Italian Firms, Review of Industrial Organisation 16: 53 – 68.
Beck, T. (2002) Financial Development and International Trade: Is There a Link? Journal of International Economics 57: 107-131 .
Beck, T. (2003), Financial Dependence and International Trade, Review of International Economics 11 (2): 296-316.
Beck, T., Demirgüç-Kunt, A. and Maksimovic, V. (2008), Financing Patterns around the World: Are Small Firms Different?, Journal of Financial Economics 89(3): 467-487
Beck, T., Demirgüç-Kunt, A., Laeven, L. and Maksimovic, V. (2006), The Determinants of Financing Obstacles, Journal of International Money & Finance 25 (6): 932-952.
Bellak, C. (2004), How Domestic and Foreign Firms Differ and why does it Matter?, Journal of Economic Surveys 18 (4): 483-514.
Bennett, R. J. (1998), Business Associations and their Potential Contribution to the Competitiveness of SMEs, Entrepreneurship & Regional Development 10: 243-260.
Bernard, A., Eaton, J., Jensen, J.B. and Kortum, S. (2003), Plants and Productivity in International Trade, American Economic Review 93 (4): 1268-1290.
36

Export Behaviour of SMEs in TCs
Bernard, B. A. and Jensen J. B. (2004), Why Some Firms Export, The Review of Economics and Statistics 86 (2): 561-569
Bevan, A.A., Estrin, S. and Schaffer, M.E. (1999), Determinants of Enterprise Performance during Transition, Centre for Economic Reform and Transformation (CERT) Discussion Paper No. 99/03 (January).
Bleaney, M. and Wakelin, K. (2002), Efficiency, Innovation, and Exports, Oxford Bulletin of Economics and Statistics 64 (3): 3-15.
Bonaccorsi, A. (1992), On the relationship between firm size and export intensity, Journal of International Business Studies, 23 (4): 605-635.
Brock, W. A. and Evans, D. E. (1989), Small Business Economics, Small Business Economics 1: 7 – 20.
Bryan, J. (2006), Training and Performance in Small Firms, International Small Business Journal 24(6): 635-660.
Calof, J. L (1993), The Impact of Size on Internationalization, Journal of Small Business Management, 31 (4): 60-69.
Carlin, J. B., Galati, J. C. and Royston, P. (2008), A new framework for managing and analyzing multiply imputed data in Stata, The Stata Journal, 8 (1): 49–67.
Carlin, W., Fries, S., Schaffer, M. And Seabright, P. (2001b), Competition and enterprise performance in transition economies: evidence from a cross-country survey, EBRD Working Paper No. 63, June.
Carlin, W., Glyn, A. and Van Reenen, J. (2001a), Export Market Performance of OECD Countries: An Empirical Examination of the Role of Cost Competitiveness, The Economic Journal 111: 128-162.
Chevalier, A., Harmon, C., Walker, I. and Zhu, Y. (2004), Does Education Raise Productivity, or Just Reflect it?, The Economic Journal 114: 499-517.
Clercq, D. D., Sapienza, H. J. and Crijns, H. (2005), The Internationalisation of Small and Medium-Sized Firms, Small Business Economics 24: 409-419.
Colombano, J. and Krkoska, L. (2006), Does Enterprise-Level Training Compensate for Poor Country-Level Skills? Lessons from Transition Countries in Central and Eastern Europe, EBRD Working Paper No. 100, Available at: http://www.ebrd.com/pubs/econo/wp0100.pdf.
Crick, D. and Spence, M. (2005), The internationalisation of ‘high performing’ UK high-tech SMEs: a study of planned and unplanned strategies, International Business Review 14: 167-85.
Damijan, J. P., S. Polanec and J. Prasnikar (2004), Self-selection, Export Market Heterogeneity and Productivity Improvements: Firm Level Evidence from Slovenia, Katholieke Universiteit Leuven, LICOS Discussion Paper 148/2004.
Demsetz, H. (1997), The Firm in Economic Theory: A Quiet Revolution, American Economic Review 87 (2): 426 – 429.
Dex, S. and Scheibl, F. (2001), Flexible and Family-Friendly Working Arrangements in UK-Based SMEs: Business Cases, British Journal of Industrial Relations 39 (3): 411 – 431.
Dex, S. and Scheibl, F. (2002), SME and Flexible Working Arrangements, Bristol: The Policy Press.
Dixit, A. (1989), Entry and Exit Decisions under Uncertainty, Journal of Political Economy 97: 620-638.
Dixit, A. and Pindyck, R. S. (1994), Investment under Uncertainty, Princeton: Princeton University Press.
Djankov, S. (1999), Ownership Structure and Enterprise Restructuring in Six Newly Independent States, World Bank Policy Research Working Paper Series Nr.WPS2047, Washington D.C., World Bank.
Djankov, S. and Hoekman, B. (2000), Foreign Investment and Productivity Growth in Czech Enterprises, The World Bank Economic Review 14 (1): 49-64.
Dunning, J. H. (1988), Explaining International Production, London: Unwin Hyman.
Dunning, J. H. (1993), Multinational Enterprises and the Global Economy, Workingham: Addison- Wesley.
37

Export Behaviour of SMEs in TCs
Dunning, J. H. (1995), What’s Wrong – and Right – with Trade Theory?, The International Trade Journal, IX (2): 163 – 202.
Dunning, J. H. (2001), The Eclectic (OLI) Paradigm of International Production: Past, Present and Future , International Journal of the Economics of Business 8(2): 173-190
EBRD (2005), Transition Report: Business in Transition, European Bank for Reconstruction and Development: London.
EBRD (2005), Transition Report: Business in Transition, European Bank for Reconstruction and Development: London.
EBRD (2009), Transition Report: Transition in Crisis, European Bank for Reconstruction and Development: London.
Esteve-Perez, S. and Rodriguez, D. (2012), The Dynamics of Exports and R&D in SMEs, Small Business Economics (Posted online: 24 March 2012): 1-22.
Estrin, S., Meyer, K, E., and Bytchkova, M. (2006), Entrepreneurship in Transition Economies, in: Mark Casson et al., eds.: Oxford Handbook of Entrepreneurship, Oxford: Oxford University Press.
Everett, J. and Watson, J. (1998) Small Business Failure and External Risk Factors, Small Business Economics, 11 (4): 371-390.
Fafchamps, M. and Shilpi, F (2005), Cities and Specialisation: Evidence from South Asia, The Economic Journal 115: 477-504.
Fan, C. C. and Scott, A. J. (2003), Industrial Agglomeration and Development: A Survey of Spatial Economic Issues in East Asia and a Statistical Analysis of Chinese Regions, Economic Geography 79(3): 295-319.
Fujita, M., Krugman, P. R. and Venables, A. J. (1999), The Spatial Economy: Cities, Regions, and International Trade, Cambridge: The MIT Press.
Futo, P., Hoggett, P., and Kallay, L. (1997), “Small Firms and Economic Transformation in Hungary”, The European Journal of Social Sciences, Vol. 10, No. 2, pp. 171-184.
Gorodnichenko, Y., Svejnar, J. and Terrell, K. (2010), Globalization and Innovation in Emerging Markets, American Economic Journal: Macroeconomics 2: 194–226
Greenaway, D. and Kneller, R. (2007), Firm Heterogeneity, Exporting, and Foreign Direct Investment, The Economic Journal 117 (517): 134-161.
Greenaway, D., Sousab, N. and Wakelin, W. (2004), Do Domestic Firms Learn to Export From Multinationals? European Journal of Political Economy 20: 1027–1043.
Greene, W. (2003a). Fixed Effects and Bias Due to the Incidental Parameters Problem in the Tobit Model. Department of Economics, Stern School of Business, New York University. Working Paper version. http://pages.stern.nyu.edu/~wgreene/publications.htm. Subsequently published as: Greene, W. (2004). Fixed Effects and Bias Due to the Incidental Parameters Problem in the Tobit Model. Econometric Reviews 23(2): 125-147.
Greene, W. (2003b), Econometric Analysis. 5th edition. New Jersey: Prentice Hall.
Grossman, G. M. and Helpman, E. (1994) Endogenous Innovation in the Theory of Growth, Journal of Economic Perspectives 8 (1): 23 – 44.
Helpman, E., Melitz, M. and Yeaple, S. (2004). Export versus FDI, American Economic Review, 94: 300–316.
Hobdari, B., Gregoric, A. and Sinani, E. (2009), The Role of Firm Ownership on Internationalization: Evidence from Two Transition Economies, Journal of Management and Governance (online).
Hoshi, I., Balcerowicz, E. and Balcerowicz, L. (2003), Barriers to Entry in Early Transition, New York: Kluwer Publishers.
Hutchinson, J. and Xavier, A. (2006), Comparing the Impact of Credit Constraints on the Growth of SMEs in a Transition Country with an Established Economy, Small Business Economics 27: 169 – 179.
38
Export Behaviour of SMEs in TCs
Iakovleva, T. (2005), “Entrepreneurial Orientation of Russian SMEs”, in Vinig, T. and Van Der Voort, R. (Ed.) The Emergency of Entrepreneurial Economics, Amsterdam: Elsevier.
Javorcik, B. S. (2004), Does Foreign Direct Investment Increase the Productivity of Domestic Firms: In Search of Spillovers through Backward Linkages, American Economic Review 94 (3): 605-627
Jones, M.V. and Coviello, N.E. (2005), Internationalisation: conceptualising an entrepreneurial process of behavior in time, Journal of International Business Studies 36(3): 284-303.
Kagochi, J. M. and Jolly, C. M. (2010), R&D Investments, Human Capital, and the Competitiveness of Selected U.S. Agricultural Export Commodities, International Journal of Applied Economics 7(1): 58-77
Kandilov, I. T. and Grennes, T. (2010), The Determinants of Service Exports from Central and Eastern Europe, Economics of Transition 18(4): 763–794
Keeble, D., Bryson, J. and Wood, P. (1991), Entrepreneurship and Flexibility in Business Services: The Rise of Small Management Consultancy and Market Research Firms in the UK, Small Business Research Centre, University of Cambridge Working Paper No. 13.
Kenward, M. G. and Carpenter, J. (2007), Multiple Imputation: Current Perspectives, Statistical Methods in Medical Research 16: 199 – 218
Keupp, M. M. and Gassmann, O. (2009), The Past and the Future of International Entrepreneurship: A Review and Suggestions for Developing the Field, Journal of Management 35(3): 600-633.
Kim, L., Nugent, J. B. and Yhee, S. (1997), Transaction Costs and Export Channels of Small and Medium – Sized Enterprises: The Case of Korea, Contemporary Economic Policy 15: 104 – 120.
Kleynhans, E.P. J. (2006), The Role of Human Capital in the Competitive Platform of South African Industries, SA Journal of Human Resource Management 4: 55-62.
Kneller, R. and Pisu, M. (2007), Industrial Linkages and Export Spillovers from FDI, The World Economy: 105-134
Konings, J. (2001), The Effects of Foreign Direct Investment on Domestic Firms: Evidence from Firm-Level Panel Data in Emerging Economies, Economics of Transition 9 (3): 619-633.
Leonidou, L. C. and Adams-Florou, A. S. (1999), Types and Sources of Export Information: Insights from Small Businesses, International Small Business Journal 17(3): 30-48.
López, R.A. (2004), Self-selection into the export markets: a conscious decision?, mimeo, Department of Economics, Indiana University.
López, R.A. (2005). Trade and growth: reconciling the macroeconomic and microeconomic evidence, Journal of Economic Surveys 19: 623-48.
Maddala, G. (1977), Econometrics. London: McGraw-Hill.
Manova, K. B. (2006), Credit Constraints in Trade: Financial Development and Export Composition. Available at SSRN: http://ssrn.com/abstract=805027.
McMillan, J. and Woodruff, C. (2002), “The Central Role of Entrepreneurs in Transition Economies”, Journal of Economic Perspectives, Vol. 16, No. 3, pp. 153-170.
Meijaard, J., Brand, M. J. and Mosselman, M. (2005), Organisational Structure and Performance in Dutch Small Firms, Small Business Economics 25: 83-96.
Melitz, M. (2003), The Impact of Trade on Intra-Industry Reallocations and Aggregate Industry Productivity, Econometrica 71 (6): 1695-1725.
Melitz, M. and Ottaviano, G. (2003). Market size, trade and productivity, mimeo, Harvard University.
Mills D. E. (1984), Demand Fluctuations and Endogenous Firm Flexibility, The Journal of Industrial Economics XXXIII: 55 – 71.
Mills, D. E. and Schumann, L. (1985), Industry Structure with Fluctuating Demand, The American Economic Review 75 (4): 758 – 767.
39

Export Behaviour of SMEs in TCs
Moosa, I. (2002), Foreign Direct Investment: Theory, Evidence and Practice, New York: Palgrave.
Plümper, T. and Troeger, V. (2007). Efficient Estimation of Time-Invariant and Rarely Changing Variables in Finite Sample Panel Analyses with Unit Fixed Effects, Political Analysis 15:124–139.
Power, B. and Reid, G. C. (2005), Flexibility, Firm-Specific Turbulence and the Performance of the Long-lived Small Firm, Review of Industrial Organisation 26(4): 415-443.
Roberts, M. J. and Tybout, J. R. (1997), The Decision to Export to Columbia: An Empirical Model of Entrywith Sunk Costs, American Economic Review 87 (4): 545-564.
Royston, P. (2005a), Multiple Imputation of Missing Values: Update, The Stata Journal 5(2): 1-14.
Royston, P. (2005b), Multiple Imputation of Missing Values: Update of ice, The Stata Journal 5(4): 527-536.
Royston, P. (2007), Multiple Imputation of Missing Values: Further Update of ice, with an Emphasis on Interval Censoring, The Stata Journal, 7 (4): 445–464
Rubin, D. B. (1987), Multiple Imputation for Nonresponse in Surveys, New York: Willey.
Scase, R. (1998), The Role of Small Businesses in the Economic Transformation of Eastern Europe: Real But Relatively Unimportant?, International Small Business Journal, Vol. 16, No 1, pp 13-21.
Schafer J. L. and Graham J. W. (2002), Missing data: Our View of the State of the Art, Psychological Methods 7(2): 147-177.
Smallbone, D. and Welter, F. (2001), The Distinctiveness of Entrepreneurship in Transition Economies, Small Business Economics 16(4): 249-262.
Spence, M. and Crick, D. (2006), A comparative investigation into the internationalisation of Canadian and UK high-tech SMEs", International Marketing Review (23)5: 524-548
Sutton, J. (2007), Quality, Trade and the Moving Window: The Globalization Process, The Economic Journal. 117 (524): 469-498
Svejnar, J. and Commander, S. J. (2007), Do Institutions, Ownership and Competition Explain Firm Performance? Evidence from 26 Transition Countries, IZA Discussion Paper No. 2637.
Syverson, C. (2011), What Determines Productivity? Journal of Economic Literature XLIX(2): 236-365.
Taylor, R. (1990), Interpretation of the Correlation Coefficient: A Basic Review. Journal of Diagnostic Medical Sonography, 6(1): 35-39.
Terjesen, S. and Hessels J. (2010), Comparative International Entrepreneurship Research: A Review and Research Agenda, mimeo.
Thai, M. T. T. and Chong, L. C. (2011), The Internationalization of Small and Medium-Sized Enterprises based in Transition Economies, Academy of Management West Meets East Conference Proceedings, 2011. Available at SSRN: http://ssrn.com/abstract=1934916
Tobin, J (1956). Estimation of Relationships for Limited Dependent Variables. Cowles Foundation Discussion Paper 3R (July).
Vagliasindi, M. (2001), Competition across transition economies: an enterprise-level analysis of the main policy and structural determinants, EBRD Working Paper No. 68, December.
Vagliasindi, M. (2006), Does Competition Policy Implementation Affect the Intensity of Competition?, September; http://www.ebrd.com/country/sector/econo/jrp27.pdf (accessed on 16 August 2009).
van Buuren, S., Boshuizen, H. C. and Knook, D. L. (1999), Multiple Imputation of Missing Blood Pressure Covariates in Survival Analysis, Statistics in Medicine 18: 681-694.
Wagner, J. (2001), A Note on the Firm Size – Export Relationship, Small Business Economics 17: 229-237.
Wakelin, K. (1998), Innovation and Export Behaviour at the Firm Level, Research Policy 26: 829-841.
Wood, P. (1991), Small Firms, Business Services and Flexibility, Small Business Research Centre, University of Cambridge Working Paper No. 3.
40

Export Behaviour of SMEs in TCs
Wooldridge, J. M. (2002), Econometric Analysis of Cross Section and Panel Data, Cambridge: MIT Press.
Wooldridge, J. M. (2006), Introductory Econometrics: A Modern Approach, 4th edition, Mason: South-Western.
World Bank (2009), World Development Report 2009: Reshaping Economic Geography, Washington DC: The World Bank.
Yudaeva, K., Kozlov, K., Melentieva, N. and Ponomareva, N. (2003), Does Foreign Ownership Matter?, Economics of Transition 11 (3): 383-409.
41