chapter 41 cost-effectiveness analyses
TRANSCRIPT

National Institute of Health and Care Excellence
Final
Chapter 41 Cost-effectiveness analyses Emergency and acute medical care in over 16s: service delivery and organisation
NICE guideline 94
Developed by the National Guideline Centre, hosted by the Royal College of Physicians
March 2018


Emergency and acute medical care Contents
Chapter 41 Cost-effectiveness analyses
Emergency and acute medical care
Disclaimer Healthcare professionals are expected to take NICE guidelines fully into account when exercising their clinical judgement. However, the guidance does not override the responsibility of healthcare professionals to make decisions appropriate to the circumstances of each patient, in consultation with the patient and, where appropriate, their guardian or carer.
Copyright © NICE 2018. All rights reserved. Subject to Notice of rights.
ISBN: 978-1-4731-2741-8Chapter 41 Cost-effectiveness analyses
Emergency and acute medical care
Chapter 41 Cost-effectiveness analyses 4
Contents 41 Cost-effectiveness analyses ................................................................................................... 6
41.1 Introduction .......................................................................................................................... 6
41.1.1 Health economics sub-group ................................................................................... 7
41.2 General methods................................................................................................................... 7
41.2.1 Model overview........................................................................................................ 7
41.2.2 Comparators ............................................................................................................. 9
41.2.3 Patient characteristics ............................................................................................ 12
41.2.4 Baseline event rates ............................................................................................... 13
41.2.5 Relative treatment effects ..................................................................................... 17
41.2.6 Life expectancy ....................................................................................................... 21
41.2.7 Utilities ................................................................................................................... 26
41.2.8 Resource use and costs .......................................................................................... 33
41.2.9 Cost-effectiveness .................................................................................................. 36
41.3 Cohort model methods ....................................................................................................... 37
41.3.1 Approach to modelling ........................................................................................... 37
41.3.2 Interventions that take place in the emergency department ................................ 38
41.3.3 Interventions that take place in hospital wards ..................................................... 39
41.3.4 Inputs ...................................................................................................................... 39
41.3.5 Sensitivity analysis .................................................................................................. 40
41.4 Simulation model methods ................................................................................................. 41
41.4.1 Approach to modelling ........................................................................................... 41
41.4.2 Labels, workstations and procedures .................................................................... 44
41.4.3 Number of model runs ........................................................................................... 47
41.4.4 Inputs and sampling ............................................................................................... 48
41.4.5 Medical outliers ...................................................................................................... 50
41.4.6 Decision rules for routing patients when resources are fully utilised ................... 51
41.4.7 Sensitivity analyses ................................................................................................. 53
41.4.8 Model validation .................................................................................................... 53
41.5 Results ................................................................................................................................. 53
41.5.1 Cohort model base case ......................................................................................... 54
41.5.2 Cohort model sensitivity analyses .......................................................................... 60
41.5.3 Simulation model base case ................................................................................... 62
41.5.4 Simulation model sensitivity analyses.................................................................... 68
41.5.5 Simulation model convergence .............................................................................. 68
41.6 Discussion ............................................................................................................................ 69
41.6.1 Summary of results ................................................................................................ 69
Emergency and acute medical care
Chapter 41 Cost-effectiveness analyses 5
41.6.2 Generalisability to other settings ........................................................................... 71
41.6.3 Limitations and areas for future research .............................................................. 71
41.6.4 Comparisons with published studies ..................................................................... 76
41.6.5 Conclusions ............................................................................................................ 77
41.7 References........................................................................................................................... 79
Appendix A: Health economic review protocol ............................................................................ 93
Appendix B: Health economic review flowchart ........................................................................... 95
Appendix C: Weekend admissions review .................................................................................... 98
Appendix D: Medical Outliers review .......................................................................................... 152
Appendix E: Analysis of activity data from an acute hospital trust ............................................ 172
Appendix F: Treatment effect calculations ................................................................................. 188
Appendix G: Simulation model labels, workstations and procedures ........................................ 194
Appendix H: Additional simulation model results ....................................................................... 205
Appendix I: Unit costs ................................................................................................................ 206

Emergency and acute medical care
Chapter 41 Cost-effectiveness analyses 6
41 Cost-effectiveness analyses
41.1 Introduction
The health economic work within the guideline was undertaken in a systematic approach. Prioritised areas were analysed with increasingly complex and detailed methods in accordance with the added value such methods would bring to decision making and recommendations (taking into account data availability, number of assumptions required and so on). Where there was a clear consensus on the likelihood of cost effectiveness at any given stage of the modelling work up for a question, no further analytical economic work was undertaken.
Step 1: review of published economic evaluations. The reviews can be found in the relevant topic-specific chapters. A generic protocol was used across all topics – see Appendix A. A single flow chart was produced for the guideline’s economic evaluation review – see Appendix B.
Step 2: presentation of unit costs associated with the intervention and/or downstream resource use impact (for questions where there are no published economic evaluations). These unit costs and can be found in Appendix I:.
Step 3: costing analyses based on the guideline’s systematic review, including downstream resource impact. Description of costing analyses and discussion of findings can be found in the relevant chapters. They were undertaken for the topics of:
Multi-disciplinary hospital teams (Chapter 29).
Standardised systems for -hospital transfer (Chapter 34).
Step 4: Cost-utility analyses based on the guideline’s systematic review. Cost utility analyses were conducted for the following topics:
Timing of consultant review (Chapter 19)
o Rapid Assessment and Treatment (RAT) in the Emergency Department (ED)
o Extended hours for consultants in the Acute Medical Unit (AMU).
Frequency of consultant review (Chapter 26)
o Daily consultant review on medical wards
Extended access to therapy (Chapter 31)
o in the ED
o on medical wards.
Whilst steps 1-4 allow for evaluation of the cost effectiveness of the interventions in isolation, the methods do not allow for consideration of the performance of individual service interventions within a dynamic system, where relationships and interactions of interventions within a complete pathway can be explored. Therefore, a final step is being undertaken.
Step 5: development of a hospital simulation model
Parameter inputs include those used within steps 1-4 where appropriate, alongside findings of the weekend admission (Appendix C) and medical outlier (Appendix D) reviews specifically conducted to inform the model. Further data was sourced via a district general hospital to take into account epidemiology, flow and capacity modelling of a hospital. The simulation model is being developed to explore:
the relative importance of the interventions covered in step 4 in terms of their cost and quality-adjusted life-year (QALY) impact
additional factors (such as medical outliers and delayed discharge).

Emergency and acute medical care
Chapter 41 Cost-effectiveness analyses 7
The model seeks to capture hourly, daily, weekly and seasonal fluctuations. It evaluates waiting time in ED and the number of medical outliers and their consequences.
This report focuses on Steps 4 and 5. Methods and inputs that are common to both are reported in 41.2. Methods specific to the cohort model and simulation model are reported in sections 41.3 and 41.4 respectively. These are followed by the results and discussion.
41.1.1 Health economics sub-group
The modelling was conducted by the health economists of the guideline technical team and was directed by a subgroup of the full guideline committee comprised of volunteers. It comprised of experts in acute medicine, emergency medicine, paramedics, intensive care medicine, psychiatry and hospital clinical management. The full committee were consulted on all methods.
41.2 General methods
41.2.1 Model overview
41.2.1.1 Comparators & population
The guideline population is adults (age≥18) who have had an acute medical emergency (AME). It therefore exclude paediatric patients, maternity, trauma, surgery and people attending health services for non-urgent care. Our models focus primarily on interventions that occur in hospital to improve the flow of patients and patient outcomes:
1. RAT in the ED
2. Extended hours for consultants in AMU
3. Daily consultant review on medical wards
4. Extended access to therapy on wards
5. Extended access to therapy in the ED.
For 1 and 5 the population is people attending ED. For 2, its patients admitted to the AMU and for the others it is patients on medical wards (other than AMU).
The simulation model includes non-AME patients passing through the adult ED but the pathway for these patients is not specifically modelled after they have been processed by the ED.
41.2.1.2 Conceptual model
The health economics subgroup of the committee discussed the requirements of a simulation of a hospital that could evaluate costs, QALYs and explore the variation of performance over time.
Generally, the models were designed on the basis that
Workload and case-mix (age and NEWS) is determined by season and day of the week and hour of the day. NEWS (National Early Warning Score) is a measure of acuity that uses 7 physiological parameters to determine a score ranging from 0 (low acuity) to 7 or more (critically ill).
Case-mix (age and NEWS) determines baseline mortality, movements between locations and length of stay.
Case-mix (age and CFS) determine average long-term survival and average utility. The Clinical Frailty Scale (CFS) uses a descriptive chart illustrating activity level. The scale ranges from 1 (very fit) to 9 (terminally ill).
Age, NEWS and CFS are correlated.
Interventions can affect many different outcomes:

Emergency and acute medical care
Chapter 41 Cost-effectiveness analyses 8
o length of stay which is influenced by clinical need, timely diagnosis, timely access to beds and specialist staff.
o In-hospital mortality – sometimes a reduction in mortality is a real effect leading to substantial QALYS gained but sometimes patients will be discharged earlier so that they can die in a more preferable location.
o Intensive care referral – we consider this an indicator of adverse events, other adverse events are captured by mortality and length of stay.
o Medical outlying – an indicator of suboptimal care, associated with risk of death, adverse event and increased length of stay.
o Queuing in ED – an indicator of the hospital being under stress and sub-optimal care.
Typical hospital pre-admission locations:
Emergency Department (ED).
Ambulatory Acute Medical Unit (AAMU) – acute medicine experts provides outpatient care for AME patients during daytime.
Clinical Decision Unit (CDU) – short stay wards provided by emergency medicine experts. Although these are technically admissions, we have made a distinction, since they are part of the emergency pathway rather than medical pathway and in the hospital data sourced; these patients were not recorded on VitalPAC, which computes NEWS.
Typical hospital admission pathways/ locations:
Acute Medical Unit (AMU) – where undifferentiated AME patients are assessed and managed usually for up to 48 hours.
General medical wards (GMW) – provide level 1 care to medical patients, includes specialist wards such as gastroenterology, care of the elderly.
Intensive care unit / high dependency unit (ICU/HDU) – the intensive medicine department providing level 2 and level 3 care.
Specialist high care units (HCU) – level 2 care such as hyper-acute stroke unit and coronary care unit.
Rehabilitation (Rehab) wards – longer stay wards involving occupational therapy and physiotherapy.
Medical outliers – AME patients on non-medical (surgery, gynaecology, trauma) wards.
Non-medical pathway – Patients that are admitted under a medical consultant but subsequently take an appropriately non-medical pathway.
41.2.1.3 Reference case
We have followed the NICE reference case.131,135
The cost perspective taken is that of the NHS and personal social services. The health perspective was limited to the patients and not family members or staff.
We used a cost-effectiveness threshold of £20,000 per QALY in the base case. Between £20,000 and £30,000 per QALY the intervention could be considered cost effective if there are additional justifications. Future costs and QALYs were discounted at 3.5% per annum, and incremental analysis was conducted.
For our cohort analyses, we have not conducted probabilistic sensitivity analysis, since we have investigated uncertainty using a simulation model.
Emergency and acute medical care
Chapter 41 Cost-effectiveness analyses 9
We have used a lifetime horizon.
41.2.2 Comparators
41.2.2.1 RAT in the ED
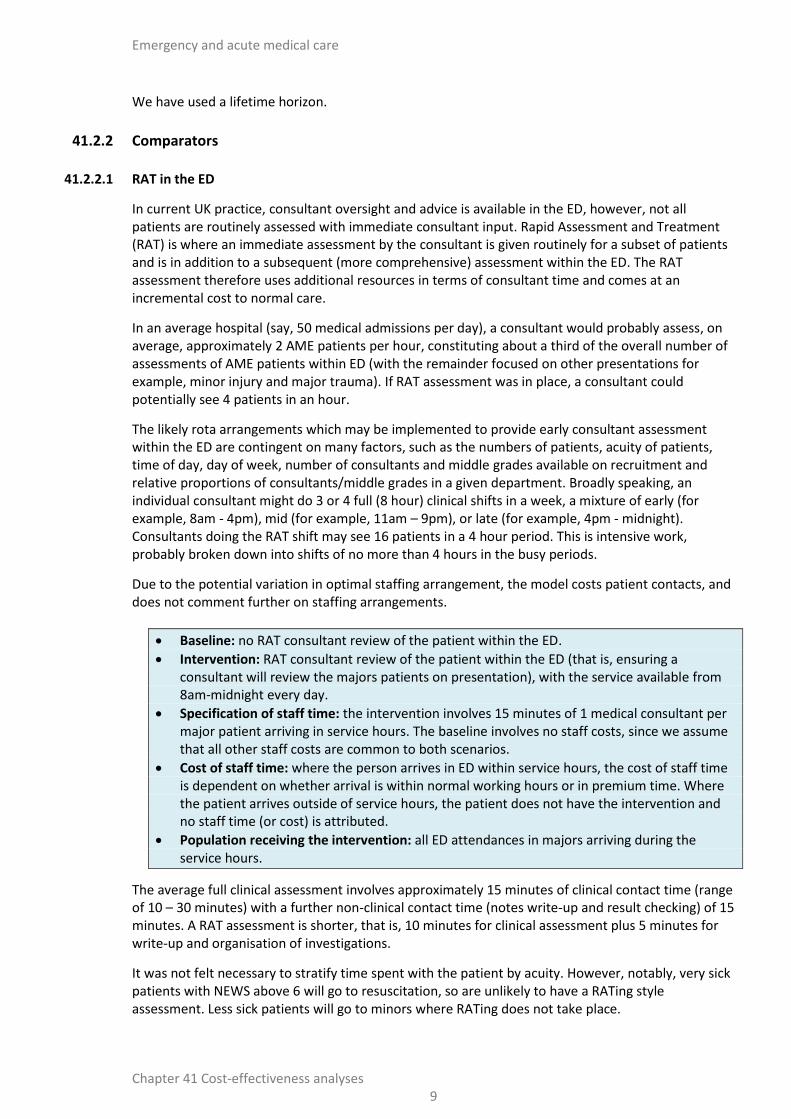
In current UK practice, consultant oversight and advice is available in the ED, however, not all patients are routinely assessed with immediate consultant input. Rapid Assessment and Treatment (RAT) is where an immediate assessment by the consultant is given routinely for a subset of patients and is in addition to a subsequent (more comprehensive) assessment within the ED. The RAT assessment therefore uses additional resources in terms of consultant time and comes at an incremental cost to normal care.
In an average hospital (say, 50 medical admissions per day), a consultant would probably assess, on average, approximately 2 AME patients per hour, constituting about a third of the overall number of assessments of AME patients within ED (with the remainder focused on other presentations for example, minor injury and major trauma). If RAT assessment was in place, a consultant could potentially see 4 patients in an hour.
The likely rota arrangements which may be implemented to provide early consultant assessment within the ED are contingent on many factors, such as the numbers of patients, acuity of patients, time of day, day of week, number of consultants and middle grades available on recruitment and relative proportions of consultants/middle grades in a given department. Broadly speaking, an individual consultant might do 3 or 4 full (8 hour) clinical shifts in a week, a mixture of early (for example, 8am - 4pm), mid (for example, 11am – 9pm), or late (for example, 4pm - midnight). Consultants doing the RAT shift may see 16 patients in a 4 hour period. This is intensive work, probably broken down into shifts of no more than 4 hours in the busy periods.
Due to the potential variation in optimal staffing arrangement, the model costs patient contacts, and does not comment further on staffing arrangements.
Baseline: no RAT consultant review of the patient within the ED.
Intervention: RAT consultant review of the patient within the ED (that is, ensuring a consultant will review the majors patients on presentation), with the service available from 8am-midnight every day.
Specification of staff time: the intervention involves 15 minutes of 1 medical consultant per major patient arriving in service hours. The baseline involves no staff costs, since we assume that all other staff costs are common to both scenarios.
Cost of staff time: where the person arrives in ED within service hours, the cost of staff time is dependent on whether arrival is within normal working hours or in premium time. Where the patient arrives outside of service hours, the patient does not have the intervention and no staff time (or cost) is attributed.
Population receiving the intervention: all ED attendances in majors arriving during the service hours.
The average full clinical assessment involves approximately 15 minutes of clinical contact time (range of 10 – 30 minutes) with a further non-clinical contact time (notes write-up and result checking) of 15 minutes. A RAT assessment is shorter, that is, 10 minutes for clinical assessment plus 5 minutes for write-up and organisation of investigations.
It was not felt necessary to stratify time spent with the patient by acuity. However, notably, very sick patients with NEWS above 6 will go to resuscitation, so are unlikely to have a RATing style assessment. Less sick patients will go to minors where RATing does not take place.
Emergency and acute medical care
Chapter 41 Cost-effectiveness analyses 10
The specification of the modelled comparison is summarised in the above text box.
41.2.2.2 Extended hours for consultants
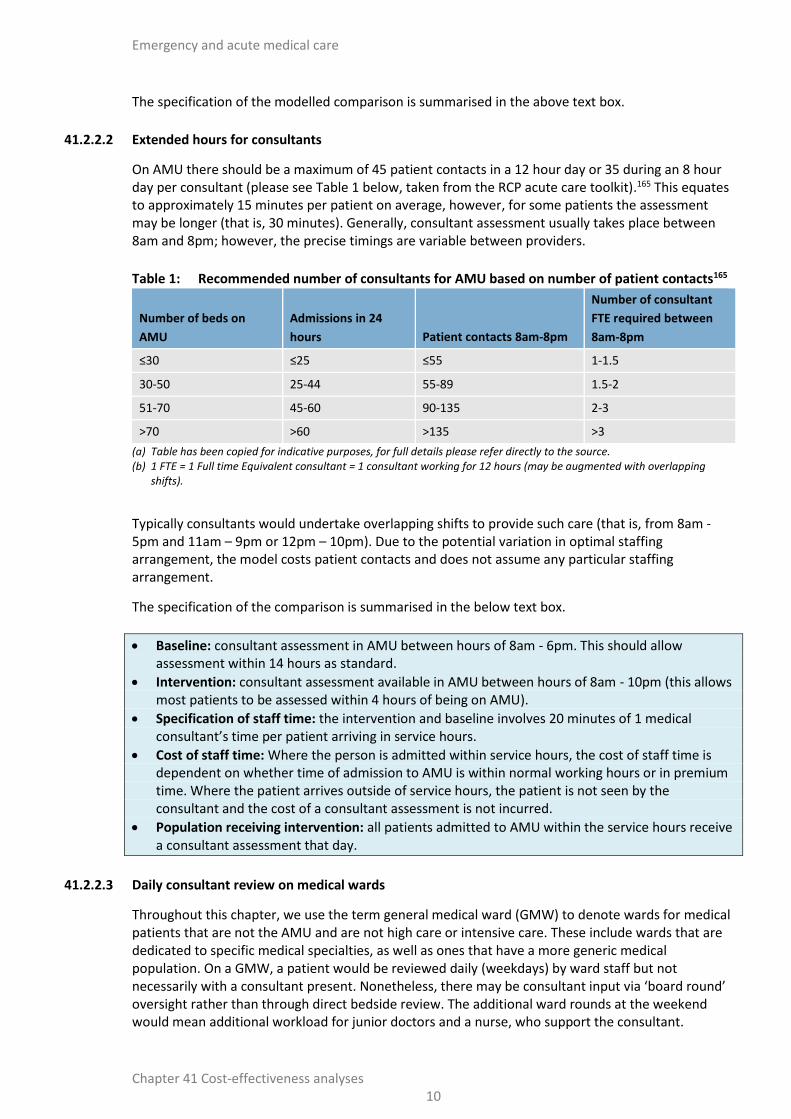
On AMU there should be a maximum of 45 patient contacts in a 12 hour day or 35 during an 8 hour day per consultant (please see Table 1 below, taken from the RCP acute care toolkit).165 This equates to approximately 15 minutes per patient on average, however, for some patients the assessment may be longer (that is, 30 minutes). Generally, consultant assessment usually takes place between 8am and 8pm; however, the precise timings are variable between providers.
Table 1: Recommended number of consultants for AMU based on number of patient contacts165
Number of beds on
AMU
Admissions in 24
hours Patient contacts 8am-8pm
Number of consultant
FTE required between
8am-8pm
≤30 ≤25 ≤55 1-1.5
30-50 25-44 55-89 1.5-2
51-70 45-60 90-135 2-3
>70 >60 >135 >3
(a) Table has been copied for indicative purposes, for full details please refer directly to the source. (b) 1 FTE = 1 Full time Equivalent consultant = 1 consultant working for 12 hours (may be augmented with overlapping
shifts).
Typically consultants would undertake overlapping shifts to provide such care (that is, from 8am -5pm and 11am – 9pm or 12pm – 10pm). Due to the potential variation in optimal staffing arrangement, the model costs patient contacts and does not assume any particular staffing arrangement.
The specification of the comparison is summarised in the below text box.
Baseline: consultant assessment in AMU between hours of 8am - 6pm. This should allow assessment within 14 hours as standard.
Intervention: consultant assessment available in AMU between hours of 8am - 10pm (this allows most patients to be assessed within 4 hours of being on AMU).
Specification of staff time: the intervention and baseline involves 20 minutes of 1 medical consultant’s time per patient arriving in service hours.
Cost of staff time: Where the person is admitted within service hours, the cost of staff time is dependent on whether time of admission to AMU is within normal working hours or in premium time. Where the patient arrives outside of service hours, the patient is not seen by the consultant and the cost of a consultant assessment is not incurred.
Population receiving intervention: all patients admitted to AMU within the service hours receive a consultant assessment that day.
41.2.2.3 Daily consultant review on medical wards
Throughout this chapter, we use the term general medical ward (GMW) to denote wards for medical patients that are not the AMU and are not high care or intensive care. These include wards that are dedicated to specific medical specialties, as well as ones that have a more generic medical population. On a GMW, a patient would be reviewed daily (weekdays) by ward staff but not necessarily with a consultant present. Nonetheless, there may be consultant input via ‘board round’ oversight rather than through direct bedside review. The additional ward rounds at the weekend would mean additional workload for junior doctors and a nurse, who support the consultant.

Emergency and acute medical care
Chapter 41 Cost-effectiveness analyses 11
Daily review would increase the consultant’s familiarity with the patient and promote continuity. This would reduce the time it takes to do the review.
The specification of the comparison is summarised in the below text box.
Baseline: a consultant undertakes a ward round twice a week (in normal working hours, that is, non-premium time). A junior doctor will take a ward round on the other 3 weekdays. At the weekend, there is no ward round.
Intervention: a consultant undertakes a ward round once daily (to take place in normal working hours that is, non-premium time and on weekends, that is, in premium time). Two junior doctors and 1 nurse accompany the consultant on ward rounds – this represents an incremental cost only at the weekend.
Specification of staff time: the review is assumed to take 15 minutes per patient for an initial assessment and 10 minutes for each daily review, at baseline. For the intervention, the initial assessment takes 15 minutes, the first review takes 10 minutes and subsequent reviews take 5 minutes per patient. We include junior doctor and nurse time for those consultant reviews taking place at the weekend.
Cost of staff time: consultant review occurs within normal working hours on weekdays and in premium time on the weekend. The intervention always occurs within normal working hours for junior doctors. For nurse time, additional pay enhancements are given for Saturday and Sunday work.
Population: all admitted patients on medical wards (excluding AMU and high care wards).
41.2.2.4 Extended access to therapy
Hospitals generally have a dedicated physiotherapy and occupational therapy (PT/OT) service for acutely ill patients. The primary role of the therapist is to assess and improve the patient’s mobility/functioning, to make sure they are safe to go home and to avoid unnecessarily prolonged hospital stay. The therapists sometimes get involved in some of the social work function, for example, calling around to try to arrange emergency placements.
A REACT team typically consists of an OT, PT and an OT/PT support worker who cover the ED and AMU. The presence of a dedicated service on the wards and for outlying patients is more variable. In some hospitals, each medical ward will have a dedicated PT and OT, who would work Monday to Friday, 9am-5pm. At weekends, a number of patients on the ward would be highlighted for weekend input, but generally, there is very much a reduced service.
The initial assessment in ED typically takes between 30 minutes to 1 hour, with the time increased where discharge is planned. Up-skilling of both physiotherapists and occupational therapists mean that basic assessment and referral can be done by either staff member.
Once assessed, a management plan is drawn up. Typically, the patient will be reassessed once admitted on the ward (approximately 40 minutes of reassessment time) and then have 20 – 40 minutes of follow up reassessment and action of the management plan for each subsequent day on the ward. Ward based management plans are enacted by various members of the team dependent on the patient and their needs. We assume that any 1 member from a team of a physiotherapist (1 whole-time equivalent [WTE]) an assistant (0.5 WTE) or ward nurse (0.2 WTE) could be involved in any given session.
During the ward stay, the occupational therapist’s time spent on each patient will be variable, and predominantly used preparing the patient for discharge. This activity is varied and important but we have not costed this as part of the intervention, on the assumption that this activity would have to take place anyway.

Emergency and acute medical care
Chapter 41 Cost-effectiveness analyses 12
The impact of extended PT/OT services is heavily reliant on the service provided in the community. The typical delay to discharge varies but is often due to capacity of care agencies at a weekend. In addition, the home environment of the patient might be unsuitable for early discharge without several adaptations.
The specification of the modelled comparison is summarised in the below text box.
Baseline: access to PT/OT (service available 9am - 5pm weekdays, that is, in normal working hours).
Intervention: extended access to PT/OT (available 9am - 8pm including weekends).
Specification of staff time: a PT/OT assessment takes 45 minutes with 1 member of the referral team in attendance (a weighted average cost of 2 qualified OT/PT professionals and 0.5 assistant is used). On medical wards, daily PT sessions of 30 minutes are given, with 1 member of the management team in attendance (a weighted average cost of a team member from a team of a physiotherapist (1WTE) an assistant (0.5 WTE) or ward nurse (0.2 WTE) is applied).
Cost of staff time: for assessment in the ED, the ED arrival time77 was used to establish whether the intervention occurs outside of normal working hours. All physiotherapy session on the ward are assumed to take place inside normal working hours, unless occurring on Saturday or Sunday.
Population: within ED, PT/OT referral is assumed to be indicated in those with low NEWS scores (0,1). PT/OT referral is only indicated for patients having a CFS score of 3, 4, 5 or 6. Patients with CFS score of 1 or 2 are unlikely to require a PT/OT referral, whilst those with a CFS score of 7 and above are likely to have special PT/OT arrangements in place in both baseline and intervention. For patients on medical wards, PT/OT is assumed to be indicated for all patients with CFS 3 and above.
41.2.3 Patient characteristics
An acute medical emergency can arise from a multitude of conditions and contains a wide number of diagnostic groups. Within each diagnostic group, the severity of the condition, the long-term prognosis and associated expected resource use can also widely differ. For this reason, it was felt most appropriate to stratify by age and by commonly used indicators of acuity and frailty, which could be applied across the population. Therefore, for purposes of identification of appropriate subgroups to receive specific interventions and to assist determination of long term survival and quality of life, the modelling work stratifies the AME population using the National Early Warning Score (NEWS)166 and Clinical Frailty Scale (CFS).163
For both models, we determined the age distribution from the Queen Alexandra Hospital – see Appendix E. We did this separately for admitted patients and patients discharged from the ED. The age distribution in each location (e.g. AMU or GMW) was also determined by the relevant patients from the Queen Alexandra Hospital.
Admitted patients
For the cohort model, the case mix (CFS and NEWS) by age of admitted patients was determined using a UK audit of 2990 patients attending Acute Medical Units (AMUs) – SAMBA 2013188 – see Table 2 and Table 3. At the time, this was the most recent year of the annual audit that was available for bespoke analysis. The audit used a modified version of NEWS that omitted responsiveness (AVPU scale - alert, voice, pain, unresponsive).
For the simulation model, the case mix of age and NEWS were determined by data from the Queen Alexandra Hospital – see Appendix E. In the absence of specific CFS data, a CFS distribution was assumed for each age-NEWS group (0, 1-4, 5-6, 7+), using the SAMBA 2013 data. The Portsmouth

Emergency and acute medical care
Chapter 41 Cost-effectiveness analyses 13
data allowed calculation of the full NEWS score and ‘NEWS minus AVPU’. Therefore, at admission, we allocated each patient both a NEWS score and ‘NEWS minus AVPU’ score; a CFS score was then randomly allocated based on age and ‘NEWS minus AVPU’.
Patients discharged from the Emergency Department
We ascribed a CFS score to patients, using the age-CFS distribution in SAMBA 2013 – see Table 2. The patients being discharged from ED were less frail on average than those patients who were admitted to hospital since they were considerably younger.
We did not have NEWS data for patients discharged from the ED and therefore we assumed that the NEWS-CFS distribution by age was the same as for admitted patients, again using SAMBA 2013 – see Table 2. Hence, NEWS in ED was on average lower for patients discharged from ED, since they were considerably younger on average.
Table 2: CFS distribution of admitted patients by age188
Age group
Clinical Frailty Score (CFS)
1 2 3 4 5 6 7 8 9 All
<18 10 2 1 1 - - - 14
18-25 76 34 5 3 1 2 2 123
25-34 104 80 16 6 1 - 1 208
35-44 75 79 36 16 4 - 3 213
45-54 88 126 69 26 10 9 12 1 2 343
55-64 57 96 92 49 25 26 14 4 6 369
65-74 44 97 140 86 51 65 34 4 8 529
75-84 20 55 157 144 106 116 54 14 14 680
85-94 4 20 61 82 81 125 58 25 5 461
95+ - - 4 6 6 13 17 5 51
All 478 589 581 419 285 356 478 53 35 2991
Table 3: NEWS distribution (%) of admitted patients by clinical frailty score 188
NEWS minus AVPU
CFS 0 1 2 3 4 5 6 7-10 11+ Total %
1 46 28 11 4 3 3 1 2 0 16
2 44 24 13 8 5 2 2 2 0 20
3 36 24 16 10 4 3 2 4 0 19
4 27 23 17 10 6 6 3 6 0 14
5 27 20 19 9 9 5 5 6 0 10
6 29 18 17 10 5 7 5 8 0 12
7 19 17 13 15 6 8 4 18 1 7
8 17 9 9 6 15 9 11 15 8 2
9 14 26 14 6 6 6 6 15 9 1
Total % 35 23 15 9 5 4 3 6 1 100
41.2.4 Baseline event rates
The simulation model uses data from a single large district general hospital (DGH), the Queen Alexandra Hospital, Portsmouth – see Appendix E.

Emergency and acute medical care
Chapter 41 Cost-effectiveness analyses 14
The cohort model uses a mixture of national sources including the Office for National Statistics (ONS) supplemented with data from the Queen Alexandra Hospital.
For baseline survival at 30 days and beyond – see 41.2.6.
41.2.4.1 Timing and number of AME presentations
For the cohort model, we take English A&E attendance data from Hospital Episode Statistics (HES)77 to estimate time and day of arrival distributions at ED - Table 4.
For the simulation model, we use data from the Queen Alexandra Hospital, Portsmouth – see Appendix E. These presentations were also stratified by time of day, day of week and season. There was also data on the number and source of direct admissions (those not passing through the ED).

Emergency and acute medical care
Chapter 41 Cost-effectiveness analyses 15
Table 4: Number of A&E attendances by hour of arrival, 2014-15
Arrival time (hour)
Average length of stay in ED (minutes)
Number of patients (on arrival)
% (at time of arrival)
% (at time of departure)(a)
0-1 276 436,553 2.23% 0.00%
01-02 204 305,969 1.56% 3.24%
02-03 203 252,102 1.29% 2.55%
03-04 203 220,818 1.13% 0.00%
04-05 202 200,216 1.02% 3.80%
05-06 201 189,594 0.97% 1.29%
06-07 185 206,957 1.06% 1.13%
07-08 152 327,941 1.68% 1.02%
08-09 123 773,230 3.95% 1.00%
09-10 123 1,243,704 6.36% 2.74%
10-11 132 1,373,822 7.02% 3.95%
11-12 144 1,400,793 7.16% 6.36%
12-13 146 1,319,049 6.74% 7.02%
13-14 145 1,288,975 6.59% 7.16%
14-15 141 1,248,402 6.38% 6.74%
15-16 140 1,207,856 6.18% 6.59%
16-17 141 1,208,970 6.18% 6.38%
17-18 146 1,164,460 5.95% 6.18%
18-19 148 1,195,982 6.12% 6.18%
19-20 153 1,111,388 5.68% 5.95%
20-21 163 960,047 4.91% 6.12%
21-22 175 787,070 4.02% 5.68%
22-23 186 633,602 3.24% 4.91%
23-24 196 499,281 2.55% 4.02%
Mean
(154)
Total (19,556,781)
(a) Calculated by adding the mean duration of stay onto the arrival time.
Emergency and acute medical care
Chapter 41 Cost-effectiveness analyses 16
41.2.4.2 Admissions from ED
For the proportion of ED presentations arriving by ambulance, 30.5% was taken from national data118.
For the cohort model, admissions rates were derived from a sample of 5 hospitals (n=412,500)132:
Admission rate for patients arriving by ambulance, 42.6%.
Admission rate overall for all ED attendances, 28.9%.
Proportion of admissions that arrived by ambulance, 39.1%.
In the model, we made the simplifying assumption that those arriving by ambulance were dealt with in majors.
For the simulation model, admission rates were from the Queen Alexandra Hospital, Portsmouth, and they were stratified by age group, time of day, day of week and season – see Appendix E.
41.2.4.3 ED mortality and length of stay
For both models, mortality in the ED was taken from Hospital Episode Statistics and was 20,388/19,556,781 (0.1%).76
ED length of stay features only in the simulation model; these data came from the Queen Alexandra Hospital, Portsmouth, and they were stratified by discharge destination (CDU, Ward, AAMU, discharge) – see Appendix E. The mean length of stay was 157 minutes (2.6 hours).
41.2.4.4 Inpatient mortality and length of stay
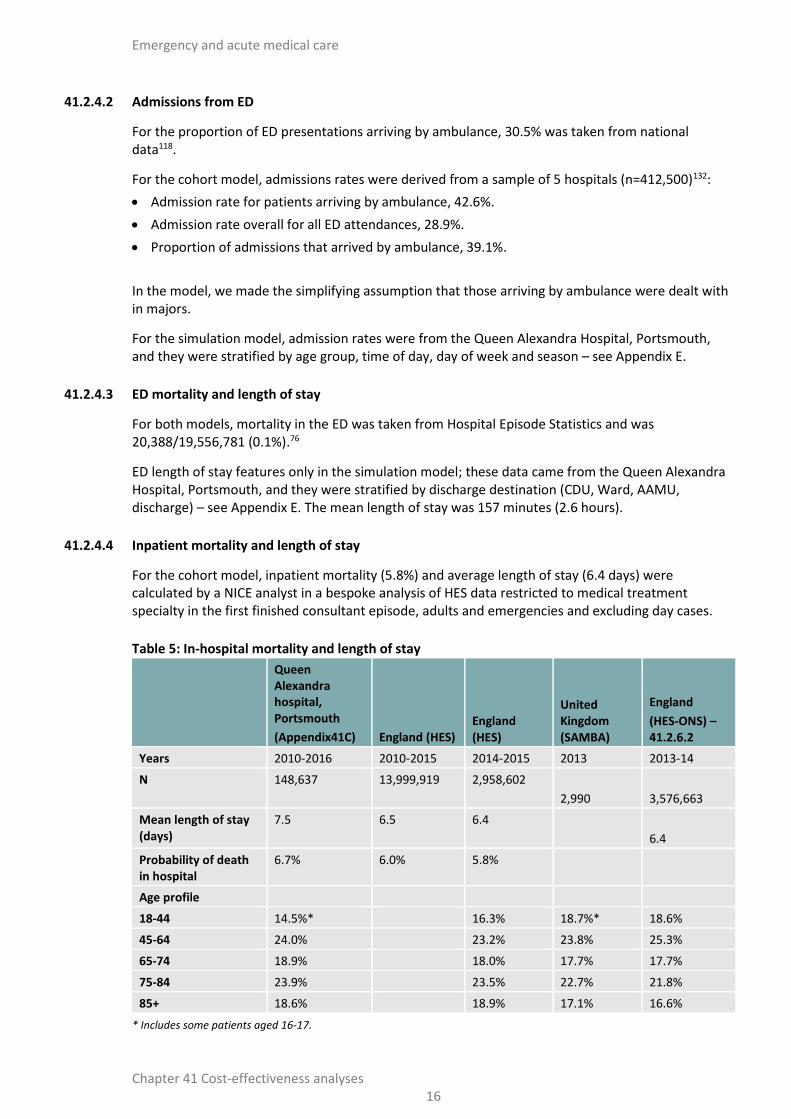
For the cohort model, inpatient mortality (5.8%) and average length of stay (6.4 days) were calculated by a NICE analyst in a bespoke analysis of HES data restricted to medical treatment specialty in the first finished consultant episode, adults and emergencies and excluding day cases.
Table 5: In-hospital mortality and length of stay
Queen Alexandra hospital, Portsmouth
(Appendix41C) England (HES) England (HES)
United Kingdom (SAMBA)
England
(HES-ONS) – 41.2.6.2
Years 2010-2016 2010-2015 2014-2015 2013 2013-14
N 148,637 13,999,919 2,958,602
2,990
3,576,663
Mean length of stay (days)
7.5 6.5 6.4
6.4
Probability of death in hospital
6.7% 6.0% 5.8%
Age profile
18-44 14.5%* 16.3% 18.7%* 18.6%
45-64 24.0% 23.2% 23.8% 25.3%
65-74 18.9% 18.0% 17.7% 17.7%
75-84 23.9% 23.5% 22.7% 21.8%
85+ 18.6% 18.9% 17.1% 16.6%
* Includes some patients aged 16-17.

Emergency and acute medical care
Chapter 41 Cost-effectiveness analyses 17
For the simulation model, these data came from the Queen Alexandra Hospital, Portsmouth, and they were stratified by age, NEWS and current hospital location – see Appendix E. Length of stay was also stratified by next location. The probability that admitted patients die in AMU (1,039/110,995=0.9%) or GMW (6,194/97,521=6.4%) was also used in the cohort model.
41.2.4.5 Referral to intensive care and other movements within the hospital
The simulation model distinguishes between the following parts of the hospital:
Emergency department (ED)
Clinical decision unit (CDU)
Ambulatory acute medical unit (AAMU)
Acute medical unit (AMU)
General medical wards (GMW)
Intensive care unit / high dependency unit (ICU/HDU)
Specialist high care units (HCUs)
Medical outliers.
Non-medical pathway.
Data on movements between these locations was from the Queen Alexandra Hospital, Portsmouth – see Appendix E. This was mainly used in the simulation model only. The probability that admitted patients go to the ICU/HDU from AMU (339/110,995=0.3%) and from GMW (866/97,521=0.9%) was also used in the cohort model.
41.2.4.6 Discharge
Data on discharge destination and time of discharge was from the Queen Alexandra Hospital, Portsmouth – see Appendix E. This data is not used in the cohort model.
41.2.5 Relative treatment effects
Treatment effectiveness estimates derived from the relevant clinical review were of low applicability or derived from studies with low quality. In addition, there was no evidence for many important outcomes. Therefore, treatment effects were formally elicited from the guideline’s health economics subgroup.
The elicitation exercise involved:
There was an initial discussion of the published estimates by the whole committee.
This was followed by a survey monkey questionnaire whereby each subgroup member independently cited their own estimates of important outcomes (taking into account the published evidence, discussion and their own experience).
These individual estimates were brought back for discussion by the subgroup to reach a consensus on the point estimates and uncertainty ranges.
These estimates were then discussed and finalised by the full committee.
In general, these estimates were considerably more conservative than estimates in the literature, reflecting the committee’s view that these studies have limited applicability and that they are heavily influenced by the baseline service structure.
In the elicitation exercise experts were asked:
Emergency and acute medical care
Chapter 41 Cost-effectiveness analyses 18
For which outcomes there will be a treatment effect?
Specification of the population on whom the treatment effect should be applied?
To give a percentage change for each outcome of interest, with a lower and upper bound to test within a sensitivity analysis.
To assist interpretation, baseline risks and absolute differences were presented as well as relative risks.
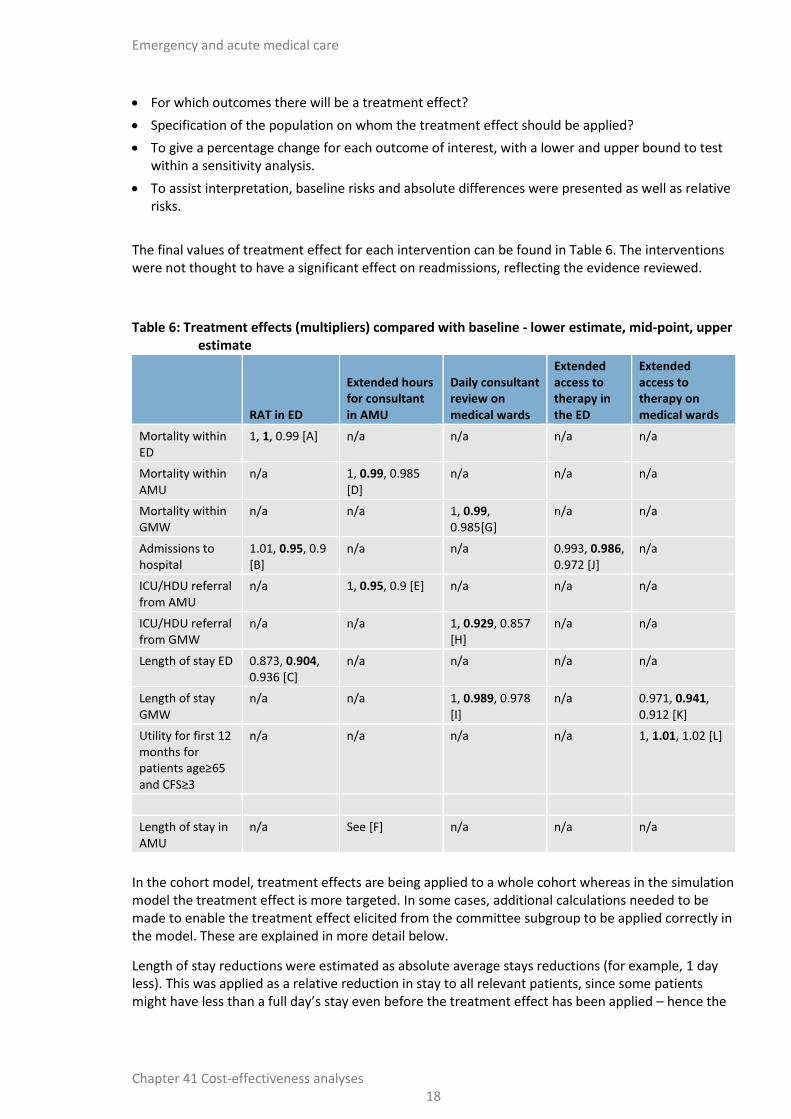
The final values of treatment effect for each intervention can be found in Table 6. The interventions were not thought to have a significant effect on readmissions, reflecting the evidence reviewed.
Table 6: Treatment effects (multipliers) compared with baseline - lower estimate, mid-point, upper estimate
RAT in ED
Extended hours for consultant in AMU
Daily consultant review on medical wards
Extended access to therapy in the ED
Extended access to therapy on medical wards
Mortality within ED
1, 1, 0.99 [A] n/a n/a n/a n/a
Mortality within AMU
n/a 1, 0.99, 0.985 [D]
n/a n/a n/a
Mortality within GMW
n/a n/a 1, 0.99, 0.985[G]
n/a n/a
Admissions to hospital
1.01, 0.95, 0.9 [B]
n/a n/a 0.993, 0.986, 0.972 [J]
n/a
ICU/HDU referral from AMU
n/a 1, 0.95, 0.9 [E] n/a n/a n/a
ICU/HDU referral from GMW
n/a n/a 1, 0.929, 0.857 [H]
n/a n/a
Length of stay ED 0.873, 0.904, 0.936 [C]
n/a n/a n/a n/a
Length of stay GMW
n/a n/a 1, 0.989, 0.978 [I]
n/a 0.971, 0.941, 0.912 [K]
Utility for first 12 months for patients age≥65 and CFS≥3
n/a n/a n/a n/a 1, 1.01, 1.02 [L]
Length of stay in AMU
n/a See [F] n/a n/a n/a
In the cohort model, treatment effects are being applied to a whole cohort whereas in the simulation model the treatment effect is more targeted. In some cases, additional calculations needed to be made to enable the treatment effect elicited from the committee subgroup to be applied correctly in the model. These are explained in more detail below.
Length of stay reductions were estimated as absolute average stays reductions (for example, 1 day less). This was applied as a relative reduction in stay to all relevant patients, since some patients might have less than a full day’s stay even before the treatment effect has been applied – hence the

Emergency and acute medical care
Chapter 41 Cost-effectiveness analyses 19
effects in Table 6 are expressed as multipliers. For example, 0.84 represents a 16% reduction in length of stay – see Appendix F for details.
41.2.5.1 RAT in the ED
[A] – Mortality within ED
Mortality within ED is mostly prevalent in resuscitation patients who do not normally come through RAT. The RAT intervention affects majors patients only and therefore there was unlikely to be a substantial mortality effect. However, a small decrease in mortality of 1 in 100 (RR=0.99) has been included for the optimistic treatment effect analysis. This treatment effect is applied to ED mortality only. The probability of dying in the ED was found to be 0.1%. Therefore, applying the treatment effect of 0.99 reduces this probability to 0.099%. With this treatment effect applied, for every 100,000 patients that go through the ED you would expect to prevent one death.
[B] – Admissions
A midpoint of 1 in 20 patients avoiding admission was agreed (RR=0.95). It was agreed that the range around the effect size should include the possibility of increasing admissions. The admissions avoided would be those where patients are admitted to AMU and subsequently discharged with a short length of stay.
[C] – ED length of stay
The presence of RATing would reduce the time to decision of admission or discharge. However, it was discussed that admitted patients might not see their overall length of stay change dependent on bed availability. This should be captured in the capacity of the model. 26.0% of patients in ED receive RAT, which was majors equating to 30.5% of ED patients - 41.2.4.2 multiplied by 85.4% arriving in service hours from the Portsmouth data). These patients would see an average decrease in time to decision of around 15 minutes (20-10 minute range). For our average length of stay of 157 minutes (41.2.4.3), this equates to treatment effect of 0.904 with an upper and lower range of 0.873- 0.936. As the main benefit of this treatment effect is to improve hospital flow it was omitted from the cohort model, as the impact of hospital flow is not captured.
41.2.5.2 Extended hours for consultants in AMU
[D] – Within AMU mortality
There would only be a small number of preventable deaths, as many deaths will be patients who are on end of life pathways. It was proposed that 1 in 100 (RR=0.99) reduction in mortality would be realistic. The effect will be applied to all AMU patients. This treatment effect is applied to AMU mortality only. The probability of dying in the AMU was found to be 0.94% in the Portsmouth hospital data analysis. Therefore, applying the risk ratio of 0.99 reduces this probability to 0.93%. With this treatment effect applied, for every 10,000 patients that go through the AMU you would expect to prevent one death.
[E] – Adverse events (admissions to ICU/HDU directly from AMU)
The treatment effect will only be applied to those that enter the AMU during extended hours 6pm – 10pm weekday, 8am – 10pm weekend). It was agreed that for these patients, of those that would have been referred to ICU/HDU, 1 in 20 would be avoided.
[F] – Length of stay in AMU (earlier discharge)
It was decided to break this down into 2 parts:

Emergency and acute medical care
Chapter 41 Cost-effectiveness analyses 20
1. Some patients who arrive during extended hours can be discharged a day earlier as a consequence of being seen earlier.
o 1 in 15 of all such patients could avoid an overnight stay (1 in 30 in the conservative analysis and 1 in 10 in the optimistic analysis)
o Those that benefit are under age 65 and are being discharged the next day to usual residence may.
2. Some patients who can be discharged hours earlier due to earlier testing/cancelled unnecessary tests.
o Patients who are admitted to AMU during extended hours, are under age 65 and are being discharged the next day to usual residence will have reduced length of stay if they are not discharged a day earlier, as above.
o 1 hour reduction (0.5 in the conservative analysis and 2 in the optimistic analysis).
41.2.5.3 Daily consultant review on medical wards
All these treatment effects apply to everyone who receives the intervention, therefore no adjustments need to be made to the MS Excel cohort model:
[G] – Mortality within GMW
It was felt that daily consultant reviews would prevent only a small number of deaths on the GMW. It was proposed that 1 in 100 (0.99) reduction in mortality would be realistic. The effect was applied to all GMW patients. This treatment effect is applied to GMW mortality only. The probability of dying in the GMW was found to be 6.35% in the Portsmouth data analysis (41.2.4.4). Therefore, applying the treatment effect of 0.99 reduces this probability to 6.29%. With this treatment effect applied, for every 10,000 patients that go through the AMU you would expect to prevent 6 deaths.
[H] – Adverse events (admission to ICU/HDU directly from GMW)
The consensus was that 1 in 14 referrals to ICU/HDU would be avoided (1 in 7 in the optimistic treatment effects sensitivity analysis and 0 in the conservative treatment effects analysis).
[I] – Length of stay on GMW
It was agreed that there would be a 1-day reduction in length of stay for 1 in 10 patients (24 * 0.1 = 2.4 hours) in the base case and 1 in 5 patients for the optimistic treatment effects sensitivity analysis. There would be a partial effect in the control arm where consultant review takes place 2 days a week, therefore the net effect was 2.4 * (5/7) = 1.7 hours.
41.2.5.4 Extended access to therapy in the ED
[J] – Admissions
The committee expected 1-2 admissions to be avoided per day for a hospital with 250 ED presentations per day. This is the equivalent of preventing 4-8 admissions per 1000 ED attendances. In the base case, it was assumed that 4 admissions would be averted (8 in the optimistic treatment effects analysis and 2 in the conservative analysis).
The patients benefiting would be those with a CFS 3-6, NEWS 0-1, and who would have had a short length of stay.

Emergency and acute medical care
Chapter 41 Cost-effectiveness analyses 21
Patients avoiding admission continue to sample their post-discharge outcomes as if they were admitted patients. This is done to avoid an effect on post-discharge outcomes by avoiding admission not intended by the intervention scenario.
41.2.5.5 Extended access to therapy on medical wards
[K] –Length of stay
It was agreed that patients on the GMW with CFS ≥3, age over 65 and being discharged would see a stay reduction of 1 day on average (0.5 to 1.5 days in sensitivity analyses).
[L] – Quality of life
It was agreed that there would be an increase of 1% in quality of life for patients on the GMW with CFS ≥3, age over 65 and being discharged to their usual place of residence from the GMW that would last for 1 year.
41.2.6 Life expectancy
Where interventions prolong life, it is good practice for economic evaluations to use a lifetime horizon. To calculate QALYs using a lifetime horizon requires estimation of survival beyond discharge from hospital.
41.2.6.1 Literature review
No study included within the guideline reviews reported survival rates for an undifferentiated AME population beyond 30 days.
A systematic search was conducted with the aim of finding long-term survival outcomes for a generic population. We were specifically interested in survival numbers/rates, survival curves or standardised mortality ratios (SMRs). An SMR is equal to the number of deaths in an AME population divided by deaths in the general population with the same age/sex distribution.
The search retrieved 1187 records. Titles and abstracts were sifted with the following exclusions:
Publication date prior to 2006 (a 10 year publication cut off).
Studies where population was not from North America, Australia or Europe.
Studies with no indication from abstract or title that the population has had an acute event/emergency (that is, simply focused on chronic management).
Studies looking at very specific subpopulations of 1 condition, that is, after a specific surgery, with a particular complication.
Studies that had follow-up of less than 1 year.
From the search, only 1 paper was retrieved that reported long term survival of a generic AME population group.171 A search on Google Scholar, PubMed and the journal’s website for all citing papers retrieved a further 14 English language results, only 1 of which reported relevant outcomes for a non-condition specific medical emergency population.72,73
The first study, a Swedish retrospective cohort study reported standardised mortality ratios for a population of non-surgical patients admitted after visiting the ED (n =6,263).171 Data was collected between 1995 and 1996, with follow up 10 years (median 9.6 years). The mean age of the cohort was 62.6. The main causes of death (SMR) were related to seizures (2.62), intoxications (2.51), asthma-like symptoms (1.84), hyperglycaemia (1.67) and chest pain (1.2). Authors note that reference

Emergency and acute medical care
Chapter 41 Cost-effectiveness analyses 22
population has lower than typical mortality for Sweden. The reported in-hospital mortality rate was 5.20%.
The second study, an Icelandic retrospective 6 year cohort study, reports standardised mortality ratios of a population of patients attending ED (n =19,259), with findings stratified by age and sex.72,73 The hazard ratio calculated for the age group 80 to 84 was 1.33; however, for younger ages the hazard ratio was considerably higher. Data was collected between 1995 and 2001, with follow up at death or at study end for enrolled patients. The main causes of death (percent of all causes of death) were related to malignant neoplasm (32%), ischaemic heart disease (21%), cerebrovascular disease (10%) and chronic lower respiratory disease (5%).
To calculate survival curves we chose to use the SMRs from the Icelandic study since they were based on a larger cohort and were age group-specific, and therefore survival can be tailored more distinctly to case-mix and individual patients within the simulation model– see Table 7. Iceland has longer life expectancy than England therefore, we would expect crude mortality rates to be lower but it is not clear whether the SMRs would be an under or over-estimate.
Table 7: Aggregated standardised mortality ratios after an AME from Gunnarsdottir et al (2012) n=19,259
Age group Observed deaths Expected deaths for general population (Iceland) SMR
18 to 44 94 23.9 3.94
45 to 64 325 106.0 3.07
65 to 74 439 214.2 2.05
75 to 84 693 486.3 1.43
85 to 104 554 296.3 1.87
41.2.6.2 Analysis of 90-day mortality using HES linked to ONS mortality
NHS digital has published linked HES-ONS mortality data aggregated by primary diagnosis (3 character ICD10). This reports mortality at 30, 60 and 90 days post admission for admitted patients in 1617 diagnostic categories:
http://content.digital.nhs.uk/article/2677/Linked-HES-ONS-mortality-data
The most recent year published is 2013-2014:
http://content.digital.nhs.uk/catalogue/PUB16081
We used this published data to calculate standardised mortality ratios (SMRs) for the first 90 days after admission for an adult AME by taking the following steps:
1. Removed diagnostic categories where emergency<50% or adult<50%.
2. Removed diagnostic categories which are non-medical (for details see below).
3. Added up number of deaths at each time point across the categories (a).
4. Extracted the age-sex profile of each included category.
a. Had to assume sex split was the same for each age group (within a diagnostic category).
5. Calculated the expected deaths from ONS England life table for each age-sex group.143
6. Added up number of expected deaths across all categories and all age-sex groups (b).
7. Calculated the standardised mortality ratio SMR=a/b and 95% confidence intervals.66
To remove diagnostic categories that would not normally be dealt with through the adult medical pathway (trauma, surgery, gynaecology/obstetrics, paediatrics and psychiatry) – step 2 - 3 physicians
Emergency and acute medical care
Chapter 41 Cost-effectiveness analyses 23
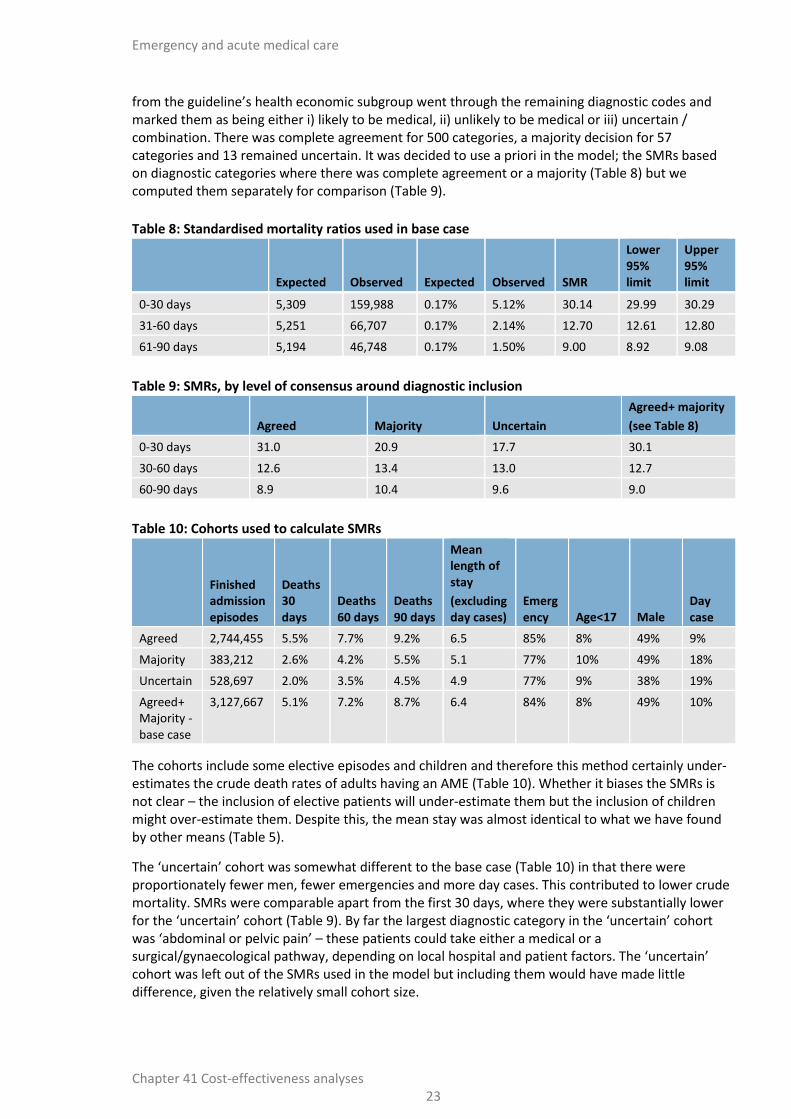
from the guideline’s health economic subgroup went through the remaining diagnostic codes and marked them as being either i) likely to be medical, ii) unlikely to be medical or iii) uncertain / combination. There was complete agreement for 500 categories, a majority decision for 57 categories and 13 remained uncertain. It was decided to use a priori in the model; the SMRs based on diagnostic categories where there was complete agreement or a majority (Table 8) but we computed them separately for comparison (Table 9).
Table 8: Standardised mortality ratios used in base case
Expected Observed Expected Observed SMR
Lower 95% limit
Upper 95% limit
0-30 days 5,309 159,988 0.17% 5.12% 30.14 29.99 30.29
31-60 days 5,251 66,707 0.17% 2.14% 12.70 12.61 12.80
61-90 days 5,194 46,748 0.17% 1.50% 9.00 8.92 9.08
Table 9: SMRs, by level of consensus around diagnostic inclusion
Agreed Majority Uncertain
Agreed+ majority
(see Table 8)
0-30 days 31.0 20.9 17.7 30.1
30-60 days 12.6 13.4 13.0 12.7
60-90 days 8.9 10.4 9.6 9.0
Table 10: Cohorts used to calculate SMRs
Finished admission episodes
Deaths 30 days
Deaths 60 days
Deaths 90 days
Mean length of stay
(excluding day cases)
Emergency Age<17 Male
Day case
Agreed 2,744,455 5.5% 7.7% 9.2% 6.5 85% 8% 49% 9%
Majority 383,212 2.6% 4.2% 5.5% 5.1 77% 10% 49% 18%
Uncertain 528,697 2.0% 3.5% 4.5% 4.9 77% 9% 38% 19%
Agreed+ Majority -base case
3,127,667 5.1% 7.2% 8.7% 6.4 84% 8% 49% 10%
The cohorts include some elective episodes and children and therefore this method certainly under-estimates the crude death rates of adults having an AME (Table 10). Whether it biases the SMRs is not clear – the inclusion of elective patients will under-estimate them but the inclusion of children might over-estimate them. Despite this, the mean stay was almost identical to what we have found by other means (Table 5).
The ‘uncertain’ cohort was somewhat different to the base case (Table 10) in that there were proportionately fewer men, fewer emergencies and more day cases. This contributed to lower crude mortality. SMRs were comparable apart from the first 30 days, where they were substantially lower for the ‘uncertain’ cohort (Table 9). By far the largest diagnostic category in the ‘uncertain’ cohort was ‘abdominal or pelvic pain’ – these patients could take either a medical or a surgical/gynaecological pathway, depending on local hospital and patient factors. The ‘uncertain’ cohort was left out of the SMRs used in the model but including them would have made little difference, given the relatively small cohort size.

Emergency and acute medical care
Chapter 41 Cost-effectiveness analyses 24
41.2.6.3 Calculating survival curves
A typical cohort model might use the mean age of the population and calculate life-years (mean survival) accordingly. However, for a patient level simulation, the expected life expectancy of an individual patient respective to their age (and case-mix) is required. In our models, therefore, expected life years and QALYs were modelled for each age between 18 and 100.
In the cohort models, life years and QALYs found for each specific age were then weighted by the age distribution of the population to find the expected average QALY for the cohort. Similarly, in the simulation model, the QALYs accrued by each patient are aggregated to find an average for the population.
Our approach was to produce survival curves for each age by multiplying together mortality rates taken from national life tables for England143 with standardised mortality ratios (SMRs) for AME patients.
For all patients we used the SMRs in Table 8 for the first 90 days and then thereafter the age-specific SMRs in Table 7. To verify this approach we compared the 30-day mortality from our baseline model, 4.0%, with a published estimated for England based on 12.7 million ED attendances between April 2013 and February 2014, 4.3%118. We considered this to be reasonably close.
Figure 1 shows an example survival curve for a person aged 85 after an AME using this method compared with the general population of the same age. We calculate life-years as the area under the curve.
Figure 1: Survival of an 85-year-old after admission for an AME
41.2.6.4 Capturing frailty
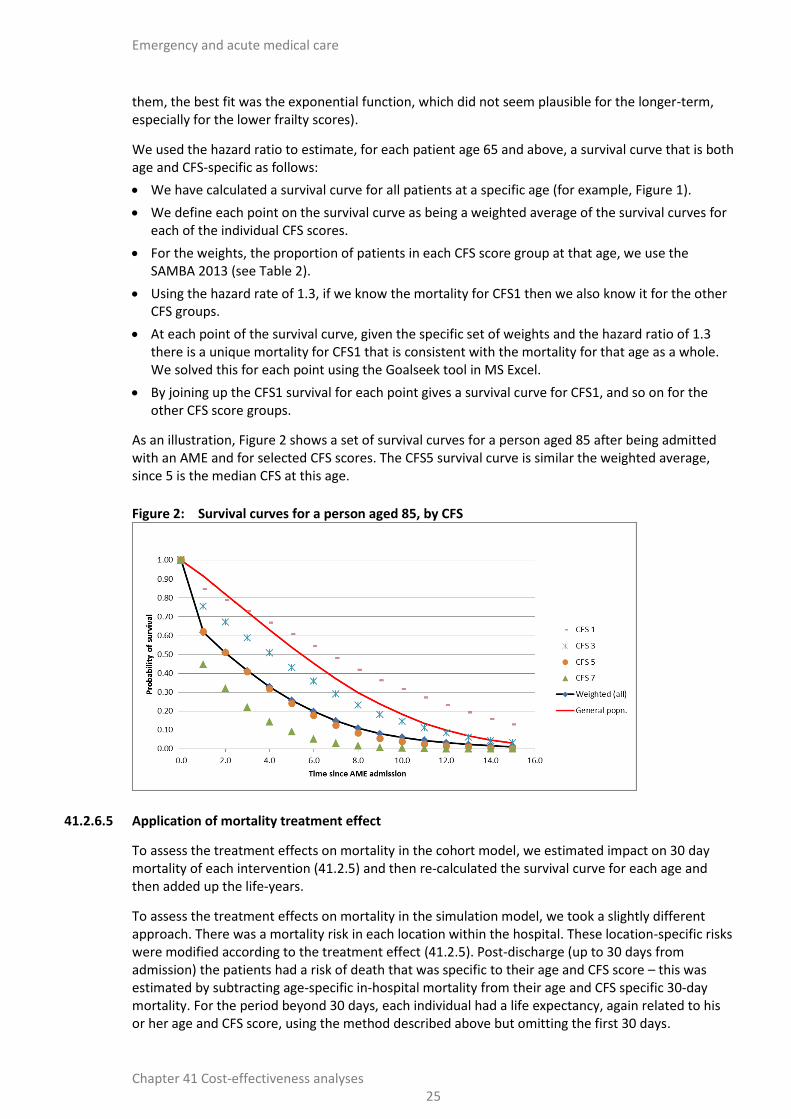
Figure 1 shows estimated survival for the cohort as a whole but some of the interventions we are evaluating are targeted at the frail elderly. The survival for these patients will be poorer than that for a similar cohort who are not frail. To avoid over-estimating QALYs gained, we attempted to estimate survival curves that were both age-specific and frailty-specific. As noted above, we have used the Clinical Frailty Score, since this has been used in the Society for Acute Medicine’s benchmarking audits – see 41.2.3. Rockwood and colleagues163 analysed survival for a sample of 2305 elderly patients who participated in the second stage of the Canadian Study of Health and Aging (CSHA). They were aged over 65 (mean age 85). They estimated a mortality hazard ratio of 1.3 for each increment on the CFS (note that they also showed Kaplan-Meir curves for the cohort as a whole but we could not use these directly since, follow-up was only for 5 years and when we fitted curves to
Emergency and acute medical care
Chapter 41 Cost-effectiveness analyses 25
them, the best fit was the exponential function, which did not seem plausible for the longer-term, especially for the lower frailty scores).
We used the hazard ratio to estimate, for each patient age 65 and above, a survival curve that is both age and CFS-specific as follows:
We have calculated a survival curve for all patients at a specific age (for example, Figure 1).
We define each point on the survival curve as being a weighted average of the survival curves for each of the individual CFS scores.
For the weights, the proportion of patients in each CFS score group at that age, we use the SAMBA 2013 (see Table 2).
Using the hazard rate of 1.3, if we know the mortality for CFS1 then we also know it for the other CFS groups.
At each point of the survival curve, given the specific set of weights and the hazard ratio of 1.3 there is a unique mortality for CFS1 that is consistent with the mortality for that age as a whole. We solved this for each point using the Goalseek tool in MS Excel.
By joining up the CFS1 survival for each point gives a survival curve for CFS1, and so on for the other CFS score groups.
As an illustration, Figure 2 shows a set of survival curves for a person aged 85 after being admitted with an AME and for selected CFS scores. The CFS5 survival curve is similar the weighted average, since 5 is the median CFS at this age.
Figure 2: Survival curves for a person aged 85, by CFS
41.2.6.5 Application of mortality treatment effect
To assess the treatment effects on mortality in the cohort model, we estimated impact on 30 day mortality of each intervention (41.2.5) and then re-calculated the survival curve for each age and then added up the life-years.
To assess the treatment effects on mortality in the simulation model, we took a slightly different approach. There was a mortality risk in each location within the hospital. These location-specific risks were modified according to the treatment effect (41.2.5). Post-discharge (up to 30 days from admission) the patients had a risk of death that was specific to their age and CFS score – this was estimated by subtracting age-specific in-hospital mortality from their age and CFS specific 30-day mortality. For the period beyond 30 days, each individual had a life expectancy, again related to his or her age and CFS score, using the method described above but omitting the first 30 days.

Emergency and acute medical care
Chapter 41 Cost-effectiveness analyses 26
41.2.7 Utilities
41.2.7.1 Identification of relevant evidence
Three systematic searches were conducted to find appropriate utilities to populate the model. The first was conducted for a general AME population and returned 662 titles, of which 12 papers were found to be suitable for review.3,9,45,60,67,85,86,164,170,175,192,193 The second search conducted aimed at finding any utilities reported for a population stratified by clinical frailty score. Of the 6 titles returned, 1 paper was reviewed for relevance.12 The third search conducted aimed to find any utilities reported for a population stratified by NEWS, no titles were returned.
Of the 13 studies identified for relevance:
Six studies were excluded due to poor applicability or quality that is, inappropriate quality of life measure employed.45,60,85,86,175,193
Two studies were conducted in the UK, both reporting EuroQol 5-Dimensions (EQ5D):
o Goodacre et al. 2012 reports on quality of life experienced 30 days after admission by admitted patients who arrived by ambulance.67
o Round et al. 2004 reports quality of life at presentation and at 6 months for patients aged 70 and over who have experienced acute care.164
Two European studies report quality of life specifically for patients who have had an ICU admission, both reporting the EQ5D:
o Sacanella et al. 2011 (Spain) reports on patients experiencing a medical condition and ICU aged 65 and over at the study start, discharge and 12 months.170
o Vainiola et al. 2011 (Finland) reports quality of life for emergency patients admitted to ICU/HDU at 6 and 12 months post treatment, stratifying by age.192
Three studies could be considered for longer term quality of life, all reporting use of EQ5D:
o Bagshaw et al. 2014 (USA) reports quality of life experienced by people who had a critical care admission and stratifies by clinical frailty score.12
o Ara and Brazier. 2011 (UK) report condition specific quality of life, stratified by age, using health surveys.9
o Agborsangaya et al. 2013 (Canada) report quality of life experienced by people with a chronic condition within the last 12 months.3 This study was selectively excluded in light of similar evidence for a UK population.9
The reviewed quality of life papers are also summarised in Table 11 with rationale for inclusion and exclusion.

Emergen
cy and
acute m
edical care
Ch
apte
r 41
Co
st-effectiveness an
alyses 2
7
Table 11: Summary of utility evidence Study Country Population Year of
data Quality of life meausre
Follow up Sample size
Stratification of findings
Inclusion?
AGBORSANGAYA20133
Canada Random sample from a community population with 16 common self-reported chronic conditions
NR EQ5D health over last 12 months
4946 By condition, level of multi-morbidity, age, gender
Selectively excluded in light of Ara 2011
ARA20119 UK General population - Health Survey for England
2003-6 EQ-5D Cross-sectional study
41,174 Presence/absence of a chronic condition
Inclusion for long term quality of life
BAGSHAW201412
USA Critical care patients age >=50 2010 EQ5D VAS and SF12
6 months and 12 months
421 By clinical frailty score and age
Inclusion for long term quality of life
COURTNEY200945
Australia Patients with an acute medical admission age≥65 with at least one risk factor for readmission
2004 to 2006
SF12 4, 12 and 24 weeks
128 NR Excluded due to utility measure employed
ERIKSEN199860
Norway Admitted patients 1993
Experts determined score
6 weeks 479 NR Excluded due to utility measure employed
GOODACRE201267
UK Admitted to hospital by ambulance 2007 to 2008
EQ5D 30 days after admission
3028 by age, gender, condition
Inclusion for post-acute phase
HUTCHINSON201385
Australia Patients with comorbid chronic condition
2007 to 2009
AQOL questionnaire shortly after first visit
210 Excluded due to utility measure employed
HUTCHINSON201586
Australia Patients with chronic condition at high risk of emergency admission
2007-2012 AQOL questionnaire shortly after first visit
1999 Excluded due to utility measure employed
ROUND2004164
UK Patients with age>= 70 and experiencing acute care
prospective cohort - 1999-2000
SF36 and EQ5D Time zero, 6 months post admission
367 at time zero, 254 at 6 mo
community versus district general hospital
Inclusion for subgroup of patients over 70.
SACANELLA2011170
Spain Patients with age>= 65 admitted to ICU with medical condition
NR EQ5D Time zero, discharge, 12 months
112 For ages 65-74 and 75 +
Selective exclusion in light of Bagshaw et al. which stratifies by CFS
SAUKKONEN2006175
Finland Medical ICU patients 2002-2004
15 D 6 months post ICU admission
1167 ED versus non ED patients going to MICU
Exclude due to QoL measure employed
VAINIOLA2011192
Finland Emergency patients admitted to ICU/HDU
2003 and 2004
EQ5D and 15D 6 and 12 months post treatment
937 By presentation Selective exclusion in light of Bagshaw et al. which

Emergen
cy and
acute m
edical care
Ch
apte
r 41
Co
st-effectiveness an
alyses 2
8
Study Country Population Year of data
Quality of life meausre
Follow up Sample size
Stratification of findings
Inclusion?
stratifies by CFS
VEDIO2000 Vedio, 2000 VEDIO2000 /id
UK Patients discharged from ICU 1994-5 SF36 6 months 115 Medical / surgical admissions
Excluded because of outcome measure
Emergency and acute medical care
Chapter 41 Cost-effectiveness analyses 29
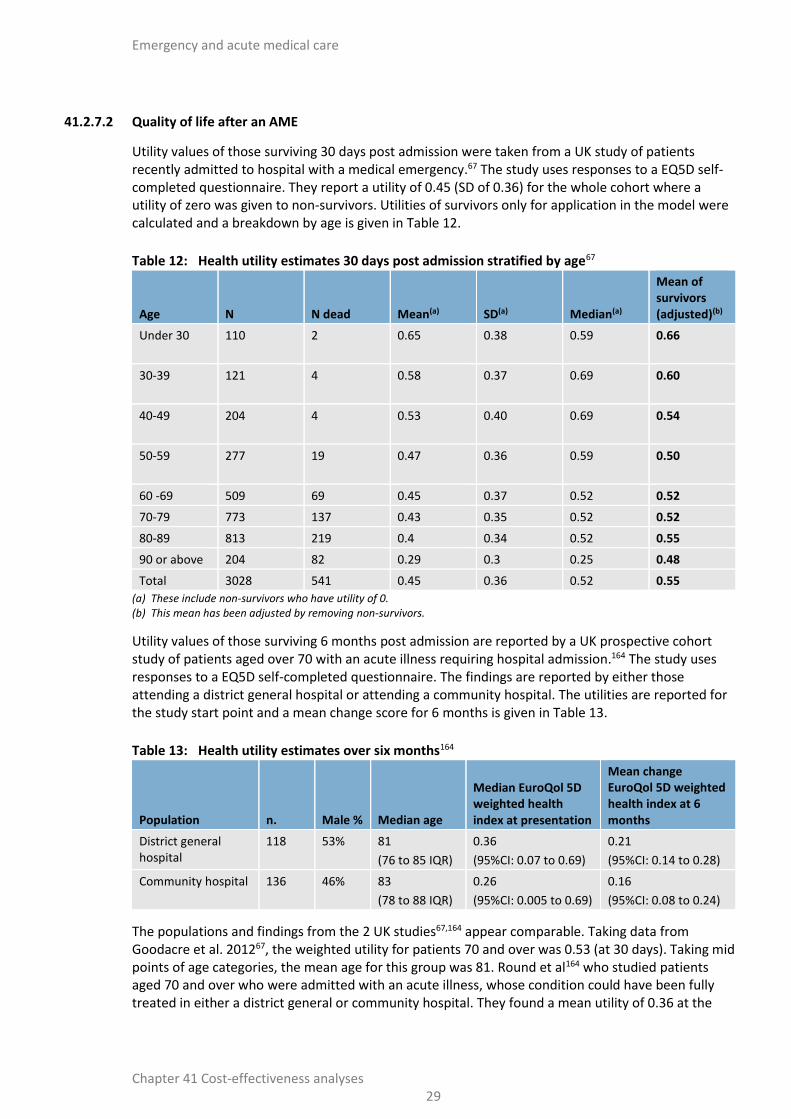
41.2.7.2 Quality of life after an AME
Utility values of those surviving 30 days post admission were taken from a UK study of patients recently admitted to hospital with a medical emergency.67 The study uses responses to a EQ5D self-completed questionnaire. They report a utility of 0.45 (SD of 0.36) for the whole cohort where a utility of zero was given to non-survivors. Utilities of survivors only for application in the model were calculated and a breakdown by age is given in Table 12.
Table 12: Health utility estimates 30 days post admission stratified by age67
Age N N dead Mean(a) SD(a) Median(a)
Mean of survivors (adjusted)(b)
Under 30
110 2 0.65 0.38 0.59
0.66
30-39
121 4 0.58 0.37 0.69 0.60
40-49
204 4 0.53 0.40 0.69 0.54
50-59
277 19 0.47 0.36 0.59 0.50
60 -69 509 69 0.45 0.37 0.52 0.52
70-79 773 137 0.43 0.35 0.52 0.52
80-89 813 219 0.4 0.34 0.52 0.55
90 or above 204 82 0.29 0.3 0.25 0.48
Total 3028 541 0.45 0.36 0.52 0.55
(a) These include non-survivors who have utility of 0. (b) This mean has been adjusted by removing non-survivors.
Utility values of those surviving 6 months post admission are reported by a UK prospective cohort study of patients aged over 70 with an acute illness requiring hospital admission.164 The study uses responses to a EQ5D self-completed questionnaire. The findings are reported by either those attending a district general hospital or attending a community hospital. The utilities are reported for the study start point and a mean change score for 6 months is given in Table 13.
Table 13: Health utility estimates over six months164
Population n. Male % Median age
Median EuroQol 5D weighted health index at presentation
Mean change EuroQol 5D weighted health index at 6 months
District general hospital
118 53% 81
(76 to 85 IQR)
0.36
(95%CI: 0.07 to 0.69)
0.21
(95%CI: 0.14 to 0.28)
Community hospital
136 46% 83
(78 to 88 IQR)
0.26
(95%CI: 0.005 to 0.69)
0.16
(95%CI: 0.08 to 0.24)
The populations and findings from the 2 UK studies67,164 appear comparable. Taking data from Goodacre et al. 201267, the weighted utility for patients 70 and over was 0.53 (at 30 days). Taking mid points of age categories, the mean age for this group was 81. Round et al164 who studied patients aged 70 and over who were admitted with an acute illness, whose condition could have been fully treated in either a district general or community hospital. They found a mean utility of 0.36 at the

Emergency and acute medical care
Chapter 41 Cost-effectiveness analyses 30
start of the study (timing was undefined) and 0.57 at 6 months post admission. The median age of participants was 81.
A US study reports utility values for a population of critically ill patients, stratifying by clinical frailty score.12 This study reported EuroQol visual analogue scale scores for each of 2 groups based on clinical frailty scores: 1 group with a score from 1 to 4 and the other group with a score greater than 4, representing the most frail group. We noted that those who have a CFS score > 3 have a utility 21% lower than the utility of those who were considered non-frail.
Table 14: Utilities by Clinical Frailty Scale score at 6 months12
CFS score
1-4 Non-frail 5-9 Frail
Mean age 66 (SD ±10) 69 (SD ±10)
At 6months
n = 195 67
Utility 0.65 (SD ±19) 0.52 (SD ±22)
At 12 months
n = 170 59
Utility 0.68 (SD ±18) 0.54 (SD ±23)
41.2.7.3 Quality of life by age for people with chronic condition
Ara and Brazier9 report expected utilities stratified by age group and common health conditions for a UK population (Table 15). Utilities for a patient population without a history of any health condition are reported for comparison.

Emergency and acute medical care
Chapter 41 Cost-effectiveness analyses 31
Table 15: Quality of life by age for the general population – with and without a history of a health condition. Ara and Brazier.9
Age Band (years) N mean
95% CI
of mean n mean
95% CI
of mean
History of health condition No history of health condition
n = 41147 n=22449
<30 8083 0.9383 (0.935,0.941)
6269 0.9633 (0.960,0.965)
30 to ≤ 35 3608 0.9145 (0.907,0.921)
2555 0.9564 (0.951,0.961)
35 to ≤ 40 4020 0.9069 (0.900,0.913)
2675 0.9544 (0.950,0.958)
40 to ≤ 45 3746 0.8824 (0.872,0.891)
2376 0.9513 (0.946,0.956)
45 to ≤ 50 3294 0.8639 (0.852,0.875)
1892 0.943 (0.936,0.949)
50 to ≤ 55 3156 0.8344 (0.824,0.843)
1555 0.9345 (0.927,0.941)
55 to ≤ 60 3285 0.8222 (0.811,0.833)
1400 0.9296 (0.914,0.944)
60 to ≤ 65 2739 0.8072 (0.793,0.821)
1017 0.9373 (0.928,0.946)
65 to ≤ 70 2993 0.8041 (0.790,0.817)
992 0.9331 (0.921,0.944)
70 to ≤ 75 2501 0.779 (0.766,0.791)
741 0.9219 (0.909,0.934)
75 to ≤ 80 1895 0.7533 (0.739,0.767)
522 0.8965 (0.881,0.911)
80 to ≤ 85 1199 0.6985 (0.677,0.719)
301 0.8844 (0.866,0.902)
>85 655 0.6497 (0.624,0.675)
154 0.8191 (0.784,0.853)
41.2.7.4 Application of utility data in the baseline scenario
Three studies were used to estimate baseline quality of life.
Goodacre et al. 201267 reports applicable and complete data for quality of life experienced 30 days after admission by patients arriving by ambulance, however, the study did not report change in quality of life overtime.
Bagshaw et al. 201412 indicates the difference in utility between frail and non-frail patients.
Ara and Brazier 20119 provide utilities by age group for people with chronic conditions.
Ara and Brazier9 report condition specific quality of life, stratified by age, using health surveys in a UK population. These represent upper estimates of long-term utility after an AME. We use these for utility for non-frail patients. Using this data, quality of life declines over time as the patient gets older. The committee were aware that for some patients, quality of life declines significantly after an AME, whereas others return to their usual quality of life. It is assumed in the model that those who are considered frail (CFS≥5) will have no utility improvement after an AME. Those who are not frail

Emergency and acute medical care
Chapter 41 Cost-effectiveness analyses 32
will have their utility linearly improve to the average age-specific quality of life described in Ara and Brazier9 for an individual with a health condition 1 year post AME.
Taking the above into account, the baseline utility used in the model is age dependent and informed by the proportion of that age group that are considered frail upon admission:
Depending on the individual’s age, a utility value is taken from Goodacre et al, as described in Table 12.
As this value represents the average utility for both frail and non-frail, it is then adjusted based on the assumption that those who are frail have a quality of life 23% lower than those who are not frail, as described in Bagshaw et al.
If the individual is not frail then their quality of life will increase at a linear rate until 1 year when it reaches the age-specific quality of life of the general population, with a health condition, as described in Table 16.
As the patient gets older, their quality of life changes in line with the values presented in Ara and Brazier but with the smoothing applied.
If the patient is frail, it is assumed that their quality of life will remain unchanged for the remainder of their life.
This approach is illustrated in if the individual is not frail then their quality of life will increase at a linear rate until 1 year when it reaches the age-specific quality of life of the general population with a health condition, as described in Table 16.
Table 16: Utility over time in the baseline scenario for patient age 80
Frailty (%)
Non-Frail
CFS 1-4 (58%)
Frail
CFS 5+
(42%) Weighted average (a)
Presentation 0.600 0.476 0.547
30 days 0.610 0.476 0.553
90 days 0.620 0.476 0.559
6 months 0.630 0.476 0.565
1 year 0.723 0.476 0.618
2 years 0.718 0.476 0.615
5 years 0.716 0.476 0.587
10 years 0.701 0.476 0.563
(a) [utility (non-frail) x (% non-frail)] +[ (utility (frail) x (% frail)] = weighted average
41.2.7.5 Application of the quality of life treatment effect
The treatment effect for extended access to physiotherapy and occupational therapy was elicited from the experts of the committee’s health economics subgroup. These were multipliers and were applied for 1 year only in the base case analysis and for 5 years in a sensitivity analysis.
41.2.7.6 Quality of life within hospital
The models do not take into account incremental quality of life within the hospital period explicitly. There was no evidence for in-hospital quality of life improvement for the interventions we looked at and a modest gain in quality of life over the course of an admission would have a negligible impact on the long-term QALYs. To avoid over-estimating the benefits of reduced length of stay, we assumed the same utility in hospital as post-discharge up to 90 days.

Emergency and acute medical care
Chapter 41 Cost-effectiveness analyses 33
41.2.8 Resource use and costs
Costs of the different types of resource use, such as staff time, are taken from standard NHS sources.
41.2.8.1 Intervention (Staff) costs
Table 17gives details of the staff time in the interventions, as decided by the Guideline’s health economics subgroup.
Table 17: Staff time
Description Baseline Intervention
RAT in the ED
Time spent with patient This service is currently not provided
15 minutes
Staff member(s) involved 1 consultant
AMU consultant review
Time spent with patient 20 minutes
Staff member(s) involved 1 consultant
Consultant review on medical wards
Consultant reviews per patient per week 2 7
How long will each review take? 15 minutes - first review
10 minutes - subsequent
15 minutes – first review
10 minutes - second review
5 minutes - subsequent reviews
Staff member(s) involved 1 consultant 1 consultant AND
2 junior doctors* and 1 nurse*
Therapy in the ED
Time spent with patient 45 minutes
Staff member(s) involved occupational or physiotherapist (80% of the time)
assistant (20% of the time)
Therapy on medical wards
Time spent with patient 30 minutes review every day
Staff member(s) involved occupational or physiotherapist (59% of the time) assistant (12% of the time) ward nurse (29% of the time)
* Costed only at the weekend because it’s considered that they would be present for ward rounds in the week for both scenarios.
The unit cost of staff were reported by the Personal and Social Services Research Unit.50 These costs were adjusted to reflect on-call salary enhancements and whether the work was in premium or non-premium time. Standard NHS contract policy documents were consulted to determine any additional cost associated with out of hours and premium time, inclusive of enhancements to salary due to rota and on-call arrangements.137-140 Since most of the interventions involve extending services further in to unsocial hours, it is important to capture the incremental costs associated with these hours. The full break down of these costs is shown in Table 18 and Table 19.

Emergen
cy and
acute m
edical care
Ch
apte
r 41
Co
st-effectiveness an
alyses 3
4
Table 18: annual wage costs used in the models
Member of staff Band/level
On-call salary enhancement Wages
Wages (with on-call salary enhancement)
Hospital physiotherapist 6 3.00% £31,351 £31,978
Hospital occupational therapist 6 3.00% £31,351 £31,978
Hospital support worker 4 3.00% £21,413 £21,841
Nurse 6 3.00% £32,114 £32,756
Consultant Medical 5.00% £87,499 £90,124
Foundation Doctor Year 1 Foundation Doctor Year 1 4.00% £26,350 £26,350
StR CT1 StR CT1 4.00% £26,350 £26,350
Table 19: overhead costs associated with staff time
Member of staff Oncost: superannuation and national insurance
Qualification and ongoing training
Staff (direct) overhead (PSSRU 2016)
Non staff (indirect) overhead (PSSRU 2016) Capital Sum of additional costs
Hospital physiotherapist £7,235 £5,995 £9,427 £16,789 £4,672 £36,883
Hospital occupational therapist
£7,235 £5,995 £9,427 £16,789 £4,672 £36,883
Hospital support worker £4,587 £0 £6,353 £11,315 £4,104 £21,772
Nurse £7,439 £11,251 £9,663 £17,210 £3,065 £41,189
Consultant £22,427 £58,533 £26,777 £47,689 £5,295 £138,294
Foundation Doctor Year 1 £5,765 £24,295 £6,752 £12,026 £4,228 £47,301
StR CT1 £5,765 £24,295 £6,752 £12,026 £4,228 £47,301

Emergen
cy and
acute m
edical care
Ch
apte
r 41
Co
st-effectiveness an
alyses 3
5
Table 20: Cost of staff time
Hours worked per annum (PSSRU 2016)
Premium wage enhancement
Cost per hour – non-premium
Cost per hour –premium Premium time
Consultant 1838 33% increase £138 £159 Weekends and 7pm-7am
Junior doctor (registrar ST1) 2133 37% increase £59 Not used in model 9pm-7am daily
Junior doctor (foundation year 1) 2037 37% increase £38 Not used in model
Therapist (band 6) 1603 30% increase (60% for Sundays)
£48 £55 (Sunday £63) Weekends and 6am-8pm
Therapy assistant (band 4) 1592 37% increase (74% for Sundays)
£30 £37 (Sunday £41)
Ward nurse (Band 6) 1573 30% increase (60% for Sundays)
£48 £55 (Sunday £63)

Emergency and acute medical care
Chapter 41 Cost-effectiveness analyses 36
41.2.8.2 Pathway and downstream costs
The models analysed the subsequent impact on hospital costs associated with the interventions. Table 21 below details the unit costs used.
Table 21: Unit costs of health care
Model Unit cost Source & notes
Hospital bed day - all inpatient wards except ICU/HDU)
Cohort model & simulation model
£296 NHS Reference costs55
For non-elective excess bed days:
(Total cost of bed days / number of bed days) = £999,936,997 / 3,380,432
ICU/HDU attendance
Cohort model £5,207 NHS Reference costs55
Weighted average of: (cost of an ICU/HDU bed day for given service code) x (average length of stay for given service code) for NHS reference cost service codes: CCU01, CCU03, CCU05, CCU09, CCU10, CCU11, CCU90, CCU91.
ICU/HDU bed day Simulation model £1,262 NHS Reference costs55
ED attendance Cohort model & simulation model
£114 NHS Reference costs55
ED – not admitted
Weighted average cost of the following service codes:
T01NA, T02NA, T03NA, T04NA
Post-discharge cost Cohort model & simulation model
£2,107 PSSRU50
Short stay admission
Cohort model £588 Non-elective short stay
NHS Reference costs55
CDU visit Simulation model £192 NHS Reference costs55
ED – admitted
AAMU visit Simulation model £158 NHS Reference costs55
General medicine - outpatient
For post-discharge costs, we used the 3-month costs for patients followed up after being admitted to an AMU. In the base case analysis, we did not include other costs in extra months of life, since only disease-specific costs should be included in the NICE reference case. However, in a sensitivity analysis we included age-specific annual NHS costs calculated by the Nuffield Trust.16,162
41.2.9 Cost-effectiveness
The widely used cost-effectiveness metric is the incremental cost-effectiveness ratio (ICER). This is calculated by dividing the difference in costs associated with 2 alternatives by the difference in QALYs. The decision rule then applied is that if the ICER falls below a given cost per QALY threshold then the result is considered cost-effective. If both costs are lower and QALYs are higher, then the option is said to dominate and an ICER is not calculated.

Emergency and acute medical care
Chapter 41 Cost-effectiveness analyses 37
)()(
)()(
AQALYsBQALYs
ACostsBCostsICER
Where: Costs(A) = total costs for option A; QALYs(A) = total QALYs for option A
Cost-effective if:
ICER < Threshold
When there are more than 2 alternative comparators, options must be ranked in order of increasing cost then options ruled out by dominance or extended dominance before calculating ICERs excluding these options. An option is said to be ‘dominated’ and ruled out if another intervention is less costly and more effective. An option is said to be extendedly dominated if a combination of 2 other options would prove to be less costly and more effective.
It is also possible, for a particular cost-effectiveness threshold, to re-express cost-effectiveness results in term of ‘net benefit’. This is calculated by multiplying the total QALYs for a comparator by the threshold cost per QALY value (for example, £20,000) and then subtracting the total costs (formula below). The decision rule then applied is that the comparator with the highest net benefit is the most cost-effective option at the specified threshold. It provides the highest number of QALYs at an acceptable cost.
)()()( XCostsXQALYsXBenefitMonetaryNet
Where: λ = threshold (£20,000 per QALY gained)
Cost-effective if:
Highest net benefit
Both methods of determining cost-effectiveness will identify exactly the same optimal strategy. For ease of computation, net benefit is used in this analysis to identify the optimal strategy.
Results are also presented graphically where total costs and total QALYs for each diagnostic strategy are shown. Comparisons not ruled out by dominance or extended dominance are joined by a line on the graph where the slope represents the incremental cost-effectiveness ratio.
41.2.9.1 Interpreting the results
NICE’s report ‘Social value judgements: principles for the development of NICE guidance’133 sets out the principles that committees should consider when judging whether an intervention offers good value for money. In general, an intervention was considered cost-effective if either of the following criteria applied (given that the estimate was considered plausible):
The intervention dominated other relevant strategies (that is, it was both less costly in terms of resource use and more clinically effective compared with all the other relevant alternative strategies), or
The intervention costs less than £20,000 per quality-adjusted life-year (QALY) gained compared with the next best strategy.
Where we compare several interventions, we use the net benefit to rank the strategies based on their relative cost-effectiveness. The highest net benefit identifies the optimal strategy at a willingness to pay of £20,000 per QALY gained.
41.3 Cohort model methods
41.3.1 Approach to modelling
The model has a simple structure (Figure 3) but the calculations are stratified by age. For each scenario, the model runs first with a cohort of 18-year-old patients and then re-runs the analysis for every age up to 100 years old, increasing age by increments of one year each time. Each time, the

Emergency and acute medical care
Chapter 41 Cost-effectiveness analyses 38
model calculates the costs and QALYs for a cohort of 1,000 patients going through. At the end, the model weights the results for each age cohort based on the relevant age distribution.
The results of each scenario are compared to the Baseline scenario where none of the interventions takes place.
Figure 3: Cohort model structure
41.3.2 Interventions that take place in the emergency department
This section covers how the model calculates costs and QALYs for the following interventions:
RAT in the ED
Extended access to therapy in the ED
First, the model retrieves the case-mix (NEWS minus AVPU, CFS) of patients for a given age. Further details on how case mix is determined can be found in section 41.2.3. In the case of RAT, it depends on whether they come through majors.
Based on the case-mix, a proportion of patients will receive the intervention. Further details on the selection criteria for each intervention can be found in section 41.2.2. Two outcomes are determined by case-mix and by the proportion of patients receiving the intervention (see 41.2.5):
Admission.
30-day survival (for RAT in the optimistic treatment effects sensitivity analysis).

Emergency and acute medical care
Chapter 41 Cost-effectiveness analyses 39
The costs are calculated based on the number of patients who receive the intervention, the number of admissions and the number of survivors at 30 days. Details on costs can be found in section 41.2.7.6.
Lifetime QALYs are calculated for each age for those patients surviving 30 days. Hence, the QALYs depend on age, frailty and the proportion surviving at 30 days. Since mortality is unchanged by these 2 interventions, there is no improvement in QALYs in the base case. Further details on how survival and quality of life are determined can be found in section 41.2.6 and 41.2.7 respectively.
41.3.3 Interventions that take place in hospital wards
This section covers how the model calculates costs and QALYs for the following interventions: • Daily consultant review on medical wards.
• Extended hours consultants in AMU.
• Extended access to therapy on medical wards.
The model calculates the impact on total costs and QALYs for a cohort of 1000 patients going through a particular ward (GMW or AMU, depending on which intervention is being analysed).
First, the model retrieves the case-mix (NEWS minus AVPU, CFS) of patients for a given age. Further details on how case mix is determined can be found in section 41.2.3.
Based on the case-mix, a proportion of patients will receive the intervention. In the case of extended hours for consultants in AMU, it will also depend on how many patients arrive during service hours. Further details on the selection criteria for each intervention can be found in 41.2.2.
Four outcomes are determined by case-mix, by the intervention and by the proportion of patients receiving the intervention (see 41.2.5):
Length of hospital stay.
Number of ICU/HDU referrals.
30-day survival.
Quality of life up to 1 year.
The costs are calculated based on the number of patients who receive the intervention, the length of stay, the number of ICU/HDU referrals and the number of survivors. Details on costs can be found in section 41.2.7.6.
Lifetime QALYs are calculated for each age for those patients surviving 30 days. Hence, the QALYs depend on age, frailty and the proportion surviving at 30 days. For the therapy intervention, an additional quality of life benefit is added to those who receive the intervention and survive. Further details on how survival and quality of life are determined can be found in section 41.2.6 and 41.2.7 respectively.
41.3.4 Inputs
The inputs have been described in 41.2. Table 22 shows the proportion of patients who were eligible for each intervention.
Table 22: Proportion of patients who receive the intervention in the Cohort model
Description Baseline Intervention Source
RAT
emergency attendances eligible for service (major patients only)
This service is currently not
30.5% Meacock 2016118

Emergency and acute medical care
Chapter 41 Cost-effectiveness analyses 40
Description Baseline Intervention Source
emergency attendances arriving within intervention service hours (8:00 – midnight,
everyday)
provided 89% HES 2014-1576
AMU consultant review
AMU patients eligible for this review 100%
patients arriving during current service hours 54% HES 2014-1576
patients arriving within extended service hours (18:00 – 22:00)
0% 24% HES 2014-1576
Consultant review on medical wards
GMW patients eligible for this review 100%
Therapy in the ED
emergency attendances eligible for service (CFS score of 3,4,5 or 6)
21% SAMBA 2013188
emergency attendances arriving within intervention service hours
38% 75% HES 2014-1576
Therapy on medical wards
GMW attendances eligible for service (CFS score of 3 or greater)
67% SAMBA 2013188
The cost of the intervention depended on the number of patients receiving the intervention during premium time – see Table 23.
Table 23: Proportion of time the intervention is in premium hours
Description Baseline Intervention
RAT in the ED
Consultants (weekends and 7pm-7am) NA 40%
AMU consultant review
Consultants (weekends and 7pm-7am) 39% 45%
Consultant review on medical wards
Consultants (weekends and 7pm-7am) 0% 21%
Junior doctors (9pm-7am daily) NA 0%
Nurses (weekends and 6am-8pm) NA 100%
Therapy in the ED
Therapists (weekends and 6am-8pm) 0% 39%
Therapy on medical wards
Therapists/nurses (weekends and 6am-8pm) 0% 29%
41.3.5 Sensitivity analysis
Each analysis was repeated as follows:
Table 24: sensitivity analyses for cohort model
Sensitivity analysis Description
SA1: Optimistic treatment effects The analysis was re-run using the most favourable conditions for the intervention treatment effects.
SA2: Conservative treatment effects The analysis was re-run using the least favourable conditions for the

Emergency and acute medical care
Chapter 41 Cost-effectiveness analyses 41
Sensitivity analysis Description
intervention treatment effects.
SA3: Long term costs Include the non-AME related healthcare costs associated with lifetime survival
SA4: improve post-AME survival The age-specific standardised mortality ratios were applied as usual but there was no additional excess mortality in the first 90 days. This improves survival and therefore increases the cost effectiveness of interventions that avert in-hospital deaths.
SA5: improve quality of life The quality of life of an individual who is frail returns to pre-AME levels. This improvement in quality of life improves the cost effectiveness of interventions that avert deaths.
SA6: simultaneously improve quality of life and survival
This sensitivity analysis improves survival and quality of life simultaneously, as described in SA4 and SA5.
SA7: Lower intervention costs Consultant wages were reduced by 25% and other staff were a grade lower than in the base case. There is a lower frequency of on-call working.
SA8: Higher intervention costs Consultant wages were increased by 25% and other staff were a grade lower than in the base case. There is a higher frequency of on-call working.
41.4 Simulation model methods
41.4.1 Approach to modelling
A discrete event simulation model was built using a “determine event first then time” approach within Simul8 professional.19,30,95 Simul8 allows the interaction of simulated patients with resources (beds) within the hospital. Since resources are limited, the model records queueing of patients and occupancy of resources.
The model captures the results for patients in 1 year running of simulated hospital for emergency patients. The model runs for a total of 4 years; 2 year warm up period to populate the simulated hospital, 1 year results collection year and 1 year cool down period to allow patients with a large length of stay that entered during the results collection year to exit the simulated hospital. After 10 months of the 1 year cool down period, resource constraints are lifted to allow the free movement and exit of the model of any patients who entered during the collection year but are still in the hospital at this time. To account for the few patients still in the hospital at the end of the cool down year, we added in Excel, mean QALYs and mean costs for each of these patients to the Simul8 totals.

Emergency and acute medical care
Chapter 41 Cost-effectiveness analyses 42
Figure 4: Flow of patients through the model
Figure 4 shows the different locations in the model and the flow of patients between them. The model is split into 3 distinct areas; preadmission, admitted wards and the community. In addition to the flows indicated by arrows, at any location, some patients will die and there are movements between the different ward locations, for example, a patient could move from a medical ward to ICU/HDU back to a medical ward and then on to a rehabilitation ward.
The following areas are modelled:
Hospital pre-admission locations
o Emergency Department (ED)
o Ambulatory Acute Medical Unit – acute medicine experts provides outpatient care for AME patients during daytime.
o Clinical Decision Unit – short stay wards provided by emergency medicine experts. Although these are technically admissions, we have made a distinction, since they are part of the emergency pathway rather than medical pathway and patients were not recorded on VitalPAC, which computes NEWS.
Hospital admission locations
o Acute Medical Unit (AMU) – where undifferentiated AME patients are assessed and managed usually for up to 24 hours.
o General medical wards (GMW) – provide level 1 care to medical patients, includes specialist wards such as gastroenterology, care of the elderly.
o Intensive care unit / high dependency unit (ICU/HDU) – the intensive medicine department providing level 2 and level 3 care.
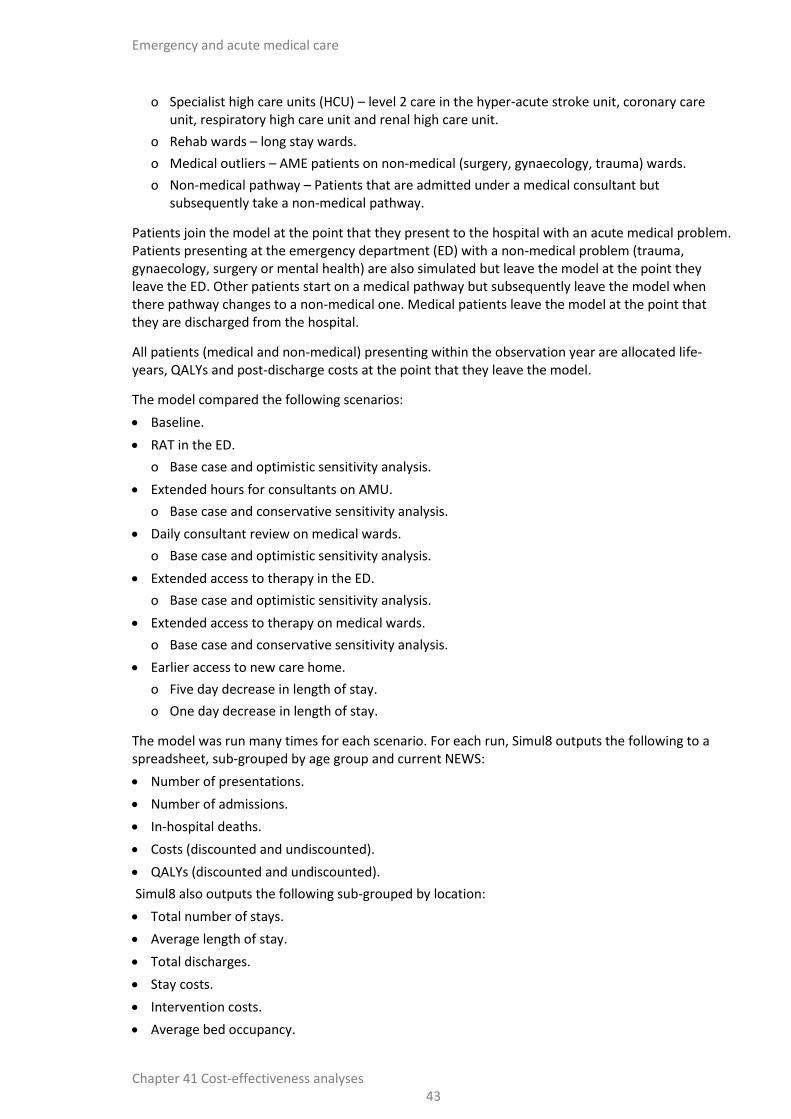
Emergency and acute medical care
Chapter 41 Cost-effectiveness analyses 43
o Specialist high care units (HCU) – level 2 care in the hyper-acute stroke unit, coronary care unit, respiratory high care unit and renal high care unit.
o Rehab wards – long stay wards.
o Medical outliers – AME patients on non-medical (surgery, gynaecology, trauma) wards.
o Non-medical pathway – Patients that are admitted under a medical consultant but subsequently take a non-medical pathway.
Patients join the model at the point that they present to the hospital with an acute medical problem. Patients presenting at the emergency department (ED) with a non-medical problem (trauma, gynaecology, surgery or mental health) are also simulated but leave the model at the point they leave the ED. Other patients start on a medical pathway but subsequently leave the model when there pathway changes to a non-medical one. Medical patients leave the model at the point that they are discharged from the hospital.
All patients (medical and non-medical) presenting within the observation year are allocated life-years, QALYs and post-discharge costs at the point that they leave the model.
The model compared the following scenarios:
Baseline.
RAT in the ED.
o Base case and optimistic sensitivity analysis.
Extended hours for consultants on AMU.
o Base case and conservative sensitivity analysis.
Daily consultant review on medical wards.
o Base case and optimistic sensitivity analysis.
Extended access to therapy in the ED.
o Base case and optimistic sensitivity analysis.
Extended access to therapy on medical wards.
o Base case and conservative sensitivity analysis.
Earlier access to new care home.
o Five day decrease in length of stay.
o One day decrease in length of stay.
The model was run many times for each scenario. For each run, Simul8 outputs the following to a spreadsheet, sub-grouped by age group and current NEWS:
Number of presentations.
Number of admissions.
In-hospital deaths.
Costs (discounted and undiscounted).
QALYs (discounted and undiscounted).
Simul8 also outputs the following sub-grouped by location:
Total number of stays.
Average length of stay.
Total discharges.
Stay costs.
Intervention costs.
Average bed occupancy.

Emergency and acute medical care
Chapter 41 Cost-effectiveness analyses 44
Percentage of 4 hour breeches (ED only).
41.4.1.1 Differences between the simulation model and the cohort model
By modelling hospital flow in the simulation model, we are able to estimate the incidence of medical outliers and the consequences for costs and health outcomes that are not assessed in the cohort model (41.3). The simulation model evaluates the same interventions as the cohort model. It is also being used to estimate the benefits of reducing delayed transfers of care for patients being transferred to a care home.
The cohort model can therefore be seen as the impact on costs and health outcomes if there were no changes to hospital flow arising from the interventions. This may be the case in some hospitals if they have few medical outliers.
By modelling individual patients, the simulation model can model some of the effects more precisely; since the effects can be applied directly to the transition probabilities (see 41.2.5). In addition, by modelling individual patients, the simulation model can better deal with the correlation between different patient characteristics (age, NEWS, CFS and mortality).
For some of the comparisons, the cohort model contained intervention costs in the baseline as well as in the intervention arm. For the simulation model, only the incremental intervention costs were included in the intervention scenarios and no intervention costs were included in the baseline scenario, on the assumption that they are incorporated within bed-day costs. The impact on cost effectiveness should be the same but it allowed the simulation model to have only a single Baseline scenario.
For the cohort models, results were reported per 1000 patients, whereas for the simulation model results are reported based on a single large DGH. Three different cohorts were used in the cohort analyses depending on the analysis (ED patients, AMU patients and GMW patients). For the simulation model, the population includes everyone presenting at ED plus direct non-elective medical admissions plus direct referrals to the ambulatory AMU. Hence mean QALYs and mean costs will reflect the cohort. However, this difference in approach should not affect the cost effectiveness result, such as the magnitude of the incremental cost per QALY gained.
The simulation model does utilise mode data that is specific to one hospital rather than national data (41.4.4) but that hospital was broadly similar to the national average in most respects (Appendix E).
During construction, the cohort model has been useful in checking the validity of the output of the (more complex) simulation model (see 41.4.8).
The run time of the simulation model has limited the number of sensitivity analyses that can be performed. Therefore, the cohort model has been useful in exploring the robustness of the model results (see 41.4.7).
41.4.2 Labels, workstations and procedures
A description of labels, workstations and procedures can be found in Appendix G.
Labels are patient-level variables that define the characteristics and history of a patient as they move throughout the model. Labels are attached to individual patients and are used for the following:
as indicators of case-mix (age, NEWS, CFS),
to record where the patient is and where they are going next,
to record model outcomes for the individual patient, such as costs and QALYs.

Emergency and acute medical care
Chapter 41 Cost-effectiveness analyses 45
In addition to labels, the model also uses global values, which are used by the entire cohort as an input or output. Examples of global variables include: one to indicate which quarter of the year the simulation is currently in and another to record the total number of admissions.
‘Workstations’ are used to do the work of different locations of the pathway; this includes assigning patient characteristics and routing patients around the model. The workstations can be seen in the model as objects that process individual patients as they move throughout the simulation. Within the objects, multiple calculations and processes can be implemented. The calculations and processes of each location within the model are represented by a queue and 2 workstations (Figure 5).
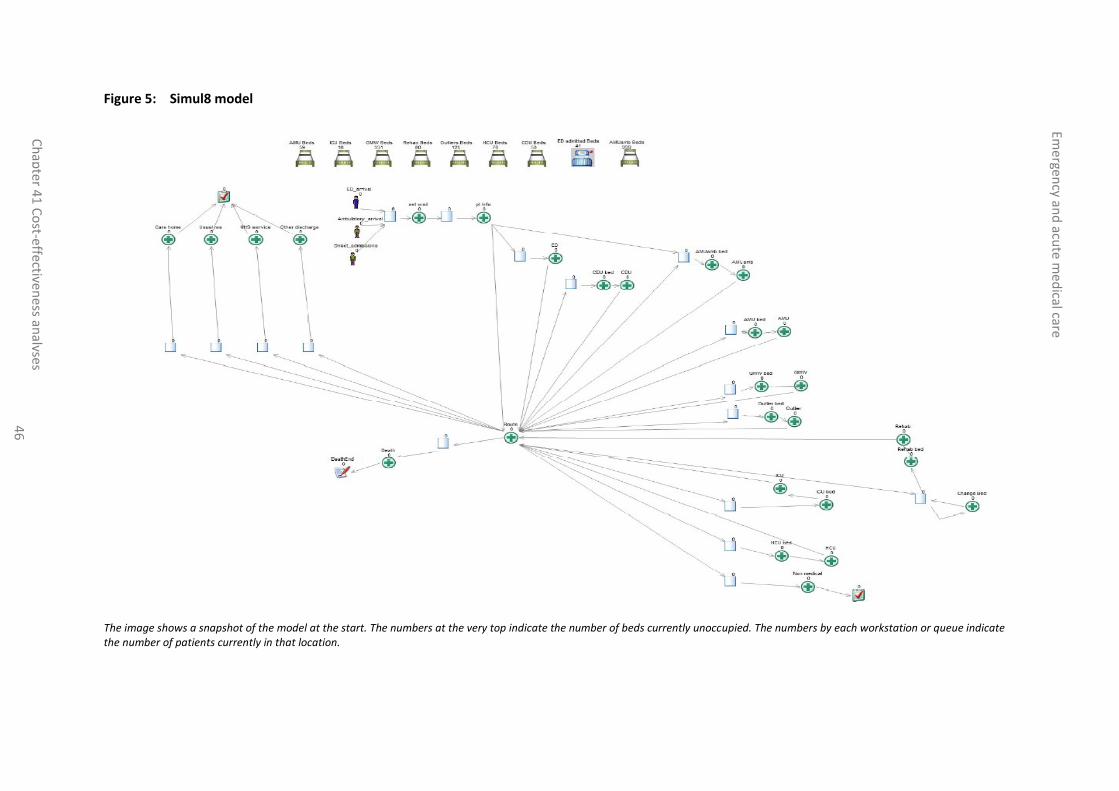
Emergen
cy and
acute m
edical care
Ch
apte
r 41
Co
st-effectiveness an
alyses 4
6
Figure 5: Simul8 model
The image shows a snapshot of the model at the start. The numbers at the very top indicate the number of beds currently unoccupied. The numbers by each workstation or queue indicate the number of patients currently in that location.

Emergency and acute medical care
Chapter 41 Cost-effectiveness analyses 47
The queue allows patients to wait for movement into a new location and trigger decision rules after a certain time waiting. For example, simulated patients enter and wait in a queue to enter the rehabilitation ward until there is available capacity. The first of 2 workstations changes the resource used by the simulated patient, representing change of beds, and creates the block causing the wait time within the queue when there is no available capacity. The second workstation calls on the different procedures to calculate the simulated patient’s next location in their pathway, their length of stay in their current location and change in NEWS over the course of the stay in that current location). Workstations are also used for other processes within the model, such as assigning patient characteristics and routing simulated patients around the model. A description of each workstation can be seen in Table 80.
The simulation model uses ‘resources’ to represent beds. There are a constrained number of beds for each location to represent the capacity of that location. Patients pick up resources on entry to a location and drop the resource only when they are able to pick up a new resource for their next location.
The simulation model calls on ‘procedures’ for identical work in each area of the model. Procedures increase efficiency within the model by avoiding repeated coding in multiple areas of the model. Procedures can be used where the same block of calculations are required but only the location is different, such as calculating the length of stay. Procedures are used for setting patient characteristics, routing patients throughout the pathway, calculating patient length of stay in each location of the model, working with resources, calling on decision rules, calculating post-hospital outcomes and recording results.
41.4.3 Number of model runs
The simulation model uses numerous random numbers for probability calculations and samples from distributions for processes such as arrival times and length of stay. As a result, multiple runs need to be carried out to take into account random variation in sampling.
To see if we had conducted a sufficient number of runs, we re-calculated:
The incremental number of medical outliers for an intervention scenario compared with baseline, averaged across different runs.
This was re-computed after each run.
This was then plotted on a graph with number of runs on the horizontal axis (seeFigure 6) to see whether and how soon the results stabilised.
This was repeated for each scenario for the following outcomes: medical outliers, cost per patient, QALYs per patient, in-hospital deaths per patient and incremental net benefit per patient.
For each outcome and each intervention, using the criteria recommended by Simul878, we assessed whether convergence had been achieved. The convergence criterion was that the ‘precision’ should be no greater than 100% of the mean, where the precision is defined half the width of the confidence.
Again, for each outcome and each intervention, we also conducted standard sample size power calculations using a significance of 5% and power of 80%. It is similar to the convergence assessment in that, it uses the mean and standard deviation of the results from the Simul8 model and employs the central limit theorem.
Trials were conducted as a multiple of 1,200, since that was the most runs that could be achieved in 24 hours using a 16-core virtual machine and parallel processing. The total number of runs conducted varied between scenarios reflecting the power calculations. However, due to time constraints it was not possible to complete enough runs to attain convergence for all scenarios, and we de-prioritised those scenarios where convergence would clearly not be achievable. The results of the convergence assessment are presented below (see 41.5.5).
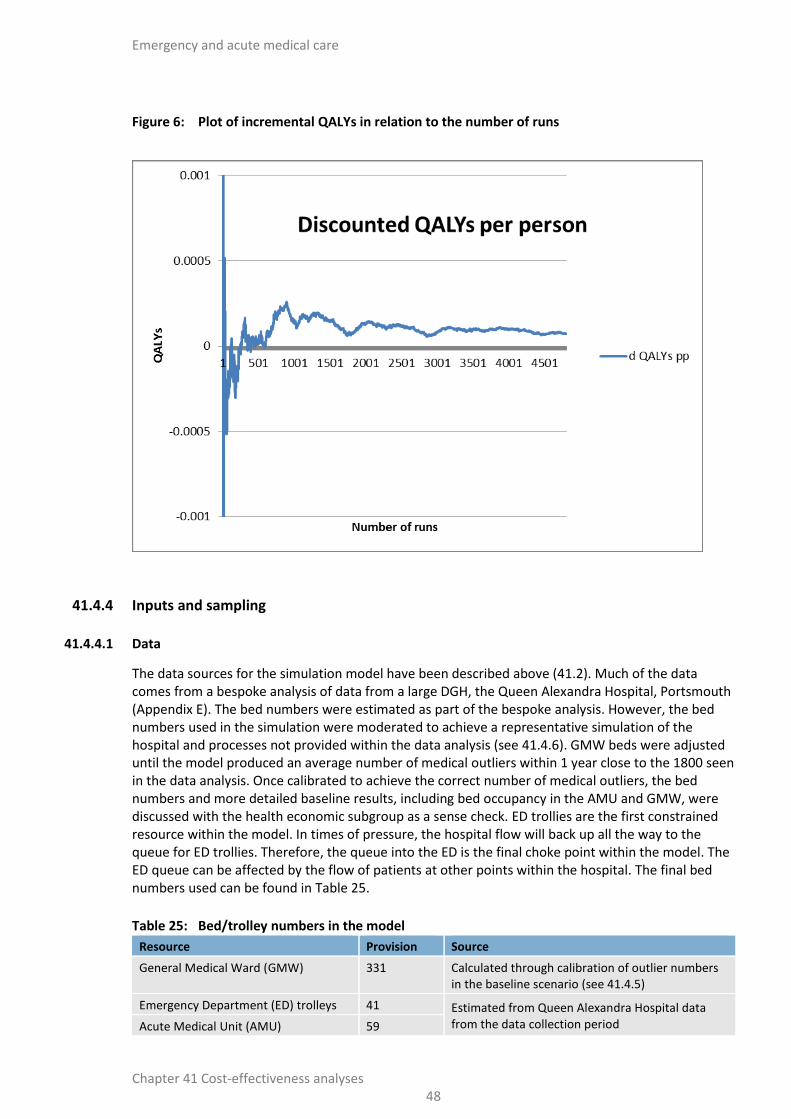
Emergency and acute medical care
Chapter 41 Cost-effectiveness analyses 48
Figure 6: Plot of incremental QALYs in relation to the number of runs
41.4.4 Inputs and sampling
41.4.4.1 Data
The data sources for the simulation model have been described above (41.2). Much of the data comes from a bespoke analysis of data from a large DGH, the Queen Alexandra Hospital, Portsmouth (Appendix E). The bed numbers were estimated as part of the bespoke analysis. However, the bed numbers used in the simulation were moderated to achieve a representative simulation of the hospital and processes not provided within the data analysis (see 41.4.6). GMW beds were adjusted until the model produced an average number of medical outliers within 1 year close to the 1800 seen in the data analysis. Once calibrated to achieve the correct number of medical outliers, the bed numbers and more detailed baseline results, including bed occupancy in the AMU and GMW, were discussed with the health economic subgroup as a sense check. ED trollies are the first constrained resource within the model. In times of pressure, the hospital flow will back up all the way to the queue for ED trollies. Therefore, the queue into the ED is the final choke point within the model. The ED queue can be affected by the flow of patients at other points within the hospital. The final bed numbers used can be found in Table 25.
Table 25: Bed/trolley numbers in the model
Resource Provision Source
General Medical Ward (GMW) 331 Calculated through calibration of outlier numbers in the baseline scenario (see 41.4.5)
Emergency Department (ED) trolleys 41 Estimated from Queen Alexandra Hospital data from the data collection period Acute Medical Unit (AMU) 59

Emergency and acute medical care
Chapter 41 Cost-effectiveness analyses 49
Resource Provision Source
Intensive Care Units (ICU) 16
Rehab 80
Medical outlier 125 Expert opinion
High Care Units (HCU) 70 Calibrated so that there was not excessive queuing
Clinical Decision Units (CDU) Not limited in the model
Ambulatory AMU
A review of the effects of weekend admission on mortality was conducted (Appendix C). It is difficult to control for case-mix in this area. The studies that included ED presentations in addition to admissions suggested that case-mix could explain most of the observed weekend effect. Therefore, we decided not to include an explicit weekend effect, other than by varying case-mix (age and NEWS on admission) by day of week.
41.4.4.2 Sampling of probabilities
For patient movements, the model uses cumulative probabilities (see for example Table 26). Random numbers between 0 and 1 are generated to determine which route, so for the example in the table, a number of 0.6 would send the individual on to usual residence, whereas a value of 0.3 would send them to the GMW. The probabilities are stratified by: current location, age group, NEWS group and whether it is their first admitted location:
Age groups
o 16-44, 45-64, 65-75, 75-85, 85+
NEWS groups
o 0, 1-4, 5-6, 7+
o Zero indicates normal healthy life signs. A score of 7+ indicates referral to critical care outreach.
This approach is also used to determine:
The arrival time of patients across the week.
Discharge time of patient across the day.
Patient case-mix (age, NEWS, CFS).
Change in NEWS group over the stay in each location.
The next location in the patient pathway.
Table 26: Transition probability for patients in AMU age group 16-44, NEWS group 1-4 and it is their first admitted location
Potential next location Probability (a) Cumulative probability
GMW 0.361 0.361
Outlier 0.012 0.373
Rehab 0.0002 0.374
ICU 0.003 0.377
HCU 0.007 0.384
Non-medical path 0.011 0.395
Care home 0.0001 0.396
Usual res 0.579 0.974
NHS service 0.017 0.992
Emergency and acute medical care
Chapter 41 Cost-effectiveness analyses 50
Potential next location Probability (a) Cumulative probability
Other discharge 0.008 0.9996
Death 0.0004 1.000
(a) This data is from the analysis of data from the Queen Alexandra Hospital in Portsmouth - Appendix E. The proportion of the patients moving to Medical outlier was omitted here and those patients re-distributed to the GMW. This was so that medical outliers were only created when medical wards were at full capacity – see 41.4.5.
The model controls for the case-mix of patients within the model by using identical random number streams for comparative runs. This means that for a given run, the number and case-mix of patients is identical for each scenario. However, the course that an individual patient can take can vary considerably, depending on:
whether they receive the intervention,
whether changes to system performance affect their pathway (indirectly caused by the intervention), and
random variation.
41.4.4.3 Sampling of other inputs
For some variables in the model, the model creates distributions from which to sample. For example, patient length of stay in each location is determined by sampling from a lognormal distribution created using a mean and standard deviation from the data analysis found in a lookup table that is stratified by current location, next location, current NEWS group and age group. The sampled length of stay is capped at a maximum of one year for each location, to avoid sampling long lengths of stay that would not be captured in the model run time. The patient’s actual length of stay in a location in the model will differ from that which is initially sampled for them for a number of reasons:
If their next destination is full then they might have to wait until a bed becomes available.
If the GMW is full then they might be discharged slightly earlier (see Table 27).
If GMW is full they might be made a medical outlier (see Table 27).
If they are due to be discharged then their length of stay will be adjusted to fit the discharge time profile.
They might receive an intervention that reduces their length of stay (Table 6).
In other instances, probability profiles have been generated using data from the bespoke analysis. Probability profiles have been used where the patient needs to sample from a bespoke distribution. Probability profiles have been used for the following:
Time presenting to hospital.
Preadmission length of stay.
Discharge time.
Post-discharge mortality up to 30-days and lifetime QALYs from 30-days, each by age and CFS were calculated in MS Excel in the manner described in section 41.2.7. These are then applied to patients in the simulation model using a lookup table.
41.4.5 Medical outliers
A medical patient becomes a medical outlier when they are transferred to a surgical or other non-medical ward bed. Medical outliers are generated in the model at times of pressure within the system, when demand for medical beds exceeds supply. Medical outliers are created in line with the decision rules implemented in the model (41.4.6).
Emergency and acute medical care
Chapter 41 Cost-effectiveness analyses 51
In the model, during their time as a medical outlier, patients incur the same risk of mortality and risk of transfer to ICU/HDU as observed in the Portsmouth data (Appendix E). As with other probabilities, these risks are stratified by current NEWS group, age group and next location.
On leaving the outlying ward, patients revert to the previous pathway they would have followed had they not been made a medical outlier (unless they died or they were referred to ICU/HDU). If they were in AMU waiting to go to GMW when they were made a medical outlier then they would move to GMW after their outlier stay. Whereas if they were in GMW when they were made a medical outlier then they would be discharged to their usual place of residence (if that were where they were due to go).
We conducted a literature review of the impact of medical outliers (Appendix D). The evidence was heterogeneous. Focusing on the evidence in general medical patients, there appeared to be an increase in length of hospital stay associated with being a medical outlier of 2.6 days and an increase in mortality (RR=1.3). In the model, most medical outliers are generated towards the end of a patient’s stay. Therefore, the mortality occurring within the medical outlier stay and the length of that stay is largely incremental. We calibrated the average time that a person spent on an outlier ward from 5.1 days in the Portsmouth data to 2.6 days found in the literature, to avoid over-estimating the impact of reduced incidence of medical outliers.
Overall, an outlying patient on a surgical ward will have similar resource use and cost as a patient on a medical ward. The timing of care however may be slower, and there may be additional cost of consultant time due to the need to travel to the patient. However, to be conservative, we have not included this extra time in the model and have used the same bed-day cost for non-medical wards as for medical wards.
41.4.6 Decision rules for routing patients when resources are fully utilised
Decision rules were discussed and agreed with the health economic subgroup and full committee. They aim to capture what can happen to the patient pathway, in line with current good practice. The decision rules are triggered when there are blockages to the patient pathway within the simulated hospital. Once triggered, the decision rules force movements of patients, either along their pathway or moving them to an outlying (non-medical) ward when necessary and possible. The decision rules should give priority to freeing capacity at bottlenecks in the hospital pathway. The final choke point within the simulation model is the emergency department, which will see a build-up of patients once the limit on medical outliers has been reached and all the other wards are full.
Sometimes, when a bed becomes available, there are several people queueing for that bed. Typically, the patient waiting the longest would be prioritised. Prioritisation was not based on age, NEWS or frailty. However, for AMU beds, CDU patients take priority over ED patients, with both taking priority over ambulatory AMU patients.
The bespoke data analysis provided total ED length of stay, inclusive of clinical length of stay and any additional length of stay caused by blockages preventing movement. Without adjusting the ED length of stay input, simulated patients could sample long lengths of stay when there are no blockages in the simulated hospital and shorter lengths of stay when there are blockages. As we were unable to differentiate between clinical length of stay and length of stay caused by blockages, we used 3 hour 59 minute as the minimum length of stay a simulated patient that sampled over 4 hours could stay. Supposing 4 hours 30 minutes is sampled for a patient that is to be admitted to AMU. If AMU has a spare bed then the patient will be transferred after 3 hours 59 minutes. However, if a bed is not available then they wait until one is. If a bed is still not available at 4 hours 30 minutes, then they are switched to a medical outlier ward. This allows queues to build up in ED when the simulated hospital is under pressure.

Emergency and acute medical care
Chapter 41 Cost-effectiveness analyses 52
A description of the decision rules implemented in the simulation model when full capacity is reached is shown in Table 27 Table 27: Decision rules built into the simulation model. The majority of medical outliers will come from the GMW, but they can come from anywhere (second most likely is AMU and then the ED).
Emergency and acute medical care
Chapter 41 Cost-effectiveness analyses 53
Table 27: Decision rules built into the simulation model
Blockage Rule
AMU is full 1. Move the patient that has the least time remaining in the AMU, NEWS<5 and GMW as their next destination to the GMW
2. Look in the queues for rehab or care home if anyone is waiting and holding AMU bed, move them temporarily to a GMW bed
GMW is full 1. Discharge patient early from GMW who is within 24 hours of discharge, has NEWS <5 and is not being newly discharged to care home
2. Move patient who is between 24-72 hours of their GMW length of stay and has NEWS <5 to medical outlier
3. Move new incoming patient to medical outlier.
ICU is full 1. Move patient from ICU to GMW if they are in last 12 hours of ICU stay and are destined to move to GMW or rehab
HCU is full 1. Move patient from HCU to GMW if they are in last 12 hours of HCU stay and are destined to move to GMW or rehab and NEWS <5
2. New HCU patient can move to ICU but must move on when ‘true ICU’ patient needs bed
Rehab is full Patient has to wait for a bed to become available.
Medical outliers has reached maximum
Queues will build up in ED as the hospital is full.
41.4.7 Sensitivity analyses
Sensitivity analyses were undertaken looking at uncertainty around the elicited treatment effects. Upper and lower ranges of the treatment effects were elicited by the committee to create optimistic and conservative treatment effects (41.2.5) to capture the uncertainty around the effects of the different interventions.
41.4.8 Model validation
The model was developed in consultation with the committee; model structure, inputs and results were presented to and discussed with the committee for clinical validation and interpretation.
The model was systematically checked by the health economist undertaking the analysis. Breakpoints were implemented each time new logic code was implemented or edited to check the code was achieving the desired effect before running results. A built in watch window was utilised to track key variables whilst the model was running. Where errors in the code occurred, Simul8’s debugging process was used to step through code and identify the cause of any error.
Results were compared with the treatment effects and with the cohort model results to check that they were sensible.
The model code was peer reviewed by an experienced operational researcher from ScHARR, Sheffield University. The model code was checked by a senior health economist at the National Guideline Centre and the methods and results of the Excel model and Simul8 model were systematically compared.
41.5 Results
Table 28 summarises the interventions evaluated, the resources required (41.2.8) and the effects assumed (41.2.5).

Emergency and acute medical care
Chapter 41 Cost-effectiveness analyses 54
Table 28: Summary of interventions
Intervention Intervention costs Treatment effects versus Baseline
RAT in ED ED consultant time Short stay admissions averted
Reduced time in ED (Simul8 model only)
Reduced deaths in ED (Sensitivity analysis only)
Extended access to therapy in the ED
Time of occupational therapist / physiotherapist / physiotherapy assistant
Short stay admissions averted
Extended consultant hours in AMU AMU Consultant time Reduced stay in AMU
Reduced deaths in AMU
Reduced referrals to ICU/HDU
Daily consultant review on medical wards
Consultant physician time, Reduced stay in GMW
Nurse and junior doctor time at weekend
Reduced deaths in GMW
Reduced referrals to ICU/HDU
Extended access to therapy on medical wards
Time of occupational therapist / physiotherapist / physiotherapy assistant / nurse
Reduced stay on GMW
Improved quality of life for 12 months
41.5.1 Cohort model base case
The cost of providing RATing was calculated to be £37 per patient that received the intervention. As the intervention is only considered for ‘major’ patients, the cost of providing the service for 1000 ED patients was only £9435.
RAT was deemed to reduce admissions by 5.5 per 1000 patients that attend the ED. These prevented admissions were assumed to be short stays; therefore, the impact on bed days was calculated to be a reduction of 10.94 bed days. There was assumed no impact on ICU referrals.
As the only impact of the intervention was on admissions, the only cost savings come from reduced bed days, which was calculated to save £3,236 per 1000 ED patients.
The intervention was assumed to have no impact on health outcomes.
Taking all of this into account the net increase in costs to the health service of providing RAT was calculated to be £6,199 per 1000 patients. As there are no impacts on health, RAT was dominated by current practice. A full breakdown of the results can be seen in Table 29.

Emergency and acute medical care
Chapter 41 Cost-effectiveness analyses 55
Table 29: RAT versus baseline (per 1000 ED presentations)
Baseline Intervention
Increment
(intervention minus baseline)
Intervention
Number receiving intervention
0.00% 25.83% 25.83%
Intervention cost per patient receiving intervention
£0 £37 £36.52
Intervention cost (£)
£0 £9,435 £9,435.12
Resource impact
Admissions 273 267 -5.50
Bed days 1734 1723 -10.94
ICU/HDU referrals 6 6 0
Cost impact
Stay costs (£) £512,787 £509,551 -£3,236.00
ICU/HDU costs (£) £0 £0 £0.00
Post-discharge costs (£)
£1,997,495 £1,997,495 £0.00
Health outcomes
Deaths in hospital 19.4 19.4 0
Deaths in 30 days 40 40 0
Life-years (discounted)
15495 15495 -
Cost effectiveness
Total costs (£) £2,510,282 £2,516,481 £6,199.11
Quality-adjusted life-years (discounted)
11623 11623 -
Incremental cost per QALY gained (£)
- - Dominated

Emergency and acute medical care
Chapter 41 Cost-effectiveness analyses 56
The cost of extending access to therapy in the ED was calculated to be an additional £2.30 per patient that receives the intervention. This additional cost is due to the intervention now being available in premium hours. As more people receive the intervention, the additional cost of extending service hours was calculated to be £2,951 per 1000 ED attendances.
Extended access to therapy in the ED was deemed to reduce admissions by 3.8 per 1000 patients that attend the ED. These prevented admissions were assumed to be ‘short stays’; therefore, the impact on bed days was calculated to be a reduction of 7.5 bed days. There was assumed no impact on ICU referrals.
As the only impact of the intervention was on admissions, the only cost-savings come from reduced bed-days, which were calculated to save £2,222 per 1000 ED patients.
The intervention was assumed to have no impact on health outcomes.
Taking all this into account the net increase in costs from extending therapy hours in the ED was calculated to be £728 per 1000 patients. As there were no impacts on health, the intervention was dominated by current practice. A full breakdown of the results can be seen in Table 30.
Table 30: Extended access to therapy in ED versus baseline (per 1000 ED presentations)
Baseline Intervention
Increment
(intervention minus baseline)
Intervention
Number receiving intervention
7.87% 15.67% 7.80%
Intervention cost per patient receiving intervention
£33 £35 £2.30
Intervention cost (£)
£2,611 £5,562 £2,950.91
Resource impact
Admissions 273 269 -3.78
Bed days 1734 1726 -7.51
ICU/HDU referrals 6 6 0
Cost impact
Stay costs (£) £512,787 £510,564 -£2,222.44
ICU/HDU costs (£) £0 £0 £0.00
Post-discharge costs (£)
£1,997,495 £1,997,495 £0.00
Health outcomes
Deaths in hospital 19 19 0
Deaths in 30 days 40 40 0
Life-years 15495 15495 0
Cost effectiveness
Total costs (£) £2,512,893 £2,513,622 £728.47
Quality-adjusted life-years
11623 11623 -
Incremental cost per QALY gained (£)
- - Dominated

Emergency and acute medical care
Chapter 41 Cost-effectiveness analyses 57
The cost of providing extended hours for consultants in the AMU was calculated to be an additional £0.80 per patient that receives the intervention. This additional cost is due to the intervention now being available in premium hours. As more people receive an extra review, the additional cost of extending service hours was calculated to be £12,082 per 1000 AMU attendances.
Extended hours for consultants in the AMU were deemed to reduce length of stay; the impact on bed days was calculated to be a reduction of 9.2 bed days per 1000 AMU attendances. There was also a reduction in ICU referrals by 0.04 per 1,000 patients.
The intervention was also deemed to have a reduction in mortality on AMU wards. For every 1000 AMU patients there would be a reduction in in-hospital mortality by 0.09. This was found to generate an additional 0.20 QALYs.
Taking all of this into account the net increase in costs from extending hours for consultants in the AMU was calculated to be £9,255. The incremental cost effectiveness ratio was found to be £45,519 per QALY. This is above the £20,000 per QALY threshold and therefore it would not be considered cost effective. A full breakdown of the results can be seen in Table 31.
Table 31: Extended hours for consultants in AMU versus baseline (per 1000 AMU patients)
Baseline Intervention Increment (intervention minus
baseline)
Intervention
Proportion arriving in service hours
54.10% 78.03% 23.93%
Intervention cost per patient receiving intervention
£47.87 £48.67 £0.80
Intervention cost (£)
£25,896 £37,979 £12,082.43
Resource impact
Admissions 1000 1000 0.00
Bed days 6350 6341 -9.21
ICU/HDU referrals 3 3 -0.04
Cost impact
Stay costs (£) £1,878,340 £1,875,616 -£2,723.77
ICU/HDU costs (£) £0 -£187 -£186.95
Post-discharge costs (£)
£1,898,078 £1,898,161 £83.01
Health outcomes
Deaths in AMU 9 9 -0.09
Deaths in 30 days 89.9700 90 -0.07
Life-years 10455 10456 0.33
Cost effectiveness
Total costs (£) £3,802,314 £3,811,568 £9,254.73
Quality-adjusted life-years
7,456.57 7,456.77 0.20
Incremental cost per QALY gained (£)
- - £45,519.38

Emergency and acute medical care
Chapter 41 Cost-effectiveness analyses 58
The additional cost of daily consultant review was calculated to be £88,889 per 1000 GMW attendances.
Daily consultant reviews were deemed to reduce length of stay; the impact on bed days was calculated to be a reduction of 71 bed days per 1000 GMW attendances. There was also a reduction in ICU referrals by 0.6 per 1000 patients.
The intervention was also deemed to have a reduction in mortality on GMW wards. For every 1000 patients there would be a reduction in in-hospital mortality by 0.64. This was found to generate an additional 1.35 QALYs.
Taking all this into account the net increase in costs from providing daily consultant reviews in the GMW was calculated to be £65,151. The incremental cost effectiveness was £48,229 per QALY. This is above the £20,000 per QALY threshold and therefore it would not be considered cost effective. A full breakdown of the results can be seen in Table 32.
Table 32: Daily consultant review on medical ward versus baseline (per 1000 medical ward patients)
Baseline Intervention Increment (intervention minus
baseline)
Intervention
Number receiving intervention
100.00% 100.00% 0%
Intervention cost per patient receiving intervention
£57 £146 £88.89
Intervention cost (£)
£57,366 £146,256 £88,889.90
Resource impact
Admissions 1000 1000
Bed days 6350 6279 -70.83
ICU/HDU referrals 9 8 -0.64
Cost impact
Stay costs (£) £1,878,340 £1,857,387 -£20,952.61
ICU/HDU costs (£) £0 -£3,347 -£3,347.45
Post-discharge costs (£)
£1,883,029 £1,883,590 £561.14
Health outcomes
Deaths in GMW 64 63 -0.64
Deaths in 30 days 97.549 97 -0.47
Life-years 9704 9706 2.20
Cost effectiveness
Total costs (£) £3,818,734 £3,883,885 £65,150.98
Quality-adjusted life-years
6,837 6,838 1.35
Incremental cost per QALY gained (£)
- - £48,229.06

Emergency and acute medical care
Chapter 41 Cost-effectiveness analyses 59
The cost of extending access to therapy on the wards was calculated to be an additional £39.41 per patient that receives the intervention. The additional cost of extending service hours was calculated to be £26,451 per 1000 GMW attendances.
Extended therapy access was deemed to reduce length of stay; therefore, the impact on bed days was calculated to be a reduction of 393 bed days per 1000 GMW attendances. There was no impact on ICU referrals.
The intervention was also deemed to have a quality of life benefit for some patients. This was an additional 2.00 QALYs per 1000 patients.
Taking all of this into account, the net decrease in costs from extended access to therapy on the wards was calculated to be £88,464 per 1000 patients. As the intervention also increased QALYs, it was dominant and therefore cost effective. A full breakdown of the results can be seen in Table 33.
Table 33: Extended access to therapy on medical wards versus baseline (per 1000 medical ward patients)
Baseline Intervention Increment (intervention minus
baseline)
Intervention
Number receiving intervention
70.51% 70.51% 0%
Intervention cost per patient receiving intervention
£98 £137 £39.41
Intervention cost (£)
£69,117 £96,903 £27,786.44
Resource impact
Admissions 1000 1000
Bed days 6350 5957 -393
ICU/HDU referrals 9 9 0
Cost impact
Stay costs (£) £1,878,340 £1,762,090 -£116,250.01
ICU/HDU costs (£) £0 £0 £0.00
Post-discharge costs (£)
£1,883,029 £1,883,029 £0.00
Health outcomes
Deaths in hospital 64 64 0.00
Deaths in 30 days 98 98 0.00
Life-years 9704 9704 0.00
Cost effectiveness
Total costs (£) £3,830,485 £3,742,022 -£88,463.56
Quality-adjusted life-years
6837 6839 2.00
Incremental cost per QALY gained (£)
- - Dominant

Emergency and acute medical care
Chapter 41 Cost-effectiveness analyses 60
41.5.2 Cohort model sensitivity analyses
Table 34: Cost effectiveness of interventions versus baseline
Sensitivity analysis RAT
Extended access to therapy in the ED
Extended hours for consultants in AMU
Daily consultant review on medical wards
Extended access to therapy on medical wards
Base case Dominated (net cost increase to the health service: £6,199)
Dominated (net cost increase to the health service: £728)
£45,519 per QALY gained
£48,229 per QALY gained
Dominant (net savings to the health service: £88,464)
SA1: Optimistic treatment effects
£98,309 per QALY gained
Dominant (net savings to the health service: £1,504)
£25,452 per QALY gained
£19,739 per QALY gained
Dominant (net savings to the health service: £149,797)
SA2: Conservative treatment effects
Dominated (net cost increase to the health service: £9,435)
Dominated (net cost increase to the health service: £1,839)
Dominated (net cost increase to the health service: £10,671)
Dominated (net cost increase to the health service: £90,024)
Dominant (net savings to the health service: £27,130)
SA3: Long term costs
Dominated (net cost increase to the health service: £6,199)
Dominated (net cost increase to the health service: £728)
£52,438 per QALY gained
£55,227 per QALY gained
Dominant (net savings to the health service: £88,464)
SA4: improve post-AME survival
Dominated (net cost increase to the health service: £6,199)
Dominated (net cost increase to the health service: £728)
£37,427 per QALY gained
£39,812 per QALY gained
Dominant (net savings to the health service: £88,464)
SA5: improve quality of life
Dominated (net cost increase to the health service: £6,199)
Dominated (net cost increase to the health service: £728)
£42,301 per QALY gained
£44,776 per QALY gained
Dominant (net savings to the health service: £88,464)
SA6: improve quality of life and survival
Dominated (net cost increase to the health service: £6,199)
Dominated (net cost increase to the health service: £728)
£34,351 per QALY gained
£36,674 per QALY gained
Dominant (net savings to the health service: £88,464)
SA7: Optimistic intervention costs
Dominated (net cost increase to the health service: £4,979)
Dominated (net cost increase to the health service: £131)
£37,553 per QALY gained
£40,198 per QALY gained
Dominant (net savings to the health service: £92,800)
SA8: conservative intervention costs
Dominated (net cost increase to the health service: £7,518)
Dominated (net cost increase to the health service: £1,403)
£54,131 per QALY gained
£58,232 per QALY gained
Dominant (net savings to the health service: £83,286)

Emergency and acute medical care
Chapter 41 Cost-effectiveness analyses 61
A full breakdown of the results of this sensitivity analyses can be seen in Table 34. Using the optimistic values for treatment effects, the cost-effectiveness results were as follows:
RAT remained cost in-effective but it was no longer dominated as it provided some health benefit due to a small decrease in ED mortality. The ICER was now £98,309, which far exceeds the £20,000 per QALY threshold.
Extended access to therapy in the ED was now cost saving and therefore dominant, given that there were no differences in health outcomes. Rather than costing the health service an additional £728 extended access to therapy in the ED now saved the health service £1504 per 1000 patients.
Extended hours for consultants in AMU was significantly more cost effective with an ICER of £25,452 per QALY however even under the most optimistic scenario this still exceeds the £20,000 per QALY threshold.
Daily consultant reviews was significantly more cost effective with an ICER of £19,739 per QALY and therefore now below the £20,000 per QALY threshold.
Extended access to therapy on wards remained cost saving and was now even more so.
Using the most conservative values for treatment effects, meaning that the interventions were providing the least benefit, the cost-effectiveness results remained completely unchanged.
Including long-term health costs to the NHS un-related to the acute medical emergency had no impact on the cost-effectiveness conclusions for any of the interventions.
Increasing baseline survival post 30 days in the model and increasing baseline quality of life had no impact on the cost-effectiveness results.

Co
st-effectiveness an
alyses
Emergen
cy and
acute m
edical care
Ch
apte
r 41
Co
st-effectiveness an
alyses 6
2
41.5.3 Simulation model base case
Table 35: Base case results – Resource impact and health outcomes
Baseline RAT Extended access to therapy in ED
Extended hours for consultants in
AMU
Daily consultant review on medical
wards
Extended access to therapy on
medical wards
Presentations
ED 95386 0 0 0 0 0
Direct to Ambulatory AMU 5175 0 0 0 0 0
Direct admissions 7352 0 0 0 0 0
Total presentations 107912 0 0 0 0 0
Medical admissions 26755 -424 -253 0 0 0
ED stay (hours per ED presentation) 2.57 -0.09 0.00 0.00 0.00 0.00
4-hour ED breeches (%) 10.29% -1.88% -0.03% -0.03% -0.03% -0.34%
Bed days (per 1000 presentations)
0
AMU 176 -2 -1 -1 0 0
GMW 1110 0 0 0 -4 -43
Medical outlier 41 1 0 -1 -10 -39
Rehabilitation 186 0 0 0 0 0
ICU/HDU 28 0 0 0 -1 0
HCU 170 0 0 0 0 0
Total 1711 -1 -1 -2 -14 -83
Health outcomes (per 1000 presentations)
Deaths in hospital 18.17 0.00 0.00 -0.02 -0.10 -0.11

Co
st-effectiveness an
alyses
Emergen
cy and
acute m
edical care
Ch
apte
r 41
Co
st-effectiveness an
alyses 6
3
Table 36: Base case results – costs and cost effectiveness (per 1000 presentations)
Baseline RAT versus
Baseline
Extended access to therapy in ED versus baseline
Extended hours for consultants in
AMU versus baseline
Daily consultant review on medical
wards versus baseline
Extended access to therapy on
medical wards versus baseline
Intervention £0 £8,401.36 £4,240.26 £1,808.13 £12,456.74 £17,441.29
ED, CDU & AMMU £120,164 £2.27 -£0.20 -£0.15 -£0.15 £0.19
AMU £52,090 -£612.93 -£378.83 -£336.19 £3.50 -£8.23
GMW £328,429 £14.01 £42.79 £28.03 -£1,096.84 -£12,805.16
Medical outlier £12,131 £175.71 £77.40 -£217.23 -£3,100.84 -£11,505.11
Rehabilitation £54,970 -£30.57 £20.39 -£20.41 £63.77 £10.64
ICU/HDU £35,305 £81.86 £117.53 -£135.93 -£815.82 -£563.96
HCU £50,141 £24.86 £9.60 -£10.99 £26.26 -£2.71
Post-discharge £2,000,700 -£63.36 -£19.19 £6.10 £167.30 £224.60
TOTAL cost £2,653,937 £7,993.24 £4,109.58 £1,121.56 £7,704.10 -£7,209.19
Quality-adjusted life-years 10823 -0.10 -0.12 -0.02 0.07 0.85
Incremental cost per QALY gained - no QALY gain no QALY gain no QALY gain £106,503.90 Dominant
AMU bed occupancy 88.24% -1.01% -0.61% -0.56% 0.00% -0.03%
GMW bed occupancy 98.87% 0.00% 0.00% -0.01% -0.24% -3.48%

Emergency and acute medical care
Chapter 41 Cost-effectiveness analyses 64
The results of each intervention scenario are tabulated above, with resource impact and health outcomes in Table 35 and costs and cost-effectiveness in Table 36. A summary of the results are outlined below for each intervention. The overall cost-effectiveness results have been presented on a cost-effectiveness plane for comparison with each other and the £20,000 threshold in Figure 7. There was a large amount of variation between the runs of each scenario; this has been presented for incremental results in Table 37.
Rapid Assessment and Treatment (RAT) in the ED
RAT cost £8,401 per 1,000 hospital presentations. RAT reduced admissions and in turn saw small reductions in ED length of stay, total hospital bed days, four-hour breeches, AMU bed occupancy and mortality. The impact on hospital flow and resource use did not offset the cost of RAT and did not return any QALY gain. As a result, RAT was dominated in the base case by standard care, due to an increase in costs (£7,973) with no QALY gain.
Extended access to therapy in the ED
Extended access to therapy in the ED cost £4,240 per 1,000 hospital presentations. Extended access reduced admissions with a small impact on ED length of stay, total hospital bed days, 4 hour breeches, AMU bed occupancy, medical outliers and mortality. The impact on hospital flow and resource use did not offset the cost of extended access to therapy in ED, with a total cost per 1,000 patients of £4,110. However, there was a mean QALY loss of 0.1 per 1000 patients. As a result, extended access to therapy in ED was deemed not cost-effective in the base case analysis.
Extended access to consultants in the Acute Medical Unit (AMU)
Extended access to consultant in the AMU cost £1,808 per 1000 hospital presentations. There were small reductions in total hospital bed days, 4 hour breeches, AMU bed occupancy, medical outliers and mortality. The impact on hospital flow and resource use did not completely offset the cost of the intervention, with a total cost per 1000 patients of £1,122. There was a mean QALY loss of 0.02 per 1000 patients. As a result, extended access to consultants in the AMU was deemed not cost-effective in the base case analysis.
Daily consultant review on the medical wards
Daily consultant review on the medical wards cost £12,457 per 1000 hospital presentations. There were large reductions in total hospital bed days, medical outliers and mortality. The impact on hospital flow and resource use did not offset the cost of the intervention, with a total cost per 1000 patients of £7,704 and there was a QALY gain of 0.07. the cost per QALY gained was £106,504 and therefore it was not cost effective in the base case analsis.
Extended access to therapy on the medical wards
Extended access to therapy in the medical wards cost £17,441 per 1000 hospital presentations. Extended access saw large reductions in total hospital bed days, four-hour breeches, AMU and GMW bed occupancy, medical outliers and mortality. The impact on hospital flow and resource use offset the cost of extended access to therapy in wards, with a total saving per 1000 patients of £7,209 driven by the large reduction in medical outliers. There was also a mean QALY gain of 0.85 per 1000 patients. As a result, extended access to therapy in the medical wards was deemed to be dominant in the base case, due to large cost savings and increase in QALYs.
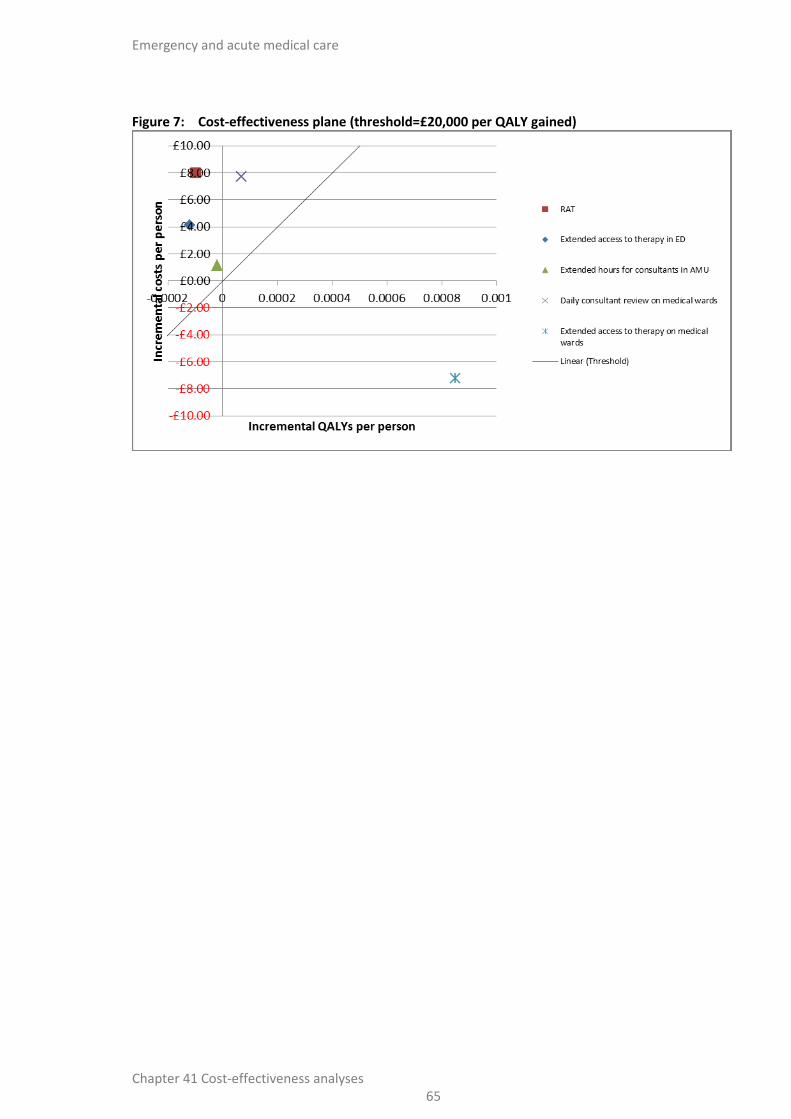
Emergency and acute medical care
Chapter 41 Cost-effectiveness analyses 65
Figure 7: Cost-effectiveness plane (threshold=£20,000 per QALY gained)
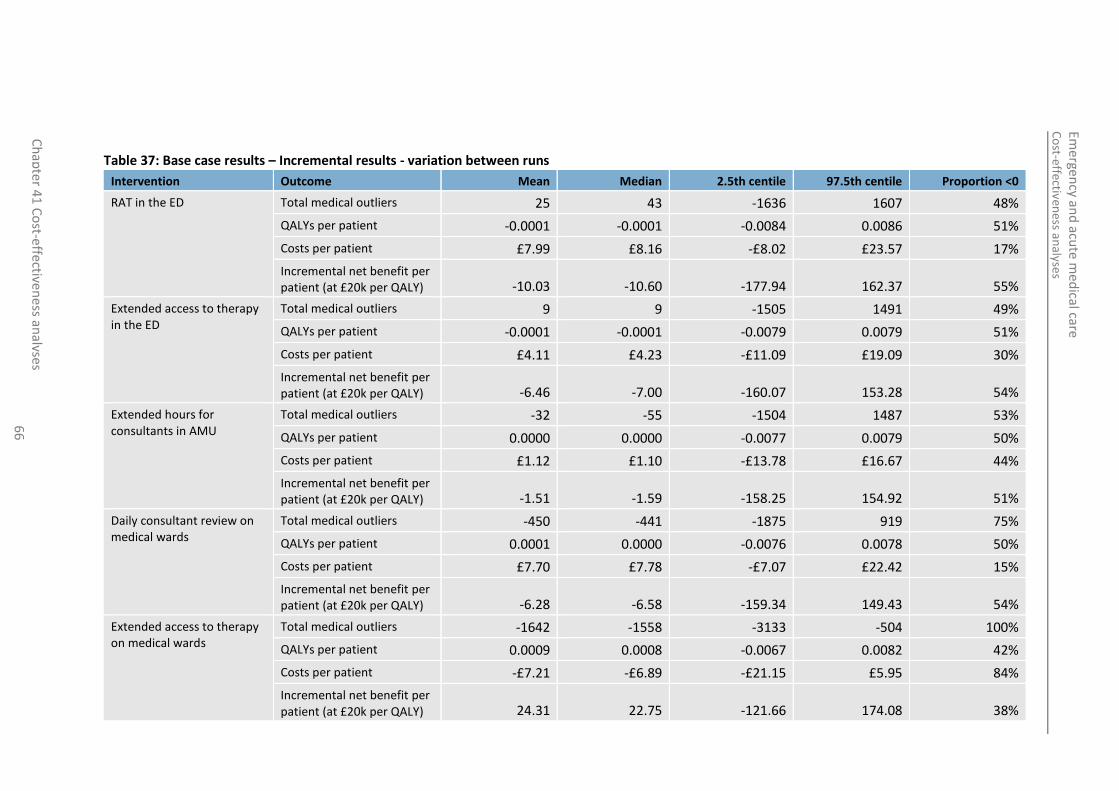
Co
st-effectiveness an
alyses
Emergen
cy and
acute m
edical care
Ch
apte
r 41
Co
st-effectiveness an
alyses 6
6
Table 37: Base case results – Incremental results - variation between runs
Intervention Outcome Mean Median 2.5th centile 97.5th centile Proportion <0
RAT in the ED Total medical outliers 25 43 -1636 1607 48%
QALYs per patient -0.0001 -0.0001 -0.0084 0.0086 51%
Costs per patient £7.99 £8.16 -£8.02 £23.57 17%
Incremental net benefit per patient (at £20k per QALY) -10.03 -10.60 -177.94 162.37 55%
Extended access to therapy in the ED
Total medical outliers 9 9 -1505 1491 49%
QALYs per patient -0.0001 -0.0001 -0.0079 0.0079 51%
Costs per patient £4.11 £4.23 -£11.09 £19.09 30%
Incremental net benefit per patient (at £20k per QALY) -6.46 -7.00 -160.07 153.28 54%
Extended hours for consultants in AMU
Total medical outliers -32 -55 -1504 1487 53%
QALYs per patient 0.0000 0.0000 -0.0077 0.0079 50%
Costs per patient £1.12 £1.10 -£13.78 £16.67 44%
Incremental net benefit per patient (at £20k per QALY) -1.51 -1.59 -158.25 154.92 51%
Daily consultant review on medical wards
Total medical outliers -450 -441 -1875 919 75%
QALYs per patient 0.0001 0.0000 -0.0076 0.0078 50%
Costs per patient £7.70 £7.78 -£7.07 £22.42 15%
Incremental net benefit per patient (at £20k per QALY) -6.28 -6.58 -159.34 149.43 54%
Extended access to therapy on medical wards
Total medical outliers -1642 -1558 -3133 -504 100%
QALYs per patient 0.0009 0.0008 -0.0067 0.0082 42%
Costs per patient -£7.21 -£6.89 -£21.15 £5.95 84%
Incremental net benefit per patient (at £20k per QALY) 24.31 22.75 -121.66 174.08 38%

Co
st-effectiveness an
alyses
Emergen
cy and
acute m
edical care
Ch
apte
r 41
Co
st-effectiveness an
alyses 6
7

Emergency and acute medical care
Chapter 41 Cost-effectiveness analyses 68
41.5.4 Simulation model sensitivity analyses
Sensitivity analyses were planned using more optimistic and most conservative treatment effect estimates. Due to the unexpectedly long run time. Only the following analyses were undertaken:
Daily consultant review was still not cost effective at £81k per QALY with the optimistic treatment effects.
Extended access to therapy in the ED remained dominated with the optimistic treatment effects..
Extended access to therapy on medical wards was no longer dominant with conservative treatment effect estimates but was cost effective as it cost £8k per QALY gained.
41.5.5 Simulation model convergence
Table 38 and Table 39 show the assessment of convergence for key outcomes (incremental to the baseline) for each intervention compared in the base case analysis.
We have only conducted a sufficient of runs to determine all the key outcomes with any level of precision for Extended access to therapy on medical wards.
For Daily consultant review, Rapid Assessment and Treatment and Extended access to therapy in ED sufficient runs were conducted to establish that they were not cost-effective at £20k per QALY but not enough runs to establish the QALY gain and therefore the cost per QALY gained is very imprecise.
For Extended hours for consultants in AMU it is not practical to do enough runs – the signal is too weak compared with the noise.
Table 38: Number of runs at which convergence* was achieved (Base case)
Outcome
Extended hours for consultants in AMU versus Baseline
RAT versus Baseline
Daily consultant review on medical wards versus Baseline
Extended access to therapy in ED versus Baseline
Extended access to therapy on medical wards versus Baseline
n so far 1200 3600 4800 3600 1200
Cost per patient 60 5 7 20 8
QALYs per patient
Not converged
Not converged Not converged Not converged 116
In-hospital mortality per patient
Not converged
Not converged 189 Not converged 173
Medical outliers Not converged
Not converged 27 Not converged 4
Net benefit per patient (£20k per QALY)
Not converged
1608 1541 983 80
* The convergence criterion was that the ‘precision’ should be no greater than 100% of the mean, where the precision is defined half the width of the confidence78.
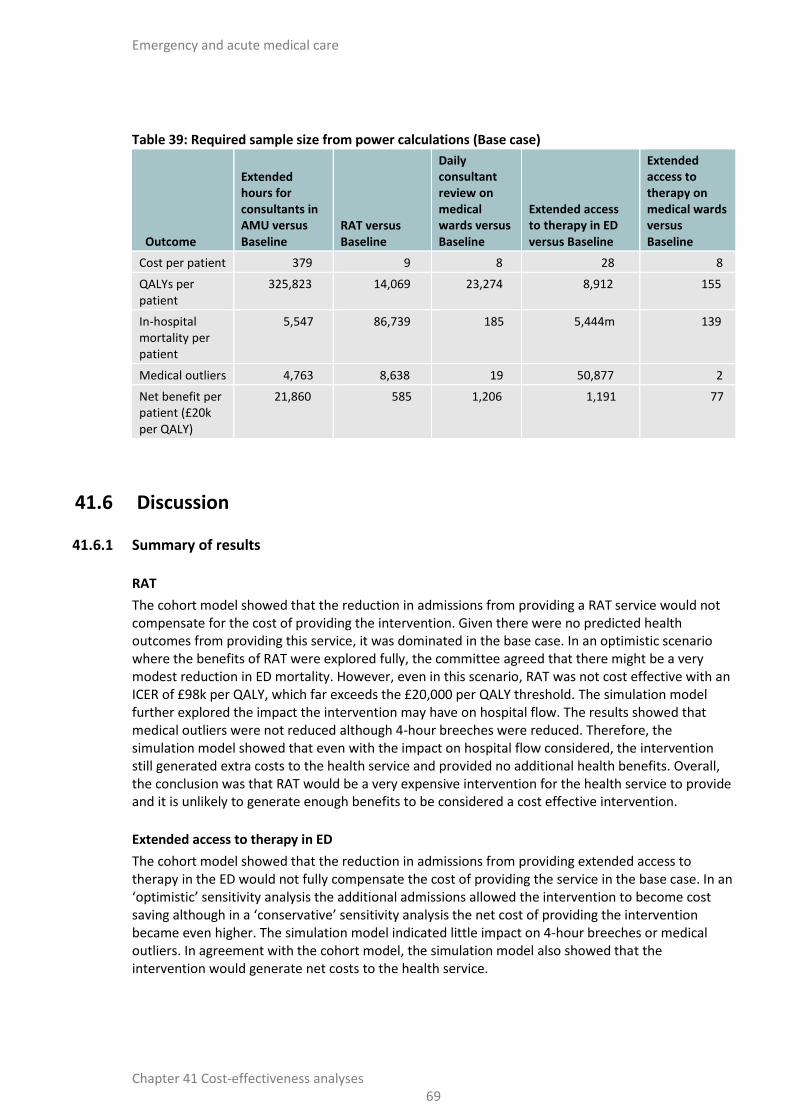
Emergency and acute medical care
Chapter 41 Cost-effectiveness analyses 69
Table 39: Required sample size from power calculations (Base case)
Outcome
Extended hours for consultants in AMU versus Baseline
RAT versus Baseline
Daily consultant review on medical wards versus Baseline
Extended access to therapy in ED versus Baseline
Extended access to therapy on medical wards versus Baseline
Cost per patient 379 9 8 28 8
QALYs per patient
325,823 14,069 23,274 8,912 155
In-hospital mortality per patient
5,547 86,739 185 5,444m 139
Medical outliers 4,763 8,638 19 50,877 2
Net benefit per patient (£20k per QALY)
21,860 585 1,206 1,191 77
41.6 Discussion
41.6.1 Summary of results
RAT
The cohort model showed that the reduction in admissions from providing a RAT service would not compensate for the cost of providing the intervention. Given there were no predicted health outcomes from providing this service, it was dominated in the base case. In an optimistic scenario where the benefits of RAT were explored fully, the committee agreed that there might be a very modest reduction in ED mortality. However, even in this scenario, RAT was not cost effective with an ICER of £98k per QALY, which far exceeds the £20,000 per QALY threshold. The simulation model further explored the impact the intervention may have on hospital flow. The results showed that medical outliers were not reduced although 4-hour breeches were reduced. Therefore, the simulation model showed that even with the impact on hospital flow considered, the intervention still generated extra costs to the health service and provided no additional health benefits. Overall, the conclusion was that RAT would be a very expensive intervention for the health service to provide and it is unlikely to generate enough benefits to be considered a cost effective intervention.
Extended access to therapy in ED
The cohort model showed that the reduction in admissions from providing extended access to therapy in the ED would not fully compensate the cost of providing the service in the base case. In an ‘optimistic’ sensitivity analysis the additional admissions allowed the intervention to become cost saving although in a ‘conservative’ sensitivity analysis the net cost of providing the intervention became even higher. The simulation model indicated little impact on 4-hour breeches or medical outliers. In agreement with the cohort model, the simulation model also showed that the intervention would generate net costs to the health service.

Emergency and acute medical care
Chapter 41 Cost-effectiveness analyses 70
Extended hours for consultants in AMU
The cohort model showed that the reduction in length of stay and ICU admissions did not provide enough cost savings to allow the intervention to provide a net saving to the health service. The intervention did provide health benefits in the form of mortality reduction in the AMU, however, these additional health benefits were not deemed cost effective in the base case with an ICER of £46k per QALY. Using optimistic estimates for the treatment effects the ICER decreased to £25k per QALY however, the intervention was dominated when more conservative treatment effects were applied. Although the cohort model found extended consultant hours in the AMU to not be cost effective in the base case, the additional health outcomes associated with improvements in hospital flow may provide enough additional benefits to allow the intervention to be cost effective. Unfortunately, the number of runs required was such that it was not possible to assess extended hours in AMU – there was too much noise to distinguish the signal. Therefore a definitive conclusion cannot be reached concerning its cost effectiveness.
Daily consultant review
The cohort model showed that the reduction in length of stay and ICU admissions did not provide enough cost savings to allow the intervention to provide a net saving to the health service. The intervention did provide health benefits in the form of mortality reduction seen in the GMW, however these additional health benefits were not deemed cost effective in the base case with an ICER of £48k per QALY. Using optimistic estimates for the treatment effects, the ICER decreased to £20k per QALY however, the intervention was dominated when conservative treatment effects were applied. The simulation model showed that medical outliers were reduced by a 450 per year for the hospital. However, the QALY gain was small and it cost a considerable £107k per QALY gained.
Overall, there is considerable uncertainty concerning the cost effectiveness of daily consultant reviews. Given the substantial cost of providing this intervention there would need to be considerable health benefits and/or cost savings to justify its implementation.
Therapy on medical wards
The cohort model showed that the reduction in length of stay provided enough cost savings to allow the intervention to provide a net saving to the health service of £88k per 1000 patients. The intervention also provided health benefits in the form of quality of life improvements for patients over 65 years of age with a CFS > 3 therefore making the intervention dominant. The treatment remained dominant even when conservative treatment effects were applied. The intervention would have to have significant negative impacts on hospital flow for the cost effectiveness of the intervention to be reversed. Therefore, from the cohort model alone it was considered highly likely that extended therapy access on the wards would be a cost effective and likely cost saving use of resources. The simulation model confirmed this result by also showing large cost savings along with QALY increases. Under all tested scenarios extended access to therapy remained cost effective across both models showing that the likelihood of it being a cost effective (and most likely a cost saving) intervention is very high.
Conclusions for all interventions
Overall RAT was the least likely to be cost effective and extended access to therapy on the wards was the most likely to be cost effective. There was considerable uncertainty concerning the cost effectiveness of all other strategies.
Consideration was given to how these interventions would interact with each other should they hypothetically all be provided at the same time. The 2 interventions in the ED would likely change the case-mix of individuals being admitted to AMU but would be unlikely to have an impact on GMW case mix as avoided admissions would be of low severity. Therefore, the cost effectiveness of interventions on the GMW would likely be independent of the 2 interventions assessed in the ED. The case mix of patients being admitted to the AMU may get worse, with the introduction of the ED

Emergency and acute medical care
Chapter 41 Cost-effectiveness analyses 71
interventions but the net impact on the cost effectiveness of extended consultant hours is not obvious. The ability of the consultant to discharge patients early would be reduced but the health outcomes might increase, since the consultant will be able to focus their attention on the more acutely ill patients.
The 2 interventions that would likely have the most impact on each other would be extended access to therapy on wards and daily consultant reviews. However, it is not clear how they would interact. On the one hand, it seems too optimistic to assume that the length of stay reductions from daily consultant review and extended access to therapy to be additive. However, the 2 interventions could be complementary –it is only possible to discharge a patient if they are signed off by both the therapist and the consultant. This should be a consideration when deciding to implement either service.
41.6.2 Generalisability to other settings
These results are unlikely to be easily transferred to health systems outside of the UK for various reasons, including differences in patient pathways, provision of community and social care.
The models made use of patient flow data from a large district general hospital for the model baseline. The hospital was broadly similar to the national average where comparable data was available. However, the case-mix was a little more severe than average and the data was for the period 2010 to 2016 and we know that hospital outcomes have changed over this time in terms of length of stay, numbers of ED presentations and 4 hour target breeches, to name but a few. At the hospital, most medical admissions started in the AMU and most medical outliers were patients moved from the GMW, rather than patients arriving at the hospital. We believe this is quite common but certainly, there is quite a lot of variation between the pathways of different hospitals across England and the UK. Perhaps the model will be less transferrable to smaller hospitals or larger tertiary hospitals.
In addition, the relative treatment effects assumed in this model might not be transferrable either. In particular, hospitals that are already operating at a high level of effectiveness and efficiency might see a smaller benefit on average.
41.6.3 Limitations and areas for future research
41.6.3.1 Treatment effects
The source of the treatment effects in the model were the expert opinion of the health economics subgroup of the committee. These opinions were informed by the guideline’s systematic review but also by the experience of the individuals and extensive discussion.
Although, the effects and their sizes were initially elicited through a formal consensus process, the subgroup did revise the estimates after extensive discussion, making the effect sizes more modest in each case. There was a deliberate attempt to make the analyses conservative by moderating the effect size (for example, RR=0.99), by targeting the effects on specific patient groups (for example, patients age>65 and CFS>2) and specific parts of the pathway (for example, AMU mortality). Conversely, we tried not to under-estimate intervention costs – these were applied to broad groups of patients and staff time were assumed to be incremental (there is an opportunity cost of the staff time required).
It was believed that the starting point of a hospital, could affect not just the baseline risks and case-mix but also the effect sizes themselves. For example, a hospital/ward that is operating effectively and efficiently with highly trained staff and access to critical care outreach might see much less benefit of daily consultant review than a hospital/ward that is less well-resourced or less well organised.

Emergency and acute medical care
Chapter 41 Cost-effectiveness analyses 72
Analyses were conducted with more optimistic and more conservative effect sizes. In the case of extended therapy on medical wards, it remained cost saving but the other interventions were more sensitive to the magnitude of the treatment effects assumed.
The treatment effects incorporated in the model were those that the committee felt able to quantify. It was believed that these interventions could have other consequences that are not quantifiable. For example, the committee felt that, early consultant assessment in the ED is likely to lead to better quality/location of death for some patients, which are not captured in the model. There might also be reduced testing and fewer adverse events that are not captured.
Critical care outreach teams (CCOT) had been prioritised for modelling but the group decided that they could not estimate key consequences. For example, it was felt that one advantage of CCOT is that it relieves ward nurses and doctors of work but without a time and motions study it was unclear by how much. The only information obtained from the systematic review concerned the impact on cardiac arrests and in-hospital mortality. The committee felt that information on mortality could be misleading as in some instances the use of critical care outreach may be to improve the quality of death, an outcome which could not be captured using the QALY metric.
Overall, we have assessed the analyses as being directly applicable but with potentially serious limitations because the reporting of new trials or other evidence in this area could change the conclusions considerably.
41.6.3.2 Case-mix and baseline data
Since we were interested in the outcome of all non-elective medical patients being seen at an acute hospital, we chose to characterise patients by age, NEWS and CFS rather than diagnosis. In order to have data on patient movements and outcomes in relation to these characteristics, we had to do quite detailed analysis of data from a single large DGH. Had time allowed, we would have liked to repeat this analysis on data from at least one other Trust. Even in this case, we did not have CFS data from the same source as the other data and therefore we had to extrapolate using data from a national audit. In addition, we did not have data for patients in ED to the same level of detail as those admitted (for example, NEWS).
The case-mix of patients from the source hospital were similar to the national average but were slightly more severe. However, changing the case-mix of the population is something that could be dealt with by sensitivity analysis in the future.
We did not explicitly accounted for a weekend admission effect in the model but had we done so the effect might have been to increase the QALY gains from extended consultant hours in AMU and daily consultant review, due to increasing the baseline mortality and absolute reduction in mortality.
The short to long-term survival and quality of life of people who have had an acute medical problem or emergency was done using national data and epidemiological studies. However, this was fraught with difficulties because national statistics and epidemiological are usually either focused on specific diseases or else on the whole population so rarely can people having a specifically medical emergency be identified and followed up. For long-term survival, we found ourselves having to apply standardised mortality ratios to English national mortality data. We think that there is important research that could be done in terms of both:
analysing the survival of AME patients, and
cross-mapping utility scores with frailty scores.

Emergency and acute medical care
Chapter 41 Cost-effectiveness analyses 73
41.6.3.3 Costs
Since staff rotas are complex and vary between hospitals, we did not attempt to model the staff numbers required but instead estimated contact time per patient and costed that time. This assumes that the time involved with the intervention would otherwise have been spent in a productive way.
With regard to the unit cost of staff time, we have based them on contracts in place at the time of analysis but we note that these will change as the move towards a 7-day NHS proceeds.
The majority of the intervention costs are either consultant time or therapist time. Implementation of these interventions will require such staff to be moved from other activity (such as outpatient work) or it would mean training of more staff. Therefore, there might be implications for Health Education England.
We have costed (occupied) bed days with a daily cost. We have costed medical outlying bed days the same as those on medical wards on the basis that there is an opportunity cost of a bed per se. This might not capture the cost of cancelled surgery neither from an NHS perspective nor from the perspective of Trust reimbursement. We have not attached a cost to an unoccupied bed day – although in the model these are relatively few in number, with GMW in particular operating at a very high occupancy level.
41.6.3.4 Simulation model
A patient-level simulation model allows interactions of complex systems, such as hospital pathways, to be explored in more depth than a cohort model. The simulation model simulates individual patients, their characteristics, outcomes and movements within the pathway. The individual patient outcomes can then be aggregated and averaged for results. Simulation models offer advantages over cohort models when94:
There is heterogeneity in the baseline characteristics of the eligible population and particularly where there is a non-linear relationship between characteristics and outcomes (for example, QALYs at the mean age might not equal the mean QALYs).
Disease progression is a continuous process.
Event rates vary by time.
Prior events affect subsequent event rates.
We want to explore the impact of an intervention in the context of fixed resources and queueing.
The interventions explored by our model specifically deal with timing of actions, such as timing and availability of staff interaction. Using a simulation model allows us to target interventions on specific patients and investigate the direct and indirect effects on the entire hospital pathway. A key characteristic of the simulation model is the dynamic use of resources, in this case hospital beds. The simulation model allows beds to be used throughout the pathway picked up and dropped by patients when needed. Having beds within the simulation model creates a flow to the hospital pathway that can be impacted upon positively or negatively by changes to the model, replicating a working hospital with the same pressures on capacity and solutions to accommodating patients. This adds to the cohort model as it allows saved bed days from interventions to be reallocated to other patients. An important outcome of the model, tied in with beds, is medical outliers. Medical outliers were generated as an outcome of the simulation model, resulting from blockages to hospital flow.
Hospitals are complex and our aim was to start with a simple but realistic model. With more time and more data, this model could be extended in the following ways. These modifications are unlikely to affect substantially our estimates of cost effectiveness but they could make certain parameters like bed occupancy and number of 4 hour breeches more realistic:
More detailed specification of locations and patients.

Emergency and acute medical care
Chapter 41 Cost-effectiveness analyses 74
o Currently the model uses large locations to represent multiple wards within the hospital pathway. By not having to allocate patients to sex-specific wards or specialty-specific wards, a higher bed occupancy level is achievable in the model than would be in reality.
o The model also does not include elective and non-medical patients and therefore does not capture their interactions with the acute medical emergency pathway. Simulating elective and non-medical patients would allow estimation of whole hospital occupancy, costs and consequences resulting from interventions in the medical emergency pathway.
More refined transitions between locations.
o The model updates NEWS when patients move to a new location, daily changes in patients’ NEWS scores and corresponding risks, such as mortality and ICU admission, could be implemented to capture variation in condition during a ward length of stay. If we were evaluating interventions that are triggered by NEWS then this would allow a precise estimation of the timing of the intervention.
o Currently, patients move between beds within the model with no time delay. It has been assumed that the delay is built into the sampled length of stay. However, when patients are having length of stay adjusted through decision rules, this allows patients to move between beds immediately. Time to change beds between patients and delays could be implemented within the model when being forced to move beds, such as to an outlier ward, to capture the service delay in moving between beds.
o As well as delays to movements between beds, timings of transfers may not always be realistic. The model adjusts sampled length of stay for those being discharged to represent realistic discharge times from hospital. However, it does not do this for transfers between wards. This means that the time distribution of patient transfers between wards is not taken into account when sampling length of stay and not be representative of a real hospital. The result of this could mean a greater proportion of patient transfers occur outside of normal working hours in the model.
o Systematic reviews of the interventions investigated in the simulation model did not find a significant difference in readmissions. Furthermore, baseline readmission rates by age and CFS are not easily available. Readmissions were therefore not included in the simulated hospital pathway, although data from readmitted patients were not excluded from the data analysis. With the right data, this could be easily incorporated.
More resource constraints
o Resource constraints are used throughout the model to capture hospital capacity and investigate occupancy. However, not all the preadmission areas of the simulated hospital had constraints. The ambulatory acute medical unit could hold constraints. The ED could also be separated into locations for majors, minors and resuscitation, to add more detail and realistically represent a working ED. An additional step in the preadmission area would be to include ambulance queues prior to entry into the hospital, including costs and consequences to the first point of care in the acute medical emergency pathway.
o The model uses staff time to generate unit costs for interventions. However, the model does not simulate individual members of staff and does not take into account their interactions with patients and each other. Including staff as a resource constraint would add a greater level of detail to the model and might allow conclusions on staffing levels to be explored but would probably not be generalisable.
More scenarios
o The model so far has looked at isolated interventions being implemented in the pathway. Some of the interventions target similar cohorts of patients. There is scope to investigate multiple interventions being implemented alongside each other to understand how they would interact. Many other service interventions could be evaluated as long as the pathway of the patients affected can be quantified.
Emergency and acute medical care
Chapter 41 Cost-effectiveness analyses 75
The data used in the model for patient flow was from a single source, a large district general hospital, and so it was internally consistent. The data was stratified by age and NEWS so that correlation between outcomes and pathways could be reasonably estimated but this might have been achieved with greater precision had patient-level data for the whole pathway been used but this would be more complex and time-consuming to analyse.
Probabilities were used to model transitions and then time until the transition takes place. An alternative method would have been to use daily rates, with these rates changing by day of admission. However, our method ensured that mortality and length of stay were kept independent. This was important to avoid double counting of treatment effects, otherwise an intervention that reduced length of stay would inadvertently reduce mortality, even if this were not the intention of the committee.
We have tried to model the hospital to simulate what would happen at times of full capacity. This involved specifying decision rules about who is made a medical outlier and activating these rules when a hospital location is at full capacity. The main principle followed that patients in the early part of their stay would not be prioritised to be an outlier nor would patients with a high NEWS score or those going to rehab or a care home. However, by sampling length of stay from distributions that do not account for how busy the hospital is, the model will only be partially successful at mimicking practice for a number of reasons:
o It will not account for staff working more quickly when under greater pressure.
o In the case of the ED, admitted patients stay longer in the ED at times of stress, as they wait for a bed but those who are not admitted take the same time as when the hospital is busy.
o The model assumes increased risks for those who are made medical outliers reflected in their mortality, length of stay and referrals to ICU/HDU. However, it conservatively does not estimate the negative impact of over-occupancy on the patients that remain on the medical wards.
The simulation model holds a large amount of variability. Due to time constraints, the number of runs was limited. This was a significant limitation. It was concluded that the number of runs required was such that it was not possible to assess extended hours in AMU. For the other interventions the cost per QALY gained was very imprecise.. In order to speed up runtime, we used the parallel processing feature of Simul8, such that 8 runs were run in parallel. A side effect of this is that the exact results of an individual run may differ on different machines despite using an identical random number seed but this should not affect the statistical validity of the results.
The simulation model results do not include any probabilistic sensitivity analyses, such as distributions attached to input parameters. However, as the simulation model has conducted a large number of runs with variability, this may not be a major limitation. It is difficult to put a distribution around the relative treatment effects as these were based on expert opinion.
The model controls for case-mix of patients presenting in the simulated hospital. It would be desirable but not feasible to control further such that the same individual patients die in different scenarios of the same run. Controlling case-mix has reduced ‘noise’ in the analysis substantially but still random variations in mortality by case-mix group seem to be drowning out the effect sizes of interest.
41.6.3.5 Interventions not evaluated
Our modelling has focused on interventions that take place in the hospital. This arose because there were a number of interventions where we had evidence of effectiveness from the guideline’s systematic review but no published evidence of cost effectiveness. There was also reason to believe that the cost of these interventions is substantial. For interventions taking place outside of the hospital, on the other hand, either there was already, published evidence of cost effectiveness (for example, hospital at home) or else there was a lack of evidence of effectiveness (for example, GP home visits). For intermediate care, there were 15 published economic evaluations that were supportive including one based on a discrete event simulation. However, we have planned an

Emergency and acute medical care
Chapter 41 Cost-effectiveness analyses 76
analysis using the simulation model looking at the effects of reducing delayed transfers of care, to inform research around social care provision.
The model could be developed to evaluate other interventions both inside and outside the hospital.
41.6.4 Comparisons with published studies
41.6.4.1 Intervention evidence reviews
RAT in the ED
One RCT found that RAT had no effect on admissions, albeit with large confidence intervals. The idea of increasing admissions is plausible; however, it is likely that there would be a health benefit associated with the additional admissions. This evidence was assessed as being moderate quality. Observational evidence was of very low quality but suggested a reduction in admissions and ED length of stay. Overall, the reduction in admissions and ED length of stay in the observational evidence is likely to be an overestimate of the benefit that RAT may have on these outcomes and therefore it is unlikely that RAT is cost effective.
Extended hours for consultants in the AMU
Only one cohort study was identified in the systematic review. The study showed significant decreases to length of stay, early discharge and mortality from extended access to a consultant on the AMU. All 3 outcomes were included in the model although the treatment effects used were more conservative. One of the main concerns of the study was the differences in baseline between the data the model was built on and the hospital being assessed in the study. For example, length of stay and mortality in the control arm of the study were 9 days and 10% respectively. In the model, average length of stay is 6.4 days and mortality in the AMU is only 1%, albeit the study looks at mortality across all wards. Given that the evidence was assessed as very low quality, the committee agreed that choosing more conservative treatment effects, in line with the baseline, were more appropriate.
Daily consultant review on medical wards
One randomised trial was identified; however, this was only for consultants on the ICU and it was assessing 24-hour access versus daytime access to a consultant. Three other studies included were observational and only 1 compared daily versus twice-weekly consultant review on the GMW. The only outcomes reported by this study were reductions in mortality and readmissions. No impact was found on readmissions but the study showed a significant reduction in mortality. The treatment effect that influences the reduction in mortality used in the model is more conservative. Again, a reason for this was due to a difference in baseline. In the study, mortality was 14.6% whereas in the model mortality is 6.4% in the GMW. One study analysed the impact of twice daily consultant review versus twice weekly. This study looked at the impact on mortality, readmissions and length of stay. The study found that twice daily review reduced length of stay by around 4 days and reduced mortality by an absolute amount of 0.2%. The mean readmission rate was also slightly lower at 0.5%. An economic study that was identified in the review was also conducted using this data and found that costs were £108 lower in the twice-daily consultant review arm; however, consultant time was not included as an opportunity cost, as it is in the model. Overall, the committee decided to use conservative estimates for mortality and length of stay as well as also explore the additional benefit of reducing ICU admissions, an outcome not reported in the evidence for daily consultant reviews.
Extended access to therapy
Two RCTs were identified: 1 in elderly patients and 1 in stroke patients. For the elderly, the evidence suggested an increase in quality of life assessed as moderate quality. There was also a reduction in mortality at 3 months but this was assessed as very low quality evidence. Both studies reported a

Emergency and acute medical care
Chapter 41 Cost-effectiveness analyses 77
length of stay reduction, however in both studies this difference was only interpreted by comparing the medians of both arms. The difference in median length of stay was assessed as 10 days and 1 day for elderly rehabilitation and stroke patients respectively. In the model, extended access to therapy on the ward was assessed by looking at reductions in length of stay and improvements in quality of life. A 1-day reduction in length of stay was chosen as well as a small increase in quality of life. Both estimates were on the conservative side of what was seen from the evidence. Additional assumptions were also put in place such as quality of life only lasting for 1 year. Overall treatment effects were in line with the clinical evidence; however, we were on the more conservative side of what the evidence showed.
An Australian study found providing therapy on a Saturday was cost saving, although this was in a population where medical patients were in the minority.32
No evidence was found on extended therapy access in the ED. Therefore, conservative estimates were chosen. The only outcome of consideration in the model was impact on short stay admissions.
41.6.4.2 Discrete event simulations of acute medical services
We searched for discrete event simulation models that have evaluated acute medical care at the service level (rather than disease-specific models). We found 25 models that evaluated services within a hospital for acutely ill patients.13,14,42,46,51,58,59,70,71,81,82,93,98,100,103,106,107,124,151,153,154,169,172,176,190 Of these, 9 modelled flow beyond the ED.13,46,59,71,81,82,100,124,153
Only one study124 estimated costs and none looked at mortality or other health outcomes. We reported the results of this model in Chapter 12 on the alternatives to hospital. Our model is unique in terms of estimating QALYs, utility or cost effectiveness.
There are more examples that have used discrete event simulation to evaluate service delivery interventions in terms of costs and health outcomes but these have all focused on specific disease populations, such as heart failure178 or stroke.130
Our model is probably unique in modelling age, NEWS and clinical frailty score as primary characteristics of patients.
41.6.5 Conclusions
Of all the interventions the one that is most likely to be cost saving is extending access to therapy on wards. These cost savings are ‘opportunity cost’ savings and would not necessarily be realised by trusts, unless they lead to ward closures, but they might avoid the need to open more wards in the future and could increase Trust income by reducing cancellations of surgical procedures.
It is likely that RAT would not be a cost effective use of NHS resources. It is unlikely that any health benefits would be realised from implementing the intervention and the assumed cost savings are very far away from making the intervention cost saving. However, Trusts might still consider it worthwhile as a means of meeting the 4-hour target.
The cost effectiveness of extended consultant hours on the AMU, daily consultant reviews on the GMW and extended access to therapy on the ED is highly uncertain. The cost effectiveness changes under a variety of scenarios, all of which are plausible. The baseline of the hospital under consideration would determine the appropriateness of each intervention. Case-mix, hospital size and efficiency are all key factors that would play a part in determining the cost effectiveness of these interventions. A hospital that has few medical outliers for example would benefit less from the implementation of these interventions.
Although the analysis gives indications as to which interventions have the highest potential to be cost effective, the conclusions for the majority of interventions cannot be taken to be certain. This means

Emergency and acute medical care
Chapter 41 Cost-effectiveness analyses 78
the role of local or regional assessment will be crucial when trusts consider the use of these interventions. Local analysis of patient flow and health and social care system (particularly delayed transfers of care) may indicate which interventions will deliver best value. Following the intervention further analysis of effect is then crucial to confirm that value.
Overall, this analysis was assessed as being directly applicable but with potentially serious limitations. There is considerable complexity and uncertainty concerning hospital flows and each hospital is likely to react to different scenarios, for example, when full capacity is reached. This analysis was conducted with the best available data. However, the evidence to inform treatment effects was largely determined by elicited expert opinion.
There is a need for more research to determine the effects of these service delivery interventions in different settings. There are potential benefits to hospital flow from reducing delayed transfers of care that need further investigation. To inform future models, it would be helpful if there were more observational studies in to the survival and utility of patients presenting with acute medical problems.

Emergency and acute medical care
Chapter 41 Cost-effectiveness analyses 79
41.7 References
1 Slash diversion, improve care of boarded patients with an ED-based hospital medicine (HMED) team. ED Management. 2012; 24(11):124-127
2 Study: hospitals struggle to implement proven strategies for eliminating ED boarding, crowding. ED Management. 2012; 24(11):121-124
3 Agborsangaya CB, Lau D, Lahtinen M, Cooke T, Johnson JA. Health-related quality of life and healthcare utilization in multimorbidity: results of a cross-sectional survey. Quality of Life Research. 2013; 22(4):791-799
4 Alakeson V, Pande N, Ludwig M. A plan to reduce emergency room 'boarding' of psychiatric patients. Health Affairs. 2010; 29(9):1637-1642
5 Alameda C, Suarez C. Clinical outcomes in medical outliers admitted to hospital with heart failure. European Journal of Internal Medicine. 2009; 20(8):764-767
6 Aldridge C, Bion J, Boyal A, Chen YF, Clancy M, Evans T et al. Weekend specialist intensity and admission mortality in acute hospital trusts in England: a cross-sectional study. The Lancet.: Elsevier. 2016; 388(10040):178-186
7 American College of Emergency Physicians. Caring for emergency department "boarders". Annals of Emergency Medicine. 2005; 46(1):104
8 Anselmi L, Meacock R, Kristensen SR, Doran T, Sutton M. Arrival by ambulance explains variation in mortality by time of admission: retrospective study of admissions to hospital following emergency department attendance in England. BMJ Quality & Safety. 2016;
9 Ara R, Brazier JE. Using health state utility values from the general population to approximate baselines in decision analytic models when condition-specific data are not available. Value in Health. 2011; 14(4):539-545
10 Arabi Y, Alshimemeri A, Taher S. Weekend and weeknight admissions have the same outcome of weekday admissions to an intensive care unit with onsite intensivist coverage. Critical Care Medicine. 2006; 34(3):605-611
11 Aylin P, Yunus A, Bottle A, Majeed A, Bell D. Weekend mortality for emergency admissions. A large, multicentre study. Quality and Safety in Health Care. 2010; 19(3):213-217
12 Bagshaw SM, Stelfox HT, McDermid RC, Rolfson DB, Tsuyuki RT, Baig N et al. Association between frailty and short- and long-term outcomes among critically ill patients: a multicentre prospective cohort study. CMAJ Canadian Medical Association Journal. 2014; 186(2):E95-E102
13 Bagust A, Place M, Posnett JW. Dynamics of bed use in accommodating emergency admissions: stochastic simulation model. BMJ. 1999; 319(7203):155-158
14 Bair AE, Song WT, Chen Y-C, Morris BA. The impact of inpatient boarding on ED efficiency: a discrete-event simulation study. Journal of Medical Systems. 2010; 34(5):919-929

Emergency and acute medical care
Chapter 41 Cost-effectiveness analyses 80
15 Bakhsh HT, Perona SJ, Shields WA, Salek S, Sanders AB, Patanwala AE. Medication errors in psychiatric patients boarded in the emergency department. International Journal of Risk and Safety in Medicine. 2014; 26(4):191-198
16 Bardsley M, Georghiou T, and Dixon J. Social care and hospital use at the end of life. The Nuffield Trust, 2010. Available from: https://www.nuffieldtrust.org.uk/research/social-care-and-hospital-use-at-the-end-of-life
17 Barer D. Do studies of the weekend effect really allow for differences in illness severity? An analysis of 14 years of stroke admissions. Age and Ageing. 2016;
18 Barnett AG, Graves N, Cooper BS, Batra R, Edgeworth JD. Hospitals are dangerous places. Medical Journal of Australia. 2008; 189(11-12):672
19 Barton P, Jobanputra P, Wilson J, Bryan S, Burls A. The use of modelling to evaluate new drugs for patients with a chronic condition: the case of antibodies against tumour necrosis factor in rheumatoid arthritis. Health Technology Assessment. 2004; 8(11):iii, 1-iii,91
20 Bazarian JJ, Schneider SM, Newman VJ, Chodosh J. Do admitted patients held in the emergency department impact the throughput of treat-and-release patients? Academic Emergency Medicine. 1996; 3(12):1113-1118
21 Becker DJ. Weekend hospitalization and mortality: a critical review. Expert Review of Pharmacoeconomics and Outcomes Research. 2008; 8(1):23-26
22 Beecher S, O'Leary DP, McLaughlin R. Increased risk environment for emergency general surgery in the context of regionalization and specialization. International Journal of Surgery. 2015; 21:112-114
23 Bell D, Lambourne A, Percival F, Laverty AA, Ward DK. Consultant input in acute medical admissions and patient outcomes in hospitals in England: a multivariate analysis. PloS One. 2013; 8(4):e61476
24 Bing-Hua YU. Delayed admission to intensive care unit for critically surgical patients is associated with increased mortality. American Journal of Surgery. 2014; 208(2):268-274
25 Blay N, Donoghue J, Mitten-Lewis S. A retrospective comparative study of patients with chest pain and intra-ward transfers. Australian Health Review. 2002; 25(2):145-154
26 Blom MC, Landin-Olsson M, Lindsten M, Jonsson F, Ivarsson K. Patients presenting at the emergency department with acute abdominal pain are less likely to be admitted to inpatient wards at times of access block: a registry study. Scandinavian Journal of Trauma, Resuscitation and Emergency Medicine. 2015; 23:78
27 Bornemann-Shepherd M, Le-Lazar J, Makic MBF, DeVine D, McDevitt K, Paul M. Caring for inpatient boarders in the emergency department: improving safety and patient and staff satisfaction. Journal of Emergency Nursing. 2015; 41(1):23-29
28 Bray BD, Ayis S, Campbell J, Cloud GC, James M, Hoffman A et al. Associations between stroke mortality and weekend working by stroke specialist physicians and registered nurses: prospective multicentre cohort study. PLoS Medicine. 2014; 11(8):e1001705
Emergency and acute medical care
Chapter 41 Cost-effectiveness analyses 81
29 Bray BD, Cloud GC, James MA, Hemingway H, Paley L, Stewart K et al. Weekly variation in health-care quality by day and time of admission: a nationwide, registry-based, prospective cohort study of acute stroke care. The Lancet.: Elsevier. 2016; 388(10040):170-177
30 Brennan A, Chick SE, Davies R. A taxonomy of model structures for economic evaluation of health technologies. Health Economics. 2006; 15(12):1295-1310
31 Brims FJH, Asiimwe A, Andrews NP, Prytherch D, Higgins BR, Kilburn S et al. Weekend admission and mortality from acute exacerbations of chronic obstructive pulmonary disease in winter. Clinical Medicine. 2011; 11(4):334-339
32 Brusco NK, Watts JJ, Shields N, Taylor NF. Is cost effectiveness sustained after weekend inpatient rehabilitation? 12 month follow up from a randomized controlled trial. BMC Health Services Research. 2015; 15:165
33 Campbell JTP, Bray BD, Hoffman AM, Kavanagh SJ, Rudd AG, Tyrrell PJ et al. The effect of out of hours presentation with acute stroke on processes of care and outcomes: analysis of data from the Stroke Improvement National Audit Programme (SINAP). PloS One. 2014; 9(2):e87946
34 Carr BG, Hollander JE, Baxt WG, Datner EM, Pines JM. Trends in boarding of admitted patients in US Emergency Departments 2003-2005. Journal of Emergency Medicine. 2010; 39(4):506-511
35 Cavallazzi R, Marik PE, Hirani A, Pachinburavan M, Vasu TS, Leiby BE. Association between time of admission to the ICU and mortality: a systematic review and metaanalysis. Chest. 2010; 138(1):68-75
36 Cha WC, Cho JS, Shin SD, Lee EJ, Ro YS. The impact of prolonged boarding of successfully resuscitated out-of-hospital cardiac arrest patients on survival-to-discharge rates. Resuscitation. 2015; 90:25-29
37 Chalfin DB, Trzeciak S, Likourezos A, Baumann BM, Dellinger RP, DELAY-ED study group. Impact of delayed transfer of critically ill patients from the emergency department to the intensive care unit. Critical Care Medicine. 2007; 35(6):1477-1483
38 Clark K, Normile L. Nursing informatics and data collection from the electronic medical record: study of characteristics, factors and occupancy impacting outcomes of critical care admissions from the Emergency Department. Health Informatics Journal. 2012; 18(4):309-319
39 Clark K, Normile LB. Influence of time-to-interventions for emergency department critical care patients on hospital mortality. Journal of Emergency Nursing. 2007; 33(1):6-90
40 Cohen ME, Bilimoria KY, Ko CY, Richards K, Hall BL. Variability in length of stay after colorectal surgery: assessment of 182 hospitals in the national surgical quality improvement program. Annals of Surgery. 2009; 250(6):901-907
41 Coil CJ, Flood JD, Belyeu BM, Young P, Kaji AH, Lewis RJ. The effect of emergency department boarding on order completion. Annals of Emergency Medicine. 2016; 67(6):730-736
42 Connelly LG, Bair AE. Discrete event simulation of emergency department activity: a platform for system-level operations research. Academic Emergency Medicine. 2004; 11(11):1177-1185
43 Conway R, Cournane S, Byrne D, O'Riordan D, Coveney S, Silke B. The relationship between social deprivation and a weekend emergency medical admission. Acute Medicine. 2016; 15(3):124-129
Emergency and acute medical care
Chapter 41 Cost-effectiveness analyses 82
44 Conway R, Cournane S, Byrne D, O'Riordan D, Silke B. Time patterns in mortality after an emergency medical admission; relationship to weekday or weekend admission. European Journal of Internal Medicine. 2016; 36:44-49
45 Courtney M, Edwards H, Chang A, Parker A, Finlayson K, Hamilton K. Fewer emergency readmissions and better quality of life for older adults at risk of hospital readmission: a randomized controlled trial to determine the effectiveness of a 24-week exercise and telephone follow-up program. Journal of the American Geriatrics Society. 2009; 57(3):395-402
46 Crawford EA, Parikh PJ, Kong N, Thakar CV. Analyzing discharge strategies during acute care: a discrete-event simulation study. Medical Decision Making. 2014; 34(2):231-241
47 Creamer GL, Dahl A, Perumal D, Tan G, Koea JB. Anatomy of the ward round: the time spent in different activities. ANZ Journal of Surgery. 2010; 80(12):930-932
48 Cubeddu RJ, Cruz-Gonzalez I, Kiernan TJ, Truong QA, Rosenfield K, Leinbach RC et al. ST-elevation myocardial infarction mortality in a major academic center "on-" versus "off-" hours. Journal of Invasive Cardiology. 2009; 21(10):518-523
49 Curtis L. Unit costs of health and social care 2014. Canterbury: Personal Social Services Research Unit, University of Kent; 2014. Available from: http://www.pssru.ac.uk/project-pages/unit-costs/2014/index.php
50 Curtis L. Unit costs of health and social care 2015. Canterbury: Personal Social Services Research Unit, University of Kent; 2015. Available from: http://www.pssru.ac.uk/project-pages/unit-costs/2015/index.php
51 Day TE, Al-Roubaie AR, Goldlust EJ. Decreased length of stay after addition of healthcare provider in emergency department triage: a comparison between computer-simulated and real-world interventions. Emergency Medicine Journal. 2013; 30(2):134-138
52 de Cordova PB, Phibbs CS, Bartel AP, Stone PW. Twenty-four/seven: a mixed-method systematic review of the off-shift literature. Journal of Advanced Nursing. 2012; 68(7):1454-1468
53 Degenhardt N. Increased mortality among the critically ill patients admitted on weekends: a global trend. Dynamics. 2011; 22(3):14-18
54 Denno J. Caring for critical care boarders in the emergency department. Journal of Emergency Nursing. 2014; 40(1):e11-e18
55 Department of Health. NHS reference costs 2013-14. 2014. Available from: http://www.gov.uk/government/publications/nhs-reference-costs-2013-to-2014 [Last accessed: 12 March 2015]
56 Department of Health. Reference costs collection guidance for 2013-14. 2014. Available from: http://www.gov.uk/government/publications/nhs-reference-costs-collection-guidance-for-2013-to-2014 [Last accessed: 25 March 2015]
57 Deshmukh H, Hinkley M, Dulhanty L, Patel HC, Galea JP. Effect of weekend admission on in-hospital mortality and functional outcomes for patients with acute subarachnoid haemorrhage (SAH). Acta Neurochirurgica. 2016; 158(5):829-835
Emergency and acute medical care
Chapter 41 Cost-effectiveness analyses 83
58 Duguay C, Chetouane F. Modeling and improving emergency department systems using discrete event simulation. Transactions of the Society For Modeling and Simulation International. 2007; 83(4):311-320
59 Eatock J, Clarke M, Picton C, Young T. Meeting the four-hour deadline in an A&E department. Journal of Health, Organisation and Management. 2011; 25(6):606-624
60 Eriksen BO, Kristiansen IS, Nord E, Pape JF, Almdahl SM, Hensrud A et al. Does admission to a department of internal medicine improve patients' quality of life? Journal of Internal Medicine. 1998; 244(5):397-404
61 Falvo T, Grove L, Stachura R, Vega D, Stike R, Schlenker M et al. The opportunity loss of boarding admitted patients in the emergency department. Academic Emergency Medicine. 2007; 14(4):332-337
62 Freemantle N, Richardson M, Wood J, Ray D, Khosla S, Shahian D et al. Weekend hospitalization and additional risk of death: an analysis of inpatient data. Journal of the Royal Society of Medicine. 2012; 105(2):74-84
63 Freemantle N, Ray D, McNulty D, Rosser D, Bennett S, Keogh BE et al. Increased mortality associated with weekend hospital admission: a case for expanded seven day services? BMJ. 2015; 351:h4596
64 Geraci JM, Johnson ML, Gordon HS, Petersen NJ, Shroyer AL, Grover FL et al. Mortality after cardiac bypass surgery: prediction from administrative versus clinical data. Medical Care. 2005; 43(2):149-158
65 Goldacre MJ, Maisonneuve JJ. Mortality from meningococcal disease by day of the week: English national linked database study. Journal of Public Health. 2013; 35(3):413-421
66 Goldblatt P, Moser K, Fox J, Pugh H, Rosato M, Leon D. Longitudinal study. Mortality and social organisation. Series LS No. 6. London: Office of Population Censuses and Surveys; 1990
67 Goodacre SW, Wilson RW, Bradburn M, Santarelli M, Nicholl JP. Health utility after emergency medical admission: a cross-sectional survey. Health and Quality of Life Outcomes. 2012; 10:20
68 Gordon HS, Johnson ML, Wray NP, Petersen NJ, Henderson WG, Khuri SF et al. Mortality after noncardiac surgery: prediction from administrative versus clinical data. Medical Care. 2005; 43(2):159-167
69 Gralnek IM. Evaluating the "weekend effect" on patient outcomes in upper GI bleeding. Gastrointestinal Endoscopy. 2014; 80(2):236-238
70 Gunal MM, Pidd M. Understanding target-driven action in emergency department performance using simulation. Emergency Medical Journal. 2009; 26(10):724-727
71 Gunal MM, Pidd M. DGHPSim: generic simulation of hospital performance. ACM Transactions on Modeling and Computer Simulation. 2011; 21(4):23
72 Gunnarsdottir OS. Users of a hospital emergency department: diagnoses and mortality of those discharged home from the emergency department. Nordic School of Public Health, 2006. Available from: http://nhv.episerverhotell.net/upload/dokument/forskning/Publikationer/MPH/MPH2005-39_O.Gunnarsdottir.pdf
Emergency and acute medical care
Chapter 41 Cost-effectiveness analyses 84
73 Gunnarsdottir OS, Rafnsson V. Mortality of the users of a hospital emergency department. Emergency Medicine Journal. 2006; 23(4):269-273
74 Haas JM, Gundrum JD, Rathgaber SW. Comparison of time to endoscopy and outcome between weekend/weekday hospital admissions in patients with upper GI hemorrhage. WMJ. 2012; 111(4):161-165
75 Hamilton P, Mathur S, Gemeinhardt G, Eschiti V, Campbell M. Expanding what we know about off-peak mortality in hospitals. Journal of Nursing Administration. 2010; 40(3):124-128
76 Health & Social Care Information Centre. Accident and Emergency Attendances - England, 2014-15: tables [.xlsx], 2015. Available from: http://www.hscic.gov.uk/catalogue/PUB19883
77 Health & Social Care Information Centre, NHS Information Centre. HESonline: hospital episode statistics. 2011. Available from: http://www.hesonline.nhs.uk/ [Last accessed: 21 September 2011]
78 Hoad K, Robinson S, and Davies R. Automating DES output analysis: How many replications to run, 2007. Available from: http://www.informs-sim.org/wsc07papers/060.pdf
79 Hoehn RS, Hanseman DJ, Chang AL, Daly MC, Ertel AE, Abbott DE et al. Surgeon characteristics supersede hospital characteristics in mortality after urgent colectomy. Journal of Gastrointestinal Surgery. 2017; 21(1):23-32
80 Hohloch K, Bertram N, Trumper L, Beissbarth T, Griesinger F. Superior vena cava syndrome caused by a malignant tumor: a retrospective single-center analysis of 124 cases. Journal of Cancer Research and Clinical Oncology. 2014; 140(12):2129-2134
81 Holm LB, Luras H, Dahl FA. Improving hospital bed utilisation through simulation and optimisation. With application to a 40% increase in patient volume in a Norwegian general hospital. International Journal of Medical Informatics. 2013; 82(2):80-89
82 Hoot NR, LeBlanc LJ, Jones I, Levin SR, Zhou C, Gadd CS et al. Forecasting emergency department crowding: a discrete event simulation. Annals of Emergency Medicine. 2008; 52(2):116-125
83 Horwich TB, Hernandez AF, Liang L, Albert NM, Labresh KA, Yancy CW et al. Weekend hospital admission and discharge for heart failure: association with quality of care and clinical outcomes. American Heart Journal. 2009; 158(3):451-458
84 Hsu JC, Varosy PD, Parzynski CS, Chaudhry SI, Dewland TA, Curtis JP et al. Procedure timing as a predictor of inhospital adverse outcomes from implantable cardioverter-defibrillator implantation: insights from the National Cardiovascular Data Registry. American Heart Journal. 2015; 169(1):45-52
85 Hutchinson A, Rasekaba TM, Graco M, Berlowitz DJ, Hawthorne G, Lim WK. Relationship between health-related quality of life, and acute care re-admissions and survival in older adults with chronic illness. Health and Quality of Life Outcomes. 2013; 11:136
86 Hutchinson AF, Graco M, Rasekaba TM, Parikh S, Berlowitz DJ, Lim WK. Relationship between health-related quality of life, comorbidities and acute health care utilisation, in adults with chronic conditions. Health and Quality of Life Outcomes. 2015; 13:69
Emergency and acute medical care
Chapter 41 Cost-effectiveness analyses 85
87 Hwang U, Richardson L, Livote E, Harris B, Spencer N, Sean Morrison R. Emergency department crowding and decreased quality of pain care. Academic Emergency Medicine. 2008; 15(12):1248-1255
88 Iqbal MB, Khamis R, Ilsley C, Mikhail G, Crake T, Firoozi S et al. Time-trend analyses of bleeding and mortality after primary percutaneous coronary intervention during out of working hours versus in-working hours: an observational study of 11466 patients. Circulation Cardiovascular Interventions. 2015; 8(6):e002206
89 Jairath V, Kahan BC, Logan RFA, Hearnshaw SA, Travis SPL, Murphy MF et al. Mortality from acute upper gastrointestinal bleeding in the United Kingdom: does it display a "weekend effect"? American Journal of Gastroenterology. 2011; 106(9):1621-1628
90 Jansen JO, Maclennan GS, Cuthbertson BH. Effect of day and time of admission on mortality in an intensive care unit. Journal of the Intensive Care Society. 2013; 14(4):294-298
91 Jauss M, Oertel W, Allendoerfer J, Misselwitz B, Hamer H. Bias in request for medical care and impact on outcome during office and non-office hours in stroke patients. European Journal of Neurology. 2009; 16(10):1165-1167
92 Jiang F, Zhang JH, Qin X. "Weekend effects" in patients with intracerebral hemorrhage. Acta Neurochirurgica. 2011; 111:333-336
93 Kang H, Nembhard HB, Rafferty C, Deflitch CJ. Patient flow in the emergency department: a classification and analysis of admission process policies. Annals of Emergency Medicine. 2014; 64(4):335
94 Karnon J, Haji Ali AH. When to use discrete event simulation (DES) for the economic evaluation of health technologies? A review and critique of the costs and benefits of DES. Pharmacoeconomics. 2014; 32(6):547-558
95 Karnon J, Stahl J, Brennan A, Caro JJ, Mar J, Moller J. Modeling using discrete event simulation: a report of the ISPOR-SMDM Modeling Good Research Practices Task Force-4. Medical Decision Making. 2012; 32(5):701-711
96 Karthikesalingam A, Holt PJ, Vidal-Diez A, Ozdemir BA, Poloniecki JD, Hinchliffe RJ et al. Mortality from ruptured abdominal aortic aneurysms: clinical lessons from a comparison of outcomes in England and the USA. The Lancet. 2014; 383(9921):963-969
97 Keatinge WR, Donaldson GC. Changes in mortalities and hospital admissions associated with holidays and respiratory illness: implications for medical services. Journal of Evaluation in Clinical Practice. 2005; 11(3):275-281
98 Kilmer RA, Smith AE, Shuman LJ. An emergency department simulation and a neural network metamodel. Journal of the Society for Health Systems. 1997; 5(3):63-79
99 Kolic I, Crane S, McCartney S, Perkins Z, Taylor A. Factors affecting response to national early warning score (NEWS). Resuscitation. 2015; 90:85-90
100 Komashie A, Mousavi A. Modeling emergency departments using discrete event simulation techniques. Simulation Conference, 2005 Proceedings of the Winter 2005;5

Emergency and acute medical care
Chapter 41 Cost-effectiveness analyses 86
101 Kruth P, Zeymer U, Gitt A, Junger C, Wienbergen H, Niedermeier F et al. Influence of presentation at the weekend on treatment and outcome in ST-elevation myocardial infarction in hospitals with catheterization laboratories. Clinical Research in Cardiology. 2008; 97(10):742-747
102 Kulstad EB, Sikka R, Sweis RT, Kelley KM, Rzechula KH. ED overcrowding is associated with an increased frequency of medication errors. American Journal of Emergency Medicine. 2010; 28(3):304-309
103 Laker LF, Froehle CM, Lindsell CJ, Ward MJ. The flex track: flexible partitioning between low- and high-acuity areas of an emergency department. Annals of Emergency Medicine. 2014; 64(6):591-603
104 Lecumberri R, Soler S, Del Toro J, Barba R, Rosa V, Ciammaichella MM et al. Effect of the time of diagnosis on outcome in patients with acute venous thromboembolism. Findings from the RIETE Registry. Thrombosis and Haemostasis. 2011; 105(1):45-51
105 Leong KS, Titman A, Brown M, Powell R, Moore E, Bowen-Jones D. A retrospective study of seven-day consultant working: reductions in mortality and length of stay. Journal of the Royal College of Physicians of Edinburgh. 2015; 45(4):261-267
106 Lim ME, Worster A, Goeree R, Tarride JE. Simulating an emergency department: the importance of modeling the interactions between physicians and delegates in a discrete event simulation. BMC Medical Informatics and Decision Making. 2013; 13:59
107 Lin C-H, Kao C-Y, Huang C-Y. Managing emergency department overcrowding via ambulance diversion: a discrete event simulation model. Journal of the Formosan Medical Association. 2015; 114(1):64-71
108 Liu SW, Thomas SH, Gordon JA, Hamedani AG, Weissman JS. A pilot study examining undesirable events among emergency department-boarded patients awaiting inpatient beds. Annals of Emergency Medicine. 2009; 54(3):381-385
109 Lloyd JM, Elsayed S, Majeed A, Kadambande S, Lewis D, Mothukuri R et al. The practice of out-lying patients is dangerous: a multicentre comparison study of nursing care provided for trauma patients. Injury. 2005; 36(6):710-713
110 Lorenzano S, Ahmed N, Tatlisumak T, Gomis M, Davalos A, Mikulik R et al. Within-day and weekly variations of thrombolysis in acute ischemic stroke: results from safe implementation of treatments in stroke-international stroke thrombolysis register. Stroke. 2014; 45(1):176-184
111 Maggs F, Mallet M. Mortality in out-of-hours emergency medical admissions--more than just a weekend effect. Journal of the Royal College of Physicians of Edinburgh. 2010; 40(2):115-118
112 Magid DJ, Wang Y, Herrin J, McNamara RL, Bradley EH, Curtis JP et al. Relationship between time of day, day of week, timeliness of reperfusion, and in-hospital mortality for patients with acute ST-segment elevation myocardial infarction. JAMA - Journal of the American Medical Association. 2005; 294(7):803-812
113 Mahmoudian-Dehkordi A, Sadat S. Sustaining critical care: using evidence-based simulation to evaluate ICU management policies. Health Care Management Science. 2016;
114 Mansbach JM, Wharff E, Austin SB, Ginnis K, Woods ER. Which psychiatric patients board on the medical service? Pediatrics. 2003; 111(6 Pt 1):e693-e698

Emergency and acute medical care
Chapter 41 Cost-effectiveness analyses 87
115 McCallum IJD, McLean RC, Dixon S, O'Loughlin P. Retrospective analysis of 30-day mortality for emergency general surgery admissions evaluating the weekend effect. British Journal of Surgery. 2016; 103(11):1557-1565
116 McKnight JA, Espie C. Managing acute medical admissions: the plight of the medical boarder. Scottish Medical Journal. 2012; 57(1):45-47
117 McLean RC, McCallum IJD, Dixon S, O'Loughlin P. A 15-year retrospective analysis of the epidemiology and outcomes for elderly emergency general surgical admissions in the North East of England: a case for multidisciplinary geriatric input. International Journal of Surgery. 2016; 28:13-21
118 Meacock R, Anselmi L, Kristensen SR, Doran T, Sutton M. Higher mortality rates amongst emergency patients admitted to hospital at weekends reflect a lower probability of admission. Journal of Health Services Research and Policy. 2016; Epub
119 Meacock R, Doran T, Sutton M. What are the costs and benefits of providing comprehensive seven-day services for emergency hospital admissions? Health Economics. 2015; 24(8):907-912
120 Metcalfe L, McNally S, Smith SMS. A review of inpatient ward location and the relationship to Medical Emergency Team calls. International Emergency Nursing. 2016;
121 Mohammed MA, Faisal M, Richardson D, Howes R, Beaston K, Speed K et al. Adjusting for illness severity shows there is no difference in patient mortality at weekends or weekdays for emergency medical admissions. QJM. 2016;
122 Mohammed MA, Sidhu KS, Rudge G, Stevens AJ. Weekend admission to hospital has a higher risk of death in the elective setting than in the emergency setting: a retrospective database study of national health service hospitals in England. BMC Health Services Research. 2012; 12:87
123 Mohammed N, Rehman A, Swinscoe MT, Mundre P, Rembacken B. Outcomes of acute upper gastrointestinal bleeding in relation to timing of endoscopy and the experience of endoscopist: a tertiary center experience. Endoscopy International Open. 2016; 4(3):E282-E286
124 Monitor. Moving healthcare closer to home: financial impacts, 2015. Available from: https://www.gov.uk/guidance/moving-healthcare-closer-to-home
125 Morton B, Nagaraja S, Collins A, Pennington SH, Blakey JD. A retrospective evaluation of critical care blood culture yield - do support services contribute to the "weekend effect"? PloS One. 2015; 10(10):e0141361
126 Mpotsaris A, Kowoll A, Weber W, Kabbasch C, Weber A, Behme D. Endovascular stroke therapy at nighttime and on weekends-as fast and effective as during normal business hours? Journal of Vascular and Interventional Neurology. 2015; 8(1):39-45
127 Murphy JFA. Revisiting higher hospital weekend mortality. Irish Medical Journal. 2015; 108(8):228
128 Mustafa F, Gilligan P, Obu D, O'Kelly P, O'Hea E, Lloyd C et al. 'Delayed discharges and boarders': a 2-year study of the relationship between patients experiencing delayed discharges from an acute hospital and boarding of admitted patients in a crowded ED. Emergency Medicine Journal. 2016; 33(9):636-640

Emergency and acute medical care
Chapter 41 Cost-effectiveness analyses 88
129 Nakajima M, Inatomi Y, Yonehara T, Watanabe M, Ando Y. Outcome in patients admitted outside regular hospital working hours: does time until regular working hours matter? International Journal of Stroke. 2015; 10(1):79-84
130 National Audit Office. Progress in improving stroke care: report on the findings from our modelling of stroke care provision. London. National Audit Office, 2010. Available from: http://www.nao.org.uk/report/department-of-health-progress-in-improving-stroke-care/
131 National Institute for Health and Care Excellence. Developing NICE guidelines: the manual. London. National Institute for Health and Care Excellence, 2014. Available from: http://www.nice.org.uk/article/PMG20/chapter/1%20Introduction%20and%20overview
132 National Institute for Health and Care Excellence. Safe nurse staffing for A&E departments: economic report, 2014. Available from: https://www.nice.org.uk/guidance/gid-sgwave0762/documents/accident-and-emergency-departments-economic-report2
133 National Institute for Health and Clinical Excellence. Social value judgements: principles for the development of NICE guidance. 2nd edition. London: National Institute for Health and Clinical Excellence; 2008. Available from: https://www.nice.org.uk/media/default/about/what-we-do/research-and-development/social-value-judgements-principles-for-the-development-of-nice-guidance.pdf
134 National Institute for Health and Clinical Excellence. The guidelines manual. London: National Institute for Health and Clinical Excellence; 2012. Available from: http://publications.nice.org.uk/the-guidelines-manual-pmg6/
135 National Institute for Health and Clinical Excellence. Guide to the methods of technology appraisal 2013. 2nd edition. London: National Institute for Health and Clinical Excellence; 2013. Available from: http://publications.nice.org.uk/pmg9
136 Neuraz A, Guerin C, Payet C, Polazzi S, Aubrun F, Dailler F et al. Patient mortality is associated with staff resources and workload in the ICU: a multicenter observational study. Critical Care Medicine. 2015; 43(8):1587-1594
137 NHS Employers. Terms and conditions - Consultants (England) 2003, 2009. Available from: http://www.nhsemployers.org/PayAndContracts/MedicalandDentalContracts/ConsultantsAndDentalConsultants/Pages/Consultants-KeyDocuments.aspx
138 NHS Employers. NHS terms and conditions of service handbook, 2011. Available from: http://www.nhsemployers.org/SiteCollectionDocuments/AfC_tc_of_service_handbook_fb.pdf
139 NHS Employers. Agenda for change - pay rates. 2016. Available from: https://www.healthcareers.nhs.uk/about/careers-nhs/nhs-pay-and-benefits/agenda-change-pay-rates [Last accessed: 4 October 2016]
140 NHS Employers. Unsocial hours payments - Section 2(a) (England). 2016. Available from: http://www.nhsemployers.org/your-workforce/pay-and-reward/nhs-terms-and-conditions/nhs-terms-and-conditions-of-service-handbook/unsocial-hours-payments [Last accessed: 4 October 2016]
141 Nicks BA, Manthey DM. The impact of psychiatric patient boarding in emergency departments. Emergency Medicine International. 2012; 2012:360308

Emergency and acute medical care
Chapter 41 Cost-effectiveness analyses 89
142 Noman A, Ahmed JM, Spyridopoulos I, Bagnall A, Egred M. Mortality outcome of out-of-hours primary percutaneous coronary intervention in the current era. European Heart Journal. 2012; 33(24):3046-3053
143 Office for National Statistics. National life tables: England. 2016. Available from: https://www.ons.gov.uk/peoplepopulationandcommunity/birthsdeathsandmarriages/lifeexpectancies/datasets/nationallifetablesenglandreferencetables/current [Last accessed: 4 October 2016]
144 Ortolani P, Marzocchi A, Marrozzini C, Palmerini T, Saia F, Aquilina M et al. Clinical comparison of "normal-hours" vs "off-hours" percutaneous coronary interventions for ST-elevation myocardial infarction. American Heart Journal. 2007; 154(2):366-372
145 Ozdemir BA, Karthikesalingam A, Sinha S, Poloniecki JD, Vidal-Diez A, Hinchliffe RJ et al. Association of hospital structures with mortality from ruptured abdominal aortic aneurysm. British Journal of Surgery. 2015; 102(5):516-524
146 Ozdemir BA, Sinha S, Karthikesalingam A, Poloniecki JD, Pearse RM, Grocott MPW et al. Mortality of emergency general surgical patients and associations with hospital structures and processes. British Journal of Anaesthesia. 2016; 116(1):54-62
147 Palmer WL, Bottle A, Davie C, Vincent CA, Aylin P. Dying for the weekend: a retrospective cohort study on the association between day of hospital presentation and the quality and safety of stroke care. Archives of Neurology. 2012; 69(10):1296-1302
148 Park SO, Shin DH, Baek KJ, Hong DY, Kim EJ, Kim SC et al. A clinical observational study analysing the factors associated with hyperventilation during actual cardiopulmonary resuscitation in the emergency department. Resuscitation. 2013; 84(3):298-303
149 Pascual JL, Blank NW, Holena DN, Robertson MP, Diop M, Allen SR et al. There's no place like home: boarding surgical ICU patients in other ICUs and the effect of distances from the home unit. Journal of Trauma and Acute Care Surgery. 2014; 76(4):1096-1102
150 Patel R, Thiagarajan P. Structured approach in improving weekend handovers in a medical high dependency unit. BMJ Quality Improvement Reports. 2014; 3(1)
151 Paul JA, Lin L. Models for improving patient throughput and waiting at hospital emergency departments. Journal of Emergency Medicine. 2012; 43(6):1119-1126
152 Peberdy MA, Ornato JP, Larkin GL, Braithwaite RS, Kashner TM, Carey SM et al. Survival from in-hospital cardiac arrest during nights and weekends. JAMA - Journal of the American Medical Association. 2008; 299(7):785-792
153 Peck JS, Benneyan JC, Nightingale DJ, Gaehde SA. Characterizing the value of predictive analytics in facilitating hospital patient flow. IIE Transactions on Healthcare Systems Engineering. 2014; 4(3):135-143
154 Pennathur PR, Cao D, Sui Z, Lin L, Bisantz AM, Fairbanks RJ et al. Development of a simulation environment to study emergency department information technology. Simulation in Healthcare. 2010; 5(2):103-111
155 Perimal-Lewis L, Ben-Tovim DI, Li JY, Hakendorf PH, Thompson CH. Emergency department lengths of stay: characteristics favouring a delay to the admission decision as distinct from a delay while awaiting an inpatient bed. Internal Medicine Journal. 2014; 44(4):384-389

Emergency and acute medical care
Chapter 41 Cost-effectiveness analyses 90
156 Perimal-Lewis L, Li JY, Hakendorf PH, Ben-Tovim DI, Qin S, Thompson CH. Relationship between in-hospital location and outcomes of care in patients of a large general medical service. Internal Medicine Journal. 2013; 43(6):712-716
157 Puvaneswaralingam S, Ross D. Improving the communication between teams managing boarded patients on a surgical specialty ward. BMJ Quality Improvement Reports. 2016; 5(1):w3750
158 Qureshi SA, Ahern T, O'Shea R, Hatch L, Henderson SO. A standardized Code Blue Team eliminates variable survival from in-hospital cardiac arrest. Journal of Emergency Medicine. 2012; 42(1):74-78
159 Raghavan RP, Baskar V, Buch H, Singh BM, Viswanath AK. Consultant delivered seven-day health care: results from a medical model on a diabetes base ward. Practical Diabetes. 2014; 31(2):58-61
160 Ranasinghe C, Fleury A, Peel NM, Hubbard RE. Frailty and adverse outcomes: impact of multiple bed moves for older inpatients. International Psychogeriatrics. 2016;1-5
161 Rathod KS, Jones DA, Gallagher SM, Bromage DI, Whitbread M, Archbold AR et al. Out-of-hours primary percutaneous coronary intervention for ST-elevation myocardial infarction is not associated with excess mortality: a study of 3347 patients treated in an integrated cardiac network. BMJ Open. 2013; 3(6):e003063
162 Robineau D. Ageing Britain: two-fifths of NHS budget is spent on over-65s. The Guardian, 2016. Available from: https://www.theguardian.com/society/2016/feb/01/ageing-britain-two-fifths-nhs-budget-spent-over-65s
163 Rockwood K, Song X, MacKnight C, Bergman H, Hogan DB, McDowell I et al. A global clinical measure of fitness and frailty in elderly people. CMAJ Canadian Medical Association Journal. 2005; 173(5):489-495
164 Round A, Crabb T, Buckingham K, Mejzner R, Pearce V, Ayres R et al. Six month outcomes after emergency admission of elderly patients to a community or a district general hospital. Family Practice. 2004; 21(2):173-179
165 Royal College of Physicians. Acute care toolkit 4: delivering a 12-hour, 7-day consultant presence on the acute medical unit, 2015. Available from: https://www.rcplondon.ac.uk/guidelines-policy/acute-care-toolkit-4-delivering-12-hour-7-day-consultant-presence-acute-medical-unit
166 Royal College of Physicians. National Early Warning Score (NEWS), 2015. Available from: https://www.rcplondon.ac.uk/projects/outputs/national-early-warning-score-news
167 Rudd AG, Hoffman A, Down C, Pearson M, Lowe D. Access to stroke care in England, Wales and Northern Ireland: the effect of age, gender and weekend admission. Age and Ageing. 2007; 36(3):247-255
168 Ruiz M, Bottle A, Aylin PP. The Global Comparators project: international comparison of 30-day in-hospital mortality by day of the week. BMJ Quality & Safety. 2015; 24(8):492-504
169 Ruohonen T, Neittaanmaki P, Teittinen J. Simulation model for improving the operation of the emergency department of special health care. Simulation Conference, 2006.WSC 06.Proceedings of the Winter 2006;453-458

Emergency and acute medical care
Chapter 41 Cost-effectiveness analyses 91
170 Sacanella E, Perez-Castejon JM, Nicolas JM, Masanes F, Navarro M, Castro P et al. Functional status and quality of life 12 months after discharge from a medical ICU in healthy elderly patients: a prospective observational study. Critical Care. 2011; 15(2):R105
171 Safwenberg U, Terent A, Lind L. Differences in long-term mortality for different emergency department presenting complaints. Academic Emergency Medicine. 2008; 15(1):9-16
172 Samaha S, Armel WS, Starks DW. The use of simulation to reduce the length of stay in an emergency department. Simulation Conference, 2003.Proceedings of the 2003 Winter 2003; 2:1907-1911
173 Santamaria JD, Tobin AE, Anstey MH, Smith RJ, Reid DA. Do outlier inpatients experience more emergency calls in hospital? An observational cohort study. Medical Journal of Australia. 2014; 200(1):45-48
174 Sato S, Arima H, Heeley E, Hirakawa Y, Delcourt C, Lindley RI et al. Off-hour admission and outcomes in patients with acute intracerebral hemorrhage in the INTERACT2 trial. Cerebrovascular Diseases. 2015; 40(3-4):114-120
175 Saukkonen KA, Varpula M, Rasanen P, Roine RP, Voipio-Pulkki LM, Pettila V. The effect of emergency department delay on outcome in critically ill medical patients: evaluation using hospital mortality and quality of life at 6 months. Journal of Internal Medicine. 2006; 260(6):586-591
176 Saunders CE, Makens PK, LeBlanc LJ. Modeling emergency department operations using advanced computer simulation systems. Annals of Emergency Medicine. 1989; 18(2):134-140
177 Schmid-Mazzoccoli A, Hoffman LA, Wolf GA, Happ MB, Devita MA. The use of medical emergency teams in medical and surgical patients: impact of patient, nurse and organisational characteristics. Quality and Safety in Health Care. 2008; 17(5):377-381
178 Schroettner J, Lassnig A. Simulation model for cost estimation of integrated care concepts of heart failure patients. Health Economics Review. 2013; 3(1):26
179 Serafini F, Fantin G, Brugiolo R, Lamanna O, Aprile A, Presotto F. Outlier admissions of medical patients: prognostic implications of outlying patients. The experience of the Hospital of Mestre. Italian Journal of Medicine. 2015; 9(3):299-302
180 Shokouhi BN, Khan M, Carter MJ, Khan NQ, Mills P, Morris D et al. The setting up and running of a cross-county out-of-hours gastrointestinal bleed service: a possible blueprint for the future. Frontline Gastroenterology. 2013; 4(3):227-231
181 Showkathali R, Davies JR, Sayer JW, Kelly PA, Aggarwal RK, Clesham GJ. The advantages of a consultant led primary percutaneous coronary intervention service on patient outcome. QJM. 2013; 106(11):989-994
182 Simpson SA, Joesch JM, West II, Pasic J. Who's boarding in the psychiatric emergency service? Western Journal of Emergency Medicine. 2014; 15(6):669-674
183 Sorita A, Lennon RJ, Haydour Q, Ahmed A, Bell MR, Rihal CS et al. Off-hour admission and outcomes for patients with acute myocardial infarction undergoing percutaneous coronary interventions. American Heart Journal. 2014; 169(1):62-68

Emergency and acute medical care
Chapter 41 Cost-effectiveness analyses 92
184 Sorita A, Ahmed A, Starr SR, Thompson KM, Reed DA, Prokop L et al. Off-hour presentation and outcomes in patients with acute myocardial infarction: systematic review and meta-analysis. BMJ. 2014; 348:f7393
185 Southey D, Mishra PK, Nevill A, Aktuerk D, Luckraz H. Continuity of care by cardiothoracic nurse practitioners: impact on outcome. Asian Cardiovascular and Thoracic Annals. 2014; 22(8):944-947
186 Soyiri IN, Reidpath DD, Sarran C. Asthma length of stay in hospitals in London 2001-2006: demographic, diagnostic and temporal factors. PloS One. 2011; 6(11):e27184
187 Stowell A, Claret PG, Sebbane M, Bobbia X, Boyard C, Genre Grandpierre R et al. Hospital out-lying through lack of beds and its impact on care and patient outcome. Scandinavian Journal of Trauma, Resuscitation and Emergency Medicine. 2013; 21:17
188 Subbe CP, Burford C, Le Jeune I, Masterton-Smith C, Ward D. Relationship between input and output in acute medicine - secondary analysis of the Society for Acute Medicine's benchmarking audit 2013 (SAMBA '13). Clinical Medicine. 2015; 15(1):15-19
189 Sullivan C, Staib A, Eley R, Scanlon A, Flores J, Scott I. National Emergency Access Targets metrics of the emergency department-inpatient interface: measures of patient flow and mortality for emergency admissions to hospital. Australian Health Review. 2015; 39(5):533-538
190 Thorwath M and Arisha A. Application of discrete-event simulation in health care: a review. Reports. Paper 3. Dublin. School of Management, Dublin Institute of Technology, 2009. Available from: http://arrow.dit.ie/cgi/viewcontent.cgi?article=1002&context=buschmanrep
191 Triggle N. Care standards set to reduce mortality rates at weekends. Emergency Nurse. 2014; 21(9):11
192 Vainiola T, Roine RP, Pettila V, Kantola T, Rasanen P, Sintonen H. Effect of health-related quality-of-life instrument and quality-adjusted life year calculation method on the number of life years gained in the critical care setting. Value in Health. 2011; 14(8):1130-1134
193 Vedio AB, Chinn S, Warburton FG, Griffiths MP, Leach RM, Treacher DF. Assessment of survival and quality of life after discharge from a teaching hospital general intensive care unit. Clinical Intensive Care. 2000; 11(1):39-46
194 Warne S, Endacott R, Ryan H, Chamberlain W, Hendry J, Boulanger C et al. Non-therapeutic omission of medications in acutely ill patients. Nursing in Critical Care. 2010; 15(3):112-117. DOI:Warne,Siobhan. School of Nursing and Community Studies, University of Plymouth, Plymouth, UK.
195 Zhou JC, Pan KH, Zhou DY, Zheng SW, Zhu JQ, Xu QP et al. High hospital occupancy is associated with increased risk for patients boarding in the emergency department. American Journal of Medicine. 2012; 125(4):416-417
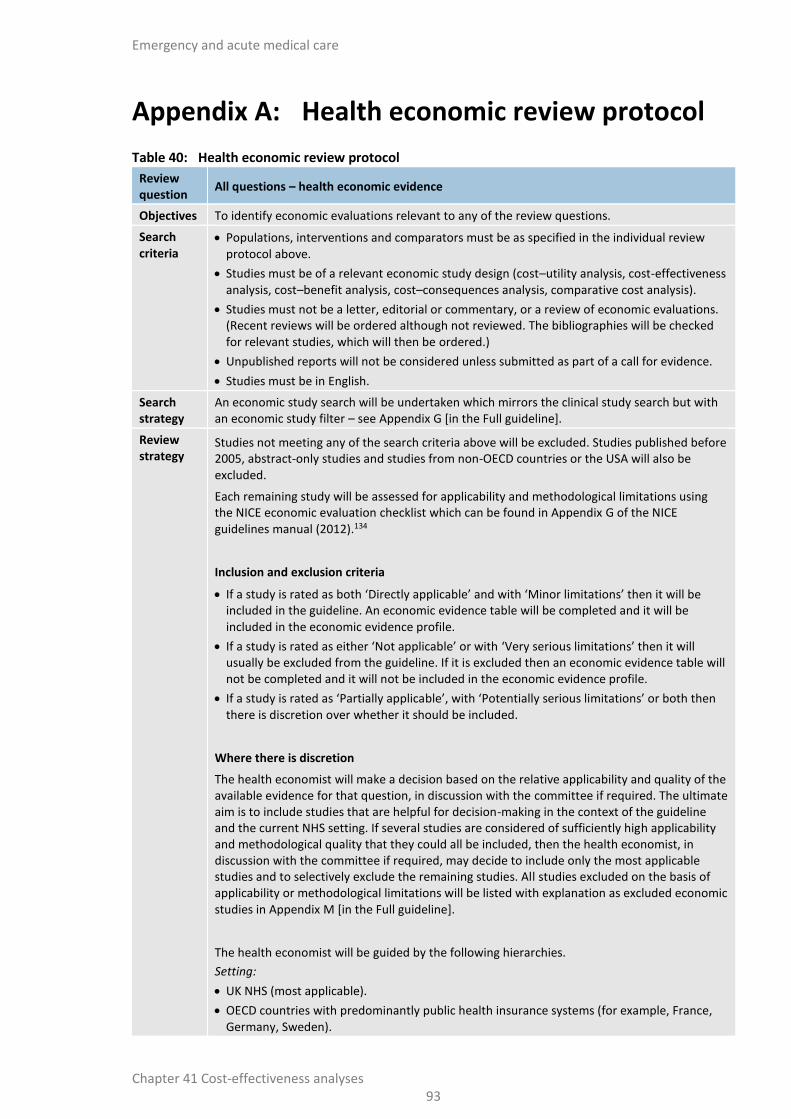
Emergency and acute medical care
Chapter 41 Cost-effectiveness analyses 93
Appendix A: Health economic review protocol
Table 40: Health economic review protocol
Review question
All questions – health economic evidence
Objectives To identify economic evaluations relevant to any of the review questions.
Search criteria
Populations, interventions and comparators must be as specified in the individual review protocol above.
Studies must be of a relevant economic study design (cost–utility analysis, cost-effectiveness analysis, cost–benefit analysis, cost–consequences analysis, comparative cost analysis).
Studies must not be a letter, editorial or commentary, or a review of economic evaluations. (Recent reviews will be ordered although not reviewed. The bibliographies will be checked for relevant studies, which will then be ordered.)
Unpublished reports will not be considered unless submitted as part of a call for evidence.
Studies must be in English.
Search strategy
An economic study search will be undertaken which mirrors the clinical study search but with an economic study filter – see Appendix G [in the Full guideline].
Review strategy
Studies not meeting any of the search criteria above will be excluded. Studies published before 2005, abstract-only studies and studies from non-OECD countries or the USA will also be excluded.
Each remaining study will be assessed for applicability and methodological limitations using the NICE economic evaluation checklist which can be found in Appendix G of the NICE guidelines manual (2012).134
Inclusion and exclusion criteria
If a study is rated as both ‘Directly applicable’ and with ‘Minor limitations’ then it will be included in the guideline. An economic evidence table will be completed and it will be included in the economic evidence profile.
If a study is rated as either ‘Not applicable’ or with ‘Very serious limitations’ then it will usually be excluded from the guideline. If it is excluded then an economic evidence table will not be completed and it will not be included in the economic evidence profile.
If a study is rated as ‘Partially applicable’, with ‘Potentially serious limitations’ or both then there is discretion over whether it should be included.
Where there is discretion
The health economist will make a decision based on the relative applicability and quality of the available evidence for that question, in discussion with the committee if required. The ultimate aim is to include studies that are helpful for decision-making in the context of the guideline and the current NHS setting. If several studies are considered of sufficiently high applicability and methodological quality that they could all be included, then the health economist, in discussion with the committee if required, may decide to include only the most applicable studies and to selectively exclude the remaining studies. All studies excluded on the basis of applicability or methodological limitations will be listed with explanation as excluded economic studies in Appendix M [in the Full guideline].
The health economist will be guided by the following hierarchies.
Setting:
UK NHS (most applicable).
OECD countries with predominantly public health insurance systems (for example, France, Germany, Sweden).
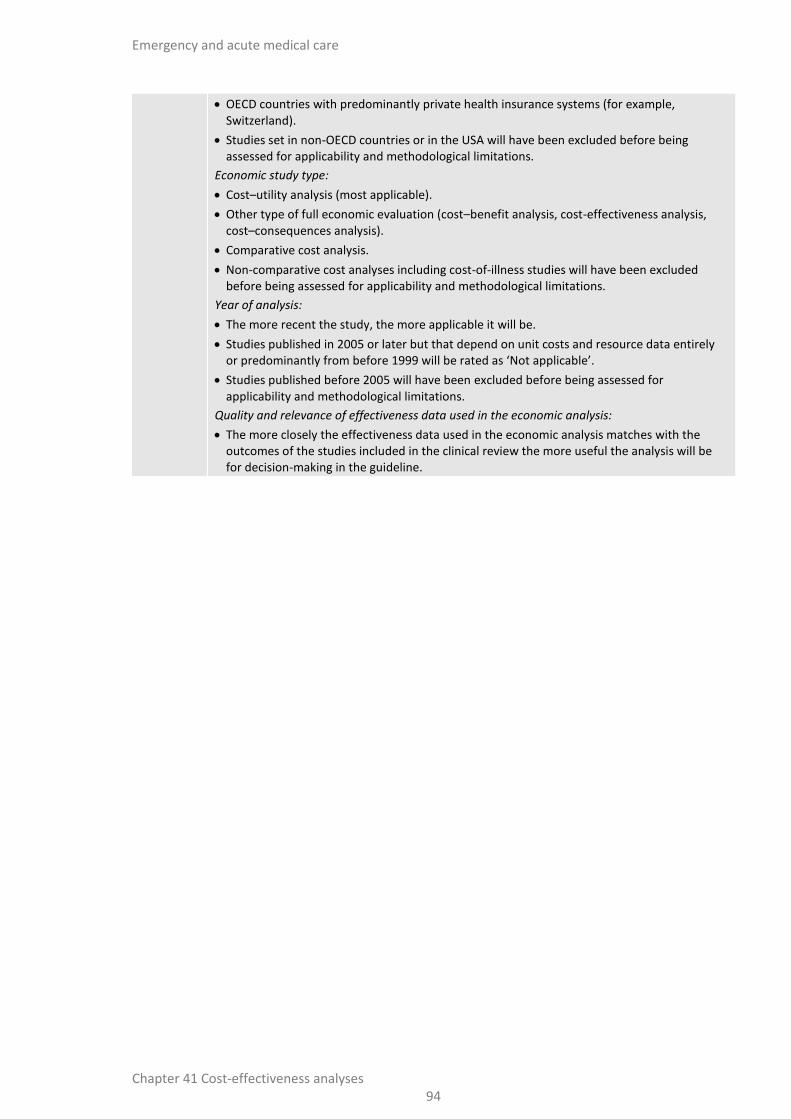
Emergency and acute medical care
Chapter 41 Cost-effectiveness analyses 94
OECD countries with predominantly private health insurance systems (for example, Switzerland).
Studies set in non-OECD countries or in the USA will have been excluded before being assessed for applicability and methodological limitations.
Economic study type:
Cost–utility analysis (most applicable).
Other type of full economic evaluation (cost–benefit analysis, cost-effectiveness analysis, cost–consequences analysis).
Comparative cost analysis.
Non-comparative cost analyses including cost-of-illness studies will have been excluded before being assessed for applicability and methodological limitations.
Year of analysis:
The more recent the study, the more applicable it will be.
Studies published in 2005 or later but that depend on unit costs and resource data entirely or predominantly from before 1999 will be rated as ‘Not applicable’.
Studies published before 2005 will have been excluded before being assessed for applicability and methodological limitations.
Quality and relevance of effectiveness data used in the economic analysis:
The more closely the effectiveness data used in the economic analysis matches with the outcomes of the studies included in the clinical review the more useful the analysis will be for decision-making in the guideline.

Emergency and acute medical care
Chapter 41 Cost-effectiveness analyses 95
Appendix B: Health economic review flowchart
Figure 8: Flow chart of economic article selection
Records screened in 1st sift, n=26,043
Full-text articles assessed for eligibility in 2nd sift, n=448
Records excluded* in 1st sift, n= 25,595
Records excluded* in 2nd sift, n=342
Papers included, n=64 (59 studies)
Papers selectively excluded, n=17
Records identified through database searching, n=26,012
Additional records identified through other sources, n= 31
Full-text articles assessed for applicability and quality of methodology, n=106
Papers excluded, n=25
* Non-relevant population, intervention, comparison, design or setting; non-English language or published before 2005

Emergency and acute medical care
Chapter 41 Cost-effectiveness analyses 96
Table 41: Included and excluded economic studies by guideline chapter
Chapter
Included Selectively excluded papers
Excluded papers
Studies Papers
Emergency and acute medical care in the community
2 Non-emergency phone access 1 1 0 1
3 Paramedic enhanced competencies 1 1 0 1
4 Paramedic remote support 0 0 0 1
5 GP extended hours 1 1 0 0
6 GP led home visits 0 0 0 0
7 GP access to lab tests 3 3 1 0
8 GP access to radiology 0 0 0 0
9 Community nursing 3 3 2 2
10 Community pharmacists 9 11 6 7
11 Social care 0 0 0 0
12 Alternatives to hospital care 13 14 4 2
13 Community rehab 6 7 0 4
14 Palliative care 2 2 0 4
15 Advanced care planning 0 0 0 0
Emergency and acute medical care in hospital
16 ED opening hours 0 0 0 0
17 GP-ED 0 0 0 1
18 MIU UCC WiC 1 1 0 0
19 Early versus late consultant review 0 0 0 0
20 Physician extenders 1 1 1 1
21 Standardised criteria for admission 1 1 0 0
22 7 day radiology 0 0 0 0
23 Liaison psychiatry 1 2 0 0
24 AMU admission 0 0 0 0
25 ECAU 1 1 0 0
26 Consultant frequency 1 1 0 0
27 Critical care outreach 1 1 0 0
28 Structured ward rounds 0 0 0 0
29 MDTs 0 0 0 0
30 Pharmacist support 7 7 0 0
31 Enhanced therapy access 0 0 0 0
32 Structured patient handovers 1 1 0 0
33 Integrated patient information systems 0 0 0 0
34 Hospital transfers 0 0 0 0
35 Discharge planning 0 0 0 0
36 Discharge criteria 0 0 0 0
37 Post discharge early follow up clinics 1 1 0 0
Planning emergency and acute care services
38 Integrated care models 4 4 3 1
39 Bed capacity 0 0 0 0

Emergency and acute medical care
Chapter 41 Cost-effectiveness analyses 97
Chapter
Included Selectively excluded papers
Excluded papers
Studies Papers
40 Escalation measures 0 0 0 0
All 59 64 17 25
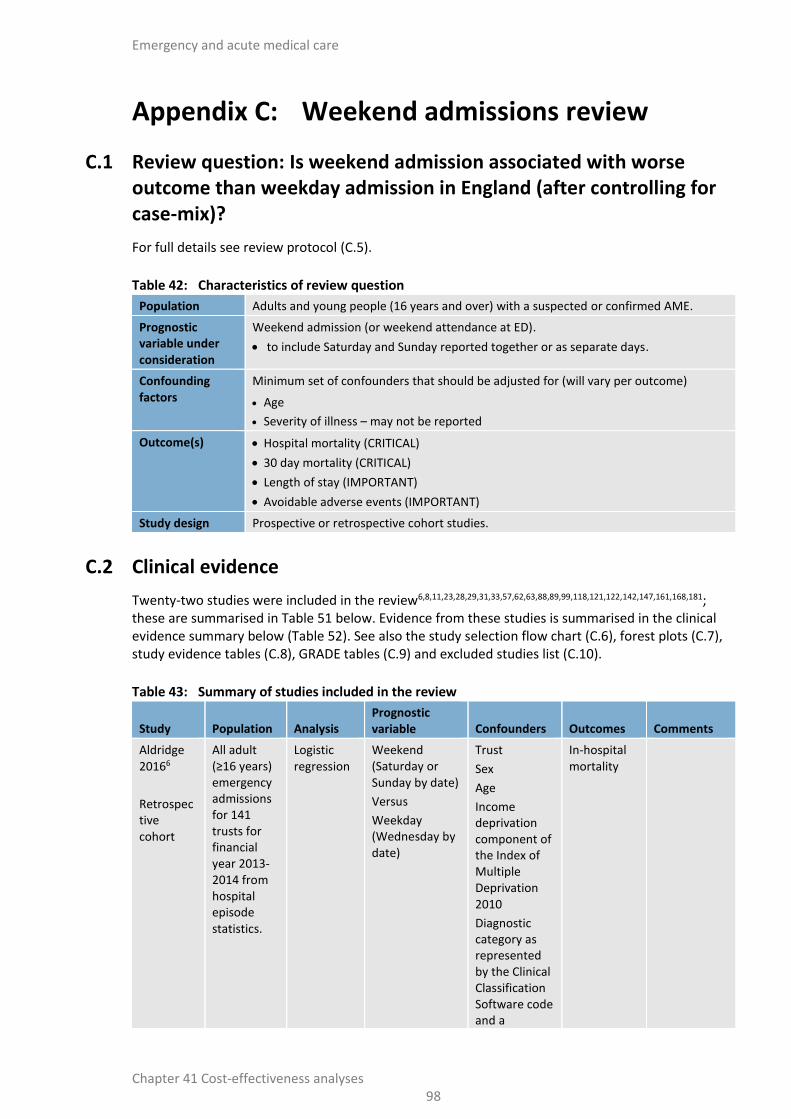
Emergency and acute medical care
Chapter 41 Cost-effectiveness analyses 98
Appendix C: Weekend admissions review
C.1 Review question: Is weekend admission associated with worse outcome than weekday admission in England (after controlling for case-mix)?
For full details see review protocol (C.5).
Table 42: Characteristics of review question
Population Adults and young people (16 years and over) with a suspected or confirmed AME.
Prognostic variable under consideration
Weekend admission (or weekend attendance at ED).
to include Saturday and Sunday reported together or as separate days.
Confounding factors
Minimum set of confounders that should be adjusted for (will vary per outcome)
Age
Severity of illness – may not be reported
Outcome(s) Hospital mortality (CRITICAL)
30 day mortality (CRITICAL)
Length of stay (IMPORTANT)
Avoidable adverse events (IMPORTANT)
Study design Prospective or retrospective cohort studies.
C.2 Clinical evidence
Twenty-two studies were included in the review6,8,11,23,28,29,31,33,57,62,63,88,89,99,118,121,122,142,147,161,168,181; these are summarised in Table 51 below. Evidence from these studies is summarised in the clinical evidence summary below (Table 52). See also the study selection flow chart (C.6), forest plots (C.7), study evidence tables (C.8), GRADE tables (C.9) and excluded studies list (C.10).
Table 43: Summary of studies included in the review
Study Population Analysis Prognostic variable Confounders Outcomes Comments
Aldridge 20166
Retrospective cohort
All adult (≥16 years) emergency admissions for 141 trusts for financial year 2013-2014 from hospital episode statistics.
Logistic regression
Weekend (Saturday or Sunday by date)
Versus
Weekday (Wednesday by date)
Trust
Sex
Age
Income deprivation component of the Index of Multiple Deprivation 2010
Diagnostic category as represented by the Clinical Classification Software code and a
In-hospital mortality
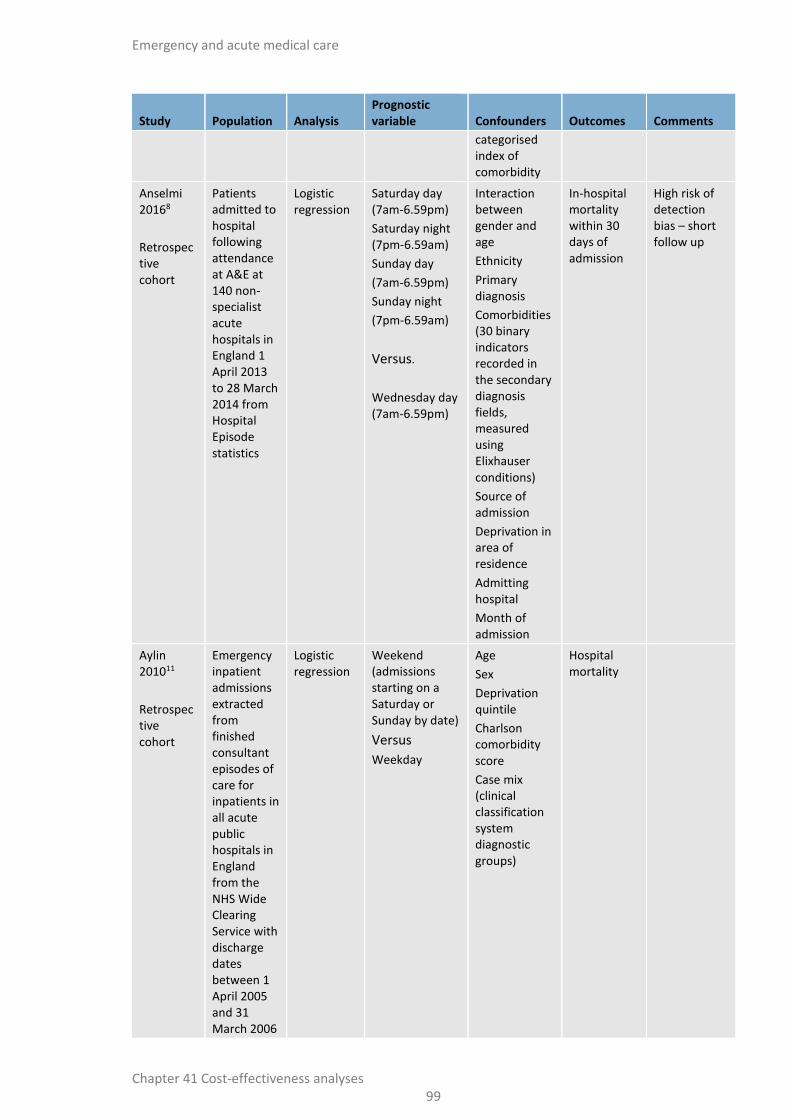
Emergency and acute medical care
Chapter 41 Cost-effectiveness analyses 99
Study Population Analysis Prognostic variable Confounders Outcomes Comments
categorised index of comorbidity
Anselmi 20168
Retrospective cohort
Patients admitted to hospital following attendance at A&E at 140 non-specialist acute hospitals in England 1 April 2013 to 28 March 2014 from Hospital Episode statistics
Logistic regression
Saturday day (7am-6.59pm)
Saturday night (7pm-6.59am)
Sunday day
(7am-6.59pm)
Sunday night
(7pm-6.59am)
Versus.
Wednesday day (7am-6.59pm)
Interaction between gender and age
Ethnicity
Primary diagnosis
Comorbidities (30 binary indicators recorded in the secondary diagnosis fields, measured using Elixhauser conditions)
Source of admission
Deprivation in area of residence
Admitting hospital
Month of admission
In-hospital mortality within 30 days of admission
High risk of detection bias – short follow up
Aylin 201011
Retrospective cohort
Emergency inpatient admissions extracted from finished consultant episodes of care for inpatients in all acute public hospitals in England from the NHS Wide Clearing Service with discharge dates between 1 April 2005 and 31 March 2006
Logistic regression
Weekend (admissions starting on a Saturday or Sunday by date)
Versus
Weekday
Age
Sex
Deprivation quintile
Charlson comorbidity score
Case mix (clinical classification system diagnostic groups)
Hospital mortality

Emergency and acute medical care
Chapter 41 Cost-effectiveness analyses 100
Study Population Analysis Prognostic variable Confounders Outcomes Comments
n=4,317,866
Number of events = 215,054
Bell 201323
Retrospective cohort
Adult (≥16 years) acute medical admissions derived from hospital episode statistics for patients admitted to participating hospitals as an acute medical emergency 1 April 2009 to 31 March 2010
n=1.3 million
Event rate = 4.3%
Step-wise multivariate regression analysis
Weekend
Versus
Weekday
Charlson comorbidity index
Age
Index of multiple deprivation
Hospital mortality
Weekend not defined
Bray 201428
Retrospective cohort
Adults (≥18 years) admitted with stroke from the Stroke Improvement National Audit Programme from 1 June 2011 to 1 December 2012 linked with English national register of deaths
n=32,388
Cox proportional hazards model
Weekend
Versus
Weekday
Age
Stroke type
Pre-stroke independence
Hypoxia in the first 24 hours of admission
Lowest level of consciousness in the first 24 hours
Arm weakness
Leg weakness
Hemianopia
Dysphasia
No. of SU beds
Presence of 24/7 on-site
30 day mortality
Weekend not defined
HR for weekend versus weekday with 7 days per week stroke specialist physician rounds

Emergency and acute medical care
Chapter 41 Cost-effectiveness analyses 101
Study Population Analysis Prognostic variable Confounders Outcomes Comments
Event rate = 11.8%
thrombolysis service
Ratio of HCAs/nurses to beds
Presence of 7-day physician ward rounds
Management solely in an optimal setting in first 24 hours
Antiplatelet therapy if required
Brain scan within 24 hours
Bray 201629
Retrospective cohort
All adults (>16 years) admitted to hospital in England and Wales with acute stroke between April 1, 2013 and March 31, 2014 from the Sentinel Stroke National Audit Programme (SSNAP).
Logistic regression
Weekend (Saturday to Sunday 08:00-19:59 h and Saturday to Sunday 20:00-07:59 h)
Versus
Weekday (Monday to Friday 08:00-19:59 h and Monday to Friday 20:00-07:59 h)
Age
Sex
Place of stroke onset (in or out of hospital)
Stroke type
Vascular comorbidity (atrial fibrillation, heart failure, diabetes, previous stroke or transient ischemic attack, hypertension)
Pre-stroke functional level(as measured by the modified Rankin Scale)
Time from stroke onset to admission
Stroke severity (National Institutes of Health Stroke Scale score or
30-day survival (following admission)

Emergency and acute medical care
Chapter 41 Cost-effectiveness analyses 102
Study Population Analysis Prognostic variable Confounders Outcomes Comments
level of consciousness on admission)
Hospital level random intercepts
Brims 201131
Retrospective cohort
Acute exacerbations of chronic obstructive pulmonary disease patients admitted to a large secondary care hospital in Portsmouth between January 1997 and December 2004 extracted from hospital databases
n=9,915
Number of events = 1,516
Multivariate logistic regression
Weekend (midnight Friday to midnight Sunday)
Versus
Weekday (all other time)
Age
Sex
Creatinine
PaO2
Hospital mortality (within 7 days)
High risk of detection bias – short follow up
Campbell 201433
Retrospective cohort
Stroke admissions to 130 hospitals in England (1 April 2010 - 31 January 2012) from the Stroke Improvement National Audit Programme
n= 45,726
Number of events =
Logistic regression
Weekend
Versus
Weekday
Out of hours (weekdays before 08:00 or after 18:00 or at any time on a weekend day or English public holiday)
Versus
In hours (weekdays 08:00 to 18:00)
Age
Sex
Worst level of consciousness in the first 24 hours (surrogate for severity)
Stroke type
Pre-stroke independence
30 day mortality

Emergency and acute medical care
Chapter 41 Cost-effectiveness analyses 103
Study Population Analysis Prognostic variable Confounders Outcomes Comments
5,956
Deshmukh 201657
Retrospective cohort
Patients admitted between January 2009 and December 2011 with acute subarachnoid haemorrhage from 12 hospitals in Northwest England.
Cox proportional hazards
Weekend (16:00 Friday to 16:00 Sunday)
Versus
Weekday
Age
Sex
Severity of SAH (baseline World Federation of Neurosurgical Societies grade)
Treatment modalities following admission
Time from scan to admission and from admission to treatment
In-hospital mortality
Freemantle 201262
Retrospective cohort
All admissions to National Health Service Hospitals in England April 2009 - March 2010 using inpatient hospital trusts within England. Linked data on mortality from the Office of National Statistics
n=14,217,640
Number of events = 187,337 (in-hospital)
284,852 (30 day)
Contingency
tables for each day, utilising a complementary
log-log link function and binomial
error
Saturday
Sunday
Versus
Wednesday
Age
Sex
Ethnicity
Source of admission
Diagnostic group
No. of previous emergency admissions
No. of previous complex admissions
Charlson comorbidity index
Social deprivation
Hospital trust
Day of the year (seasonality)
Hospital mortality
30 day mortality
Saturday and Sunday analysed separately – both statistics included in weekend versus weekday meta-analysis
Freemantle 201563
All admissions
Identical to previous
Saturday
Sunday
Case mix (clinical
30 day mortality
Saturday and Sunday

Emergency and acute medical care
Chapter 41 Cost-effectiveness analyses 104
Study Population Analysis Prognostic variable Confounders Outcomes Comments
Retrospective cohort
to National Health Service Hospitals in England in 2013-2014
n= 14 818 374
Number of events = 280 788
analysis Versus
Wednesday
classifications software category)
Age
Time of year
Trust
Deprivation
No. of previous emergency admissions
No. of previous complex admissions
Admission source
Admission urgency
Sex
Ethnicity
Charlson comorbidity index
analysed separately – both statistics included in weekend versus weekday meta-analysis
Iqbal 201588
Retrospective cohort
Consecutive STEMI patients treated with PPCI between 2005 and 2011 at 8 tertiary centres in London from local British Cardiac Intervention Society databases linked with Office of National Statistics data
n=11,466
Number of events = 607
Logistic regression and Cox proportional hazards regression models
Out of hours (weekdays 17:00 to 09:00 and any time on a Saturday or Sunday)
Versus
In hours (09:00 to 17:00 Monday to Friday)
Age
Sex
Diabetes
GP2b-3a inhibitor use
Previous MI
Renal disease
Radial access
Cardiogenic shock
IABP use
Intubation status
LMS intervention
LAD intervention
Multi-vessel intervention
Completeness of revascularisation
30 day mortality
Avoidable adverse events (in-hospital bleeding complications)
Procedure time taken as admission time
Jairath Adults (16 Mixed Weekend (3 Individual Hospital Unclear

Emergency and acute medical care
Chapter 41 Cost-effectiveness analyses 105
Study Population Analysis Prognostic variable Confounders Outcomes Comments
201189
Retrospective cohort
years and over) presenting with acute upper gastrointestinal bleeding from the 2007 UK National audit of AUGIB of all NHS hospitals accepting acute admissions in the UK (majority from England). 1 May - 30 June 2007
n=6,749
effects logistic regression
sensitivity analyses performed: 5pm Friday - midnight Sunday, Midnight Friday - 5pm Sunday, 5pm Friday to 5pm Sunday)
Versus
Weekday
components of the Rockall score (age, presentation with shock, co-morbid illness)
Presentation with hematemesis
Presentation with melaena
Haemoglobin and urea concentration on admission
Use of aspirin
Use of non-steroidal anti-inflammatory drugs
Use of proton pump inhibitors
Gender
Variceal bleeding
Peptic ulcer bleeding
Availability of OOH rota enabling 24hr access to endoscopy
Admission status (new patient
versus
inpatient)
mortality up to 30 days post-index AUGIB
Avoidable adverse events (re-bleeding, surgery/radiology, red cell transfusion)
which weekend definition was used in the analysis
High risk of detection bias (for mortality outcome) – short follow up
Kolic 201599
Prospective cohort
All patients presenting to the acute medical unit at Queen Elizabeth Hospital in London 1 October 2013 - 15 October 2013 and 9 December 2013 - 22
Multivariate logistic regression
Weekend
Versus
Weekday
Age
Severity (NEW score)
Avoidable adverse events (inadequate clinical response to NEW score)
Weekend not defined
High risk of detection bias (short follow up) and performance bias (unclear whether staff were aware of the study)

Emergency and acute medical care
Chapter 41 Cost-effectiveness analyses 106
Study Population Analysis Prognostic variable Confounders Outcomes Comments
December 2013
Exclusion: patients with <12hr inpatient stay
n=370
Number of events = 96
Meacock 2016118
Retrospective cohort
Emergency admissions to type 1 units (consultant-led, multispecialty 24-hour services with full resuscitation facilities and designated accommodation for reception of A&E patients) from 140 trusts in England from hospital episode statistics 1 April 2013 to 28 February 2014.
Logistic regression
Weekend (Saturday and Sunday by date)
Versus
Weekday (Monday to Friday by date)
Age
Sex
Ethnicity
Primary diagnosis (SHMI-grouped Clinical Classifications Software category)
Elixhauser (comorbidity) conditions
Admission method
Admission source
Deprivation quintile
Month
Admitting hospital
30-day mortality (following admission)
Admissions via A&E departments and direct admissions analysed separately
Mohammed 2012122
Retrospective cohort
Emergency admissions April 2008 - March 2009 from all acute hospitals (n=328) in England via Hospital Episode Statistics
Logistic regression
Weekend (by date)
Versus
Weekday (by date)
Age category
Complex elderly
Male
Healthcare resource group with comorbidities/complications
Interaction: Age and HRG
Hospital mortality
Assumed to be in hospital mortality because the study was on hospital discharges, no mention of follow up or ONS data

Emergency and acute medical care
Chapter 41 Cost-effectiveness analyses 107
Study Population Analysis Prognostic variable Confounders Outcomes Comments
Exclusion: admissions discharged alive with a zero day length of stay, age <16 years, maternity care, mental health care other than dementia
n=3,105,249
Number of events = 206,683
with comorbidities/complications
Admission quarter
Mohammed 2016121
Retrospective cohort
All adult (≥16 years) emergency medical and elderly admissions, discharged between 1 January 2014 and 31 December 2014 from 3 general acute hospitals in England.
Linear and logistic regression
Weekend (Saturday and Sunday by date)
Versus
Weekday (Monday to Friday by date)
Index NEWS
Age
Sex
Calendar month
In-hospital mortality
Noman 2012142
Retrospective cohort
STEMI patients undergoing PPCI March 2008 - June 2011 at one tertiary cardiac centre in Newcastle from local coronary artery disease database (Dentrite) linked with
Multiple logistic regression
Out of hours (weekdays between 18:00 and 08:00 and any time on a Saturday or Sunday)
Versus
Routine hours (08:00 to 18:00 Monday to Friday)
Age
Sex
Previous MI
Diabetes mellitus
Anterior MI site
Baseline haemoglobin and creatinine
Admission HR and SBP
Cardiogenic shock
Onset of symptoms to
Hospital mortality
Procedure time taken as admission time

Emergency and acute medical care
Chapter 41 Cost-effectiveness analyses 108
Study Population Analysis Prognostic variable Confounders Outcomes Comments
Office of National Statistics data
n=2,571
Event rate = 4.5%
balloon time
Presence of multi-vessel disease
Thromolysis in MI flow 3 post-PPCI
Palmer 2012147
Retrospective cohort
Stroke admissions from Hospital Episode Statistics 1 April 2009 - 31 March 2010
n=93,621
Number of events = 8,772 (7 day hospital mortality)
Logistic regression
Weekend (midnight Friday to Midnight Sunday)
Versus
Weekday
Age
Sex
Socioeconomic deprivation quintile
No. of previous admissions
Comorbidities (Charlson index with weights derived from all admissions in England)
Month of discharge
Ethnic group
Source of admission
Stroke type
7-day hospital mortality
Avoidable adverse events (aspiration pneumonia)
Length of stay (discharge to usual place of residence within 56 days)
High risk of detection bias (for mortality outcome) – short follow up
Rathod 2013161
Retrospective cohort
Consecutive STEMI patients undergoing PPCI in one tertiary heart attack centre in London January 2004 - July 2012 from clinical database, electronic patient record and cardiac surgical database linked with Office of National
Logistic regression
Out of hours (17:01 to 07:59 Monday to Friday and 17:01 Friday to 07:59 Monday)
Versus
In hours (08:00 to 17:00 Monday to Friday)
Age
Shock
eGFR>60 (epidermal growth factor receptor)
EF>40
Procedural success
Multi-vessel disease
30 day mortality
Avoidable adverse events (death, recurrent MI, target vessel revascularisation)
Procedure time taken as admission time

Emergency and acute medical care
Chapter 41 Cost-effectiveness analyses 109
Study Population Analysis Prognostic variable Confounders Outcomes Comments
Statistics data
n=3347
Number of events = 138
Ruiz 2015168
Retrospective cohort
Emergency admissions from an International dataset from the Global Comparators project consisting of hospital administrative data 2009-2012 (separate English data analysis)
Exclusion: day cases, non-acute care, records with missing/invalid entries, short-term emergency admissions not ending in death or transfer within 24 hours and with recorded major procedure
n=885,864
Number of events = 40,749
Multilevel mixed-effects logistic regression
Saturday
Sunday
Versus
Monday
Age
Gender
Transfers in from another hospital
Year of admission
Comorbidity score
Diagnosis risk factor
Bed numbers
Rate of transfers to other hospitals
Hospital 30 day mortality
Saturday and Sunday analysed separately - included in weekend versus weekday meta-analysis
High risk of detection bias – short follow up
Showkathali 2013181
All patients undergoing
Binary logistic
Out of hours (18:00 to 08:00
Age >75 years
Sex
30 day mortality
Procedure time taken as
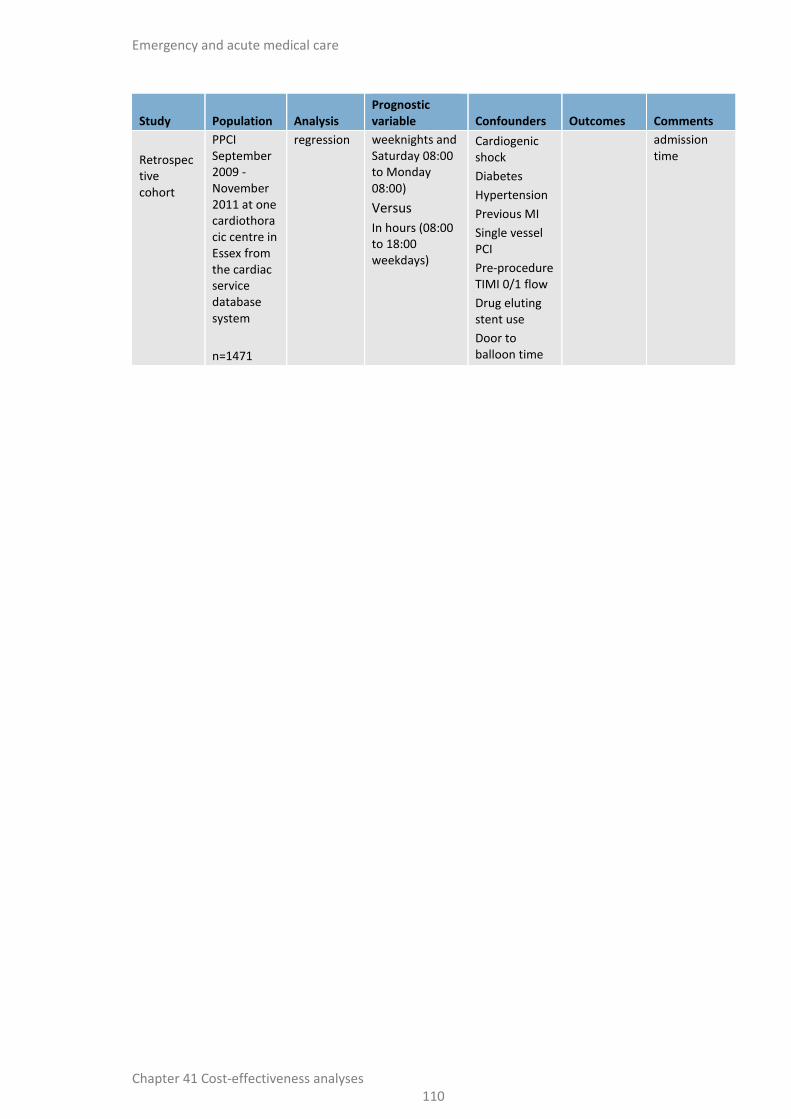
Emergency and acute medical care
Chapter 41 Cost-effectiveness analyses 110
Study Population Analysis Prognostic variable Confounders Outcomes Comments
Retrospective cohort
PPCI September 2009 - November 2011 at one cardiothoracic centre in Essex from the cardiac service database system
n=1471
regression weeknights and Saturday 08:00 to Monday 08:00)
Versus
In hours (08:00 to 18:00 weekdays)
Cardiogenic shock
Diabetes
Hypertension
Previous MI
Single vessel PCI
Pre-procedure TIMI 0/1 flow
Drug eluting stent use
Door to balloon time
admission time

Emergen
cy and
acute m
edical care
Ch
apte
r 41
Co
st-effectiveness an
alyses 1
11
Table 44: Clinical evidence summary: Weekend admission
Risk factor and outcome
(population) Number of studies
Pooled effect (95% CI) [if meta-analysed]
OR
Effect (95% CI) [in single study] Imprecision GRADE Quality
Weekend versus weekday admission for predicting hospital mortality (adjusted OR)
(emergency admissions)a
1 Adjusted OR: 1.10 (1.08 to 1.12)
No serious imprecision
HIGH
Weekend versus weekday admission for predicting hospital mortality (adjusted OR)
(emergency inpatient admissions)a
1 Adjusted OR: 1.10 (1.08 to 1.12)
No serious imprecision
HIGH
Weekend versus weekday admission for predicting hospital mortality (adjusted OR)
(acute medical admissions)a
1 Adjusted OR: 1.15 (0.89 to 1.49)
Seriousb MODERATE
Weekend versus weekday admission for predicting hospital mortality (adjusted OR)
(acute exacerbations of chronic obstructive pulmonary disease admissions)a
1 Adjusted OR: 1.75 (0.75 to 4.09)
Seriousb LOW
Weekend versus weekday admission for predicting hospital mortality (adjusted HR)
(acute subarachnoid haemorrhage admissions)a
1 Adjusted HR: 2.10 (1.13 to 3.9) No serious imprecision
HIGH
Weekend versus weekday admission for predicting hospital mortality (adjusted HR)
(all admissions)a
1 Adjusted HR: 1.14 (1.12 to 1.15)
Range of HR: 1.11-1.16
No serious imprecision
HIGH
Weekend versus weekday admission for predicting hospital mortality (adjusted OR)
(acute upper gastrointestinal bleeding admissions)a
1 Adjusted OR: 0.93 (0.75 to 1.15)
Seriousb VERY LOW
Weekend versus weekday admission for predicting hospital mortality (adjusted OR)
(emergency admissions)a
1 Adjusted OR: 1.09 (1.05 to 1.13)
No serious imprecision
HIGH

Emergen
cy and
acute m
edical care
Ch
apte
r 41
Co
st-effectiveness an
alyses 1
12
Risk factor and outcome
(population) Number of studies
Pooled effect (95% CI) [if meta-analysed]
OR
Effect (95% CI) [in single study] Imprecision GRADE Quality
Weekend versus weekday admission for predicting hospital mortality (adjusted RR)
(emergency medical and elderly admissions)a
1 Adjusted RR:0.98 (0.91 to 1.06) Seriousb MODERATE
Weekend versus weekday admission for predicting hospital mortality (adjusted OR)
(stroke admissions)a
1 Adjusted OR: 1.18 (1.12 to 1.24)
No serious imprecision
MODERATE
Weekend versus weekday admission for predicting hospital mortality (adjusted OR)
(emergency admissions)a
1 Adjusted OR: 1.08 (1.05 to 1.10)
Range of OR: 1.07-1.08
No serious imprecision
MODERATE
Weekend versus weekday admission for predicting hospital mortality (adjusted OR)
(emergency admissions)a
1 Adjusted OR: 1.02 (1.00 to 1.03)
Range of OR: 0.96-1.03
No serious imprecision
MODERATE
Weekend (8am-7.59pm) versus weekday admission for predicting 30 day survival (adjusted OR)
(stroke admissions)a
1 Adjusted OR 1.03 (0.95 to 1.12) Seriousb MODERATE
Weekend (8pm-7.59am) versus weekday admission for predicting 30 day survival (adjusted OR)
(stroke admissions)a
1 Adjusted OR 0.89 (0.78 to 1.02) Seriousb MODERATE
Weekend versus weekday admission for predicting 30 day mortality (adjusted OR)
(stroke admissions)a
1 Adjusted OR: 1.14 (1.06 to 1.23)
No serious imprecision
HIGH
Weekend versus weekday admission for predicting 30 day mortality (adjusted OR)
(A&E admissions)a
1 Adjusted OR: 1.05 (1.04 to 1.07) No serious imprecision
HIGH
Weekend versus weekday admission for predicting 30 day mortality (adjusted OR)
(direct admissions)a
1 Adjusted OR: 1.21 (1.16 to 1.26) No serious imprecision
HIGH

Emergen
cy and
acute m
edical care
Ch
apte
r 41
Co
st-effectiveness an
alyses 1
13
Risk factor and outcome
(population) Number of studies
Pooled effect (95% CI) [if meta-analysed]
OR
Effect (95% CI) [in single study] Imprecision GRADE Quality
Weekend versus weekday admission for predicting 30 day mortality (adjusted HR)
(all admissions)a
3 Adjusted HR: 1.13 (1.10 to 1.15)
Range of HR: 0.96-1.15
No serious imprecision
MODERATE
Weekend versus weekday admission for predicting avoidable adverse events (re-bleeding)
(adjusted OR)
(acute upper gastrointestinal bleeding admissions)a
1 Adjusted OR: 0.91 (0.74 to 1.12) Seriousb LOW
Weekend versus weekday admission for predicting avoidable adverse events (surgery/radiology)
(adjusted OR)
(acute upper gastrointestinal bleeding admissions)a
1 Adjusted OR: 1.13 (0.81 to 1.58) Seriousb LOW
Weekend versus weekday admission for predicting avoidable adverse events (red cell transfusion)
(adjusted OR)
(acute upper gastrointestinal bleeding admissions)a
1 Adjusted OR: 1.12 (0.94 to 1.33) Seriousb LOW
Weekend versus weekday admission for predicting avoidable adverse events (inadequate clinical response to NEWS)
(adjusted OR)
(all admissions)a
1 Adjusted OR: 4.15 (2.24 to 7.69) No serious imprecision
MODERATE
Weekend versus weekday admission for predicting avoidable adverse events (aspiration pneumonia)
(adjusted OR)
(stroke admissions)a
1 Adjusted OR: 1.11 (1.04 to 1.18) No serious imprecision
HIGH
Weekend versus weekday admission for predicting length of stay (discharge to usual place of residence within 56 days)
(adjusted OR)
(stroke admissions)
1 Adjusted OR: 0.92 (0.88 to 0.96) No serious imprecision
HIGH

Emergen
cy and
acute m
edical care
Ch
apte
r 41
Co
st-effectiveness an
alyses 1
14
(a) Methods: multivariable analysis, including key covariates used in analysis to assess if weekend admission is an independent risk factor. Key covariates included: age and severity. (b) 95% CI around the median crosses null line.
Table 45: Clinical evidence summary: Out of hours admission
Risk factor and outcome
(population) Number of studies
Pooled effect (95% CI) [if meta-analysed]
OR
Effect (95% CI) [in single study] Imprecision GRADE Quality
Out of hours versus in hours admission for predicting hospital mortality
(adjusted OR)
(STEMI admissions)a
1 Adjusted OR: 1.33 (0.73 to 2.42) Seriousb LOW
Out of hours versus in hours admission for predicting 30 day mortality
(adjusted OR)
(stroke admissions)a
1 Adjusted OR: 1.07 (1.00 to 1.14) No serious imprecision
HIGH
Out of hours versus in hours admission for predicting 30 day mortality
(adjusted HR)
(STEMI admissions)a
1 Adjusted HR: 1.03 (0.89 to 1.19) Seriousb LOW
Out of hours versus in hours admission for predicting 30 day mortality
(adjusted HR)
(STEMI admissions)a
1 Adjusted HR: 0.74 (0.42 to 1.30) Seriousb LOW
Out of hours versus in hours admission for predicting 30 day mortality
(adjusted HR)
(all patients undergoing PPCI)a
1 Adjusted HR: 1.10 (0.60 to 2.02) Seriousb LOW
Out of hours versus in hours admission for predicting avoidable adverse events (bleeding complications)
(adjusted OR)
(STEMI admissions)a
1 Adjusted OR: 1.47 (0.97 to 2.23) Seriousb LOW
Out of hours versus in hours admission for predicting avoidable adverse events (major adverse cardiac events)
(adjusted HR)
(STEMI admissions)a
1 Adjusted HR: 0.81 (0.54 to 1.22) Seriousb LOW

Emergen
cy and
acute m
edical care
Ch
apte
r 41
Co
st-effectiveness an
alyses 1
15
(a) Methods: multivariable analysis, including key covariates used in analysis to assess if weekend admission is an independent risk factor. Key covariates included: age and severity. (b) 95% CI around the median crosses null line.

Emergency and acute medical care
Chapter 41 Cost-effectiveness analyses 116
C.3 Evidence statements The evidence for weekend versus weekday admission for predicting hospital mortality and avoidable adverse events was inconsistent. Studies examined the effect of weekend admission on varying populations of which some suggested a reduction in mortality with weekend admission, the majority found an increase in mortality.
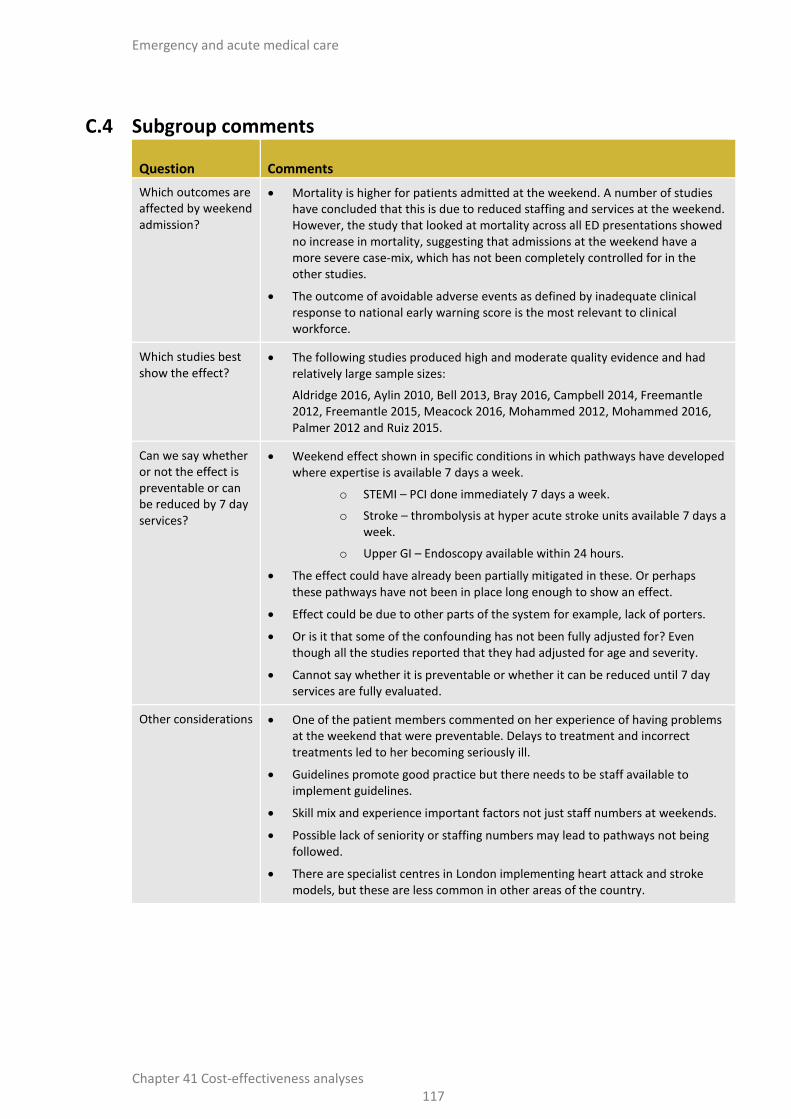
Emergency and acute medical care
Chapter 41 Cost-effectiveness analyses 117
C.4 Subgroup comments
Question Comments
Which outcomes are affected by weekend admission?
Mortality is higher for patients admitted at the weekend. A number of studies have concluded that this is due to reduced staffing and services at the weekend. However, the study that looked at mortality across all ED presentations showed no increase in mortality, suggesting that admissions at the weekend have a more severe case-mix, which has not been completely controlled for in the other studies.
The outcome of avoidable adverse events as defined by inadequate clinical response to national early warning score is the most relevant to clinical workforce.
Which studies best show the effect?
The following studies produced high and moderate quality evidence and had relatively large sample sizes:
Aldridge 2016, Aylin 2010, Bell 2013, Bray 2016, Campbell 2014, Freemantle 2012, Freemantle 2015, Meacock 2016, Mohammed 2012, Mohammed 2016, Palmer 2012 and Ruiz 2015.
Can we say whether or not the effect is preventable or can be reduced by 7 day services?
Weekend effect shown in specific conditions in which pathways have developed where expertise is available 7 days a week.
o STEMI – PCI done immediately 7 days a week.
o Stroke – thrombolysis at hyper acute stroke units available 7 days a week.
o Upper GI – Endoscopy available within 24 hours.
The effect could have already been partially mitigated in these. Or perhaps these pathways have not been in place long enough to show an effect.
Effect could be due to other parts of the system for example, lack of porters.
Or is it that some of the confounding has not been fully adjusted for? Even though all the studies reported that they had adjusted for age and severity.
Cannot say whether it is preventable or whether it can be reduced until 7 day services are fully evaluated.
Other considerations One of the patient members commented on her experience of having problems at the weekend that were preventable. Delays to treatment and incorrect treatments led to her becoming seriously ill.
Guidelines promote good practice but there needs to be staff available to implement guidelines.
Skill mix and experience important factors not just staff numbers at weekends.
Possible lack of seniority or staffing numbers may lead to pathways not being followed.
There are specialist centres in London implementing heart attack and stroke models, but these are less common in other areas of the country.

Emergency and acute medical care
Chapter 41 Cost-effectiveness analyses 118
C.5 Review protocol
Table 46: Review protocol: Weekend admission
Component Description
Review question Is weekend admission associated with worse outcome than weekday admission in England (after controlling for case-mix)?
Objectives To determine whether weekend admission is associated with worse outcome than weekday admission in England, after controlling for case-mix
Population Adults and young people (16 years and over) with a suspected or confirmed AME
Presence or absence of prognostic variable
Weekend admission (or weekend attendance at ED) to include Saturday and Sunday reported together or as separate days
Outcome(s) Hospital mortality(CRITICAL)
30 day Mortality (CRITICAL)
Length of stay
Avoidable adverse events
Study design Prospective or retrospective cohort studies
Exclusions Exclude studies from outside of England
How the information will be searched
The databases to be searched are: Medline, Embase, the Cochrane Library
Date limits for search: 10 years old (i.e., published after 2005) Language: English only
Key confounders Minimum set of confounders that should be adjusted for (will vary per outcome)
Age
Severity of illness – may not be reported
The review strategy
Meta-analysis where appropriate will be conducted.
Studies in the following subgroup populations will be included:
Frail elderly
Case mix – Cardiovascular /Oncology patients etc.
In addition, if studies have pre-specified in their protocols that results for any of these subgroup populations will be analysed separately, then they will be included. The methodological quality of each study will be assessed using the Evibase checklist and GRADE.
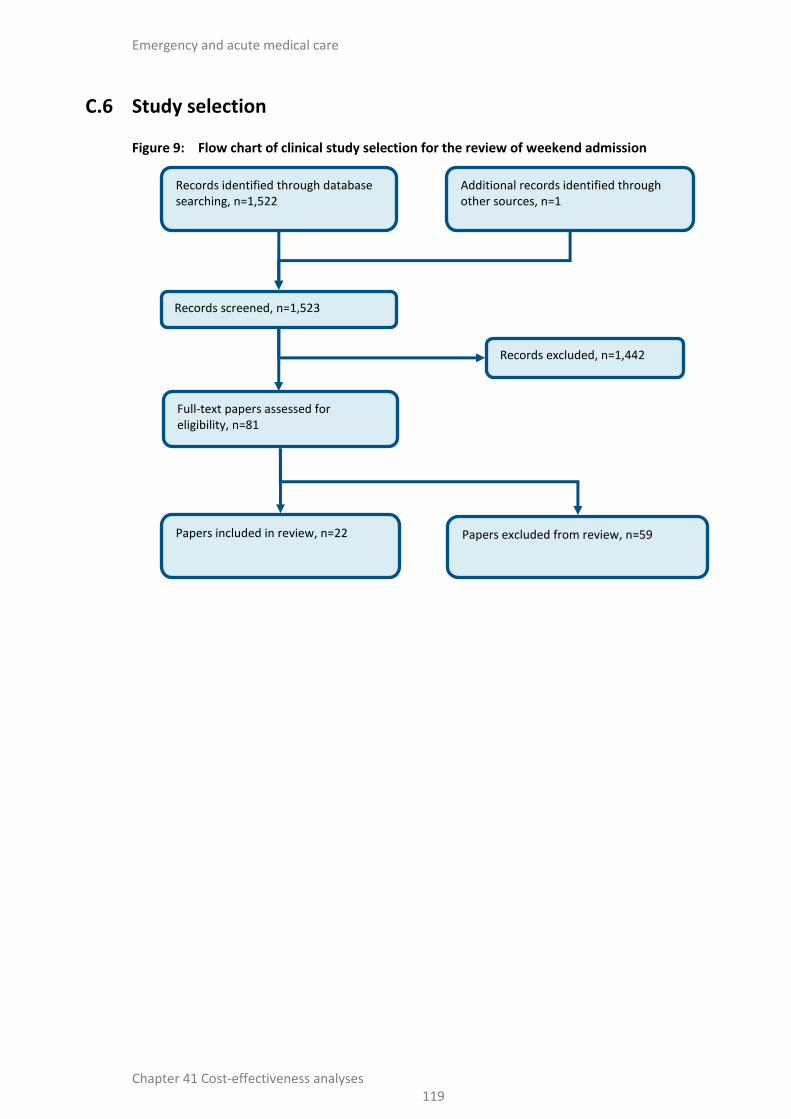
Emergency and acute medical care
Chapter 41 Cost-effectiveness analyses 119
C.6 Study selection
Figure 9: Flow chart of clinical study selection for the review of weekend admission
Records screened, n=1,523
Records excluded, n=1,442
Papers included in review, n=22
Papers excluded from review, n=59
Records identified through database searching, n=1,522
Additional records identified through other sources, n=1
Full-text papers assessed for eligibility, n=81

Emergency and acute medical care
Chapter 41 Cost-effectiveness analyses 120
C.7 Forest plots
C.7.1 Weekend versus weekday admission
Figure 10: Weekend versus weekday admission for predicting hospital mortality in acute medical admissions
Figure 11: Weekend versus weekday admission for predicting hospital mortality in acute exacerbations of chronic obstructive pulmonary disease admissions
Figure 12: Weekend versus weekday admission for predicting hospital mortality in emergency inpatient admissions
Figure 13: Weekend versus weekday admission for predicting hospital mortality in emergency admissions
Study or Subgroup
Bell 2013
Total (95% CI)
Heterogeneity: Not applicable
Test for overall effect: Z = 1.07 (P = 0.29)
log[Odds Ratio]
0.1398
SE
0.1308
Weight
100.0%
100.0%
IV, Fixed, 95% CI
1.15 [0.89, 1.49]
1.15 [0.89, 1.49]
Odds Ratio Odds Ratio
IV, Fixed, 95% CI
0.1 0.2 0.5 1 2 5 10Favours weekend Favours weekday
Study or Subgroup
Brims 2011
Total (95% CI)
Heterogeneity: Not applicable
Test for overall effect: Z = 1.29 (P = 0.20)
log[Odds Ratio]
0.5596
SE
0.433
Weight
100.0%
100.0%
IV, Fixed, 95% CI
1.75 [0.75, 4.09]
1.75 [0.75, 4.09]
Odds Ratio Odds Ratio
IV, Fixed, 95% CI
0.1 0.2 0.5 1 2 5 10Favours weekend Favours weekday
Study or Subgroup
Aylin 2010
Total (95% CI)
Heterogeneity: Not applicable
Test for overall effect: Z = 10.14 (P < 0.00001)
log[Odds Ratio]
0.0953
SE
0.0094
Weight
100.0%
100.0%
IV, Fixed, 95% CI
1.10 [1.08, 1.12]
1.10 [1.08, 1.12]
Odds Ratio Odds Ratio
IV, Fixed, 95% CI
0.1 0.2 0.5 1 2 5 10Favours weekend Favours weekday
Study or Subgroup
Aldridge 2016
Total (95% CI)
Heterogeneity: Not applicable
Test for overall effect: Z = 10.14 (P < 0.00001)
log[Odds Ratio]
0.0953
SE
0.0094
Weight
100.0%
100.0%
IV, Fixed, 95% CI
1.10 [1.08, 1.12]
1.10 [1.08, 1.12]
Odds Ratio Odds Ratio
IV, Fixed, 95% CI
0.1 0.2 0.5 1 2 5 10Favours weekend Favours weekday

Emergency and acute medical care
Chapter 41 Cost-effectiveness analyses 121
Figure 14: Weekend versus weekday admission for predicting hospital mortality in acute subarachnoid haemorrhage admissions
Figure 15: Weekend versus weekday admission for predicting hospital mortality in all admissions
Figure 16: Weekend versus weekday admission for predicting hospital mortality in acute upper gastrointestinal bleeding admissions
Figure 17: Weekend versus weekday admission for predicting hospital mortality in emergency admissions
Figure 18: Weekend versus weekday admission for predicting hospital mortality in emergency medical and elderly admissions
Study or Subgroup
Deshmukh 2016
Total (95% CI)
Heterogeneity: Not applicable
Test for overall effect: Z = 2.35 (P = 0.02)
log[Hazard Ratio]
0.7419
SE
0.3162
Weight
100.0%
100.0%
IV, Fixed, 95% CI
2.10 [1.13, 3.90]
2.10 [1.13, 3.90]
Hazard Ratio Hazard Ratio
IV, Fixed, 95% CI
0.1 0.2 0.5 1 2 5 10Favours weekend Favours weekday
Study or Subgroup
Freemantle 2012 (Sat vs. Wed)
Freemantle 2012 (Sun vs. Wed)
Total (95% CI)
Heterogeneity: Chi² = 11.68, df = 1 (P = 0.0006); I² = 91%
Test for overall effect: Z = 19.81 (P < 0.00001)
log[Hazard Ratio]
0.1044
0.1484
SE
0.0093
0.0089
Weight
47.8%
52.2%
100.0%
IV, Fixed, 95% CI
1.11 [1.09, 1.13]
1.16 [1.14, 1.18]
1.14 [1.12, 1.15]
Hazard Ratio Hazard Ratio
IV, Fixed, 95% CI
0.1 0.2 0.5 1 2 5 10Favours Saturday Favours Wednesday
Study or Subgroup
Jairath 2011
Total (95% CI)
Heterogeneity: Not applicable
Test for overall effect: Z = 0.66 (P = 0.51)
log[Odds Ratio]
-0.0726
SE
0.1098
Weight
100.0%
100.0%
IV, Fixed, 95% CI
0.93 [0.75, 1.15]
0.93 [0.75, 1.15]
Odds Ratio Odds Ratio
IV, Fixed, 95% CI
0.1 0.2 0.5 1 2 5 10Favours weekend Favours weekday
Study or Subgroup
Mohammed 2012B
Total (95% CI)
Heterogeneity: Not applicable
Test for overall effect: Z = 4.51 (P < 0.00001)
log[Odds Ratio]
0.0862
SE
0.0191
Weight
100.0%
100.0%
IV, Fixed, 95% CI
1.09 [1.05, 1.13]
1.09 [1.05, 1.13]
Odds Ratio Odds Ratio
IV, Fixed, 95% CI
0.1 0.2 0.5 1 2 5 10Favours weekend Favours weekday
Study or Subgroup
Mohammed 2016
Total (95% CI)
Heterogeneity: Not applicable
Test for overall effect: Z = 0.53 (P = 0.59)
log[Risk Ratio]
-0.0202
SE
0.0378
Weight
100.0%
100.0%
IV, Fixed, 95% CI
0.98 [0.91, 1.06]
0.98 [0.91, 1.06]
Risk Ratio Risk Ratio
IV, Fixed, 95% CI
0.1 0.2 0.5 1 2 5 10Favours [experimental] Favours [control]

Emergency and acute medical care
Chapter 41 Cost-effectiveness analyses 122
Figure 19: Weekend versus weekday admission for predicting hospital mortality in stroke admissions
Figure 20: Weekend versus weekday admission for predicting hospital mortality in emergency admissions
Figure 21: Weekend versus weekday admission for predicting hospital mortality in emergency admissions
Figure 22: Weekend (8am-7.59pm) versus weekday admission for predicting 30 day survival in stroke admissions
Study or Subgroup
Palmer 2012
Total (95% CI)
Heterogeneity: Not applicable
Test for overall effect: Z = 6.22 (P < 0.00001)
log[Odds Ratio]
0.1655
SE
0.0266
Weight
100.0%
100.0%
IV, Fixed, 95% CI
1.18 [1.12, 1.24]
1.18 [1.12, 1.24]
Odds Ratio Odds Ratio
IV, Fixed, 95% CI
0.1 0.2 0.5 1 2 5 10Favours weekend Favours weekday
Study or Subgroup
Ruiz 2015 (Sat vs. Mon)
Ruiz 2015 (Sun vs. Mon)
Total (95% CI)
Heterogeneity: Chi² = 0.12, df = 1 (P = 0.73); I² = 0%
Test for overall effect: Z = 5.29 (P < 0.00001)
log[Odds Ratio]
0.0677
0.077
SE
0.0194
0.0193
Weight
49.7%
50.3%
100.0%
IV, Fixed, 95% CI
1.07 [1.03, 1.11]
1.08 [1.04, 1.12]
1.08 [1.05, 1.10]
Odds Ratio Odds Ratio
IV, Fixed, 95% CI
0.1 0.2 0.5 1 2 5 10Favours weekend Favours weekday
Study or Subgroup
Anselmi 2016 (Fri night vs. Wed day)
Anselmi 2016 (Sat day vs. Wed day)
Anselmi 2016 (Sat night vs. Wed day)
Anselmi 2016 (Sun day vs. Wed day)
Anselmi 2016 (Sun night vs. Wed day)
Total (95% CI)
Heterogeneity: Chi² = 17.33, df = 4 (P = 0.002); I² = 77%
Test for overall effect: Z = 2.22 (P = 0.03)
log[Odds Ratio]
-0.0387
0.0305
-0.003
0.0592
0.0188
SE
0.0189
0.0161
0.0193
0.0161
0.0194
Weight
17.7%
24.3%
16.9%
24.3%
16.8%
100.0%
IV, Fixed, 95% CI
0.96 [0.93, 1.00]
1.03 [1.00, 1.06]
1.00 [0.96, 1.04]
1.06 [1.03, 1.10]
1.02 [0.98, 1.06]
1.02 [1.00, 1.03]
Odds Ratio Odds Ratio
IV, Fixed, 95% CI
0.1 0.2 0.5 1 2 5 10Favours weekend Favours weekday
Study or Subgroup
Bray 2016
Total (95% CI)
Heterogeneity: Not applicable
Test for overall effect: Z = 0.72 (P = 0.47)
log[Odds Ratio]
0.0296
SE
0.0413
Weight
100.0%
100.0%
IV, Fixed, 95% CI
1.03 [0.95, 1.12]
1.03 [0.95, 1.12]
Odds Ratio Odds Ratio
IV, Fixed, 95% CI
0.1 0.2 0.5 1 2 5 10Favours weekday Favours weekend
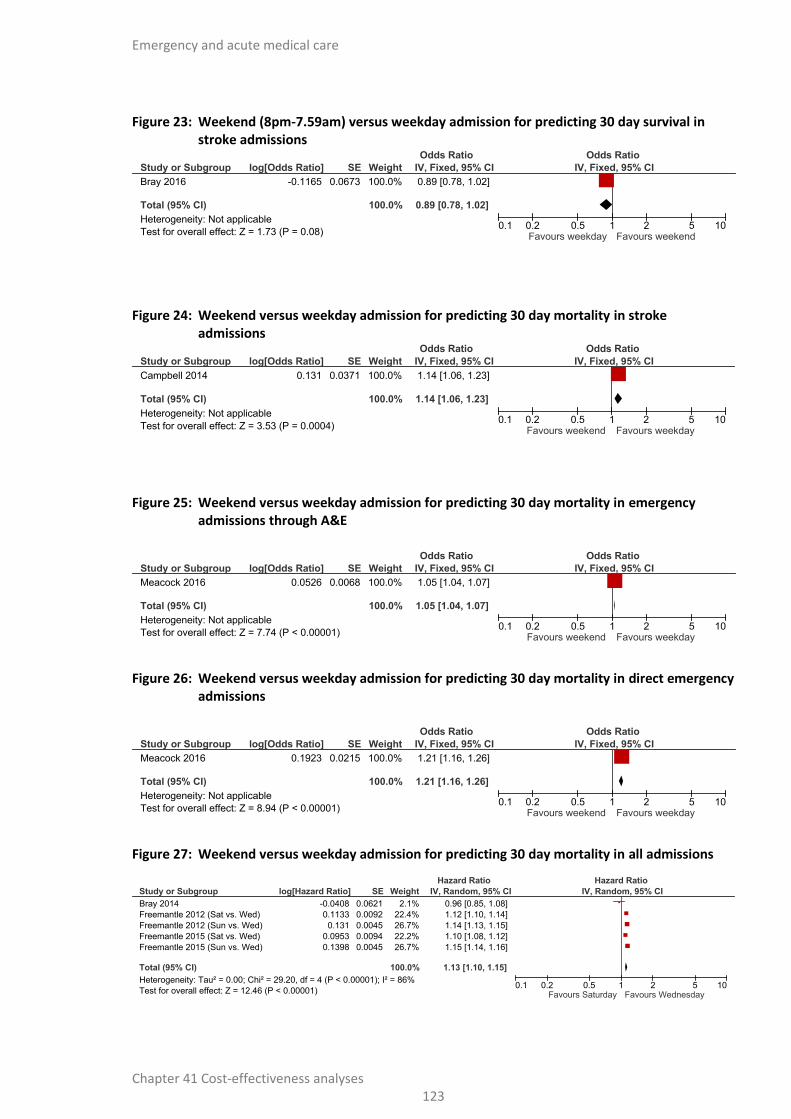
Emergency and acute medical care
Chapter 41 Cost-effectiveness analyses 123
Figure 23: Weekend (8pm-7.59am) versus weekday admission for predicting 30 day survival in stroke admissions
Figure 24: Weekend versus weekday admission for predicting 30 day mortality in stroke admissions
Figure 25: Weekend versus weekday admission for predicting 30 day mortality in emergency admissions through A&E
Figure 26: Weekend versus weekday admission for predicting 30 day mortality in direct emergency admissions
Figure 27: Weekend versus weekday admission for predicting 30 day mortality in all admissions
Study or Subgroup
Bray 2016
Total (95% CI)
Heterogeneity: Not applicable
Test for overall effect: Z = 1.73 (P = 0.08)
log[Odds Ratio]
-0.1165
SE
0.0673
Weight
100.0%
100.0%
IV, Fixed, 95% CI
0.89 [0.78, 1.02]
0.89 [0.78, 1.02]
Odds Ratio Odds Ratio
IV, Fixed, 95% CI
0.1 0.2 0.5 1 2 5 10Favours weekday Favours weekend
Study or Subgroup
Campbell 2014
Total (95% CI)
Heterogeneity: Not applicable
Test for overall effect: Z = 3.53 (P = 0.0004)
log[Odds Ratio]
0.131
SE
0.0371
Weight
100.0%
100.0%
IV, Fixed, 95% CI
1.14 [1.06, 1.23]
1.14 [1.06, 1.23]
Odds Ratio Odds Ratio
IV, Fixed, 95% CI
0.1 0.2 0.5 1 2 5 10Favours weekend Favours weekday
Study or Subgroup
Meacock 2016
Total (95% CI)
Heterogeneity: Not applicable
Test for overall effect: Z = 7.74 (P < 0.00001)
log[Odds Ratio]
0.0526
SE
0.0068
Weight
100.0%
100.0%
IV, Fixed, 95% CI
1.05 [1.04, 1.07]
1.05 [1.04, 1.07]
Odds Ratio Odds Ratio
IV, Fixed, 95% CI
0.1 0.2 0.5 1 2 5 10Favours weekend Favours weekday
Study or Subgroup
Meacock 2016
Total (95% CI)
Heterogeneity: Not applicable
Test for overall effect: Z = 8.94 (P < 0.00001)
log[Odds Ratio]
0.1923
SE
0.0215
Weight
100.0%
100.0%
IV, Fixed, 95% CI
1.21 [1.16, 1.26]
1.21 [1.16, 1.26]
Odds Ratio Odds Ratio
IV, Fixed, 95% CI
0.1 0.2 0.5 1 2 5 10Favours weekend Favours weekday
Study or Subgroup
Bray 2014
Freemantle 2012 (Sat vs. Wed)
Freemantle 2012 (Sun vs. Wed)
Freemantle 2015 (Sat vs. Wed)
Freemantle 2015 (Sun vs. Wed)
Total (95% CI)
Heterogeneity: Tau² = 0.00; Chi² = 29.20, df = 4 (P < 0.00001); I² = 86%
Test for overall effect: Z = 12.46 (P < 0.00001)
log[Hazard Ratio]
-0.0408
0.1133
0.131
0.0953
0.1398
SE
0.0621
0.0092
0.0045
0.0094
0.0045
Weight
2.1%
22.4%
26.7%
22.2%
26.7%
100.0%
IV, Random, 95% CI
0.96 [0.85, 1.08]
1.12 [1.10, 1.14]
1.14 [1.13, 1.15]
1.10 [1.08, 1.12]
1.15 [1.14, 1.16]
1.13 [1.10, 1.15]
Hazard Ratio Hazard Ratio
IV, Random, 95% CI
0.1 0.2 0.5 1 2 5 10Favours Saturday Favours Wednesday

Emergency and acute medical care
Chapter 41 Cost-effectiveness analyses 124
Figure 28: Weekend versus weekday admission for predicting avoidable adverse events (re-bleeding) in acute upper gastrointestinal bleeding admissions
Figure 29: Weekend versus weekday admission for predicting avoidable adverse events (surgery/radiology) in acute upper gastrointestinal bleeding admissions
Figure 30: Weekend versus weekday admission for predicting avoidable adverse events (red cell transfusion) in acute upper gastrointestinal bleeding admissions
Figure 31: Weekend versus weekday admission for predicting avoidable adverse events (inadequate clinical response to NEWS) in all admissions
Figure 32: Weekend versus weekday admission for predicting avoidable adverse events (aspiration pneumonia) in stroke admissions
Study or Subgroup
Jairath 2011
Total (95% CI)
Heterogeneity: Not applicable
Test for overall effect: Z = 0.89 (P = 0.37)
log[Odds Ratio]
-0.0943
SE
0.1055
Weight
100.0%
100.0%
IV, Fixed, 95% CI
0.91 [0.74, 1.12]
0.91 [0.74, 1.12]
Odds Ratio Odds Ratio
IV, Fixed, 95% CI
0.1 0.2 0.5 1 2 5 10Favours weekend Favours weekday
Study or Subgroup
Jairath 2011
Total (95% CI)
Heterogeneity: Not applicable
Test for overall effect: Z = 0.72 (P = 0.47)
log[Odds Ratio]
0.1222
SE
0.1699
Weight
100.0%
100.0%
IV, Fixed, 95% CI
1.13 [0.81, 1.58]
1.13 [0.81, 1.58]
Odds Ratio Odds Ratio
IV, Fixed, 95% CI
0.1 0.2 0.5 1 2 5 10Favours weekend Favours weekday
Study or Subgroup
Jairath 2011
Total (95% CI)
Heterogeneity: Not applicable
Test for overall effect: Z = 1.27 (P = 0.21)
log[Odds Ratio]
0.1133
SE
0.0894
Weight
100.0%
100.0%
IV, Fixed, 95% CI
1.12 [0.94, 1.33]
1.12 [0.94, 1.33]
Odds Ratio Odds Ratio
IV, Fixed, 95% CI
0.1 0.2 0.5 1 2 5 10Favours weekend Favours weekday
Study or Subgroup
Kolic 2015
Total (95% CI)
Heterogeneity: Not applicable
Test for overall effect: Z = 4.52 (P < 0.00001)
log[Odds Ratio]
1.4231
SE
0.3146
Weight
100.0%
100.0%
IV, Fixed, 95% CI
4.15 [2.24, 7.69]
4.15 [2.24, 7.69]
Odds Ratio Odds Ratio
IV, Fixed, 95% CI
0.1 0.2 0.5 1 2 5 10Favours weekend Favours weekday
Study or Subgroup
Palmer 2012
Total (95% CI)
Heterogeneity: Not applicable
Test for overall effect: Z = 3.14 (P = 0.002)
log[Odds Ratio]
0.1044
SE
0.0332
Weight
100.0%
100.0%
IV, Fixed, 95% CI
1.11 [1.04, 1.18]
1.11 [1.04, 1.18]
Odds Ratio Odds Ratio
IV, Fixed, 95% CI
0.1 0.2 0.5 1 2 5 10Favours weekend Favours weekday
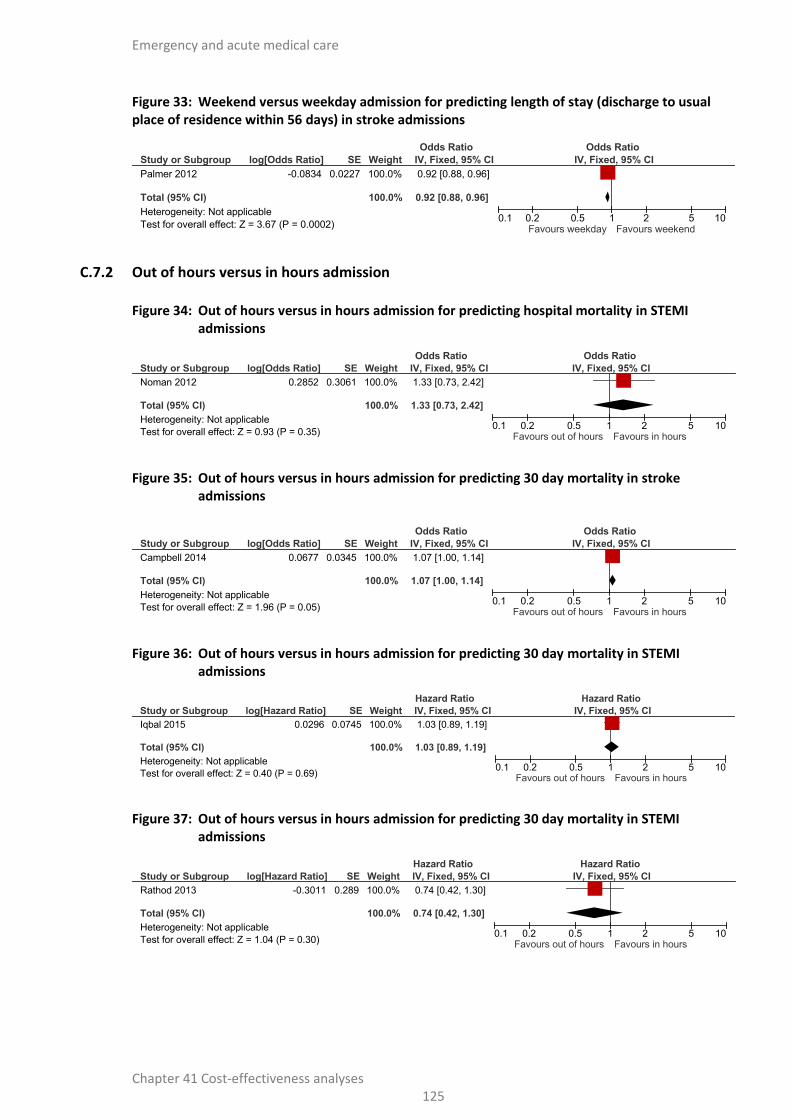
Emergency and acute medical care
Chapter 41 Cost-effectiveness analyses 125
Figure 33: Weekend versus weekday admission for predicting length of stay (discharge to usual place of residence within 56 days) in stroke admissions
C.7.2 Out of hours versus in hours admission
Figure 34: Out of hours versus in hours admission for predicting hospital mortality in STEMI admissions
Figure 35: Out of hours versus in hours admission for predicting 30 day mortality in stroke admissions
Figure 36: Out of hours versus in hours admission for predicting 30 day mortality in STEMI admissions
Figure 37: Out of hours versus in hours admission for predicting 30 day mortality in STEMI admissions
Study or Subgroup
Palmer 2012
Total (95% CI)
Heterogeneity: Not applicable
Test for overall effect: Z = 3.67 (P = 0.0002)
log[Odds Ratio]
-0.0834
SE
0.0227
Weight
100.0%
100.0%
IV, Fixed, 95% CI
0.92 [0.88, 0.96]
0.92 [0.88, 0.96]
Odds Ratio Odds Ratio
IV, Fixed, 95% CI
0.1 0.2 0.5 1 2 5 10Favours weekday Favours weekend
Study or Subgroup
Noman 2012
Total (95% CI)
Heterogeneity: Not applicable
Test for overall effect: Z = 0.93 (P = 0.35)
log[Odds Ratio]
0.2852
SE
0.3061
Weight
100.0%
100.0%
IV, Fixed, 95% CI
1.33 [0.73, 2.42]
1.33 [0.73, 2.42]
Odds Ratio Odds Ratio
IV, Fixed, 95% CI
0.1 0.2 0.5 1 2 5 10Favours out of hours Favours in hours
Study or Subgroup
Campbell 2014
Total (95% CI)
Heterogeneity: Not applicable
Test for overall effect: Z = 1.96 (P = 0.05)
log[Odds Ratio]
0.0677
SE
0.0345
Weight
100.0%
100.0%
IV, Fixed, 95% CI
1.07 [1.00, 1.14]
1.07 [1.00, 1.14]
Odds Ratio Odds Ratio
IV, Fixed, 95% CI
0.1 0.2 0.5 1 2 5 10Favours out of hours Favours in hours
Study or Subgroup
Iqbal 2015
Total (95% CI)
Heterogeneity: Not applicable
Test for overall effect: Z = 0.40 (P = 0.69)
log[Hazard Ratio]
0.0296
SE
0.0745
Weight
100.0%
100.0%
IV, Fixed, 95% CI
1.03 [0.89, 1.19]
1.03 [0.89, 1.19]
Hazard Ratio Hazard Ratio
IV, Fixed, 95% CI
0.1 0.2 0.5 1 2 5 10Favours out of hours Favours in hours
Study or Subgroup
Rathod 2013
Total (95% CI)
Heterogeneity: Not applicable
Test for overall effect: Z = 1.04 (P = 0.30)
log[Hazard Ratio]
-0.3011
SE
0.289
Weight
100.0%
100.0%
IV, Fixed, 95% CI
0.74 [0.42, 1.30]
0.74 [0.42, 1.30]
Hazard Ratio Hazard Ratio
IV, Fixed, 95% CI
0.1 0.2 0.5 1 2 5 10Favours out of hours Favours in hours

Emergency and acute medical care
Chapter 41 Cost-effectiveness analyses 126
Figure 38: Out of hours versus in hours admission for predicting 30 day mortality in all patients undergoing PPCI
Figure 39: Out of hours versus in hours admission for predicting avoidable adverse events (bleeding complications) in STEMI admissions
Figure 40: Out of hours versus in hours admission for predicting avoidable adverse events (major adverse cardiac events) in STEMI admissions
Study or Subgroup
Showkathali 2013
Total (95% CI)
Heterogeneity: Not applicable
Test for overall effect: Z = 0.31 (P = 0.76)
log[Hazard Ratio]
0.0953
SE
0.3093
Weight
100.0%
100.0%
IV, Fixed, 95% CI
1.10 [0.60, 2.02]
1.10 [0.60, 2.02]
Hazard Ratio Hazard Ratio
IV, Fixed, 95% CI
0.1 0.2 0.5 1 2 5 10Favours out of hours Favours in hours
Study or Subgroup
Iqbal 2015
Total (95% CI)
Heterogeneity: Not applicable
Test for overall effect: Z = 1.82 (P = 0.07)
log[Odds Ratio]
0.3853
SE
0.2121
Weight
100.0%
100.0%
IV, Fixed, 95% CI
1.47 [0.97, 2.23]
1.47 [0.97, 2.23]
Odds Ratio Odds Ratio
IV, Fixed, 95% CI
0.1 0.2 0.5 1 2 5 10Favours out of hours Favours in hours
Study or Subgroup
Rathod 2013
Total (95% CI)
Heterogeneity: Not applicable
Test for overall effect: Z = 1.02 (P = 0.31)
log[Hazard Ratio]
-0.2107
SE
0.2069
Weight
100.0%
100.0%
IV, Fixed, 95% CI
0.81 [0.54, 1.22]
0.81 [0.54, 1.22]
Hazard Ratio Hazard Ratio
IV, Fixed, 95% CI
0.1 0.2 0.5 1 2 5 10Favours out of hours Favours in hours

Emergen
cy and
acute m
edical care
Ch
apte
r 41
Co
st-effectiveness an
alyses 1
27
C.8 Evidence tables
Reference Aldridge 20166
Study type and analysis
Retrospective cohort study. Logistic regression.
Number of participants
and characteristics
Total n not reported
Weekend admissions n not reported; Weekday admissions n not reported
Inclusion criteria: adult emergency hospital admissions for financial year 2013-2014 from the Health and Social Care Information Centre
Exclusion criteria: patients younger than 16 years and primary maternity admissions
Prognostic variable Weekend admission (admissions starting on a Saturday or Sunday by date) versus weekday admission (reference day Wednesday by date)
Confounders Trust
Sex
Age
Income deprivation component of the Index of Multiple Deprivation 2010
Diagnostic category as represented by the Clinical Classification Software code and a categorised index of comorbidity
Outcomes and effect sizes
Protocol outcome: Hospital mortality
OR 1.10 (95% CI 1.08 to 1.12)
Comments Risk of bias assessments: Low risk of bias
Reference Anselmi 20168
Study type and analysis
Retrospective cohort study. Logistic regression.
Number of participants
and characteristics
Total n=3,027,946
Number in each risk factor category not reported
Inclusion criteria: emergency admissions via A&E between 1 April 2013 and 28 February 2014
Exclusion criteria: all but first admission in cases of multiple admissions in the last 30 days of life, incomplete information on risk-adjustment variables

Emergen
cy and
acute m
edical care
Ch
apte
r 41
Co
st-effectiveness an
alyses 1
28
Reference Anselmi 20168
Prognostic variable Weekend admission (7pm Friday night to 6.59am Monday morning) versus weekday admission (reference day Wednesday 7am to 6.59pm)
Confounders Interaction between gender and age
Ethnicity
Primary diagnosis
Comorbidities (30 binary indicators recorded in the secondary diagnosis fields, measured using Elixhauser conditions)
Source of admission
Deprivation in area of residence
Admitting hospital
Month of admission
Outcomes and effect sizes
Protocol outcome: Hospital mortality
OR 1.02 (95% CI 1.0 to 1.03)
Comments Risk of bias assessments: High risk of bias
Reference Aylin 201011
Study type and analysis
Retrospective cohort study. Logistic regression.
Number of participants
and characteristics
Total n=4,317,866
Weekend admissions 999,062; Weekday admissions 3,318,804
Inclusion criteria: Emergency inpatient admissions extracted from finished consultant episodes of care for inpatients in all acute public hospitals in England from the NHS Wide Clearing Service with discharge dates between 1 April 2005 and 31 March 2006
Exclusion criteria: Day cases (day surgery) and admissions occurring in non-acute trusts
Prognostic variable Weekend admission (admissions starting on a Saturday or Sunday by date) versus weekday admission
Confounders Age
Sex
Deprivation quintile
Charlson comorbidity score
Case mix (clinical classification system diagnostic groups)
Outcomes and Protocol outcome: Hospital mortality

Emergen
cy and
acute m
edical care
Ch
apte
r 41
Co
st-effectiveness an
alyses 1
29
Reference Aylin 201011
effect sizes OR 1.10 (95% CI 1.08 to 1.12)
Comments Risk of bias assessments: Low risk of bias
Reference Bell 201323
Study type and analysis
Retrospective cohort study. Step-wise multivariate regression analysis.
Number of participants
and characteristics
Total n=1.3 million
Number in each risk factor category not reported
Inclusion criteria: Adult (≥16 years) acute medical admissions derived from hospital episode statistics for patients admitted to participating hospitals as an acute medical emergency 1 April 2009 to 31 March 2010
Exclusion criteria: not reported
Prognostic variable Weekend admission versus weekday admission
Confounders Charlson comorbidity index
Age
Index of multiple deprivation
Outcomes and effect sizes
Protocol outcome: Hospital mortality
OR 1.15 (95% CI 0.89 to 1.49)
Comments Risk of bias assessments: Low risk of bias
Reference Bray 201428
Study type and analysis
Prospective cohort study. Cox proportional hazards model.
Number of participants
and characteristics
Total n=32,388
Number in each risk factor category not reported
Inclusion criteria: Adults (≥18 years) admitted with stroke from the Stroke Improvement National Audit Programme from 1 June 2011 to 1 December 2012 linked with English national register of deaths
Exclusion criteria: Subarachnoid haemorrhage or transient ischaemic attack
Prognostic variable Weekend admission versus weekday admission

Emergen
cy and
acute m
edical care
Ch
apter 4
1 C
ost-effectiven
ess analyses
13
0
Reference Bray 201428
Confounders Age
Stroke type
Pre-stroke independence
Hypoxia in the first 24 hours of admission
Lowest level of consciousness in the first 24 hours
Arm weakness
Leg weakness
Hemianopia
Dysphasia
No. of SU beds
Presence of 24/7 on-site thrombolysis service
Ratio of HCAs/nurses to beds
Presence of 7-day physician ward rounds
Management solely in an optimal setting in first 24 hrs
Antiplatelet therapy if required
Brain scan within 24 hours
Outcomes and effect sizes
Protocol outcome: 30 day mortality
HR 0.96 (95% CI 0.85 to 1.08)
Comments Risk of bias assessments: Low risk of bias
Reference Bray 201629
Study type and analysis
Prospective cohort study. Logistic regression.
Number of participants
and characteristics
Total n=74,307
Weekend admissions 18,916; Weekday admissions 55,391
Inclusion criteria: adult patients (aged>16 years) admitted with acute stroke in England and Wales between 1 April 2013 and 31 March 2014 from the Sentinel Stroke National Audit Programme (SSNAP)
Exclusion criteria: not reported
Prognostic variable Weekend admission (Saturday to Sunday 08:00-19:59 h and Saturday to Sunday 20:00-07:59 hours) versus Weekday admission (Monday to
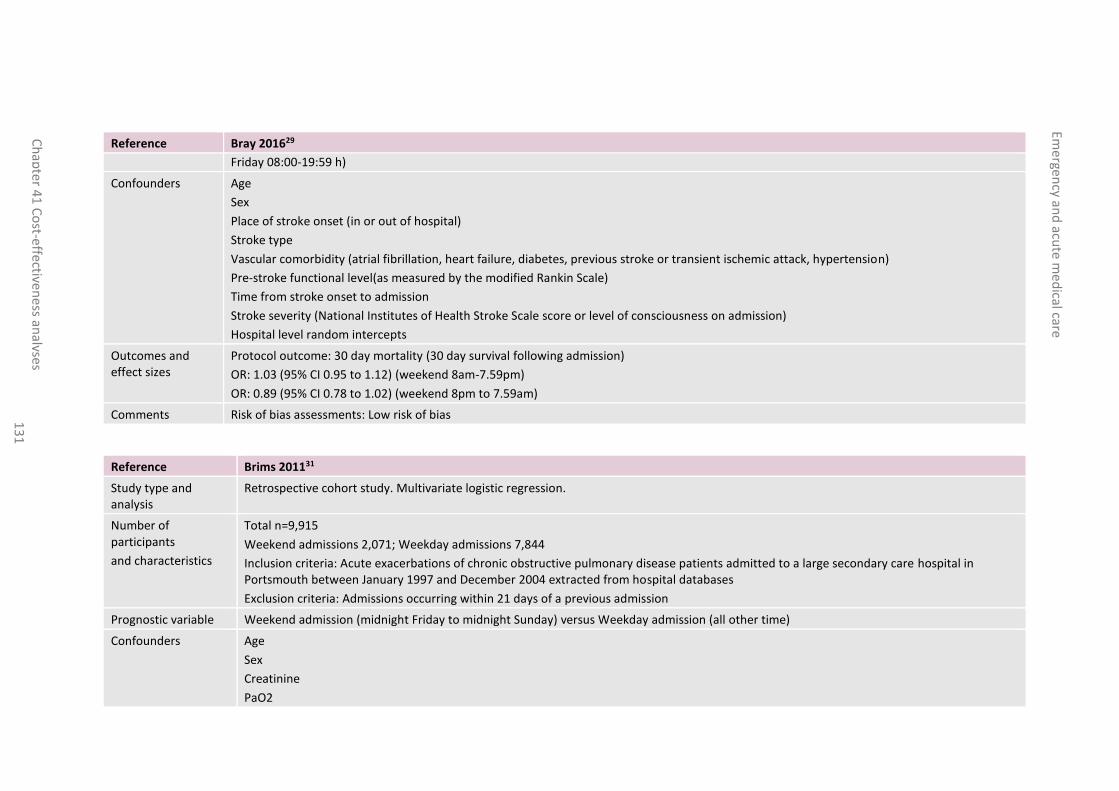
Emergen
cy and
acute m
edical care
Ch
apte
r 41
Co
st-effectiveness an
alyses 1
31
Reference Bray 201629
Friday 08:00-19:59 h)
Confounders Age
Sex
Place of stroke onset (in or out of hospital)
Stroke type
Vascular comorbidity (atrial fibrillation, heart failure, diabetes, previous stroke or transient ischemic attack, hypertension)
Pre-stroke functional level(as measured by the modified Rankin Scale)
Time from stroke onset to admission
Stroke severity (National Institutes of Health Stroke Scale score or level of consciousness on admission)
Hospital level random intercepts
Outcomes and effect sizes
Protocol outcome: 30 day mortality (30 day survival following admission)
OR: 1.03 (95% CI 0.95 to 1.12) (weekend 8am-7.59pm)
OR: 0.89 (95% CI 0.78 to 1.02) (weekend 8pm to 7.59am)
Comments Risk of bias assessments: Low risk of bias
Reference Brims 201131
Study type and analysis
Retrospective cohort study. Multivariate logistic regression.
Number of participants
and characteristics
Total n=9,915
Weekend admissions 2,071; Weekday admissions 7,844
Inclusion criteria: Acute exacerbations of chronic obstructive pulmonary disease patients admitted to a large secondary care hospital in Portsmouth between January 1997 and December 2004 extracted from hospital databases
Exclusion criteria: Admissions occurring within 21 days of a previous admission
Prognostic variable Weekend admission (midnight Friday to midnight Sunday) versus Weekday admission (all other time)
Confounders Age
Sex
Creatinine
PaO2

Emergen
cy and
acute m
edical care
Ch
apte
r 41
Co
st-effectiveness an
alyses 1
32
Reference Brims 201131
Outcomes and effect sizes
Protocol outcome: Hospital mortality
OR: 1.75 (95% CI 0.75 to 4.09)
Comments Risk of bias assessments: High risk of bias
Reference Campbell 201433
Study type and analysis
Prospective cohort study. Logistic regression.
Number of participants
and characteristics
Total n= 45,726
Out of hours admissions 23,779; In hours admissions 21,947
Inclusion criteria: Stroke admissions to 130 hospitals in England (1 April 2010 - 31 January 2012) from the Stroke Improvement National Audit Programme
Exclusion criteria: Subarachnoid haemorrhage
Prognostic variable Weekend admission versus Weekday admission
Out of hours admission (weekdays before 08:00 or after 18:00 or at any time on a weekend day or English public holiday) versus In hours admission (weekdays 08:00 to 18:00)
Confounders Age
Sex
Worst level of consciousness in the first 24 hours (surrogate for severity)
Stroke type
Pre-stroke independence
Outcomes and effect sizes
Protocol outcome: 30 day mortality
Weekend admission versus Weekday admission OR: 1.14 (95% CI 1.06 to 1.23)
Out of hours admission versus In hours admission OR 1.07 (95% CI 1.00 to 1.14)
Comments Risk of bias assessments: Low risk of bias
Reference Deshmukh 201657
Study type and analysis
Prospective cohort study. Cox proportional hazards model.

Emergen
cy and
acute m
edical care
Ch
apte
r 41
Co
st-effectiveness an
alyses 1
33
Reference Deshmukh 201657
Number of participants
and characteristics
Total n=385
Weekend admissions 100; Weekday admissions 285
Inclusion criteria: patients admitted between January 2009 and December 2011 with acute subarachnoid haemorrhage from 12 hospitals in Northwest England
Exclusion criteria: not reported
Prognostic variable Weekend admission (16:00 Friday to 16:00 Sunday) versus Weekday admission
Confounders Age
Sex
Severity of SAH (baseline World Federation of Neurosurgical Societies grade)
Treatment modalities following admission
Time from scan to admission and from admission to treatment
Outcomes and effect sizes
Protocol outcome: Hospital mortality
HR: 2.10 (95% CI 1.13 to 3.90)
Comments Risk of bias assessments: Low risk of bias
Reference Freemantle 201262
Study type and analysis
Retrospective cohort study. Contingency tables for each day, utilising a complementary log-log link function and binomial error.
Number of participants
and characteristics
Total n=14,217,640
Number in each risk factor category not reported
Inclusion criteria: All admissions to National Health Service Hospitals in England April 2009 - March 2010 using inpatient hospital trusts within England. Linked data on mortality from the Office of National Statistics
Exclusion criteria: not reported
Prognostic variable Saturday admission versus Wednesday admission
Sunday admission versus Wednesday admission
Confounders Age
Sex
Ethnicity

Emergen
cy and
acute m
edical care
Ch
apte
r 41
Co
st-effectiveness an
alyses 1
34
Reference Freemantle 201262
Source of admission
Diagnostic group
No. of previous emergency admissions
No. of previous complex admissions
Charlson comorbidity index
Social deprivation
Hospital trust
Day of the year (seasonality)
Outcomes and effect sizes
Protocol outcome: Hospital mortality
Saturday versus Wednesday HR 1.11 (95% CI 1.09 to 1.13)
Sunday versus Wednesday HR 1.16 (95% CI 1.14 to 1.18)
Protocol outcome: 30 day mortality
Saturday versus Wednesday HR 1.12 (95% CI 1.10 to 1.14)
Sunday versus Wednesday HR 1.14 (95% CI 1.13 to 1.15)
Comments Risk of bias assessments: Low risk of bias
Reference Freemantle 201563
Study type and analysis
Retrospective cohort study. Contingency tables for each day, utilising a complementary log-log link function and binomial error.
Number of participants
and characteristics
Total n= 14 818 374
17% admitted on each weekday, 8% on Saturday and 6% on Sunday
Inclusion criteria: All admissions to National Health Service Hospitals in England in 2013-2014
Exclusion criteria: At least one case mix item missing
Prognostic variable Saturday admission versus Wednesday admission
Sunday admission versus Wednesday admission
Confounders Case mix (clinical classifications software category)
Age
Time of year

Emergen
cy and
acute m
edical care
Ch
apte
r 41
Co
st-effectiveness an
alyses 1
35
Reference Freemantle 201563
Trust
Deprivation
No. of previous emergency admissions
No. of previous complex admissions
Admission source
Admission urgency
Sex
Ethnicity
Charlson comorbidity index
Outcomes and effect sizes
Protocol outcome: 30 day mortality
Saturday versus Wednesday HR 1.10 (95% CI 1.08 to 1.12)
Sunday versus Wednesday HR 1.15 (95% CI 1.14 to 1.16)
Comments Risk of bias assessments: Low risk of bias
Reference Iqbal 201588
Study type and analysis
Retrospective cohort study. Logistic regression and Cox proportional hazards regression models.
Number of participants
and characteristics
Total n=11,466
Out of hours admission 7,496; In hours admission 3,970
Inclusion criteria: Consecutive STEMI patients treated with PPCI between 2005 and 2011 at 8 tertiary centres in London from local British Cardiac Intervention Society databases linked with Office of National Statistics data
Exclusion criteria: not reported
Prognostic variable Out of hours (weekdays 17:00 to 09:00 and any time on a Saturday or Sunday) versus In hours (09:00 to 17:00 Monday to Friday)
Confounders Age
Sex
Diabetes
GP2b-3a inhibitor use
Previous MI
Renal disease
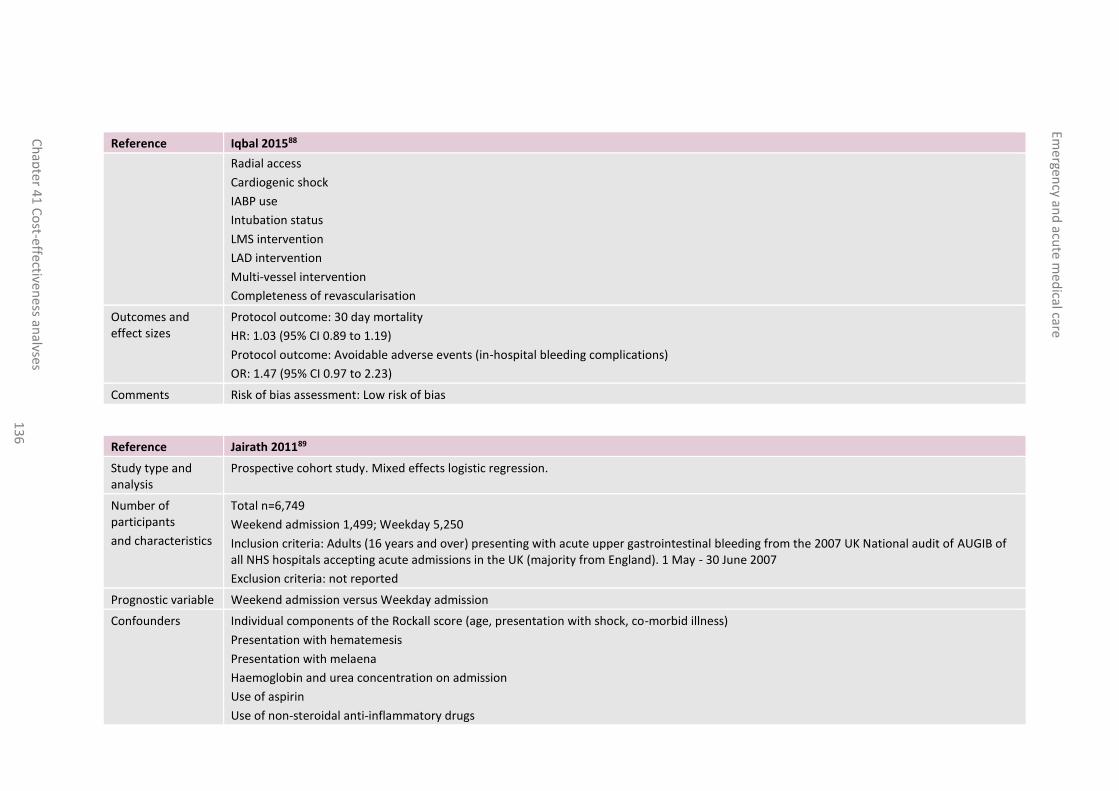
Eme
rgency an
d acu
te med
ical care
Ch
apte
r 41
Co
st-effectiveness an
alyses 1
36
Reference Iqbal 201588
Radial access
Cardiogenic shock
IABP use
Intubation status
LMS intervention
LAD intervention
Multi-vessel intervention
Completeness of revascularisation
Outcomes and effect sizes
Protocol outcome: 30 day mortality
HR: 1.03 (95% CI 0.89 to 1.19)
Protocol outcome: Avoidable adverse events (in-hospital bleeding complications)
OR: 1.47 (95% CI 0.97 to 2.23)
Comments Risk of bias assessment: Low risk of bias
Reference Jairath 201189
Study type and analysis
Prospective cohort study. Mixed effects logistic regression.
Number of participants
and characteristics
Total n=6,749
Weekend admission 1,499; Weekday 5,250
Inclusion criteria: Adults (16 years and over) presenting with acute upper gastrointestinal bleeding from the 2007 UK National audit of AUGIB of all NHS hospitals accepting acute admissions in the UK (majority from England). 1 May - 30 June 2007
Exclusion criteria: not reported
Prognostic variable Weekend admission versus Weekday admission
Confounders Individual components of the Rockall score (age, presentation with shock, co-morbid illness)
Presentation with hematemesis
Presentation with melaena
Haemoglobin and urea concentration on admission
Use of aspirin
Use of non-steroidal anti-inflammatory drugs

Emergen
cy and
acute m
edical care
Ch
apte
r 41
Co
st-effectiveness an
alyses 1
37
Reference Jairath 201189
Use of proton pump inhibitors
Gender
Variceal bleeding
Peptic ulcer bleeding
Availability of OOH rota enabling 24hr access to endoscopy
Admission status (new patient versus inpatient)
Outcomes and effect sizes
Protocol outcome: Hospital mortality up to 30 days post-index AUGIB
OR: 0.93 (95% CI 0.75 to 1.15)
Protocol outcome: Avoidable adverse events (re-bleeding)
OR: 0.91 (95% CI 0.74 to 1.12)
Protocol outcome: Avoidable adverse events (surgery/radiology)
OR: 1.13 (95% CI 0.81 to 1.58)
Protocol outcome: Avoidable adverse events (red cell transfusion)
OR: 1.12 (95% CI 0.94 to 1.33)
Comments Risk of bias assessment: High risk of bias (for the outcome of hospital mortality); Low risk of bias (for the outcomes of avoidable adverse events) 43% of patients missing at least one baseline variable, but group missing data rates not reported. Multiple imputation used to account for uncertainty caused by missing data
Reference Kolic 201599
Study type and analysis
Prospective cohort study. Multivariate logistic regression.
Number of participants
and characteristics
Total n=370
Weekend admission 75; Weekday admission 295
Inclusion criteria: All patients presenting to the acute medical unit at Queen Elizabeth Hospital in London 1 October 2013 - 15 October 2013 and 9 December 2013 - 22 December 2013
Exclusion criteria: Patients with <12hr inpatient stay
Prognostic variable Weekend admission versus Weekday admission
Confounders Age
Severity (NEW score)

Emergen
cy and
acute m
edical care
Ch
apte
r 41
Co
st-effectiveness an
alyses 1
38
Reference Kolic 201599
Outcomes and effect sizes
Protocol outcome: Avoidable adverse events (inadequate clinical response to NEW score)
OR: 4.15 (95% CI 2.24 to 7.69)
Comments Risk of bias assessment: High risk of bias
Reference Meacock 2016118
Study type and analysis
Retrospective cohort study. Logistic regression.
Number of participants
and characteristics
Total n=4,656,586
Number in each risk factor category not reported
Inclusion criteria: emergency admissions to type 1 units (consultant-led, multispecialty 24-hour services with full resuscitation facilities and designated accommodation for reception of A&E patients) from 140 trusts in England from hospital episode statistics 1 April 2013 to 28 February 2014
Exclusion criteria: single speciality centres, minor injury units and walk-in centres
Prognostic variable Weekend admission (Saturday and Sunday by date) versus Weekday admission (Monday to Friday by date)
Confounders Age
Sex
Ethnicity
Primary diagnosis (SHMI-grouped Clinical Classifications Software category)
Elixhauser (comorbidity) conditions
Admission method
Admission source
Deprivation quintile
Month
Admitting hospital
Outcomes and effect sizes
Protocol outcome: 30 day mortality
OR: 1.05 (95% CI 1.04 to 1.07) (A&E admissions)
OR: 1.21 (95% CI 1.16 to 1.26) (direct admissions)
Comments Risk of bias assessment: Low risk of bias
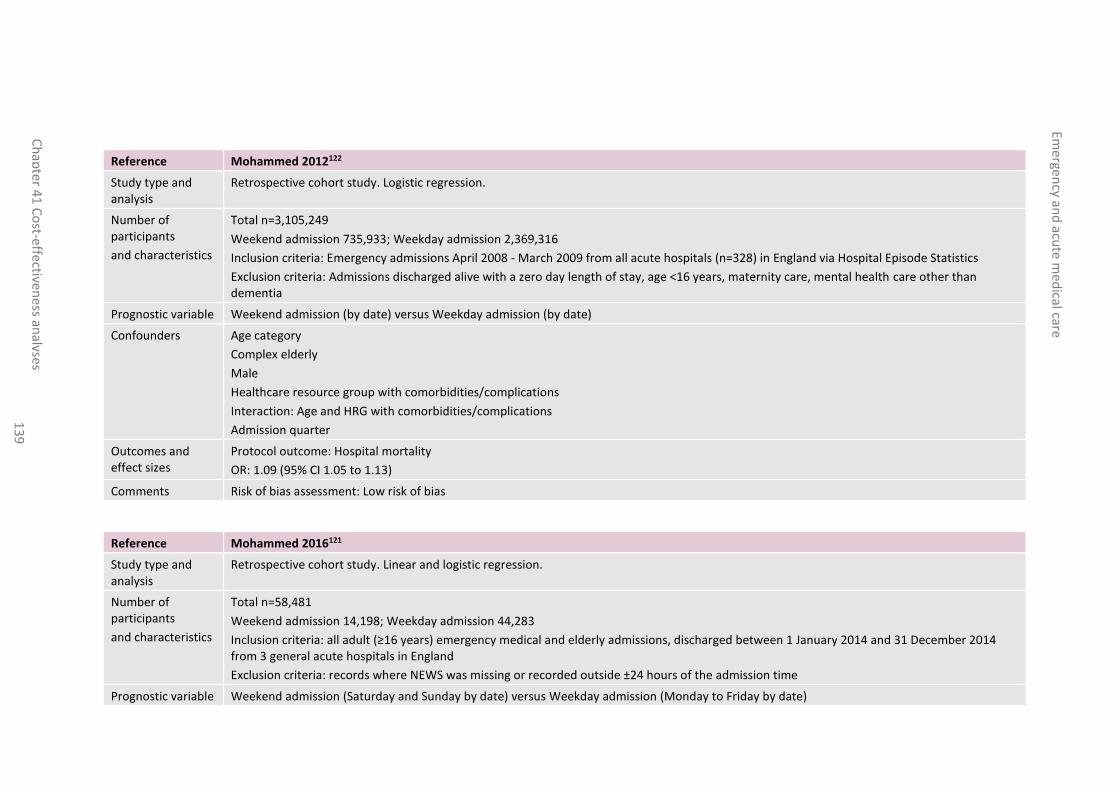
Emergen
cy and
acute m
edical care
Ch
apte
r 41
Co
st-effectiveness an
alyses 1
39
Reference Mohammed 2012122
Study type and analysis
Retrospective cohort study. Logistic regression.
Number of participants
and characteristics
Total n=3,105,249
Weekend admission 735,933; Weekday admission 2,369,316
Inclusion criteria: Emergency admissions April 2008 - March 2009 from all acute hospitals (n=328) in England via Hospital Episode Statistics
Exclusion criteria: Admissions discharged alive with a zero day length of stay, age <16 years, maternity care, mental health care other than dementia
Prognostic variable Weekend admission (by date) versus Weekday admission (by date)
Confounders Age category
Complex elderly
Male
Healthcare resource group with comorbidities/complications
Interaction: Age and HRG with comorbidities/complications
Admission quarter
Outcomes and effect sizes
Protocol outcome: Hospital mortality
OR: 1.09 (95% CI 1.05 to 1.13)
Comments Risk of bias assessment: Low risk of bias
Reference Mohammed 2016121
Study type and analysis
Retrospective cohort study. Linear and logistic regression.
Number of participants
and characteristics
Total n=58,481
Weekend admission 14,198; Weekday admission 44,283
Inclusion criteria: all adult (≥16 years) emergency medical and elderly admissions, discharged between 1 January 2014 and 31 December 2014 from 3 general acute hospitals in England
Exclusion criteria: records where NEWS was missing or recorded outside ±24 hours of the admission time
Prognostic variable Weekend admission (Saturday and Sunday by date) versus Weekday admission (Monday to Friday by date)

Emergen
cy and
acute m
edical care
Ch
apte
r 41
Co
st-effectiveness an
alyses 1
40
Reference Mohammed 2016121
Confounders Index NEWS
Age
Sex
Calendar month
Outcomes and effect sizes
Protocol outcome: Hospital mortality
RR: 0.98 (95% CI 0.91 to 1.06)
Comments Risk of bias assessment: Low risk of bias
Reference Noman 2012142
Study type and analysis
Retrospective cohort study. Multiple logistic regression.
Number of participants
and characteristics
Total n=2,571
Out of hours 1,535; Routine hours 1,036
Inclusion criteria: STEMI patients undergoing PPCI March 2008 - June 2011 at one tertiary cardiac centre in Newcastle from local coronary artery disease database (Dentrite) linked with Office of National Statistics data
Exclusion criteria: not reported
Prognostic variable Out of hours (weekdays between 18:00 and 08:00 and any time on a Saturday or Sunday) versus Routine hours (08:00 to 18:00 Monday to Friday)
Confounders Age
Sex
Previous MI
Diabetes mellitus
Anterior MI site
Baseline haemoglobin and creatinine
Admission HR and SBP
Cardiogenic shock
Onset of symptoms to balloon time
Presence of multi-vessel disease
Thromolysis in MI flow 3 post-PPCI

Emergen
cy and
acute m
edical care
Ch
apte
r 41
Co
st-effectiveness an
alyses 1
41
Reference Noman 2012142
Outcomes and effect sizes
Protocol outcome: Hospital mortality
OR: 1.33 (95% CI 0.73 to 2.42)
Comments Risk of bias assessment: Low risk of bias
Reference Palmer 2012147
Study type and analysis
Retrospective cohort study. Multiple logistic regression.
Number of participants
and characteristics
Total n=93,621
Weekend admission 23,297; Weekday admission 70,324
Inclusion criteria: Stroke admissions from Hospital Episode Statistics 1 April 2009 - 31 March 2010
Exclusion criteria: not reported
Prognostic variable Weekend (midnight Friday to Midnight Sunday) versus Weekday
Confounders Age
Sex
Socioeconomic deprivation quintile
No. of previous admissions
Comorbidities (Charlson index with weights derived from all admissions in England)
Month of discharge
Ethnic group
Source of admission
Stroke type
Outcomes and effect sizes
Protocol outcome: Hospital mortality
OR: 1.18 (95% CI 1.12 to 1.24)
Protocol outcome: Avoidable adverse events (aspiration pneumonia)
OR: 1.11 (95% CI 1.04 to 1.18)
Length of stay (discharge to usual place of residence within 56 days)
OR 0.92 (95% CI 0.88 to 0.96)
Comments Risk of bias assessment: High risk of bias (for outcome of mortality); Low risk of bias (for outcomes of avoidable adverse events); Low risk of bias

Emergen
cy and
acute m
edical care
Ch
apte
r 41
Co
st-effectiveness an
alyses 1
42
Reference Palmer 2012147
(for outcome of length of stay)
Reference Rathod 2013161
Study type and analysis
Retrospective cohort study. Logistic regression.
Number of participants
and characteristics
Total n=3347
Out of hours admissions 2,048; In hours admissions 1,299
Inclusion criteria: Consecutive STEMI patients undergoing PPCI in one tertiary heart attack centre in London January 2004 - July 2012 from clinical database, electronic patient record and cardiac surgical database linked with Office of National Statistics data
Exclusion criteria: not reported
Prognostic variable Out of hours (17:01 to 07:59 Monday to Friday and 17:01 Friday to 07:59 Monday) versus In hours (08:00 to 17:00 Monday to Friday)
Confounders Age
Shock
eGFR>60 (epidermal growth factor receptor)
EF>40
Procedural success
Multi-vessel disease
Outcomes and effect sizes
Protocol outcome: 30 day mortality
HR: 0.74 (95% CI 0.42 to 1.30)
Protocol outcome: Avoidable adverse events (death, recurrent MI, target vessel revascularisation)
HR: 0.81 (95% CI 0.54 to 1.22)
Comments Risk of bias assessment: Low risk of bias
Reference Ruiz 2015168
Study type and analysis
Retrospective cohort study. Multilevel mixed-effects logistic regression.
Number of participants
Total n=885,864
Number in each risk factor category not reported
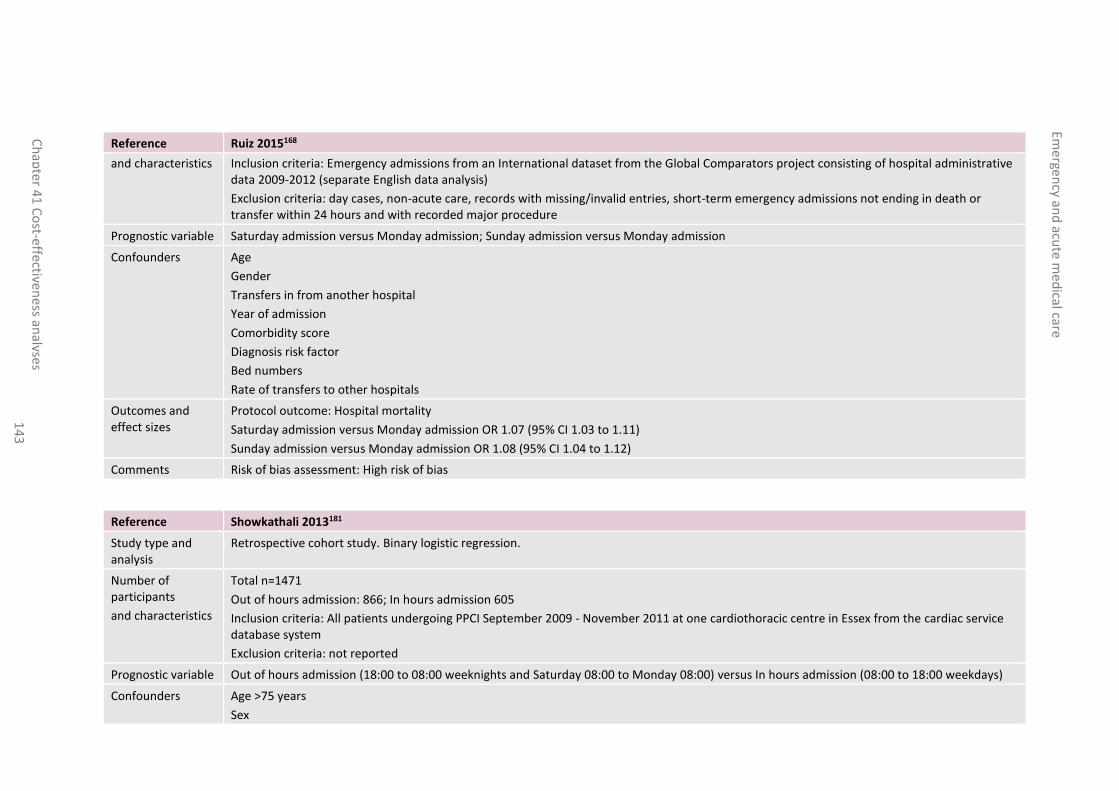
Emerge
ncy an
d acu
te med
ical care
Ch
apte
r 41
Co
st-effectiveness an
alyses 1
43
Reference Ruiz 2015168
and characteristics Inclusion criteria: Emergency admissions from an International dataset from the Global Comparators project consisting of hospital administrative data 2009-2012 (separate English data analysis)
Exclusion criteria: day cases, non-acute care, records with missing/invalid entries, short-term emergency admissions not ending in death or transfer within 24 hours and with recorded major procedure
Prognostic variable Saturday admission versus Monday admission; Sunday admission versus Monday admission
Confounders Age
Gender
Transfers in from another hospital
Year of admission
Comorbidity score
Diagnosis risk factor
Bed numbers
Rate of transfers to other hospitals
Outcomes and effect sizes
Protocol outcome: Hospital mortality
Saturday admission versus Monday admission OR 1.07 (95% CI 1.03 to 1.11)
Sunday admission versus Monday admission OR 1.08 (95% CI 1.04 to 1.12)
Comments Risk of bias assessment: High risk of bias
Reference Showkathali 2013181
Study type and analysis
Retrospective cohort study. Binary logistic regression.
Number of participants
and characteristics
Total n=1471
Out of hours admission: 866; In hours admission 605
Inclusion criteria: All patients undergoing PPCI September 2009 - November 2011 at one cardiothoracic centre in Essex from the cardiac service database system
Exclusion criteria: not reported
Prognostic variable Out of hours admission (18:00 to 08:00 weeknights and Saturday 08:00 to Monday 08:00) versus In hours admission (08:00 to 18:00 weekdays)
Confounders Age >75 years
Sex
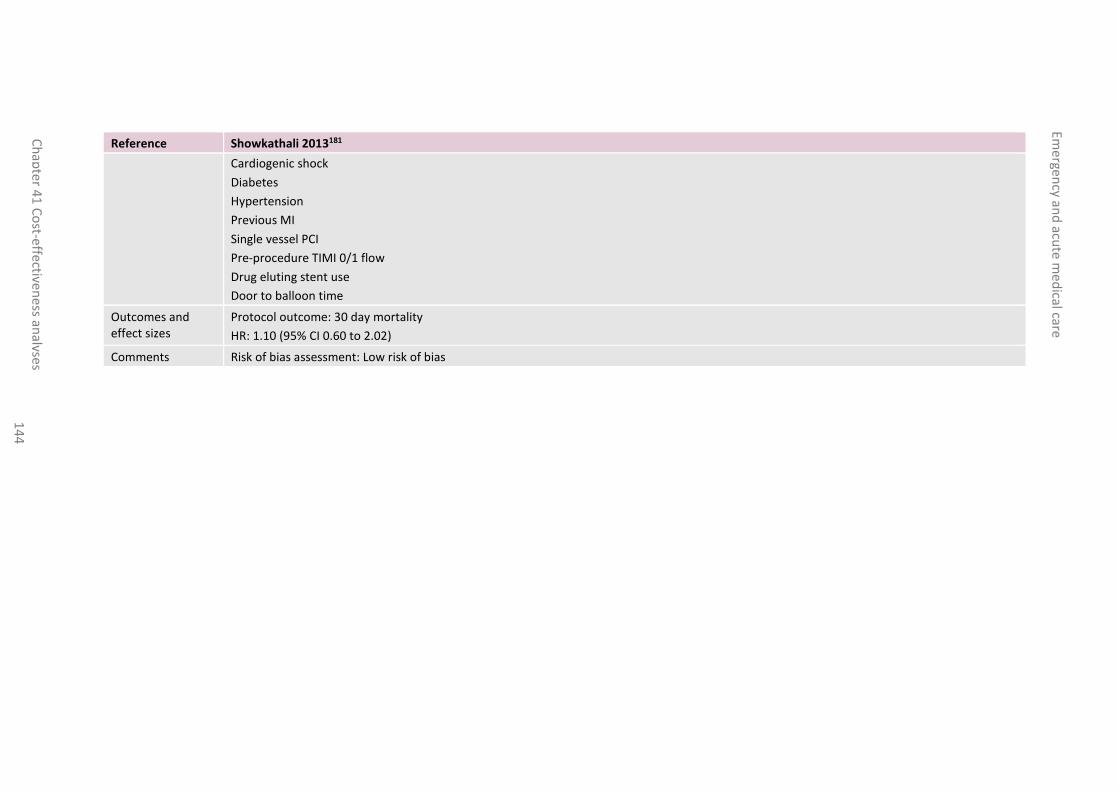
Emergen
cy and
acute m
edical care
Ch
apte
r 41
Co
st-effectiveness an
alyses 1
44
Reference Showkathali 2013181
Cardiogenic shock
Diabetes
Hypertension
Previous MI
Single vessel PCI
Pre-procedure TIMI 0/1 flow
Drug eluting stent use
Door to balloon time
Outcomes and effect sizes
Protocol outcome: 30 day mortality
HR: 1.10 (95% CI 0.60 to 2.02)
Comments Risk of bias assessment: Low risk of bias

Emergen
cy and
acute m
edical care
Ch
apte
r 41
Co
st-effectiveness an
alyses 1
45
C.9 GRADE tables
Table 47: Clinical evidence profile: Weekend admission
Quality assessment Effect
Quality
No of studies
Design Risk of bias Inconsistency Indirectness Imprecision Other considerations Pooled effect
(95% CI)
Hospital mortality (assessed with: No. of patients dying in hospital )
1 observational studies
no serious risk of bias no serious inconsistency
no serious indirectness
no serious imprecision
none Adjusted OR 1.10 (1.08 to 1.12)
HIGH
Hospital mortality (assessed with: No. of patients dying in hospital )
1 observational studies
no serious risk of bias no serious inconsistency
no serious indirectness
no serious imprecision
none Adjusted OR 1.10 (1.08 to 1.12)
HIGH
Hospital mortality (assessed with: No. of patients dying in hospital)
1 observational studies
no serious risk of bias no serious inconsistency
no serious indirectness
serious1 none Adjusted OR 1.15 (0.89 to 1.49)
MODERATE
Hospital mortality (follow-up 7 days; assessed with: No. of patients dying in hospital)
1 observational studies
serious2 no serious inconsistency
no serious indirectness
serious1 none Adjusted OR 1.75 (0.75 to 4.09)
LOW
Hospital mortality (assessed with: No. of patients dying in hospital )
1 observational studies
no serious risk of bias no serious inconsistency
no serious indirectness
no serious imprecision
none Adjusted HR 2.10 (1.13 to 3.9)
HIGH
Hospital mortality (assessed with: No. of patients dying in hospital)
2 observational studies
no serious risk of bias no serious inconsistency
no serious indirectness
no serious imprecision
none Adjusted HR 1.14 (1.12 to 1.15)
Range of HR: 1.11-1.16
HIGH

Emergen
cy and
acute m
edical care
Ch
apte
r 41
Co
st-effectiveness an
alyses 1
46
Hospital mortality (follow-up 30 days; assessed with: No. of patients dying in hospital)
1 observational studies
serious2 no serious inconsistency
serious3 serious1 none Adjusted OR 0.93 (0.75 to 1.15)
VERY LOW
Hospital mortality (assessed with: No. of patients dying in hospital)
1 observational studies
no serious risk of bias no serious inconsistency
no serious indirectness
no serious imprecision
none Adjusted OR 1.09 (1.05 to 1.13)
HIGH
Hospital mortality (assessed with: No. of patients dying in hospital)
1 observational studies
no serious risk of bias no serious inconsistency
no serious indirectness
serious1 none Adjusted RR 0.98 (0.91 to 1.06)
MODERATE
Hospital mortality (follow-up 7 days; assessed with: No. of patients dying in hospital)
1 observational studies
serious2 no serious inconsistency
no serious indirectness
no serious imprecision
none Adjusted OR 1.18 (1.12 to 1.24)
MODERATE
Hospital mortality (follow-up 30 days; assessed with: No. of patients dying in hospital)
1 observational studies
serious2 no serious inconsistency
no serious indirectness
no serious imprecision
none Adjusted OR 1.08 (1.05 to 1.1)
Range of HR: 1.07-1.08
MODERATE
Hospital mortality (follow-up 30 days; assessed with: No. of patients dying in hospital)
1 observational studies
serious2 no serious inconsistency
no serious indirectness
no serious imprecision
none Adjusted OR 1.02 (1.00 to 1.03)
Range of HR: 0.96-1.03
MODERATE
30 day survival (follow-up 30 days; assessed with: No. of patients surviving to 30 days post admission) (weekend 8am-7.59pm)
1 observational studies
no serious risk of bias no serious inconsistency
no serious indirectness
serious1 none Adjusted OR 1.03 (0.95 to 1.12)
MODERATE
30 day survival (follow-up 30 days; assessed with: No. of patients surviving to 30 days post admission) (weekend 8pm-7.59am)
1 observational studies
no serious risk of bias no serious inconsistency
no serious indirectness
serious1 none Adjusted OR 0.89 (0.78 to 1.02)
MODERATE

Emergen
cy and
acute m
edical care
Ch
apte
r 41
Co
st-effectiveness an
alyses 1
47
30 day mortality (follow-up 30 days; assessed with: No. of patients dying within 30 days of admission)
1 observational studies
no serious risk of bias no serious inconsistency
no serious indirectness
no serious imprecision
none Adjusted OR 1.14 (1.06 to 1.23)
HIGH
30 day mortality (follow-up 30 days; assessed with: No. of patients dying within 30 days of admission) (A&E admissions)
1 observational studies
no serious risk of bias no serious inconsistency
no serious indirectness
no serious imprecision
none Adjusted OR 1.05 (1.04 to 1.07)
HIGH
30 day mortality (follow-up 30 days; assessed with: No. of patients dying within 30 days of admission) (direct admissions)
1 observational studies
no serious risk of bias no serious inconsistency
no serious indirectness
no serious imprecision
none Adjusted OR 1.21 (1.16 to 1.26)
HIGH
30 day mortality (follow-up 30 days; assessed with: No. of patients dying within 30 days)
3 observational studies
no serious risk of bias serious4 no serious indirectness
no serious imprecision
none Adjusted HR 1.13 (1.1 to 1.15)
Range of HR: 0.96-1.15
MODERATE
Avoidable adverse events (assessed with: re-bleeding )
1 observational studies
no serious risk of bias no serious inconsistency
serious3 serious1 none Adjusted OR 0.91 (0.74 to 1.12)
LOW
Avoidable adverse events (assessed with: surgery/radiology)
1 observational studies
no serious risk of bias no serious inconsistency
serious3 serious1 none Adjusted OR 1.13 (0.81 to 1.58)
LOW
Avoidable adverse events (assessed with: red cell transfusion
1 observational studies
no serious risk of bias no serious inconsistency
serious3 serious1 none Adjusted OR 1.12 (0.94 to 1.33)
LOW
Avoidable adverse events (follow-up 24 hours; assessed with: inadequate response to NEWS)
1 observational studies
serious2 no serious inconsistency
no serious indirectness
no serious imprecision
prospective single centre study, unclear whether staff were aware of the study and outcome was appropriate
Adjusted OR 4.15 (2.24 to 7.69)
MODERATE

Emergen
cy and
acute m
edical care
Ch
apte
r 41
Co
st-effectiveness an
alyses 1
48
clinical response - potential for performance bias
Avoidable adverse events (assessed with: aspiration pneumonia)
1 observational studies
no serious risk of bias no serious inconsistency
no serious indirectness
no serious imprecision
none Adjusted OR 1.11 (1.04 to 1.18)
HIGH
Length of stay (follow-up 56 days; assessed with: discharge to usual place of residence within 56 days)
1 observational studies
no serious risk of bias no serious inconsistency
no serious indirectness
no serious imprecision
none Adjusted OR 0.92 (0.88 to 0.96)
HIGH
1 Downgraded by 1 increment if the confidence interval crossed the null line. 2 Downgraded by 1 increment if the majority of the evidence was at high risk of bias, and downgraded by 2 increments if the majority of the evidence was at very high risk of bias. 3 Downgraded by 1 increment if the majority of evidence included an indirect population or 2 increments if the majority of the evidence included a very indirect population. 4 Downgraded by 1 or 2 increments because heterogeneity, I2=50%, p=0.04, unexplained by subgroup analysis.
Table 48: Clinical evidence profile: Out of hours admission
Quality assessment Effect
Quality
No of studies
Design Risk of bias Inconsistency Indirectness Imprecision Other considerations Pooled effect
(95% CI)
Hospital mortality (assessed with: no. of patients dying in hospital)
1 observational studies
no serious risk of bias no serious inconsistency
serious1 serious2 none OR 1.33 (0.73 to 2.42) LOW
1 observational studies
no serious risk of bias no serious inconsistency
no serious indirectness
no serious imprecision
none OR 1.07 (1.00 to 1.14) HIGH
30 day mortality (follow-up 30 days; assessed with: no. of patients dying within 30 days)
1 observational studies
no serious risk of bias no serious inconsistency
serious1 serious2 none HR 1.03 (0.89 to 1.19) LOW
30 day mortality (follow-up 30 days; assessed with: no. of patients dying within 30 days)
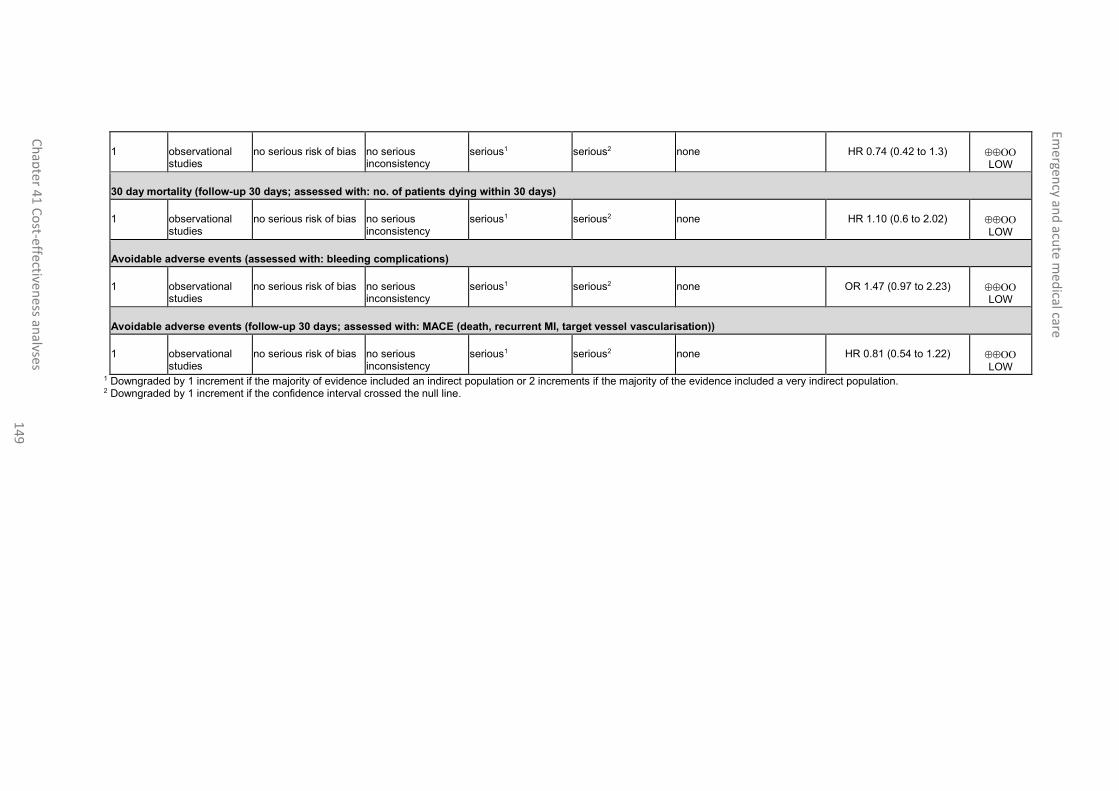
Emergen
cy and
acute m
edical care
Ch
apte
r 41
Co
st-effectiveness an
alyses 1
49
1 observational studies
no serious risk of bias no serious inconsistency
serious1 serious2 none HR 0.74 (0.42 to 1.3) LOW
30 day mortality (follow-up 30 days; assessed with: no. of patients dying within 30 days)
1 observational studies
no serious risk of bias no serious inconsistency
serious1 serious2 none HR 1.10 (0.6 to 2.02) LOW
Avoidable adverse events (assessed with: bleeding complications)
1 observational studies
no serious risk of bias no serious inconsistency
serious1 serious2 none OR 1.47 (0.97 to 2.23) LOW
Avoidable adverse events (follow-up 30 days; assessed with: MACE (death, recurrent MI, target vessel vascularisation))
1 observational studies
no serious risk of bias no serious inconsistency
serious1 serious2 none HR 0.81 (0.54 to 1.22) LOW
1 Downgraded by 1 increment if the majority of evidence included an indirect population or 2 increments if the majority of the evidence included a very indirect population. 2 Downgraded by 1 increment if the confidence interval crossed the null line.

Emergency and acute medical care
Chapter 41 Cost-effectiveness analyses 150
C.10 Excluded studies
Table 49: Studies excluded from the clinical review
Reference Reason for exclusion
Arabi 200610 Outside of England
Barer 201617 No adjustment for age
Barnett 200818 Inappropriate exposure (odds of being discharged alive by day of the week)
Becker 200821 Report; no outcomes
Beecher 201522 Outside of England
Cavallazzi 201035 Systematic review (not relevant or unclear PICO)
Clark 200739 Outside of England
Clark 201238 Outside of England
Conway 201644 Outside England (Ireland)
Conway 2016A43 Outside England (Ireland)
Cubeddu 200948 Outside of England
De Cordova 201252 Systematic review (not relevant or unclear PICO)
Degenhardt 201153 Report; no outcomes
Geraci 200564 Outside of England
Goldacre 201365 No adjustment for severity of illness
Gordon 200568 Outside of England
Gralnek 201469 Editorial (US study)
Haas 201274 Outside of England
Hamilton 201075 Outside of England; inappropriate study design (nurse survey)
Hoehn 201679 Outside England (USA)
Hohloch 201480 Outside of England
Horwich 200983 Outside of England
Hsu 201584 Outside of England
Jansen 201390 Outside of England
Jauss 200991 Outside of England
Jiang 201192 Outside of England
Karthikesalingam 201496 Incorrect population (ruptured abdominal aortic aneurysm patients)
Keatinge 200597 Study does not adjust for any confounders
Kruth 2008101 Outside of England
Lecumberri 2011104 Outside of England
Leong 2015105 Observational intervention study (before and after 7-day services); no adjustment for key confounders
Lorenzano 2014110 Outside of England (multinational analysis)
Magid 2005112 Outside of England
Maggs 2010111 No adjustment for severity of illness
McCallum 2016115 Not review population (emergency surgical patients)
McLean 2016117 Not review population (emergency surgical patients)

Emergency and acute medical care
Chapter 41 Cost-effectiveness analyses 151
Reference Reason for exclusion
Meacock 2015119 Inappropriate study design (uses ORs reported by Freemantle to calculate potential QALYs gained with a 7-day service); no relevant outcomes
Mohammed 2016A123 Only risk-risk cases included; no adjustment for key confounders
Morton 2015125 No relevant outcomes
Mpotsaris 2015126 Outside of England
Murphy 2015127 Commentary
Nakajima 2015129 Outside of England
Neuraz 2015136 Outside of England
Ortolani 2007144 Outside of England
Ozdemir 2015145 No protocol outcomes reported (90 day mortality)
Ozdemir 2016146 Not review population (emergency surgical patients)
Park 2013148 Outside of England
Patel 2014A150 Observational intervention study (before and after a handover intervention); analysis of weekend in-hospital mortality; no adjustment for key confounders
Peberdy 2008152 Outside of England
Qureshi 2012158 Outside of England
Raghavan 2014159 Inappropriate study design (before and after; intervention was introduction of seven-day consultant working)
Rudd 2007167 No relevant outcomes
Sato 2015174 Outside of England (multinational analysis)
Shokouhi 2013180 No comparator (evaluation of a weekend service)
Sorita 2014184 Systematic review (not relevant or unclear PICO)
Sorita 2014A183 Outside of England
Southey 2014185 Inappropriate study design (before and after; intervention was nurse weekend cover)
Soyiri 2011186 Inappropriate comparison (Sunday used as the reference day)
Triggle 2014191 Article; no outcomes reported
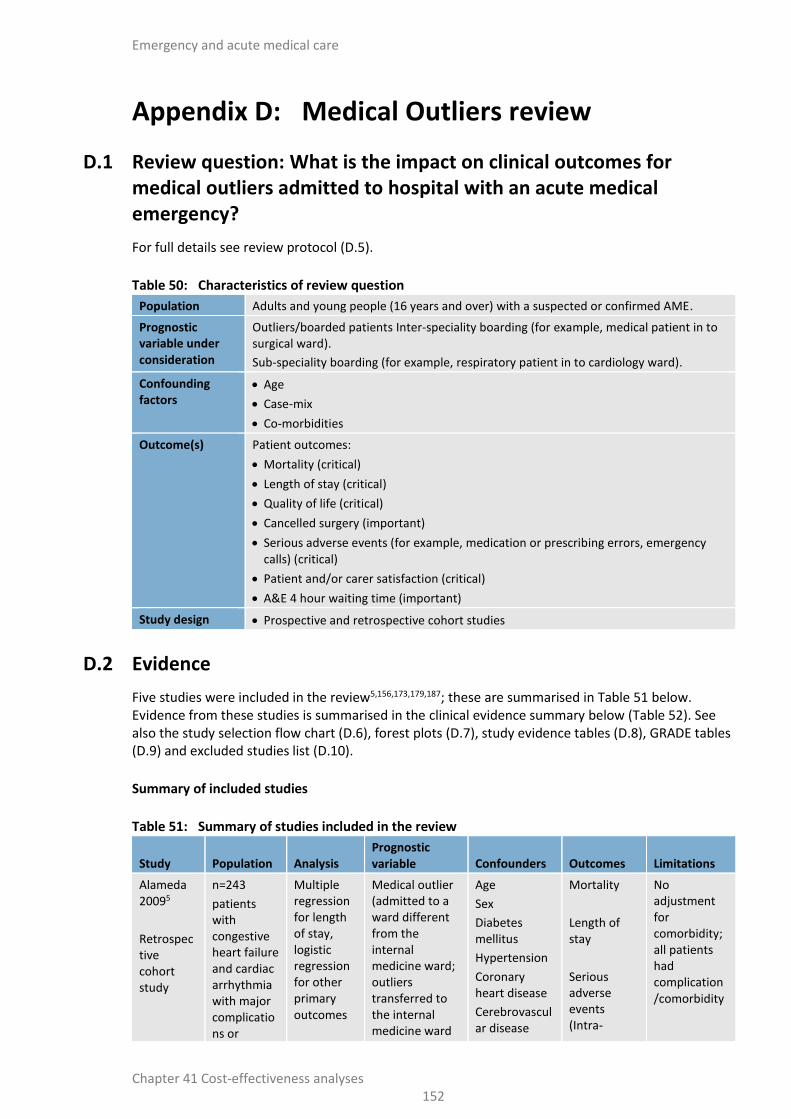
Emergency and acute medical care
Chapter 41 Cost-effectiveness analyses 152
Appendix D: Medical Outliers review
D.1 Review question: What is the impact on clinical outcomes for medical outliers admitted to hospital with an acute medical emergency?
For full details see review protocol (D.5).
Table 50: Characteristics of review question
Population Adults and young people (16 years and over) with a suspected or confirmed AME.
Prognostic variable under consideration
Outliers/boarded patients Inter-speciality boarding (for example, medical patient in to surgical ward).
Sub-speciality boarding (for example, respiratory patient in to cardiology ward).
Confounding factors
Age
Case-mix
Co-morbidities
Outcome(s) Patient outcomes:
Mortality (critical)
Length of stay (critical)
Quality of life (critical)
Cancelled surgery (important)
Serious adverse events (for example, medication or prescribing errors, emergency calls) (critical)
Patient and/or carer satisfaction (critical)
A&E 4 hour waiting time (important)
Study design Prospective and retrospective cohort studies
D.2 Evidence
Five studies were included in the review5,156,173,179,187; these are summarised in Table 51 below. Evidence from these studies is summarised in the clinical evidence summary below (Table 52). See also the study selection flow chart (D.6), forest plots (D.7), study evidence tables (D.8), GRADE tables (D.9) and excluded studies list (D.10).
Summary of included studies
Table 51: Summary of studies included in the review
Study Population Analysis Prognostic variable Confounders Outcomes Limitations
Alameda 20095
Retrospective cohort study
n=243
patients with congestive heart failure and cardiac arrhythmia with major complications or
Multiple regression for length of stay, logistic regression for other primary outcomes
Medical outlier (admitted to a ward different from the internal medicine ward; outliers transferred to the internal medicine ward
Age
Sex
Diabetes mellitus
Hypertension
Coronary heart disease
Cerebrovascular disease
Mortality
Length of stay
Serious adverse events (Intra-
No adjustment for comorbidity; all patients had complication/comorbidity

Emergency and acute medical care
Chapter 41 Cost-effectiveness analyses 153
Study Population Analysis Prognostic variable Confounders Outcomes Limitations
comorbidity discharged from the Department of Internal Medicine, 1 hospital, Spain
were included)
Versus.
No medical outlier (admitted to the internal medicine ward)
Chronic obstructive pulmonary disease
Cancer
Cognitive impairment before admission
Serum creatinine
Haemoglobin
PaO2
Serum albumin at admission
Nursing home resident
Previous hospital stay within 12 months
Weekend/bank holiday admission
hospital morbidity - infection, haemorrhage)
Perimal-Lewis 2013156
Retrospective cohort study
n=19,923 patients admitted and discharged by the general medicine service (university hospital, Australia)
Poisson regression
Outlier (not treated within a ‘home ward’ for the general medical unit allocated to care for the patient)
Versus.
Inliers (treated within a ‘home ward’ for the general medical unit allocated to care for the patient; patients under the care of GM but housed in the intensive care, high dependency or coronary care units were included as inliers)
Age
Charlson index
Gender
Length of time spent waiting for a bed in ED
Mortality (hospital mortality)
Length of stay (statistic not reported)
No adjustment for case mix
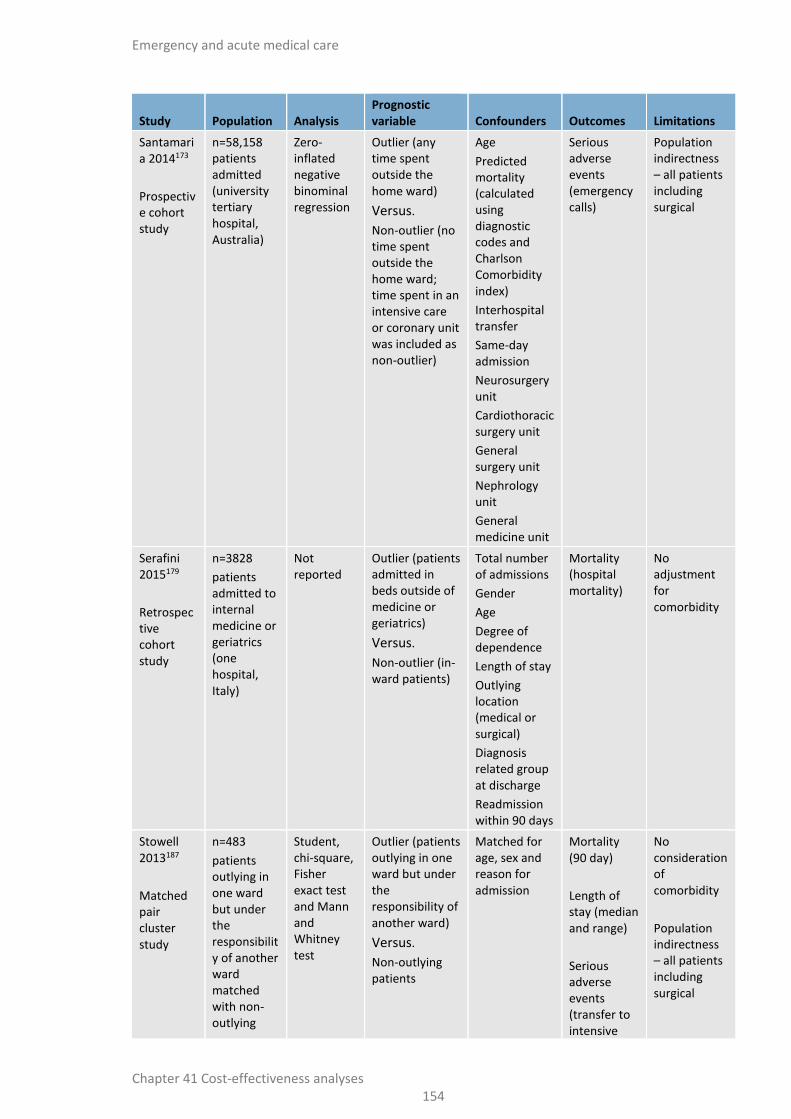
Emergency and acute medical care
Chapter 41 Cost-effectiveness analyses 154
Study Population Analysis Prognostic variable Confounders Outcomes Limitations
Santamaria 2014173
Prospective cohort study
n=58,158 patients admitted (university tertiary hospital, Australia)
Zero-inflated negative binominal regression
Outlier (any time spent outside the home ward)
Versus.
Non-outlier (no time spent outside the home ward; time spent in an intensive care or coronary unit was included as non-outlier)
Age
Predicted mortality (calculated using diagnostic codes and Charlson Comorbidity index)
Interhospital transfer
Same-day admission
Neurosurgery unit
Cardiothoracic surgery unit
General surgery unit
Nephrology unit
General medicine unit
Serious adverse events (emergency calls)
Population indirectness – all patients including surgical
Serafini 2015179
Retrospective cohort study
n=3828
patients admitted to internal medicine or geriatrics (one hospital, Italy)
Not reported
Outlier (patients admitted in beds outside of medicine or geriatrics)
Versus.
Non-outlier (in-ward patients)
Total number of admissions
Gender
Age
Degree of dependence
Length of stay
Outlying location (medical or surgical)
Diagnosis related group at discharge
Readmission within 90 days
Mortality (hospital mortality)
No adjustment for comorbidity
Stowell 2013187
Matched pair cluster study
n=483
patients outlying in one ward but under the responsibility of another ward matched with non-outlying
Student, chi-square, Fisher exact test and Mann and Whitney test
Outlier (patients outlying in one ward but under the responsibility of another ward)
Versus.
Non-outlying patients
Matched for age, sex and reason for admission
Mortality (90 day)
Length of stay (median and range)
Serious adverse events (transfer to intensive
No consideration of comorbidity
Population indirectness – all patients including surgical

Emergency and acute medical care
Chapter 41 Cost-effectiveness analyses 155
Study Population Analysis Prognostic variable Confounders Outcomes Limitations
patients consecutively included among all patients hospitalised during the study period
care)
ED 4 hour transit time (median and range)

Emergen
cy and
acute m
edical care
Ch
apte
r 41
Co
st-effectiveness an
alyses 1
56
Table 52: Clinical evidence summary: medical outliers (adjusted for all key confounders)
Risk factor and outcome
(population) Number of studies Effect (95% CI) Imprecision GRADE Quality
Outlier versus non-outlier for predicting serious adverse events (emergency calls)
(all admitted patients)a
1 Adjusted RR: 1.53 (1.31 to 1.77)
No serious imprecision
MODERATE
(a) Methods: multivariable analysis, including key covariates used in analysis to assess if outlier status is an independent risk factor. Key covariates included: age, case-mix, co-morbidities.
Table 53: Clinical evidence summary: medical outliers
Risk factor and outcome
(population) Number of studies
Effect (95% CI) Imprecision GRADE Quality
Outlier versus non-outlier for predicting mortality (hospital mortality)
(congestive heart failure and cardiac arrhythmia patients)a
1 Adjusted RR: 0.80 (0.40 to 1.60) Seriousb LOW
Outlier versus non-outlier for predicting mortality (hospital mortality)
(general medical patients)a
1 Adjusted RR: 1.41 (1.16 to 1.71) No serious imprecision
MODERATE
Outlier versus non-outlier for predicting mortality (hospital mortality)
(medical and geriatric patients)a
1 Adjusted HR: 1.8 (1.28 to 2.53) No serious imprecision
MODERATE
Outlier versus non-outlier for predicting mortality (90 day mortality)
(all admitted patients)a
1 RR: 0.75 (0.51 to 1.11) Seriousb VERY LOW
Outlier versus non-outlier for predicting length of stay (days)
(congestive heart failure and cardiac arrhythmia patients)a
1 Adjusted mean difference: 2.60 (0.60 to 4.60)
No serious imprecision
MODERATE
Outlier versus non-outlier for predicting serious adverse events (infection)
(congestive heart failure and cardiac arrhythmia patients)a
1 Adjusted RR: 1.50 (0.80 to 2.81) Seriousb LOW
Outlier versus non-outlier for predicting serious adverse events (haemorrhage)
(congestive heart failure and cardiac arrhythmia patients)a
1 Adjusted RR: 1.20 (0.40 to 3.60) Seriousb LOW
Outlier versus non-outlier for predicting serious adverse events (transfer to ICU)
(all admitted patients)a
1 RR: 1.05 (0.5 to 2.18) Seriousb VERY LOW
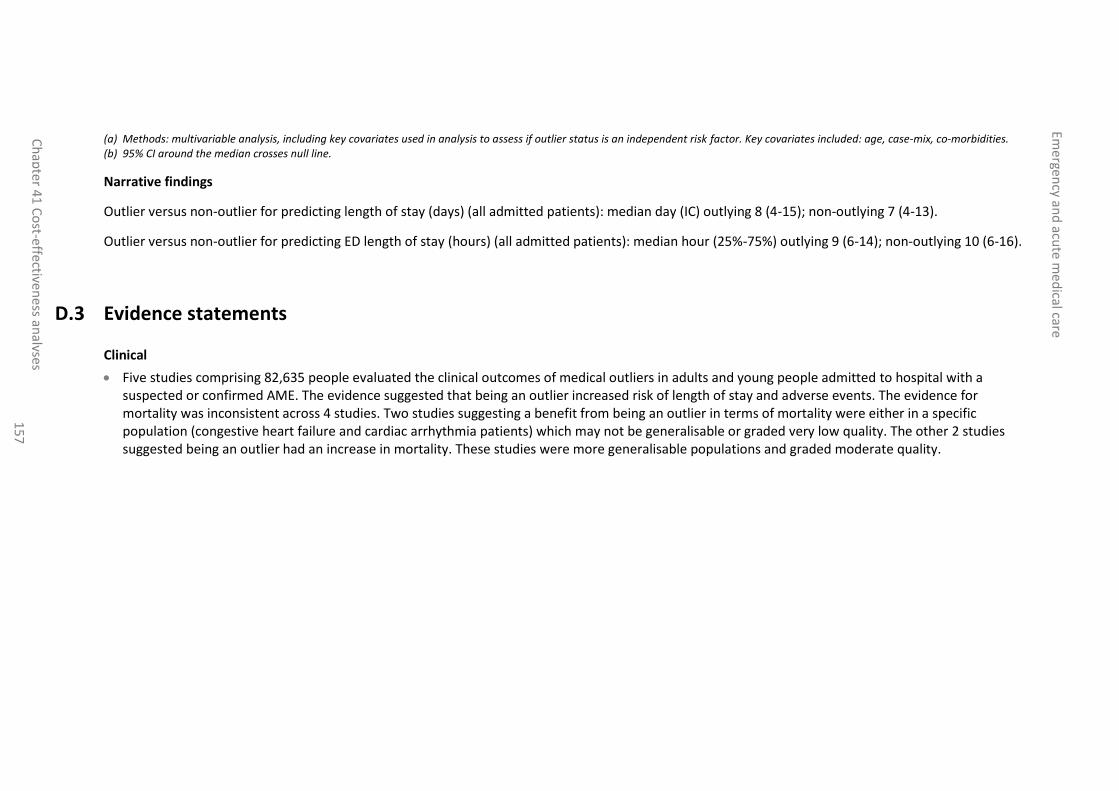
Emergen
cy and
acute m
edical care
Ch
apte
r 41
Co
st-effectiveness an
alyses 1
57
(a) Methods: multivariable analysis, including key covariates used in analysis to assess if outlier status is an independent risk factor. Key covariates included: age, case-mix, co-morbidities. (b) 95% CI around the median crosses null line.
Narrative findings
Outlier versus non-outlier for predicting length of stay (days) (all admitted patients): median day (IC) outlying 8 (4-15); non-outlying 7 (4-13).
Outlier versus non-outlier for predicting ED length of stay (hours) (all admitted patients): median hour (25%-75%) outlying 9 (6-14); non-outlying 10 (6-16).
D.3 Evidence statements
Clinical
Five studies comprising 82,635 people evaluated the clinical outcomes of medical outliers in adults and young people admitted to hospital with a suspected or confirmed AME. The evidence suggested that being an outlier increased risk of length of stay and adverse events. The evidence for mortality was inconsistent across 4 studies. Two studies suggesting a benefit from being an outlier in terms of mortality were either in a specific population (congestive heart failure and cardiac arrhythmia patients) which may not be generalisable or graded very low quality. The other 2 studies suggested being an outlier had an increase in mortality. These studies were more generalisable populations and graded moderate quality.

Emergency and acute medical care
Chapter 41 Cost-effectiveness analyses 158
D.4 Subgroup comments
Question Comments
Which outcomes are affected by weekend admission?
Mortality.
Severe adverse events (emergency calls to medical team only).
Length of stay.
Which studies best show the effect and could inform the model?
Mortality
Alameda 2009 is in a very specific population (congestive heart failure and cardiac arrhythmia patients), which may not be generalisable to other patient groups and also is of low quality and should therefore not be used.
Evidence from Stowell 2013 is of very low quality. This study compared control cases with outlying patients using a matched pair design based on age, sex and reason for admission. However, it is likely that patients who are less severely ill are admitted to outlying wards and are therefore less likely to die, so the study may have underestimated the effect of outlying status on mortality.
Perimal-Lewis 2013 and Serafini 2015 were the best quality studies (moderate) and were in a more generalisable population. The effect sizes seem realistic and had no serious imprecision. These studies should be used to inform the economic model.
These studies showed a modest but expected increase in mortality for medical outliers. This could be an underestimate though due to the nature of the observational studies where the more acutely ill patients are less likely to be medical outliers.
Severe adverse events
Santamaria 2014 was the only study to adjust for all 3 confounders and was moderate quality and no serious imprecision around the point estimate. Serious adverse events were defined as call outs for the emergency medical team. It is likely that medical emergency teams are variable in staff makeup both nationally and internationally. Therefore the evidence may not be generalisable to the UK.
Evidence from Stowell 2013 is of very low quality. This study compared control cases with outlying patients using a matched pair design based on age, sex and reason for admission. However, it is likely that patients who are less severely ill are admitted to outlying wards and are therefore less likely to require transfer to the ICU, so the study (which showed no effect of outlier status) may have underestimated the effect of outlying status on serious adverse events defined as transfer to ICU. Alameda 2009 is in a very specific population (congestive heart failure and cardiac arrhythmia patients), which may not be generalisable to other patient groups and also is of low quality with serious imprecision around the point estimate and should therefore not be used.
The subgroup considered that overall, there appears to be an increase in serious adverse event rate in outlying patients.
Length of stay
Alameda 2009 is in a very specific population (congestive heart failure and cardiac arrhythmia patients), which may not be generalisable to other patient groups. However, the study was the only one to report mean differences in length of stay and provided moderate quality evidence. The evidence suggested that outlying patients have a longer length of stay, which the subgroup felt fitted with clinical experience. However, the results of this study may not generalisable to the entire AME population, as these patients may require specialised tests prior to discharge, which are more difficult to arrange from an outlying ward.
The subgroup expected an increase in length of stay for medical outliers as these

Emergency and acute medical care
Chapter 41 Cost-effectiveness analyses 159
Question Comments patients are seen less and it will take longer for them to be discharged, however this increase is difficult to quantify from the evidence.
Other considerations The analysis is likely to underestimate the true financial cost of outlying.
Cancelled elective surgeries are likely to occur if a medical patient is outlying on a surgical ward.
There will be additional time constraints on ward rounds for an outlying patient. Staff will need to cover more patients in their ward rounds with outlying patients having a greater effect on this. It is more time consuming to undertake a ward round on a different ward to your own and is not just an additional patients worth of time.
It is likely an outlying patient will be seen at the end of a ward round which may cause problems. The timing of the ward round may not fit in with routine and could occur at detrimental times to efficiency for example, at a nurse handover time slot
Geographical constraints of being on a different ward could mean that discharge time is affected for example, a patient may not be assessed to be ready for discharge until late in the day due to staffing locations which could lead to an extra overnight stay
Boarding patients is seldom a deliberate process. The existence of medical outliers is an indicator of high occupancy that could lead to detrimental effects on patients and flow due to prioritisation of tasks, especially for outlying patients.
Opportunity cost of emergency medical team – impact on hospital staffing and other patients who need their help.
Medical outliers may start on the correct ward and then move out to their ‘outlying’ ward rather than the perceived traditional assumption that outlying is at the start of a patients stay.
At what point in their pathway a patient becomes an outlier may affect their outcomes for example, if they are moved from their ‘home’ ward to a ward where they are defined as an outlier rather than admission straight to an outlying ward, they may have a lower acuity.
Transferring elderly patients to different wards can cause them to become confused, especially if they experience multiple moves. This can make their condition worse and lead to a longer length of stay, creating a vicious cycle.
The committee agreed that outlying is inevitable in most hospitals and is associated with worse patient outcomes. The cost of preventing medical outliers would be great, therefore practical steps should be taken to mitigate the risks and ensure that care for outlying patients is not compromised. For example, accepting temporal changes in occupancy parameters and making appropriate allowances.
Patients perspective:
For patients, being on a ward that doesn’t specialise in their condition is associated with feelings of anxiety and fear that they will not receive the best treatment or that they are being forgotten by the appropriate specialists. In some circumstances, patients can feel embarrassed if they have a different condition from other patients on the ward as the other patients may not understand their symptoms. It may also be emotionally insensitive to board certain patients in certain wards. Patients would like there to be recommendations in place to aid outlying patient care.

Emergency and acute medical care
Chapter 41 Cost-effectiveness analyses 160
D.5 Review protocol
Table 54: Review protocol: medical outliers
Component Description
Review question What is the impact on clinical outcomes for medical outliers admitted to hospital with an acute medical emergency?
Objectives To estimate the prognostic value of medical outlier status on clinical outcomes.
Population Adults and young people (16 years and over) with a suspected or confirmed AME
Presence or absence of prognostic variable
Outliers/boarded patients; Inter-speciality boarding (for example, medical patient in to surgical ward); Sub-speciality boarding (for example, respiratory patient in to cardiology ward).
Versus
Non-outliers/non-boarded patients: patients treated within their speciality (that is, no boarding present).
Outcome(s) Patient outcomes:
Mortality (critical)
Length of stay (critical)
Quality of life (critical)
Cancelled surgery (important)
Serious adverse events (e.g. medication or prescribing errors, emergency calls) (critical)
Patient and/or carer satisfaction (critical)
A&E 4 hour waiting time (important)
Study design Prospective and retrospective cohort studies
Exclusions Non OECD countries
How the information will be searched
The databases to be searched are: Medline, Embase, the Cochrane Library
Language: English
Dates: 1990
Key confounders Minimum set of confounders that should be adjusted for (will vary per outcome)
Age
Case-mix
Co-morbidities
The review strategy
Meta-analysis where appropriate will be conducted.
Studies in the following subgroup populations will be included in subgroup analysis:
Frail elderly
Type of boarding – inter-speciality boarding and sub-speciality boarding
UK versus non-UK studies

Emergency and acute medical care
Chapter 41 Cost-effectiveness analyses 161
D.6 Study selection
Figure 41: Flow chart of clinical study selection for the review of medical outliers
Records screened, n=759
Records excluded, n=716
Papers included in review, n=5
Papers excluded from review, n=38 Reasons for exclusion: see A.9.
Records identified through database searching, n=758
Additional records identified through other sources, n=1
Full-text papers assessed for eligibility, n=43

Emergency and acute medical care
Chapter 41 Cost-effectiveness analyses 162
D.7 Forest plots
D.7.1 Outlier versus non-outlier (adjusted for all key confounders)
Figure 42: Serious adverse events (emergency calls)
D.7.2 Outlier versus non-outlier
Figure 43: Mortality (hospital mortality)
Figure 44: Mortality (hospital mortality)
Figure 45: Mortality (hospital mortality)
Figure 46: Mortality (90 day)
Study or Subgroup
Santamaria 2014
Total (95% CI)
Heterogeneity: Not applicable
Test for overall effect: Z = 5.70 (P < 0.00001)
log[Risk Ratio]
0.4253
SE
0.0746
Weight
100.0%
100.0%
IV, Fixed, 95% CI
1.53 [1.32, 1.77]
1.53 [1.32, 1.77]
Risk Ratio Risk Ratio
IV, Fixed, 95% CI
0.1 0.2 0.5 1 2 5 10Favours outlier Favours non-outlier
Study or Subgroup
Alameda 2009
Total (95% CI)
Heterogeneity: Not applicable
Test for overall effect: Z = 0.63 (P = 0.53)
log[Risk Ratio]
-0.2231
SE
0.3537
Weight
100.0%
100.0%
IV, Fixed, 95% CI
0.80 [0.40, 1.60]
0.80 [0.40, 1.60]
Risk Ratio Risk Ratio
IV, Fixed, 95% CI
0.1 0.2 0.5 1 2 5 10Favours outlier Favours non-outlier
Study or Subgroup
Perimal-Lewis 2013
Total (95% CI)
Heterogeneity: Not applicable
Test for overall effect: Z = 3.45 (P = 0.0006)
log[Risk Ratio]
0.3436
SE
0.0996
Weight
100.0%
100.0%
IV, Fixed, 95% CI
1.41 [1.16, 1.71]
1.41 [1.16, 1.71]
Risk Ratio Risk Ratio
IV, Fixed, 95% CI
0.1 0.2 0.5 1 2 5 10Favours outlier Favours non-outlier
Study or Subgroup
Serafini 2015
Total (95% CI)
Heterogeneity: Not applicable
Test for overall effect: Z = 3.38 (P = 0.0007)
log[Hazard Ratio]
0.5878
SE
0.1739
Weight
100.0%
100.0%
IV, Fixed, 95% CI
1.80 [1.28, 2.53]
1.80 [1.28, 2.53]
Hazard Ratio Hazard Ratio
IV, Fixed, 95% CI
0.1 0.2 0.5 1 2 5 10Favours outlier Favours non-outlier
Study or Subgroup
Stowell 2013
Total (95% CI)
Total events
Heterogeneity: Not applicable
Test for overall effect: Z = 1.44 (P = 0.15)
Events
38
38
Total
245
245
Events
49
49
Total
238
238
Weight
100.0%
100.0%
M-H, Fixed, 95% CI
0.75 [0.51, 1.11]
0.75 [0.51, 1.11]
Outlier Non-outlier Risk Ratio Risk Ratio
M-H, Fixed, 95% CI
0.1 0.2 0.5 1 2 5 10Favours outlier Favours non-outlier

Emergency and acute medical care
Chapter 41 Cost-effectiveness analyses 163
Figure 47: Length of stay
Figure 48: Serious adverse events (infection)
Figure 49: Serious adverse events (haemorrhage)
Figure 50: Serious adverse events (transfer to ICU)
Study or Subgroup
Alameda 2009
Total (95% CI)
Heterogeneity: Not applicable
Test for overall effect: Z = 2.55 (P = 0.01)
Mean Difference
2.6
SE
1.0204
Weight
100.0%
100.0%
IV, Fixed, 95% CI
2.60 [0.60, 4.60]
2.60 [0.60, 4.60]
Mean Difference Mean Difference
IV, Fixed, 95% CI
-10 -5 0 5 10Favours outlier Favours non-outlier
Study or Subgroup
Alameda 2009
Total (95% CI)
Heterogeneity: Not applicable
Test for overall effect: Z = 1.26 (P = 0.21)
log[Risk Ratio]
0.4055
SE
0.3207
Weight
100.0%
100.0%
IV, Fixed, 95% CI
1.50 [0.80, 2.81]
1.50 [0.80, 2.81]
Risk Ratio Risk Ratio
IV, Fixed, 95% CI
0.1 0.2 0.5 1 2 5 10Favours outlier Favours non-outlier
Study or Subgroup
Alameda 2009
Total (95% CI)
Heterogeneity: Not applicable
Test for overall effect: Z = 0.33 (P = 0.74)
log[Risk Ratio]
0.1823
SE
0.5605
Weight
100.0%
100.0%
IV, Fixed, 95% CI
1.20 [0.40, 3.60]
1.20 [0.40, 3.60]
Risk Ratio Risk Ratio
IV, Fixed, 95% CI
0.1 0.2 0.5 1 2 5 10Favours outlier Favours non-outlier
Study or Subgroup
Stowell 2013
Total (95% CI)
Total events
Heterogeneity: Not applicable
Test for overall effect: Z = 0.12 (P = 0.90)
Events
14
14
Total
245
245
Events
13
13
Total
238
238
Weight
100.0%
100.0%
M-H, Fixed, 95% CI
1.05 [0.50, 2.18]
1.05 [0.50, 2.18]
Outlier Non-outlier Risk Ratio Risk Ratio
M-H, Fixed, 95% CI
0.1 0.2 0.5 1 2 5 10Favours outlier Favours non-outlier

Emergen
cy and
acute m
edical care
Ch
apte
r 41
Co
st-effectiveness an
alyses 1
64
D.8 Evidence tables
Reference Alameda5
Study type and analysis
Retrospective cohort study. Multiple regression for length of stay; logistic regression for mortality and serious adverse events.
Number of participants
and characteristics
n=243
Outliers n=109
Non outliers n=134
Inclusion criteria: patients discharged from the Department of Internal Medicine with the All Patients Diagnosis-Related Group 544 (congestive heart failure and cardiac arrhythmia with major complications or comorbidity).
Exclusion criteria: patients admitted to departments other than Internal Medicine or the Intensive Care Unit.
Data from the minimum basic data set, discharge summaries and test records from La Princesa University Hospital, Madrid, Spain, 2006.
Prognostic variable Medical outlier (admitted to a ward different from the internal medicine ward; outliers transferred to the internal medicine ward were included)
Versus.
No medical outlier (admitted to the internal medicine ward)
Confounders Age, sex, diabetes mellitus, hypertension, coronary heart disease, cerebrovascular disease, chronic obstructive pulmonary disease, cancer, cognitive impairment before admission, serum creatinine, haemoglobin, PaO2, serum albumin at admission, nursing home resident, previous hospital stay within 12 months, weekend/bank holiday admission.
Outcomes and effect sizes
Mortality: RR 0.8 (95% CI 0.4 to 1.6)
Length of stay: Mean difference 2.6 days higher (95% CI 0.6 to 4.6)
Serious adverse events (infection): RR 1.5 (95% CI 0.8 to 2.81)
Serious adverse events (haemorrhage): RR 1.2 (95% CI 0.4 to 3.6)
Comments Risk of bias: High (no adjustment for comorbidity)
Reference Perimal-Lewis 2013156
Study type and analysis
Retrospective cohort study. Poisson regression.
Number of n= 19,923

Emergen
cy and
acute m
edical care
Ch
apte
r 41
Co
st-effectiveness an
alyses 1
65
Reference Perimal-Lewis 2013156
participants
and characteristics
Outliers n=2,592
Non outliers n=15, 213
Inclusion criteria: patients admitted and discharged by the general medicine service
Exclusion criteria: patients discharged from the ED, patients staying in hospital over 30 days
Data extracted from Flinders Medical Centre patient journey database (1 Jan 2003 to 20 September 2009)
Prognostic variable Outlier (not treated within a ‘home ward’ for the general medical unit allocated to care for the patient)
Versus.
Inliers (treated within a ‘home ward’ for the general medical unit allocated to care for the patient; patients under the care of GM but housed in the intensive care, high dependency or coronary care units were included as inliers)
Confounders Age, charlson index, gender, length of time spent waiting for a bed in ED
Outcomes and effect sizes
Mortality: RR 1.41 (95% CI 1.16 to 1.71)
Length of stay: 0.77 (95% CI 0.74 to 0.80)
Comments Risk of bias: High (no adjustment for case mix)
Reference Santamaria 2014173
Study type and analysis
Prospective cohort study. Zero-inflated negative binominal regression.
Number of participants
and characteristics
n= 58,158
Outliers n= 11,034
Non outliers n= 47,124
Inclusion criteria: all admitted patients
Exclusion criteria: patients admitted for outpatient testing, mental health care, rehabilitation or palliative care
Consecutive patients admitted to St Vincent’s Hospital, Melbourne between 1 July 2009 and 30 November 2011
Prognostic variable Outlier (any time spent outside the home ward)
Versus.
Non-outlier (no time spent outside the home ward; time spent in an intensive care or coronary unit was included as non-outlier)
Confounders Age, predicted mortality (calculated using diagnostic codes and Charlson Comorbidity index), interhospital transfer, same-day admission, neurosurgery unit, cardiothoracic surgery unit, general surgery unit, nephrology unit, general medicine unit
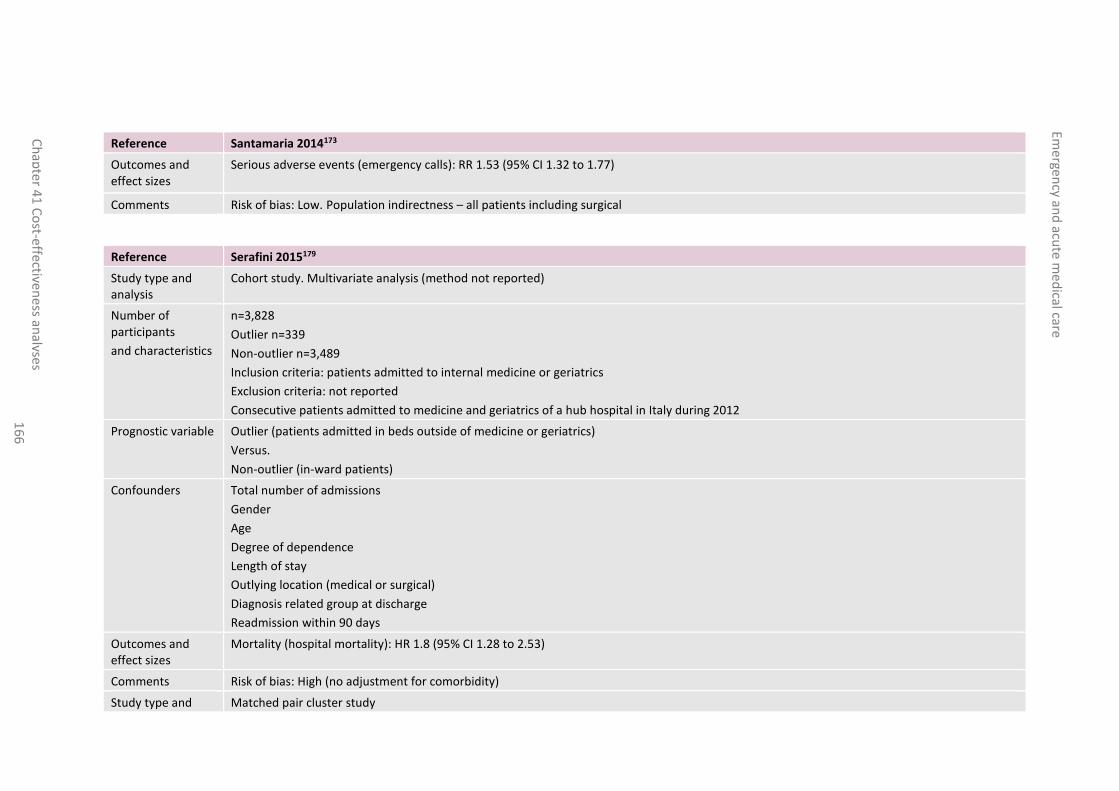
Emergen
cy and
acute m
edical care
Ch
apte
r 41
Co
st-effectiveness an
alyses 1
66
Reference Santamaria 2014173
Outcomes and effect sizes
Serious adverse events (emergency calls): RR 1.53 (95% CI 1.32 to 1.77)
Comments Risk of bias: Low. Population indirectness – all patients including surgical
Reference Serafini 2015179
Study type and analysis
Cohort study. Multivariate analysis (method not reported)
Number of participants
and characteristics
n=3,828
Outlier n=339
Non-outlier n=3,489
Inclusion criteria: patients admitted to internal medicine or geriatrics
Exclusion criteria: not reported
Consecutive patients admitted to medicine and geriatrics of a hub hospital in Italy during 2012
Prognostic variable Outlier (patients admitted in beds outside of medicine or geriatrics)
Versus.
Non-outlier (in-ward patients)
Confounders Total number of admissions
Gender
Age
Degree of dependence
Length of stay
Outlying location (medical or surgical)
Diagnosis related group at discharge
Readmission within 90 days
Outcomes and effect sizes
Mortality (hospital mortality): HR 1.8 (95% CI 1.28 to 2.53)
Comments Risk of bias: High (no adjustment for comorbidity)
Study type and Matched pair cluster study

Emergen
cy and
acute m
edical care
Ch
apte
r 41
Co
st-effectiveness an
alyses 1
67
Reference Serafini 2015179
analysis
Number of participants
and characteristics
n=483
Outlier n=245
Non-outlier n=238
Inclusion criteria: any patient outlying in one ward but under the responsibility of another ward
Exclusion criteria: refusal to take part, persons under judicial protection or guardianship, persons under 18 years, patients hospitalised directly in intensive care units from the ED
Patients selected from a period from February to May 2010 (outlying patients). Control group were consecutively included among all patients hospitalised during the study period.
Prognostic variable Outlier (patients outlying in one ward but under the responsibility of another ward)
Versus.
Non-outlying patients
Confounders Matched for age, sex and reason for admission
Outcomes and effect sizes
Mortality (90 day): RR 0.75 (0.51 to 1.11)
Serious adverse events (transfer to intensive care): RR 1.05 (0.5 to 2.18)
Comments Risk of bias: High (no consideration of comorbidity). Population indirectness – all patients including surgical and trauma
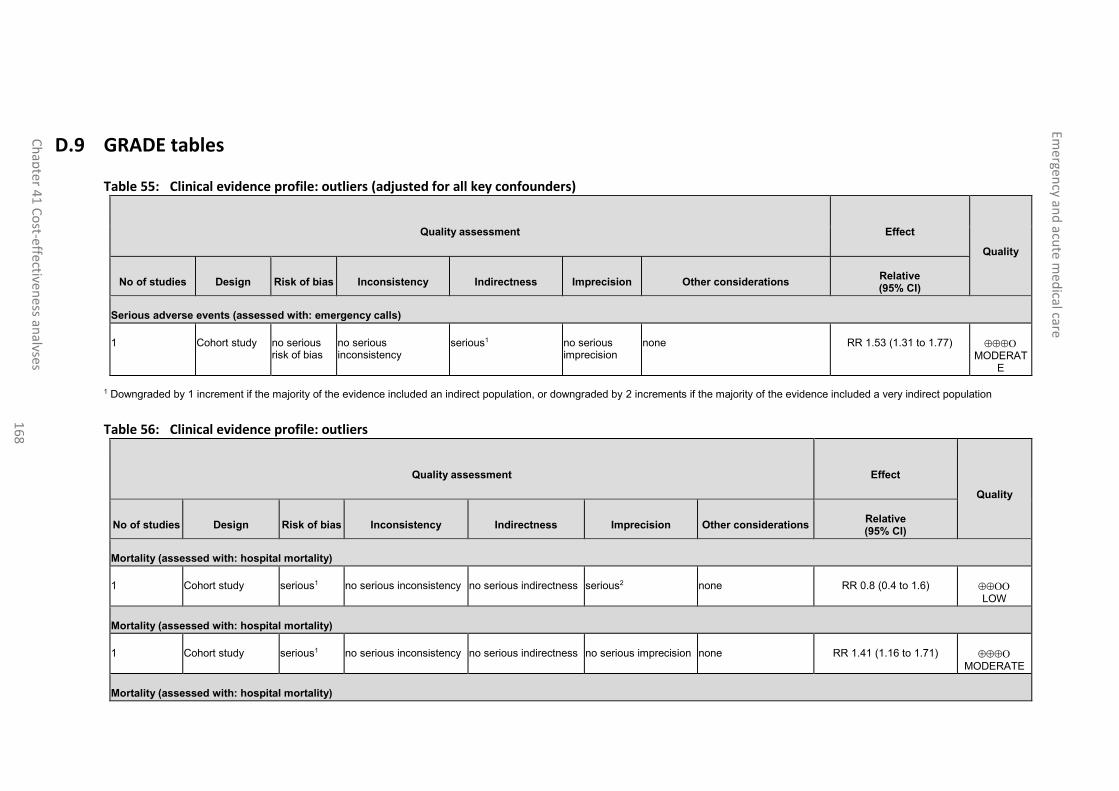
Emergen
cy and
acute m
edical care
Ch
apte
r 41
Co
st-effectiveness an
alyses 1
68
D.9 GRADE tables
Table 55: Clinical evidence profile: outliers (adjusted for all key confounders)
Quality assessment Effect
Quality
No of studies Design Risk of bias Inconsistency Indirectness Imprecision Other considerations Relative (95% CI)
Serious adverse events (assessed with: emergency calls)
1 Cohort study no serious risk of bias
no serious inconsistency
serious1 no serious imprecision
none RR 1.53 (1.31 to 1.77) MODERAT
E
1 Downgraded by 1 increment if the majority of the evidence included an indirect population, or downgraded by 2 increments if the majority of the evidence included a very indirect population
Table 56: Clinical evidence profile: outliers
Quality assessment Effect
Quality
No of studies Design Risk of bias Inconsistency Indirectness Imprecision Other considerations Relative (95% CI)
Mortality (assessed with: hospital mortality)
1 Cohort study serious1 no serious inconsistency no serious indirectness serious2 none RR 0.8 (0.4 to 1.6) LOW
Mortality (assessed with: hospital mortality)
1 Cohort study serious1 no serious inconsistency no serious indirectness no serious imprecision none RR 1.41 (1.16 to 1.71) MODERATE
Mortality (assessed with: hospital mortality)

Emergen
cy and
acute m
edical care
Ch
apte
r 41
Co
st-effectiven
ess analyses
16
9
1 Cohort study serious1 no serious inconsistency no serious indirectness no serious imprecision none HR 1.8 (1.28 to 2.53) MODERATE
Mortality (assessed with: 90 day mortality)
1 Matched pair study serious1 no serious inconsistency serious3 serious2 none RR 0.75 (0.51 to 1.11) VERY LOW
Length of stay (measured with: length of hospital stay (days); Better indicated by lower values)
1 Cohort study serious1 no serious inconsistency no serious indirectness no serious imprecision none Mean difference 2.6 higher (0.6 to 4.6 higher)
MODERATE
Serious adverse events (assessed with: infection)
1 Cohort study serious1 no serious inconsistency no serious indirectness serious2 none RR 1.5 (0.8 to 2.81) LOW
Serious adverse events (assessed with: haemorrhage)
1 Cohort study serious1 no serious inconsistency no serious indirectness serious2 none RR 1.2 (0.4 to 3.6) LOW
Serious adverse events (assessed with: transfer to ICU)
1 Matched pair study serious1 no serious inconsistency serious3 serious2 none RR 1.05 (0.5 to 2.18) VERY LOW
1 Downgraded by 1 increment if the majority of the evidence was at high risk of bias, and downgraded by 2 increments if the majority of the evidence was at very high risk of bias. 2 Downgraded by 1 increment if the confidence interval crossed the null line. 3 Downgraded by 1 increment if the majority of the evidence included an indirect population, or downgraded by 2 increments if the majority of the evidence included a very indirect population.
Emergency and acute medical care
Chapter 41 Cost-effectiveness analyses 170
D.10 Excluded studies
Table 57: Studies excluded from the clinical review
Reference Reason for exclusion
Alakeson 20104 Commentary (no outcomes reported)
American College of Emergency Physicians 20057
Policy statement (no outcomes reported)
Anon 2012A2 Article (no outcomes reported)
Anon 2012B1 Article (no outcomes reported)
Bair 201014 No relevant outcomes (effects of boarding on ED crowding)
Bakhsh 201415 No comparator
Bazarian 199620 Inappropriate study design (before and after); No multivariate analysis; Inappropriate comparison (all patients before versus after intervention)
Bing-Hua 201424 Incorrect population (surgical patients)
Blay 200225 No multivariate analysis
Blom 201526 Inappropriate exposure (high occupancy); Inappropriate comparison (low occupancy); Inappropriate outcome (admission)
Bornemann-Shepherd 201527 Inappropriate study design (before and after); No relevant outcomes
Carr 201034 No relevant outcomes (trends in boarding)
Cha 201536 Inappropriate exposure and comparison (delayed admission versus non-delayed admission)
Chalfin 200737 Inappropriate exposure and comparison (delayed admission versus non-delayed admission)
Cohen 200940 No relevant outcomes (predictors of length of stay after colorectal surgery)
Coil 201641 Inappropriate exposure and comparison (delayed admission versus not delayed)
Creamer 201047 No multivariate analysis; No relevant outcomes
Denno 201454 Article (no outcomes reported)
Falvo 200761 No relevant outcomes (no patient outcomes)
Hwang 200887 Inappropriate exposure (high boarding); Inappropriate comparison (low boarding); Outcomes reported for all patients (boarders and non-boarders together)
Kulstad 2010102 Inappropriate exposure (ED overcrowding); Outcomes reported for all patients (boarders and non-boarders together)
Liu 2009108 No multivariate analysis
Lloyd 2005109 Incorrect population (trauma patients)
Mahmoudian-Dehkordi 2016113 Simulation paper comparing different ICU management strategies during times of crisis
Mansbach 2003114 No relevant outcomes
McKnight 2012116 Article (no outcomes reported)
Metcalfe 2016120 Systematic review – references screened
Mustafa 2016128 Effect of ED boarding on delayed discharges (overall); no adjustment for confounders
Nicks 2012141 Inappropriate exposure (psychiatric patients); Inappropriate comparison (non-psychiatric patients)
Emergency and acute medical care
Chapter 41 Cost-effectiveness analyses 171
Reference Reason for exclusion
Pascual 2014149 Incorrect population (surgical patients)
Perimal-Lewis 2014155 No relevant outcomes (characteristics/predictors of boarders)
Puvaneswaralingam 2016157 Incorrect exposure and comparison (boarded patient outcomes before and after a communication tool intervention)
Ranasinghe 2016160 Outlying was an outcome rather than an exposure
Schmid-Mazzoccoli 2008177 No adjustment for key confounders
Simpson 2014182 No relevant outcomes
Sullivan 2015189 Inappropriate exposure and comparison (delayed admission versus not delayed); no adjustment for confounders
Warne 2010194 No multivariate analysis
Zhou 2012195 No comparator (predictors of poor outcome in boarded patients)

Emergency and acute medical care
Chapter 41 Cost-effectiveness analyses 172
Appendix E: Analysis of activity data from an acute hospital trust
E.1 Introduction
To evaluate the cost effectiveness of various interventions, the guideline technical team developed a simulation model of a district general hospital (DGH). To populate the baseline model bespoke analyses were conducted for a large DGH, Queen Alexandra Hospital, Portsmouth. This appendix describes those analyses.
E.2 Methods
E.2.1 Conceptual model
The health economics subgroup of the committee discussed the requirements of a simulation of a hospital that could evaluate costs, QALYs and explore the variation of performance over time.
Generally, the analyses were designed on the basis that workload and case-mix (age and NEWS) is determined by season and day of the week and hour of the day. Case-mix determines mortality, movements and length of stay.
It was agreed that to achieve this, the following characteristics would be essential.
Patient characteristics:
o Age group
– 16-44, 45-64, 65-75, 75-85, 85+
o NEWS group
– 0, 1-4, 5-6, 7+
– Zero indicates normal healthy life signs. A score of 7+ indicates referral to critical care outreach.
o Frailty scores would have been desirable but were not recorded.
Hospital pre-admission locations:
o Emergency Department (ED)
o Ambulatory Acute Medical Unit – acute medicine experts provides outpatient care for AME patients during daytime
o Clinical Decision Unit – short stay wards provided by emergency medicine experts. Although these are technically admissions, we have made a distinction, since they are part of the emergency pathway rather than medical pathway and patients were not recorded on VitalPAC, which computes NEWS.
Hospital admission locations
o Acute Medical Unit (AMU) – where undifferentiated AME patients are assessed and managed usually for up to 24 hours
o General medical wards (GMW) – provide level 1 care to medical patients, includes specialist wards such as gastroenterology, care of the elderly.
o Intensive care unit / high dependency unit (ICU/HDU) – the intensive medicine department providing level 2 and level 3 care
Emergency and acute medical care
Chapter 41 Cost-effectiveness analyses 173
o Specialist high care units (HCU) – level 2 care in the hyper-acute stroke unit, coronary care unit, respiratory high care unit and renal high care unit.
o Rehab wards – long stay wards
o Medical outliers – AME patients on non-medical (surgery, gynaecology, trauma) wards
o Non-medical pathway – Patients that are admitted under a medical consultant but subsequently take a non-medical pathway
Discharge locations:
o Usual residence
o Care home (new admission) – a source of delayed transfers of care
o NHS service
o Other
Outcomes:
o Mortality – 30-day mortality data was not available; in-hospital mortality should be treated cautiously. Reduced in-hospital mortality might be due to reduced length of stay and could be offset by more deaths in the community. However, generally, death at home is considered preferable to patients and family members.
o Length of stay (LOS) – excessive length of stay impedes flow and represents a cost to the NHS
o ICU/HDU referral – we consider this an indicator of adverse events, other adverse events are captured by mortality and length of stay
o Medical outlying – an indicator of suboptimal care
o Queuing in ED – an indicator of the hospital being under stress and sub-optimal care.
E.2.2 Data
Data was extracted from the Queen Alexandra Hospital records and statistics computed by an experienced analyst from Portsmouth Hospitals Trust.
Admissions
For admitted patients data was combined from Patient Admissions System (PAS) and VitalPAC. Data was extracted from 1st May 2010, when VitalPAC was first used routinely to 30th April 2016, the most recently available data at the time of analysis. However, data for the period 8 March 2015 to 20 June 2016 was omitted because the hospital experimented with an integrated ED and AMU, and therefore it was felt that this period would not be comparable. In total there was 5.7 years of data.
Included patients were those aged ≥16 who had a non-elective admission with a medical treatment specialty code.
Each patient’s hospital spell was segmented in to the different locations.
Identified medical outliers by comparing ward with consultant
Pre-admission attendances (not specifically medical)
The data was from PAS. To be consistent, the data was extracted for the same period as the admissions data. For these areas, all patients were included, it was not possible to differentiate, those with medical conditions from those with trauma or gynaecological problems. Children were excluded because they have a separate ED and pathway at the hospital.
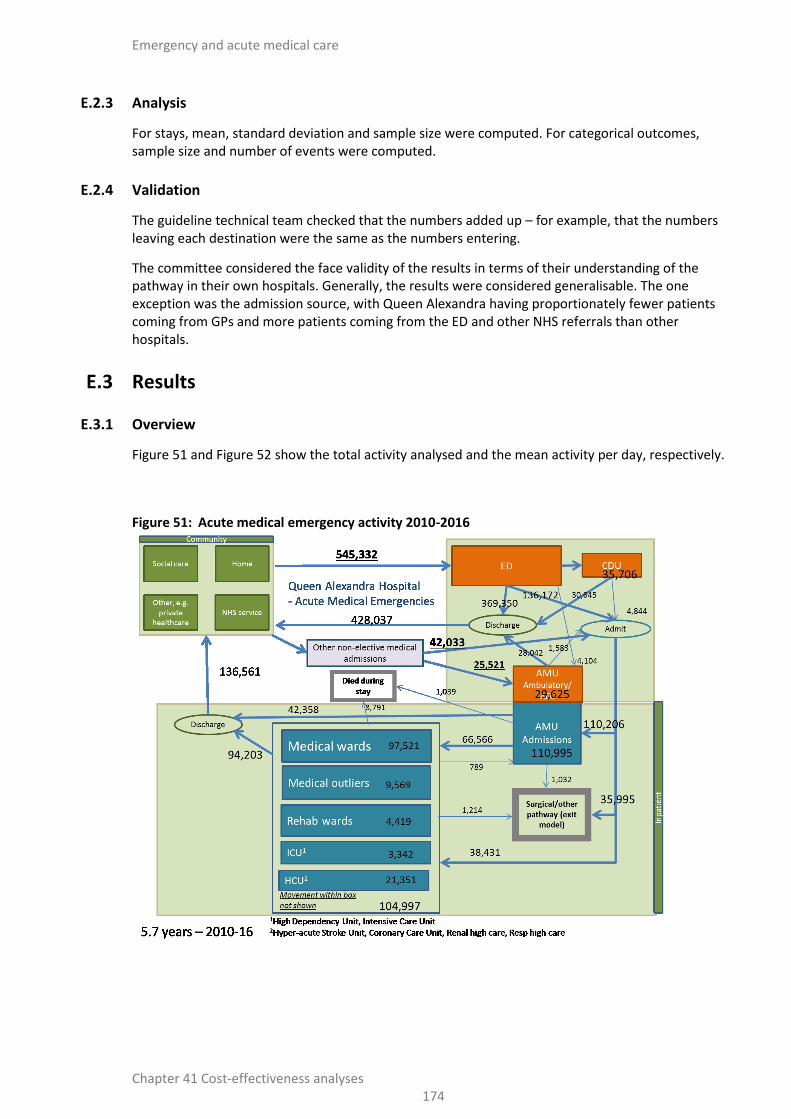
Emergency and acute medical care
Chapter 41 Cost-effectiveness analyses 174
E.2.3 Analysis
For stays, mean, standard deviation and sample size were computed. For categorical outcomes, sample size and number of events were computed.
E.2.4 Validation
The guideline technical team checked that the numbers added up – for example, that the numbers leaving each destination were the same as the numbers entering.
The committee considered the face validity of the results in terms of their understanding of the pathway in their own hospitals. Generally, the results were considered generalisable. The one exception was the admission source, with Queen Alexandra having proportionately fewer patients coming from GPs and more patients coming from the ED and other NHS referrals than other hospitals.
E.3 Results
E.3.1 Overview
Figure 51 and Figure 52 show the total activity analysed and the mean activity per day, respectively.
Figure 51: Acute medical emergency activity 2010-2016

Emergency and acute medical care
Chapter 41 Cost-effectiveness analyses 175
Figure 52: Acute medical emergency activity per day
E.3.2 Pre-admission activity
The following statistics were extracted:
ED attendances
o By age group and whether admitted
ED attendances
o By time, quarter, day(Sunday, Monday, Tuesday, Wednesday, Thursday, Friday, Saturday), admitted(y/n)
ED attendances
o By time & destination(CDU, Ward, AAMU, discharge)
ED attendances
o by week
ED LOS mean SD and in 5 min intervals
o By destination (CDU, Ward, AAMU, discharge)
CDU discharges
o by destination (Ward, AAMU, discharge)
CDU LOS – mean, sd & n
o By admitted(y/n)
AAMU attendances
o By hour, quarter, admitted(y/n)

Emergency and acute medical care
Chapter 41 Cost-effectiveness analyses 176
The distribution of ED presentations can be seen by day of the week (Table 58) and hour of the day (Figure 53 and Figure 54). Presentations were highest on Sundays and Mondays, as were absolute numbers of admissions. But admission rates were lowest on these days.
Table 58: ED attendances by day of week and whether admitted
Day of week Not admitted Admitted All Admissions per 1000
Monday 59,469 25,741 85,210 302
Tuesday 52,155 24,017 76,172 315
Wednesday 49,760 23,829 73,589 324
Thursday 49,486 23,785 73,271 325
Friday 48,063 24,053 72,116 334
Saturday 54,805 25,167 79,972 315
Sunday 59,472 25,530 85,002 300
All 373,210 172,122 545,332 316
Figure 53: ED attendances by hour of the day
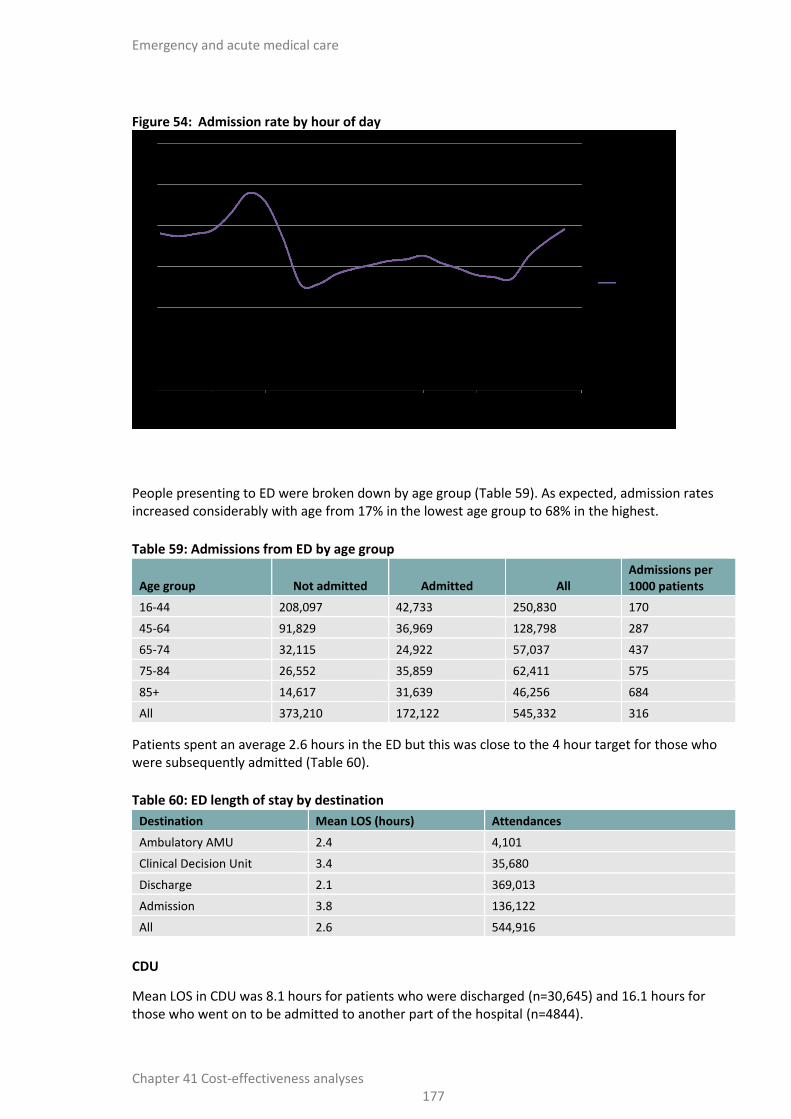
Emergency and acute medical care
Chapter 41 Cost-effectiveness analyses 177
Figure 54: Admission rate by hour of day
People presenting to ED were broken down by age group (Table 59). As expected, admission rates increased considerably with age from 17% in the lowest age group to 68% in the highest.
Table 59: Admissions from ED by age group
Age group Not admitted Admitted All Admissions per 1000 patients
16-44 208,097 42,733 250,830 170
45-64 91,829 36,969 128,798 287
65-74 32,115 24,922 57,037 437
75-84 26,552 35,859 62,411 575
85+ 14,617 31,639 46,256 684
All 373,210 172,122 545,332 316
Patients spent an average 2.6 hours in the ED but this was close to the 4 hour target for those who were subsequently admitted (Table 60).
Table 60: ED length of stay by destination
Destination Mean LOS (hours) Attendances
Ambulatory AMU 2.4 4,101
Clinical Decision Unit 3.4 35,680
Discharge 2.1 369,013
Admission 3.8 136,122
All 2.6 544,916
CDU
Mean LOS in CDU was 8.1 hours for patients who were discharged (n=30,645) and 16.1 hours for those who went on to be admitted to another part of the hospital (n=4844).

Emergency and acute medical care
Chapter 41 Cost-effectiveness analyses 178
Ambulatory AMU
Clinic runs 8 am to 8 pm – max=12 hours. For the Ambulatory AMU stay we only have narrative information. Average LOS was around 6 hours:
Reviews - 30 min to 3 hours
New patients - 1 to 6 hours, up to 12 hours for multiple investigations, or fluid infusions
Procedures - 3 to 12 hours.
Attendances at the ambulatory AMU peaked at 9am and then gradually declined over the course of the day (Table 58); 5.3% of these patients were subsequently admitted.
Table 61: Attendances at ambulatory AMU by hour of day and whether admitted
Hour of arrival Not admitted Admitted All
7 1250 35 1285
8 2205 110 2315
9 4168 167 4335
10 4102 205 4307
11 3439 199 3638
12 3692 259 3951
13 2383 132 2515
14 2660 162 2822
15 1938 141 2079
16 1173 74 1247
17 714 68 782
18 304 30 334
19 14 1 15
All 28042 1583 29625
E.3.3 Admission activity
The following statistics were extracted:
Admissions
o By method of admission (ED, GP, outpatient, other)
GMWa stays where GMW was the first location
o Next location, age group, NEWS group at beginning of GMW stay, NEWS at discharge from GMW.
GMWa stays where GMW was not the first location
o Next location, age group, NEWS group at beginning of GMW stay, NEWS at discharge from GMW.
Discharges
o By destination & hour
a These analyses were repeated for ICU/HDU and HCU. They were also conducted for medical outliers, rehab wards and the AMU, but for these locations, we did not distinguish between first location and subsequent location because of the smaller numbers.

Emergency and acute medical care
Chapter 41 Cost-effectiveness analyses 179
Mortality
o by age group, NEWS group at admission, ITU stay (ICU/HDU, No but HCU, no), Medical outlier (yes at some point, no)
LOS –mean, sd and n
o by age group, NEWS group at admission, ITU stay (ICU/HDU, No but HCU, no)
LOS –mean, sd and n
o By current location, location, next location age group, news group at admission
Table 62: Admissions by location of admitting ward and NEWS at admission
Location of admitting (first) ward
NEWS score at admission
0 1-4 5-6 7+ Not recorded All
Per 1000
GMW 6,363 12,983 1,393 757 3,334 24,830 167
HCU 4,066 5,336 908 802 139 11,251 76
ICU/HDU 69 298 82 45 1,300 1,794 12
AMU 33,462 59,120 9,953 6,623 1,048 110,206 741
Outlier 190 262 19 11 36 518 3
Rehab 18 16 3 1 38 0
All 44,168 78,015 12,358 8,238 5,858 148,637 1,000
Per 1000 297 525 83 55 39 1,000
Table 62 shows the admissions by first location and NEWS score at admission. Most patients admitted via the AMU but significant numbers go direct to GMW or HCU wards. 29.7% of patients had a NEWS score of zero (normal) at admission. NEWS was not recorded within the first 24 hours in 3.9% of patients - Table 62. This included ICU/HDU where it is not routinely recorded. However, most of the omissions were on the general medical ward. There are a number of reasons for these omissions including:
Very short stay might mean it does not get recorded
Patients admitted overnight might get it recorded on paper only
Wards being refurbished
Random selection
Terminally ill patients – this seems to be borne out in Table 66 by the high mortality for patients who did not have a NEWS score recorded (after excluding patients on the ICU/HDU).
The proportion of patients with a NEWS at admission greater than 4 was more than double in the highest age group that of the lowest age group (Table 63).

Emergency and acute medical care
Chapter 41 Cost-effectiveness analyses 180
Table 63: NEWS distribution at admission by age group
age group
NEWS score at admission
0 1-4 5-6 7+ Not recorded All
16-44 330 543 49 21 58 1,000
45-64 318 513 69 42 57 1,000
65-74 280 517 91 68 44 1,000
75-84 284 522 98 69 27 1,000
85+ 280 538 101 70 13 1,000
All 297 525 83 55 39 1,000
Table 64: Mortality by NEWS at admission
NEWS at admission
Age 75-84 Admissions Deaths Deaths per 1000
0 10,098 320 32
1-4 18,569 1,418 76
5-6 3,475 587 169
7+ 2,444 769 315
Not recorded 968 261 270
All 35,554 3,355 94
The following were associated with high mortality:
Higher NEWS – Table 64
No NEWS recorded in first 24 hours - Table 64 and Table 66
An admission to ICU - Table 65
Older age - Table 63.
Table 65: Mortality by whether there was an intensive therapy stay
HCU or ICU/HDU at any time
during admission Admissions Deaths
Deaths per
1000
No HCU/ITU stay 126,624 6,938 55
HCU stay (not ICU/HDU) 18,859 2,046 108
ICU/HDU stay 3,154 1,034 328
All 148,637 10,018 67

Emergency and acute medical care
Chapter 41 Cost-effectiveness analyses 181
Table 66: Mortality by age group, NEWS at admission and HCU stay
No ICU/HDU or HCU stay HCU stay
News at admission
Admissions
Deaths Probability of death
Admissions
Deaths Probability of death
16-44 0 6620 5 0.1% 450 0 0.0%
1-4 10909 32 0.3% 623 7 1.1%
5-6 904 7 0.8% 114 2 1.8%
7+ 322 12 3.7% 77 4 5.2%
NR 883 3 0.3% 24 3 12.5%
16-44 Total 19638 59 0.3% 1288 16 1.2%
45-64 0 9700 37 0.4% 1572 5 0.3%
1-4 15753 313 2.0% 2207 62 2.8%
5-6 1979 100 5.1% 377 32 8.5%
7+ 1066 137 12.9% 334 59 17.7%
NR 1469 31 2.1% 85 10 11.8%
45-64 Total 29967 618 2.1% 4575 168 3.7%
65-74 0 6532 87 1.3% 1294 29 2.2%
1-4 12176 473 3.9% 2137 155 7.3%
5-6 2085 192 9.2% 412 68 16.5%
7+ 1389 245 17.6% 431 97 22.5%
NR 892 40 4.5% 58 19 32.8%
65-74 Total 23074 1037 4.5% 4332 368 8.5%
75-84 0 8501 230 2.7% 1545 74 4.8%
1-4 15956 1055 6.6% 2469 295 11.9%
5-6 2836 388 13.7% 572 163 28.5%
7+ 1845 541 29.3% 547 210 38.4%
NR 665 89 13.4% 63 36 57.1%
75-84 Total 29803 2303 7.7% 5196 778 15.0%
85+ 0 6781 304 4.5% 958 91 9.5%
1-4 13137 1275 9.7% 1732 298 17.2%
5-6 2348 558 23.8% 432 153 35.4%
7+ 1611 664 41.2% 311 149 47.9%
NR 265 120 45.3% 35 25 71.4%
85+ Total 24142 2921 12.1% 3468 716 20.6%
All 126624 6938 5.5% 18859 2046 10.8%
Table 67 shows the movement of medical patients between different hospital and discharge locations. From the AMU, 55% move to GMW, 36% are discharged to their usual residence and the remaining patients are distributed to the other locations.

Emergency and acute medical care
Chapter 41 Cost-effectiveness analyses 182
Table 67: Next location by current location
Next location
Current location
AMU
GMW
1st GMW
subs Outlier Rehab
HCU
1st
HCU
subs
ICU/HDU
1st
ICU/HDU
subs
AMU 1 9 0 20 0 0 1
GMW 552 152 71 298 481 446 419
Outlier 15 22 85 0 34 18 37 54
Rehab 2 6 30 27 100 51 2 1
HCU 28 113 47 13 26 123 174
ICU/HDU 3 12 8 6 0 8 19
Non-medical
9 5 6 48 15 4 3 30
Usual Res 357 728 623 646 596 445 299 130 22
Care Home
1 7 43 36 118 5 8 2 1
NHS Service
12 32 45 43 71 34 27 35 26
Other discharge
11 34 33 18 56 5 11 11 8
Died 9 41 71 11 27 66 82 213 264
1,000 1,000 1,000 1,000 1,000 1,000 1,000 1,000 1,000
Table 68: NEWS at end of AMU stay by NEWS at start of AMU stay
NEWS at start of
AMU stay
NEWS at end of AMU stay
0 1-4 5-6 7+ Not
recorded Total
0 637 355 6 2 0 1000
1-4 250 683 52 14 0 1000
5-6 70 572 268 90 0 1000
7+ 29 367 292 311 1 1000
Not recorded 56 60 4 6 874 1000
All 336 548 72 35 9 1000
Table 69 shows how the proportion of patients with a high NEWS score diminishes over the course of the AMU stay.
Table 69: Length of stay by age group
Admissions Bed days Mean LOS (days)
16-44 21,569 66,900 3.1
45-64 35,680 188,755 5.3
65-74 28,116 198,930 7.1
75-84 35,554 336,300 9.5
85+ 27,718 326,200 11.8
148,637 1,117,084 7.5
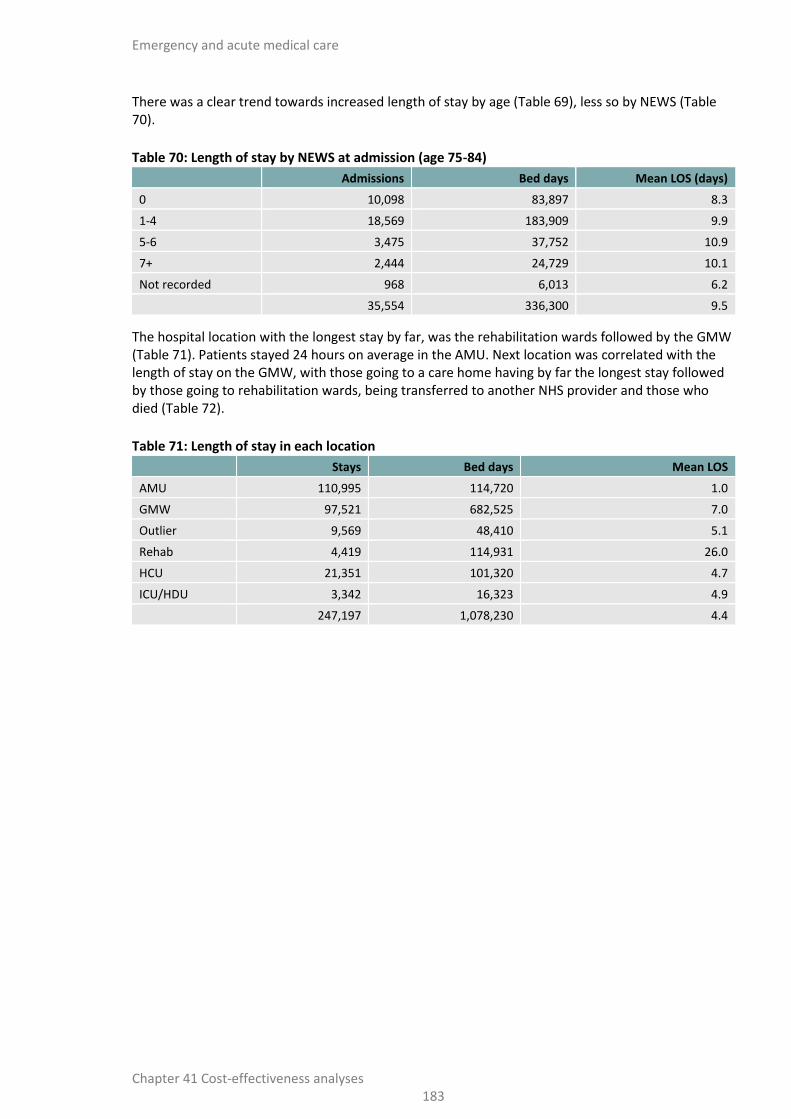
Emergency and acute medical care
Chapter 41 Cost-effectiveness analyses 183
There was a clear trend towards increased length of stay by age (Table 69), less so by NEWS (Table 70).
Table 70: Length of stay by NEWS at admission (age 75-84)
Admissions Bed days Mean LOS (days)
0 10,098 83,897 8.3
1-4 18,569 183,909 9.9
5-6 3,475 37,752 10.9
7+ 2,444 24,729 10.1
Not recorded 968 6,013 6.2
35,554 336,300 9.5
The hospital location with the longest stay by far, was the rehabilitation wards followed by the GMW (Table 71). Patients stayed 24 hours on average in the AMU. Next location was correlated with the length of stay on the GMW, with those going to a care home having by far the longest stay followed by those going to rehabilitation wards, being transferred to another NHS provider and those who died (Table 72).
Table 71: Length of stay in each location
Stays Bed days Mean LOS
AMU 110,995 114,720 1.0
GMW 97,521 682,525 7.0
Outlier 9,569 48,410 5.1
Rehab 4,419 114,931 26.0
HCU 21,351 101,320 4.7
ICU/HDU 3,342 16,323 4.9
247,197 1,078,230 4.4
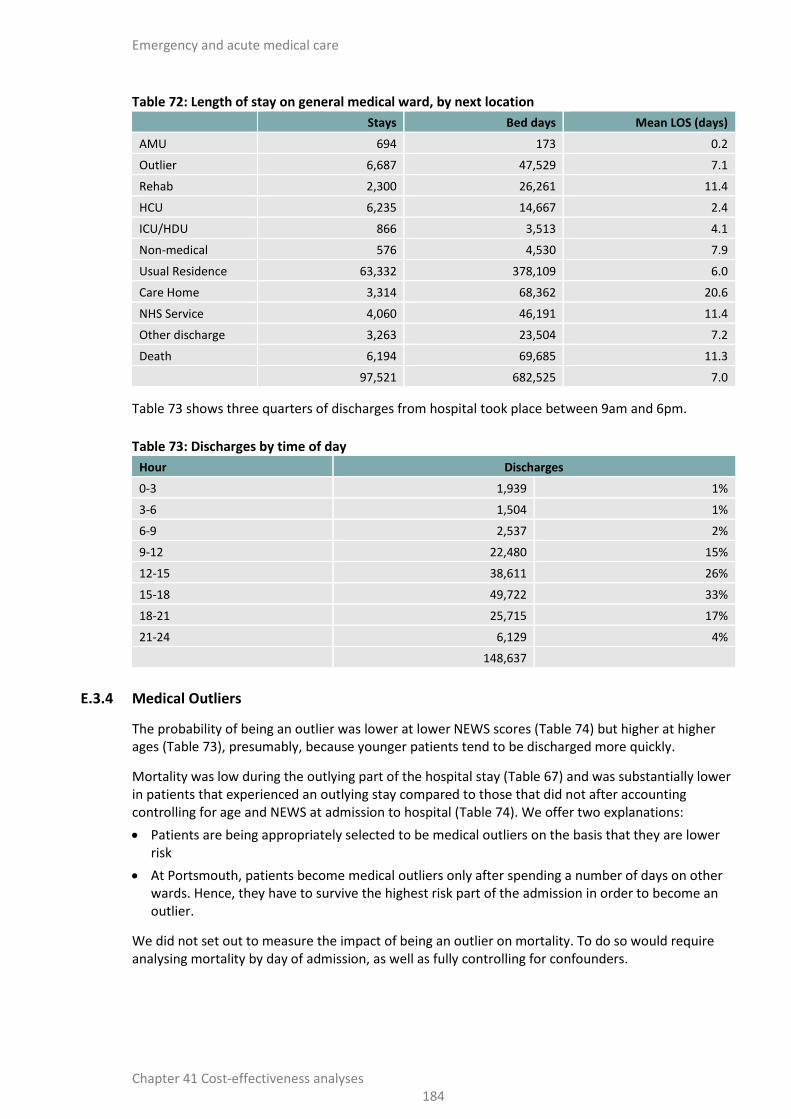
Emergency and acute medical care
Chapter 41 Cost-effectiveness analyses 184
Table 72: Length of stay on general medical ward, by next location
Stays Bed days Mean LOS (days)
AMU 694 173 0.2
Outlier 6,687 47,529 7.1
Rehab 2,300 26,261 11.4
HCU 6,235 14,667 2.4
ICU/HDU 866 3,513 4.1
Non-medical 576 4,530 7.9
Usual Residence 63,332 378,109 6.0
Care Home 3,314 68,362 20.6
NHS Service 4,060 46,191 11.4
Other discharge 3,263 23,504 7.2
Death 6,194 69,685 11.3
97,521 682,525 7.0
Table 73 shows three quarters of discharges from hospital took place between 9am and 6pm.
Table 73: Discharges by time of day
Hour Discharges
0-3 1,939 1%
3-6 1,504 1%
6-9 2,537 2%
9-12 22,480 15%
12-15 38,611 26%
15-18 49,722 33%
18-21 25,715 17%
21-24 6,129 4%
148,637
E.3.4 Medical Outliers
The probability of being an outlier was lower at lower NEWS scores (Table 74) but higher at higher ages (Table 73), presumably, because younger patients tend to be discharged more quickly.
Mortality was low during the outlying part of the hospital stay (Table 67) and was substantially lower in patients that experienced an outlying stay compared to those that did not after accounting controlling for age and NEWS at admission to hospital (Table 74). We offer two explanations:
Patients are being appropriately selected to be medical outliers on the basis that they are lower risk
At Portsmouth, patients become medical outliers only after spending a number of days on other wards. Hence, they have to survive the highest risk part of the admission in order to become an outlier.
We did not set out to measure the impact of being an outlier on mortality. To do so would require analysing mortality by day of admission, as well as fully controlling for confounders.

Emergency and acute medical care
Chapter 41 Cost-effectiveness analyses 185
Table 74: Mortality by age and whether patient has been a medical outlier for any part of their stay
Patients Deaths in hospital
Age No outlier stay Outlier stay No outlier stay Outlier stay Risk ratio (outlier versus
no)
16-44 20,811 758 1% 0% 0.4
45-64 34,146 1,534 3% 1% 0.4
65-74 26,535 1,581 6% 3% 0.6
75-84 32,890 2,664 10% 4% 0.4
85+ 25,058 2,660 14% 5% 0.4
All 139,440 9,197 7% 4% 0.5
Table 75: Mortality by age group, NEWS at admission and whether patient has been a medical outlier for any part of their stay
Patients Deaths in hospital
Age NEWS at admission
No outlier stay
Outlier stay
No outlier stay
Outlier stay
Risk ratio (outlier
versus no)
16-44
0 6876 233 0% 0% 5.9
1-4 11244 464 0% 0% 0.0
5-6 1031 29 1% 3% 3.2
7+ 435 12 5% 0% 0.0
NA 1225 20 4% 0% 0.0
20811 758 1% 0% 0.4
0 10954 388 1% 1% 0.9
1-4 17419 890 3% 1% 0.6
5-6 2329 145 7% 3% 0.4
7+ 1436 74 16% 1% 0.1
NA 2008 37 10% 5% 0.5
34146 1534 3% 1% 0.4
65-74
0 7465 405 2% 2% 1.3
1-4 13649 878 5% 3% 0.6
5-6 2397 166 12% 5% 0.5
7+ 1796 109 21% 6% 0.3
NA 1228 23 15% 22% 1.4
26535 1581 6% 3% 0.6
75-84
0 9435 663 3% 2% 0.7
1-4 17091 1478 8% 5% 0.6
5-6 3180 295 18% 4% 0.2
7+ 2241 203 34% 7% 0.2
NA 943 25 27% 12% 0.4
32890 2664 10% 4% 0.4
85+
0 7022 727 5% 3% 0.6
1-4 13431 1471 11% 4% 0.4
5-6 2493 293 28% 10% 0.4
7+ 1775 157 45% 8% 0.2

Emergency and acute medical care
Chapter 41 Cost-effectiveness analyses 186
Patients Deaths in hospital
Age NEWS at admission
No outlier stay
Outlier stay
No outlier stay
Outlier stay
Risk ratio (outlier
versus no)
NA 337 12 50% 42% 0.8
25058 2660 14% 5% 0.4
All 139440 9197 7% 4% 0.5
E.4 Comparisons with national data sources
The age distribution, length of stay and mortality were broadly similar to medical patients nationally – Table 76. NEWS distribution by age was also broadly similar but there were fewer patients with the lowest NEWS score at Portsmouth 31% versus 35% in SAMBA 2013 - Table 77. Table 78 shows that the distribution of admission sources is quite different to the national pattern. Overall, it would seem that the case-mix for Portsmouth admissions is somewhat worse than average, as indicated by:
A lower proportion having NEWS=0,
A lower proportion age<65,
Longer length of stay,
Higher mortality.
Table 76: Comparison with national data sources
Portsmouth England (HES) England (HES)
England (SAMBA)188
England
(HES-ONS) – see 41.2.6.2
Years 2010-2016 2010-2015 2014-2015 2013 2013-14
n 148,637 13,999,919 2,958,602 2,990 3,576,663
Mean length of stay (days)
7.5 6.5 6.4
6.4
Probability of death in hospital
6.7% 6.0% 5.8%
Age profile
18-44 14.5%* 16.3% 18.7%* 18.6%
45-64 24.0% 23.2% 23.8% 25.3%
65-74 18.9% 18.0% 17.7% 17.7%
75-84 23.9% 23.5% 22.7% 21.8%
85+ 18.6% 18.9% 17.1% 16.6%
*Ages 16-44
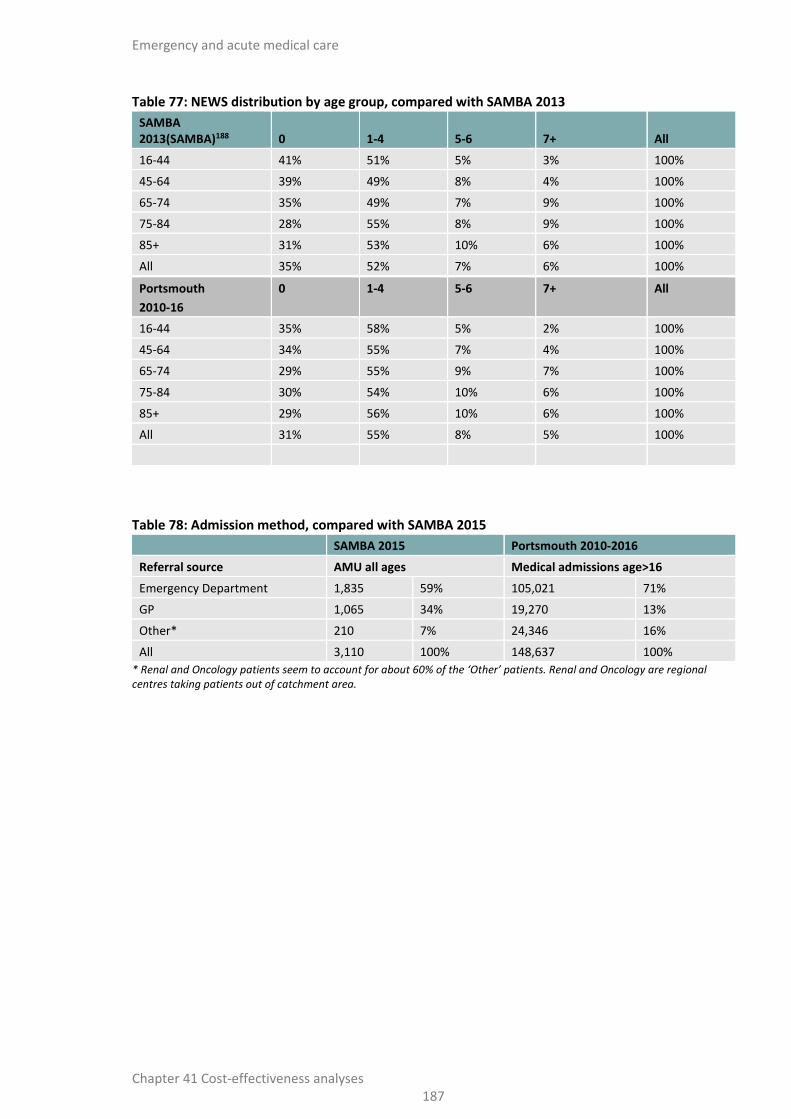
Emergency and acute medical care
Chapter 41 Cost-effectiveness analyses 187
Table 77: NEWS distribution by age group, compared with SAMBA 2013
SAMBA 2013(SAMBA)188 0 1-4 5-6 7+ All
16-44 41% 51% 5% 3% 100%
45-64 39% 49% 8% 4% 100%
65-74 35% 49% 7% 9% 100%
75-84 28% 55% 8% 9% 100%
85+ 31% 53% 10% 6% 100%
All 35% 52% 7% 6% 100%
Portsmouth
2010-16
0 1-4 5-6 7+ All
16-44 35% 58% 5% 2% 100%
45-64 34% 55% 7% 4% 100%
65-74 29% 55% 9% 7% 100%
75-84 30% 54% 10% 6% 100%
85+ 29% 56% 10% 6% 100%
All 31% 55% 8% 5% 100%
Table 78: Admission method, compared with SAMBA 2015
SAMBA 2015 Portsmouth 2010-2016
Referral source AMU all ages Medical admissions age>16
Emergency Department 1,835 59% 105,021 71%
GP 1,065 34% 19,270 13%
Other* 210 7% 24,346 16%
All 3,110 100% 148,637 100%
* Renal and Oncology patients seem to account for about 60% of the ‘Other’ patients. Renal and Oncology are regional centres taking patients out of catchment area.

Emergency and acute medical care
Chapter 41 Cost-effectiveness analyses 188
Appendix F: Treatment effect calculations
In the MS Excel model treatment effects are being applied to a whole cohort whereas in the Simul8 model the treatment effect is more targeted. In some cases, additional calculations needed to be made to enable the treatment effect elicited from the committee subgroup to be applied correctly in the model. These are explained in more detail below.
Length of stay reductions were estimated as absolute average stays reductions (for example, 1 day less). This was applied as a relative reduction in stay to all relevant patients, since some patients might have less than a full day’s stay even before the treatment effect has been applied – hence the effects in Table 6 are expressed as relative risks. For example, 0.84 represents a 16% reduction in length of stay.
F.1 RAT in the ED
F.1.1 [A] – Mortality within ED
Mortality within ED is mostly prevalent in resuscitation patients who do not normally come through RAT. The RAT intervention affects majors patients only and therefore there was unlikely to be a substantial mortality effect. However, a small decrease in mortality of 1 in 100 (RR=0.99) has been included for the optimistic treatment effect analysis. This treatment effect is applied to ED mortality only. The probability of dying in the ED was found to be 0.1%. Therefore, applying the treatment effect of 0.99 reduces this probability to 0.099%. With this treatment effect applied, for every 100,000 patients that go through the ED you would expect to prevent 1 death.
Applying this treatment effect in the MS Excel model
In the MS Excel model this treatment effect was incorporated into the 30 day mortality rate. Using the values calculated above it was estimated that there would be 0.01 fewer deaths per 1000 ED patients. After 30 days for every 1000 patients that entered the ED there are, on average, 39.92 deaths. Therefore, this value would decrease to 39.91 when the deaths averted from the intervention are incorporated. The treatment effect applied to the 30 day mortality rate is therefore (39.91/39.92) = 0.9997.
F.1.2 [B] – Admissions
A midpoint of 1 in 20 patients avoiding admission was agreed (RR=0.95). It was agreed that the range around the effect size should include the possibility of increasing admissions. The admissions avoided would be those where patients are admitted to AMU and subsequently discharged with a short length of stay.
Applying this treatment effect in the MS Excel model
As this effect only applies to those who receive the intervention, additional adjustments needed to be made when applying it to a cohort of patients, some of whom will not receive the intervention. The probability of receiving the intervention, based on the inclusion criteria for the intervention, was found to be 27.1% (Table 23). For every 1000 ED attendances, 271 would receive the intervention. All of these patients would be ‘majors’ and the admission rate for majors was found to be 42.6% (41.2.4.2), therefore, of the 271 patients we would expect 116 admissions. This is where the treatment effect is now applied. Avoiding 1 in 20 admissions would reduce this number to 110 admissions. For every 1000 ED attendances, we would currently expect 289 admissions (41.2.4.2). With the intervention in place, we would expect 283 admissions, the equivalent of a 0.979 risk ratio

Emergency and acute medical care
Chapter 41 Cost-effectiveness analyses 189
being applied to the admission rate for the whole cohort. The model assumes these avoided admissions are in short stay patients only.
Applying this treatment effect in the Simul8 model
F.1.3 The model does not identify whether a simulated patient has been through majors or not. Therefore, the treatment effect elicited is transformed for use within the simulation model. Using the Portsmouth data analysis, 85.4% of ED attendances are during RATing hours with 30.1% of those being admitted. This equates to 257 admissions during RATing hours for every 1000 ED attendances. We estimated that 39.1% of ED admissions are majors (41.2.4.2). This makes 1 in 20 major admissions avoided equivalent to 1 in 51 admissions avoided. Applying this to the 257 admissions during RATing hours leads to 5 admissions avoided per 1000 ED attendances. All of the admissions avoided should be patients who received the intervention, majors patients who would be avoiding a short stay. The simulation model is able to identify the exact type of patient that would be able to avoid admission and apply the treatment effect to only those patients. Therefore, the treatment effect needs to be modified. 74.1% (190) of the 257 admissions during RATing hours are admitted to the AMU. 38.2% (73) of those are discharged from the AMU after a short stay. Avoiding 5 of the 73 admissions to match the 1 in 20 majors admissions avoided elicited as the treatment effect equates to a risk ratio of 0.93 applied to simulated patients that arrived during RATing hours and subsequently admitted to the AMU for a short stay.[C] – ED length of stay.
The presence of RATing would reduce the time to decision of admission or discharge. However, it was discussed that admitted patients might not see their overall length of stay change dependent on bed availability. This should be captured in the capacity of the model. 26.0% of patients in ED receive RAT, which was majors equating to 30.5% of ED patients - 41.2.4.2 multiplied by 85.4% arriving in service hours from the Portsmouth data). These patients would see an average decrease in time to decision of around 15 minutes (20-10 minute range). For our average length of stay of 157 minutes (41.2.4.3), this equates to treatment effect of 0.904 with an upper and lower range of 0.873- 0.936. As the main benefit of this treatment effect is to improve hospital flow it was omitted from the MS Excel model as the impact of hospital flow is not captured.
F.2 Extended hours for consultants in AMU
F.2.1 [D] – Within AMU mortality
There would only be a small number of preventable deaths, as a large number of patients are on an end of life pathway. It was proposed that 1 in 100 (RR=0.99) reduction in mortality would be realistic. The effect is applied to all AMU patients. This treatment effect is applied to AMU mortality only. The probability of dying in the AMU was found to be 0.94% in the Portsmouth hospital data analysis. Therefore applying the risk ratio of 0.99 reduces this probability to 0.93%. With this treatment effect applied, for every 10,000 patients that go through the AMU you would expect to prevent one death.
Applying this treatment effect in the MS Excel model
In the MS Excel model this treatment effect was incorporated into the 30 day mortality rate. Using the values calculated above it was estimated that there would be 0.1 fewer deaths per 1,000 AMU patients. After 30 days for every 1,000 patients that entered the AMU there are, on average, 89.97 deaths (See 41.2.6 and Table 32). Therefore, this value would decrease to 89.87 when the deaths averted from the intervention are incorporated. The treatment effect applied to the 30 day mortality rate is therefore (89.87/89.97) = 0.99896.
Emergency and acute medical care
Chapter 41 Cost-effectiveness analyses 190
F.2.2 [E] – Adverse events (admissions to ICU/HDU directly from AMU)
The treatment effect was only applied to those that enter the AMU during extended hours 6pm - 10pm weekday, 8am – 10pm weekend). It was agreed that for these patients, of those that would have been referred to ICU/HDU, 1 in 20 would be avoided.
Applying this treatment effect in the MS Excel model
As this treatment effect only applies to those who arrive in extended hours, additional adjustments needed to be made when applying it to a cohort of patients, some of whom will not arrive in extended hours. The probability of arriving in extended hours was found to be 23.9% (Table 22). For every 100,000 AMU admissions, 23,900 would arrive in extended hours. The probability of being admitted to the ICU/HDU was found to be 0.3% from the Portsmouth data analysis; therefore, of the 23,900 patients we would expect 72 admissions to ICU/HDU from AMU. Avoiding 1 in 15 ICU/HDU admissions would reduce this number by 5 admissions. For every 100,000 AMU attendances, we would currently expect 300 ICU/HDU admissions. With the intervention in place, we would expect 295 ICU admissions, the equivalent of a 0.98 risk ratio being applied to the ICU/HDU admission rate for the whole cohort.
Applying this treatment effect in the Simul8 model
This treatment effect is applied only to those that arrive during extended hours. It was agreed that 1 in 20 would avoid ICU/HDU admission under the intervention. This is implemented in the model by applying a 5% (0.95 risk ratio) reduction in the probability of ICU admission from the AMU for patients arriving during extended hours.
F.2.3 [F] – Length of stay in AMU (earlier discharge)
It was decided to break this down into 2 parts:
1. Some patients who arrive during extended hours can be discharged a day earlier as a consequence of being seen earlier:
1 in 15 of all such patients could avoid an overnight stay (1 in 30 in the conservative analysis and 1 in 10 in the optimistic analysis)
Those that benefit are under age 65 and are being discharged the next day to usual residence.
2. Some patients who can be discharged hours earlier due to earlier testing/cancelled unnecessary tests:
Patients who are admitted to AMU during extended hours are under age 65 and are being discharged the next day to usual residence will have reduced length of stay if they are not discharged a day earlier, as above.
One hour reduction (0.5 in the conservative analysis and 2 in the optimistic analysis).
Applying this treatment effect in the MS Excel model
As this treatment effect only applies to those who arrive in extended hours, additional adjustments needed to be made when applying it to a cohort of patients, most of whom will not arrive in extended hours. The probability of arriving in extended hours was found to be 23.9%. For every 1000 AMU attendances, 239 would arrive in extended hours. 1 in 15 of these patients would be discharged a day earlier meaning for every 1000 AMU attendances 16 patients would now be discharged a day earlier. The committee decided that all these patients would be <65 and expected to be discharged the next day. The proportion of AMU attendances that fit the criteria was found to be 19.0% in the Portsmouth data. Therefore, of the 239 who arrive in extended hours, 45.5 would be under 65 and
Emergency and acute medical care
Chapter 41 Cost-effectiveness analyses 191
planned to be discharged the next day. The committee agreed that for those who met the criteria but who were not discharged a day earlier, length of stay would be reduced by 1 hour on average, due to earlier testing and cancelling of unnecessary tests. Of the 45.5, if 16 were discharged earlier, as calculated above, then 29.5 would therefore have their length of stay reduced by 1 hour.
Applying this treatment effect in the Simul8 model
The length of stay treatment effects are only applied to those that arrive during the extended hours who are under 65 and being discharged to usual residence the next day in a 2 stage approach.
1) It was noted above that the intervention would avoid an overnight admission in 1 in 15 patients arriving in extended hours, equivalent to 310 per year (=4,654/15) from the Portsmouth data analysis. Of the 4,654, 884 patients fulfil the criteria of being under 65 years of age and being discharged home from AMU. Therefore, 35.1% of these patients would avoid overnight admission (310/884). These patients were computed a discharge time between arrival and midnight using a uniform distribution.
2) In the data analysis, the average AMU length of stay for this cohort was 28 hours. Those who arrived in extended hours, were aged under 65 and being discharged home and did not avoid an overnight admission would have a 1-hour reduction in length of stay. The weight applied for these patients was 0.964=1-1/28.
F.3 Daily consultant review on medical wards
All these treatment effects apply to everyone who receives the intervention, therefore no adjustments need to be made to the MS Excel cohort model:
F.3.1 [G] – Mortality within GMW
It was felt that daily consultant reviews would prevent only a small number of deaths on the GMW. It was proposed that 1 in 100 (0.99) reduction in mortality would be realistic. The effect was applied to all GMW patients. This treatment effect is applied to GMW mortality only. The probability of dying in the GMW was found to be 6.35% in the Portsmouth data analysis (41.2.4.4). Therefore applying the treatment effect of 0.99 reduces this probability to 6.29%. With this treatment effect applied, for every 10,000 patients that go through the AMU you would expect to prevent 6 deaths.
Applying this treatment effect in the MS Excel model
In the MS Excel model this treatment effect was incorporated into the 30 day mortality rate. Using the values calculated above it was estimated that there would be 0.63 fewer deaths per 1,000 GMW patients. After 30 days for every 1000 patients that entered the GMW there are, on average, 89.97 deaths (See 41.2.6 and Table 32). Therefore, this value would decrease to 89.33 when the deaths averted from the intervention are incorporated. The treatment effect applied to the 30 day mortality rate is therefore (89.33/89.97) = 0.993.
F.3.2 [H] – Adverse events (admission to ICU/HDU directly from GMW)
The consensus was that 1 in 14 referrals to ICU/HDU would be avoided (1 in 7 in the optimistic treatment effects sensitivity analysis; 0 in the conservative treatment effects analysis).
F.3.3 [I] – Length of stay on GMW
It was agreed that there would be a 1-day reduction in length of stay for 1 in 10 patients (24 * 0.1 = 2.4 hours) in the base case and 1 in 5 patients for the optimistic treatment effects sensitivity analysis.

Emergency and acute medical care
Chapter 41 Cost-effectiveness analyses 192
There would be a partial effect in the control arm where consultant review takes place 2 days a week, therefore the net effect was (2.4 * (5/7)) = 1.7 hours.
Applying this treatment effect in the MS Excel model
The average reduction of 1.7 hours length of stay for all GMW patients being discharged equates to a weight of 0.989 (=1-1.7/[6.4x24]) assuming an average length of hospital stay of 6.4 days (HES 2014-15 – 41.2.4.4).
Applying this treatment effect in the Simul8 model
The average reduction of 1.7 hours length of stay for all GMW patients being discharged equates to a weight of 0.990 (=1-1.7/[7.0x24])assuming an average length of GMW stay of 7.0 days (Portsmouth hospital data analysis).
F.4 Extended access to therapy in the ED
F.4.1 [J] – Admissions
The committee expected 1-2 admissions to be avoided per day for a hospital with 250 ED presentations per day. This is the equivalent of preventing 4-8 admissions per 1000 ED attendances. In the base case, it was assumed that 4 admissions would be averted (8 in the optimistic treatment effects analysis and 2 in the conservative analysis).
The patients benefiting would be those with a CFS 3-6, NEWS 0-1, and who would have had a short length of stay.
Applying this treatment effect in the MS Excel model
For every 1000 ED attendances, it was calculated that there would be, on average, 289 ED admissions (41.2.4.2). By preventing 4 admissions per 1000 this number would reduce to 285 admissions per 1000 ED attendances. This equates to a treatment effect of 0.986 being applied to the admission rate for the whole cohort of patients going through the ED. It was assumed these avoided admissions would be in short stay patients only.
Applying this treatment effect in the Simul8 model
Applying the SAMBA CFS distributions to the Portsmouth admission data gave 3,819 patients per year of CFS 3-6 who had a short length of stay (10.5 per day). Avoiding 1 admission per day is equivalent to a risk ratio of 0.904 (1-1/10.5) applied only to the targeted cohort.
F.5 Extended access to therapy on medical wards
F.5.1 [K] –Length of stay
It was agreed that patients on the GMW with CFS ≥3, age over 65 and being discharged would see a stay reduction of 1 day on average (0.5 to 1.5 days in sensitivity analyses).
Applying this treatment effect in the MS Excel model
For every 1000 GMW attendances, it was estimated that there would be, on average, 393 who had a CFS over 3 and were over 65 years of age (using SAMBA 2013 data). A 1 day reduction in length of stay would bring the average length of stay down from 6.4 (41.2.4.4) to 5.4 in these patients only (5.4/6.4=0.84). The average length of stay for the whole GMW cohort, including those who do not

Emergency and acute medical care
Chapter 41 Cost-effectiveness analyses 193
receive the intervention, decreases to 6.0. This equates to a weight of 0.94 being applied to the length of stay for the entire GMW cohort.
Applying this treatment effect in the Simul8 model
The effect was applied specifically to the cohort of patients in GMW with CFS ≥3, age over 65 and being discharged. The 1-day length of stay reduction was applied as a relative weight of 1-1/7.0=0.857, where 7.0 was the average length of stay for patients on GMW in the Portsmouth hospital data.
F.5.2 [L] – Quality of life
It was agreed that there would be an increase of 1% in quality of life for patients on the GMW with CFS ≥3, age over 65 and being discharged to their usual place of residence from the GMW that would last for 1 year.
Applying this treatment effect in the MS Excel model
Using Samba 2013, it was calculated that 63% of those over 65 years of age would have a CFS > 3. These would be the patients that would receive a 1% improvement in quality of life for 1 year. If 63% received a 1% improvement in quality of life and 37% received no increase in quality of life then this works out as a [(63% x 1%) + (37% x 0%) = 0.63%] improvement in quality of life for all patients aged 65 years of age.

Emergen
cy and
acute m
edical care
Ch
apte
r 41
Co
st-effectiveness an
alyses 1
94
Appendix G: Simulation model labels, workstations and procedures
Table 79: Model labels (that is, patient-level variables)
Label name Type Function Workstations where label is used Procedures where label is used
lbl_30mort Binary Indicator of if simulated patient died between discharge and 30 days post admission.
- Proc_End,
Proc_LongTerm
lbl_AdmAvoid Binary Indicates if patient avoided admission (where we are applying a treatment effect in the model)
AMU
Proc_BedDrop
lbl_AdmDay Categorical Day of the week that the patient was admitted.(Monday=1) Route,
AMU
Proc_End
lbl_admit Binary Whether or not to admit patient. AMUamb,
pt info
Proc_PreAdmRoute,
Proc_LOS,
Proc_LongTerm
lbl_AdmNEWS Categorical NEWS score on admission. (1=0, 2=1-4, 3=5-6, 4=7+, 5=unknown)
Route,
AMU
Proc_End
lbl_AdmPatNum Categorical Unique patient number for admitted patients. AMUamb,
AMU
Proc_PreAdmRoute,
Proc_DecisionRules,
Proc_End
lbl_AdmQuart Categorical Quarter of the year that the patient is admitted. (Jan-Mar=1) Route Proc_End
lbl_Age Continuous Exact age at presentation (16-100). pt info Proc_End,
Proc_LongTerm
lbl_AgeCat Categorical Age category. (1=16-44, 2=45-64, 3=65-74, 4=75-84, 5=85+) pt info,
AMU,
GMW,
Route,
Death
Proc_PreAdmRoute,
Proc_route,
Proc_LOS,
Proc_Discharge,
Proc_End,
Proc_LongTerm

Emergen
cy and
acute m
edical care
Ch
apte
r 41
Co
st-effectiveness an
alyses 1
95
Label name Type Function Workstations where label is used Procedures where label is used
lbl_ArrivalTime Continuous Arrival time into simulation. (exact minute of the year entered simulation)
pt_info
set wait,
AMU
Proc_PreAdmRoute,
Proc_BedDrop,
Proc_End
lbl_arrival mode Categorical Mode of arrival (1=ED, 2=direct, 3=ambulatory AMU). pt info,
Route,
Outlier
Proc_End
lbl_BedHeld Categorical Resource (bed) simulated patient currently holding (e.g. 1=AMU).
Death Proc_BedPickUp
Proc_BedDrop
lbl_BedLOS Continuous Length of stay in current resource (bed). Proc_BedDrop
lbl_CFS Categorical Patient clinical frailty scale score. pt info,
ED,
GMW,
Route,
Death
Proc_BedDrop,
Proc_LOS,
Proc_Discharge,
Proc_End,
Proc_LongTerm
lbl_changebed Binary Indicating if patient queuing for rehab should change to GMW bed
Change Bed Proc_DecisionRules
lbl_Cost Continuous Simulated patient running total cost. ED, CDU, AMUamb, AMU, GMW, Death
Proc_BedDrop,
Proc_End,
Proc_LongTerm
lbl_CostAMUamb Continuous Cost of having ambulatory AMU stay AMUamb Proc_End
lbl_CostAMUround Continuous Costs associated with AMU consultant ward round (extended hours)
AMU Proc_End
lbl_CostAMUstay Continuous Cost of stay on AMU - Proc_BedDrop,
Proc_End
lbl_CostCDU Continuous Cost of having CDU stay CDU Proc_End
lbl_CostEDatt Continuous Costs of attending ED ED Proc_End
lbl_CostGMWround Continuous Cost of GMW consultant ward round (additional days) - Proc_BedDrop,

Emergen
cy and
acute m
edical care
Ch
apte
r 41
Co
st-effectiveness an
alyses 1
96
Label name Type Function Workstations where label is used Procedures where label is used
Proc_End
lbl_CostGMWstay Continuous Cost of stay on GMW - Proc_BedDrop,
Proc_End
lbl_CostHCUstay Continuous Cost of stay on HCU - Proc_BedDrop,
Proc_End
lbl_CostICUstay Continuous Cost of stay on ICU - Proc_BedDrop,
Proc_End
lbl_CostOUTstay Continuous Cost of stay as a medical outlier - Proc_BedDrop,
Proc_End
lbl_CostPTOTEDRef Continuous Costs of having therapy intervention in ED ED Proc_End
lbl_CostPTOTWard Continuous Cost of having therapy intervention on medical wards - Proc_BedDrop,
Proc_End
lbl_CostRAT Continuous Costs of RAT in ED ED Proc_End
lbl_CostREHstay Continuous Cost of stay on Rehabilitation wards - Proc_BedDrop,
Proc_End
lbl_CostsHosp Continuous Simulated patient running total hospital cost. Death Proc_End,
Proc_LongTerm
lbl_currentoutlier Binary Indicating if patient has been a medical outlier. Route Proc_LOS,
Proc_End
lbl_Dcost Continuous Simulated patient running total discounted cost. - Proc_End,
Proc_LongTerm
lbl_direct Binary Indicating patient was a direct admission. pt info,
ED,
CDU,
Route
Proc_PreAdmRoute,
Proc_route,
Proc_NEWS
lbl_DQALYS Continuous Simulated patient running total discounted quality adjusted life years.
- Proc_End,
Proc_LongTerm
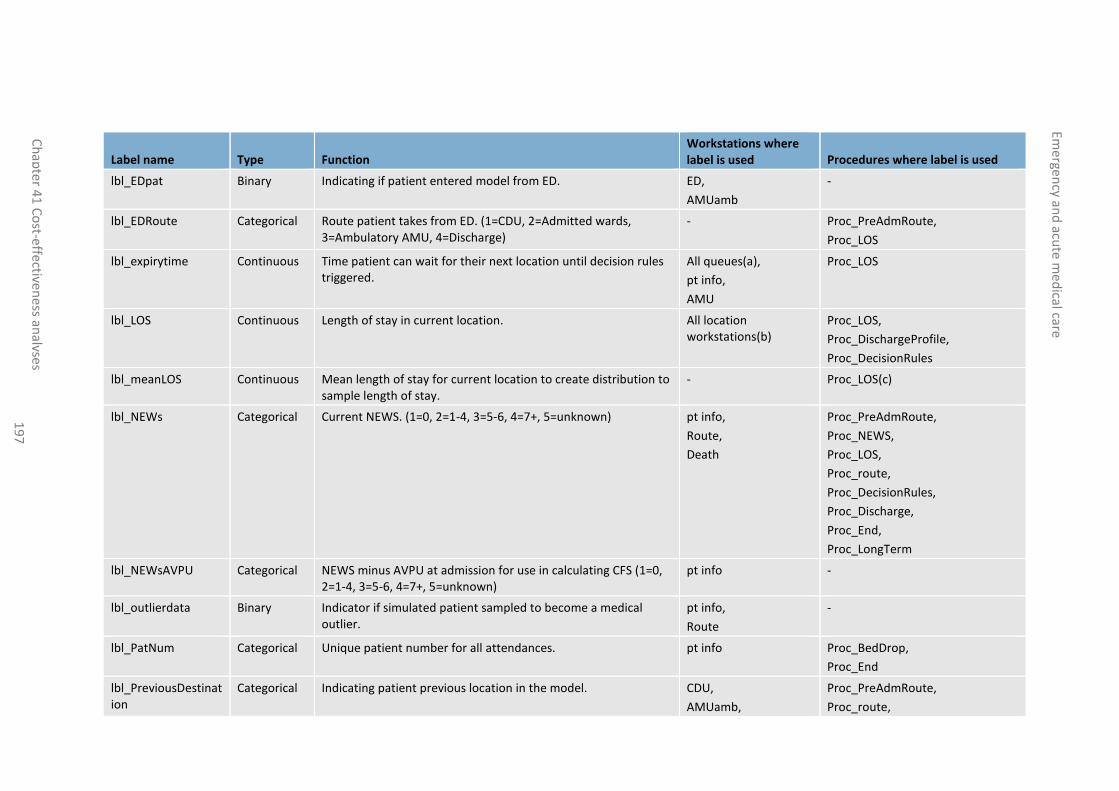
Emergen
cy and
acute m
edical care
Ch
apte
r 41
Co
st-effectiveness an
alyses 1
97
Label name Type Function Workstations where label is used Procedures where label is used
lbl_EDpat Binary Indicating if patient entered model from ED. ED,
AMUamb
-
lbl_EDRoute Categorical Route patient takes from ED. (1=CDU, 2=Admitted wards, 3=Ambulatory AMU, 4=Discharge)
- Proc_PreAdmRoute,
Proc_LOS
lbl_expirytime Continuous Time patient can wait for their next location until decision rules triggered.
All queues(a),
pt info,
AMU
Proc_LOS
lbl_LOS Continuous Length of stay in current location. All location workstations(b)
Proc_LOS,
Proc_DischargeProfile,
Proc_DecisionRules
lbl_meanLOS Continuous Mean length of stay for current location to create distribution to sample length of stay.
- Proc_LOS(c)
lbl_NEWs Categorical Current NEWS. (1=0, 2=1-4, 3=5-6, 4=7+, 5=unknown) pt info,
Route,
Death
Proc_PreAdmRoute,
Proc_NEWS,
Proc_LOS,
Proc_route,
Proc_DecisionRules,
Proc_Discharge,
Proc_End,
Proc_LongTerm
lbl_NEWsAVPU Categorical NEWS minus AVPU at admission for use in calculating CFS (1=0, 2=1-4, 3=5-6, 4=7+, 5=unknown)
pt info -
lbl_outlierdata Binary Indicator if simulated patient sampled to become a medical outlier.
pt info,
Route
-
lbl_PatNum Categorical Unique patient number for all attendances. pt info Proc_BedDrop,
Proc_End
lbl_PreviousDestination
Categorical Indicating patient previous location in the model. CDU,
AMUamb,
Proc_PreAdmRoute,
Proc_route,

Emergen
cy and
acute m
edical care
Ch
apte
r 41
Co
st-effectiveness an
alyses 1
98
Label name Type Function Workstations where label is used Procedures where label is used
AMU,
GMW,
Change Bed,
Death
Proc_DecisionRules,
Proc_Discharge,
Proc_End,
Proc_LongTerm
lbl_priority Continuous Rank priority of patients in same queue by certain variable (e.g. patients queuing into AMU have following priority based on their current location: 1=CDU, 2=ED, 3=Ambulatory AMU)
- -
lbl_QALYS Continuous Simulated patient running total quality adjusted life years. - Proc_End,
Proc_LongTerm
lbl_QOLTE Binary Indicating if patient should have a quality of life treatment effect applied.
GMW Proc_LongTerm
lbl_ResultsPat Binary Indicates if patient came in during results collection period (rather than the burn-in or cool-off periods).
pt info,
Route,
Discharge locations(d)
Proc_BedDrop
lbl_route Categorical Next location in patient pathway CDU,
AMUamb,
AMU,
GMW
Proc_PreAdmRoute,
Proc_NEWS,
Proc_LOS,
Proc_route,
Proc_DecisionRules,
Proc_DischargeProfile,
Proc_BedDrop,
Proc_End
lbl_RouteAdjust Binary Indicating if patient should have route adjusted based on a treatment effect (removing, for example, an ICU stay from their pathway).
AMU,
GMW
Proc_route
lbl_sdLOS Continuous Standard deviation length of stay for current location to create distribution to sample length of stay.
- Proc_LOS(c)
lbl_StayCost Continuous Total cost of bed days (all locations) ED, Proc_BedDrop,

Emergen
cy and
acute m
edical care
Ch
apte
r 41
Co
st-effectiveness an
alyses 1
99
Label name Type Function Workstations where label is used Procedures where label is used
CDU,
AMUamb,
AMU,
Death
Proc_LongTerm
lbl_SurgicalAdm Binary Indicating if simulated patient was a surgical admission. Non-medical Proc_PreAdmRoute,
Proc_End
lbl_TimeBedEntered Continuous Exact minute of the year patient picked up current resource (entered current bed).
- Proc_DecisionRules,
Proc_BedPickUp,
Proc_BedDrop,
lbl_TimeRemaining Continuous Time remaining in sampled length of stay for current location. - Proc_DecisionRules
lbl_TotalLOS Continuous Total hospital length of stay Discharge locations(d) Proc_BedDrop
lbl_wait Continuous Exact minute of the week patient enters model from weekly distribution.
Set wait
(a) Used in queues to all workstations (b) Used in all workstations that represent an area of the simulated hospital, indicates how long simulated patient should spend in that workstation (c) Also used within the distribution distLOS to sample for lbl_LOS (d) All locations where simulated patient exits model: Usual res, Care home, NHS service, Other discharge, Non-medical, Death

Emergen
cy and
acute m
edical care
Ch
apte
r 41
Co
st-effectiveness an
alyses 2
00
Table 80: Model workstations
Object Description Procedures called Resources Enter from Exit to
Start points
Walk_amb Arrival mode. One batch of patients enter per week. Arrival mode captured by label.
None None n/a set wait
Referrals Arrival mode. One batch of patients enter per week. Arrival mode captured by label.
None None n/a set wait
Direct admissions
Arrival mode. One batch of patients enter per week. Arrival mode captured by label.
None None n/a set wait
Pre-admission - general
set wait Sets wait time until arrival into hospital sampled from arrival hour distribution dependent on ED or ambulatory arrival.
None None Start points pt info
pt info Calculate if patient will be admitted (admit includes movement to CDU, discharge includes movement to ambulatory AMU), patient age and patient NEWS. Route out on arrival mode label.
None None set wait Pre-admission locations
Pre-admission locations*
ED Preadmission route (preadmission, admitted wards, discharge locations). ED length of stay. Counts if patient breaches 4 hour target. Labels patient as direct admission.
Proc_PreAdmRoute
Proc_LOS
ED Bed. Assigned in workstation. Wait in queue if not available.
pt info Route
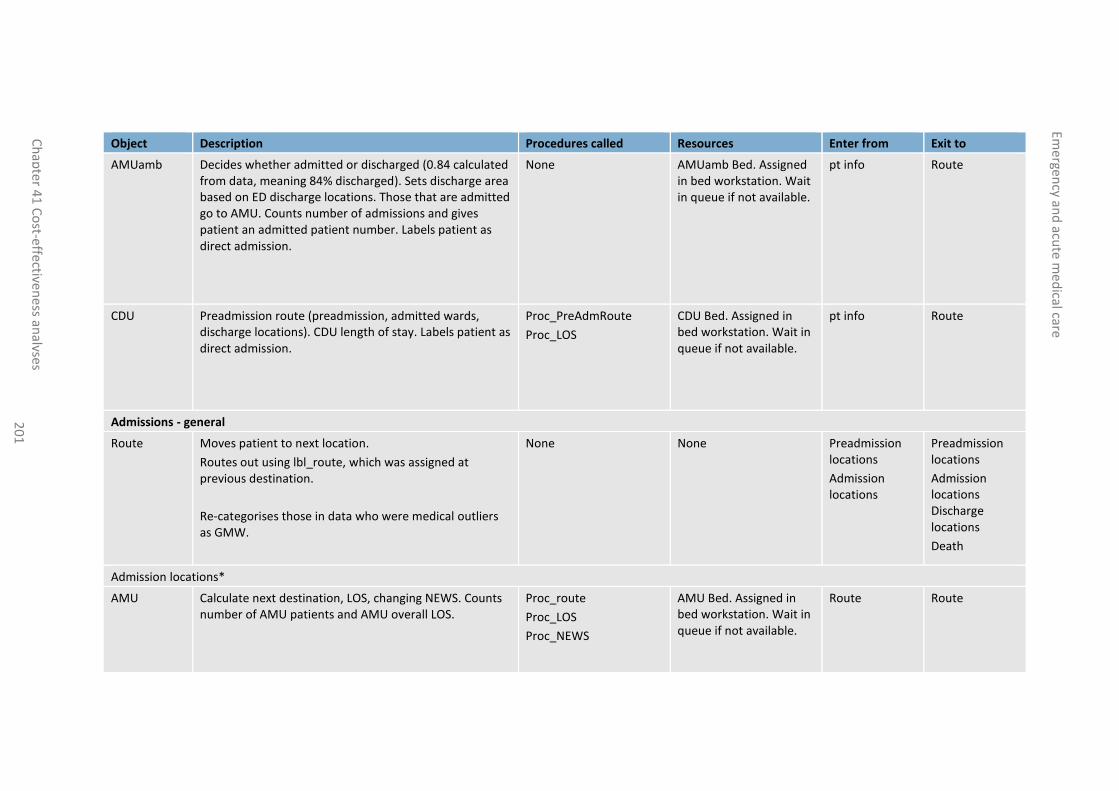
Emergen
cy and
acute m
edical care
Ch
apte
r 41
Co
st-effectiveness an
alyses 2
01
Object Description Procedures called Resources Enter from Exit to
AMUamb
Decides whether admitted or discharged (0.84 calculated from data, meaning 84% discharged). Sets discharge area based on ED discharge locations. Those that are admitted go to AMU. Counts number of admissions and gives patient an admitted patient number. Labels patient as direct admission.
None AMUamb Bed. Assigned in bed workstation. Wait in queue if not available.
pt info Route
CDU
Preadmission route (preadmission, admitted wards, discharge locations). CDU length of stay. Labels patient as direct admission.
Proc_PreAdmRoute
Proc_LOS
CDU Bed. Assigned in bed workstation. Wait in queue if not available.
pt info Route
Admissions - general
Route Moves patient to next location.
Routes out using lbl_route, which was assigned at previous destination.
Re-categorises those in data who were medical outliers as GMW.
None None Preadmission locations
Admission locations
Preadmission locations
Admission locations Discharge locations
Death
Admission locations*
AMU
Calculate next destination, LOS, changing NEWS. Counts number of AMU patients and AMU overall LOS.
Proc_route
Proc_LOS
Proc_NEWS
AMU Bed. Assigned in bed workstation. Wait in queue if not available.
Route Route

Emergen
cy and
acute m
edical care
Ch
apte
r 41
Co
st-effectiveness an
alyses 2
02
Object Description Procedures called Resources Enter from Exit to
GMW
Calculate next destination, LOS, changing NEWS. Proc_route
Proc_LOS
Proc_NEWS
GMW Bed. Assigned in bed workstation. Wait in queue if not available.
Route Route
Outlier
Calculate next destination, LOS, changing NEWS. Counts number of medical outliers created in the simulation.
Proc_route
Proc_LOS
Proc_NEWS
Outlier Bed. Assigned in bed workstation. Wait in queue if not available.
Route Route
Rehab
Calculate next destination, LOS, changing NEWS. Proc_route
Proc_LOS
Proc_NEWS
Rehab Bed. Assigned in bed workstation. Wait in queue if not available.
Route Route
ICU
Calculate next destination, LOS, changing NEWS. Proc_route
Proc_LOS
Proc_NEWS
ICU Bed. Assigned in bed workstation. Wait in queue if not available.
Route Route
HCU
Calculate next destination, LOS, changing NEWS. Proc_route
Proc_LOS
Proc_NEWS
HCU Bed. Assigned in bed workstation. Wait in queue if not available.
Route Route
Change bed Changes resource used for patients waiting for a rehab ward bed when determined by decision rule.
None Change from current bed to GMW bed
Queue to rehab Queue to rehab
Discharge locations
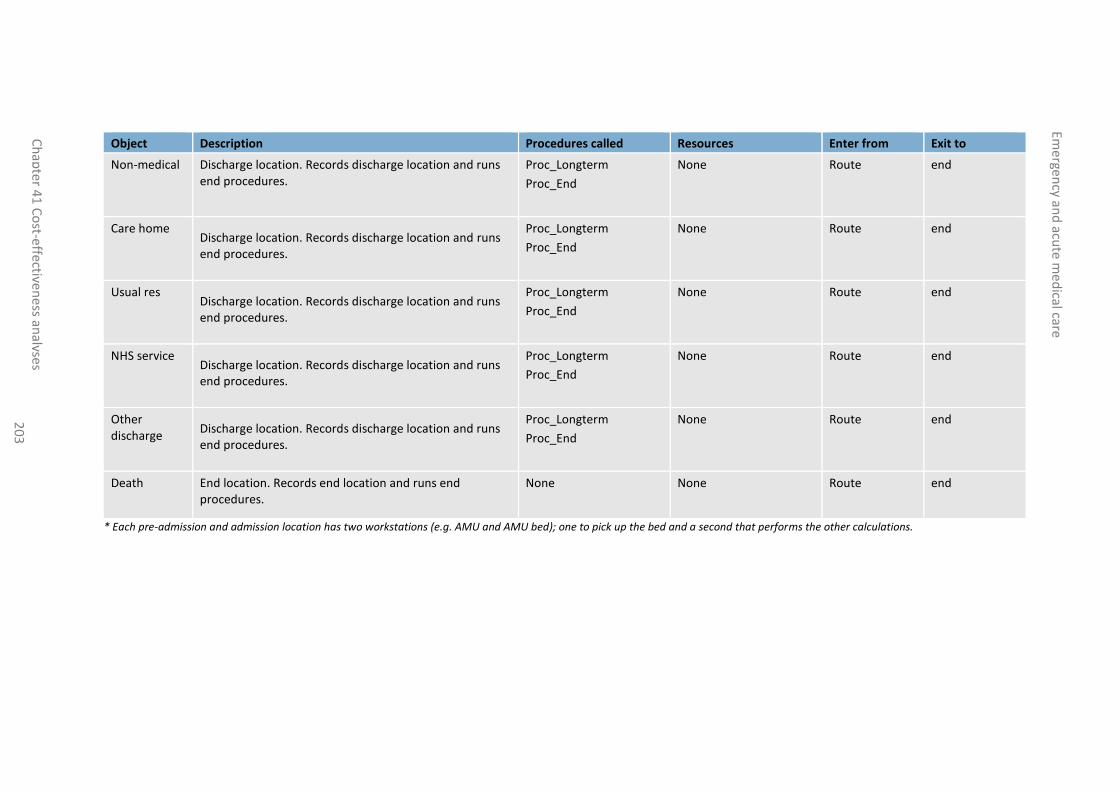
Emergen
cy and
acute m
edical care
Ch
apte
r 41
Co
st-effectiveness an
alyses 2
03
Object Description Procedures called Resources Enter from Exit to
Non-medical Discharge location. Records discharge location and runs end procedures.
Proc_Longterm
Proc_End
None Route end
Care home Discharge location. Records discharge location and runs end procedures.
Proc_Longterm
Proc_End
None Route end
Usual res Discharge location. Records discharge location and runs end procedures.
Proc_Longterm
Proc_End
None Route end
NHS service Discharge location. Records discharge location and runs end procedures.
Proc_Longterm
Proc_End
None Route end
Other discharge
Discharge location. Records discharge location and runs end procedures.
Proc_Longterm
Proc_End
None Route end
Death End location. Records end location and runs end procedures.
None None Route end
* Each pre-admission and admission location has two workstations (e.g. AMU and AMU bed); one to pick up the bed and a second that performs the other calculations.
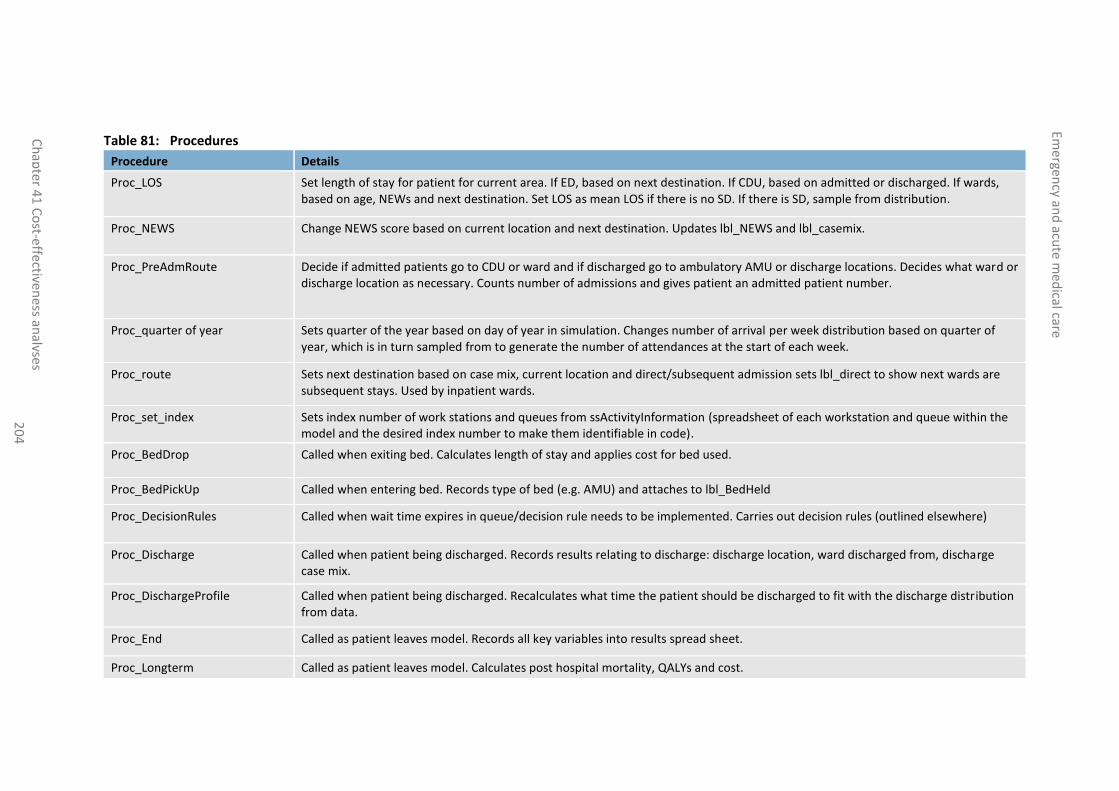
Emergen
cy and
acute m
edical care
Ch
apte
r 41
Co
st-effectiveness an
alyses 2
04
Table 81: Procedures
Procedure Details
Proc_LOS Set length of stay for patient for current area. If ED, based on next destination. If CDU, based on admitted or discharged. If wards, based on age, NEWs and next destination. Set LOS as mean LOS if there is no SD. If there is SD, sample from distribution.
Proc_NEWS Change NEWS score based on current location and next destination. Updates lbl_NEWS and lbl_casemix.
Proc_PreAdmRoute Decide if admitted patients go to CDU or ward and if discharged go to ambulatory AMU or discharge locations. Decides what ward or discharge location as necessary. Counts number of admissions and gives patient an admitted patient number.
Proc_quarter of year Sets quarter of the year based on day of year in simulation. Changes number of arrival per week distribution based on quarter of year, which is in turn sampled from to generate the number of attendances at the start of each week.
Proc_route Sets next destination based on case mix, current location and direct/subsequent admission sets lbl_direct to show next wards are subsequent stays. Used by inpatient wards.
Proc_set_index Sets index number of work stations and queues from ssActivityInformation (spreadsheet of each workstation and queue within the model and the desired index number to make them identifiable in code).
Proc_BedDrop Called when exiting bed. Calculates length of stay and applies cost for bed used.
Proc_BedPickUp Called when entering bed. Records type of bed (e.g. AMU) and attaches to lbl_BedHeld
Proc_DecisionRules Called when wait time expires in queue/decision rule needs to be implemented. Carries out decision rules (outlined elsewhere)
Proc_Discharge Called when patient being discharged. Records results relating to discharge: discharge location, ward discharged from, discharge case mix.
Proc_DischargeProfile Called when patient being discharged. Recalculates what time the patient should be discharged to fit with the discharge distribution from data.
Proc_End Called as patient leaves model. Records all key variables into results spread sheet.
Proc_Longterm Called as patient leaves model. Calculates post hospital mortality, QALYs and cost.

Emergency and acute medical care
Chapter 41 Cost-effectiveness analyses 205
Appendix H: Additional simulation model results See separate spreadsheet.

Emergency and acute medical care
Chapter 41 Cost-effectiveness analyses 206
Appendix I: Unit costs This appendix contains unit costs presented to the committee to aid their consideration of cost effectiveness. These unit costs were not necessarily used in the models.
Table 82: Unit costs of staff time
Health care professional Costs per hour
Notes
Medical Consultant £140
Surgical Consultant £142
Associate Specialist £124
Registrar £61 Weighted average unit cost across 3 categories of working hours (40-hour week, 48-hour week and 56-hour week).
Foundation House Officer 2 £41
Foundation House Officer 1 £39
Nurse (24-hour ward) £44 Includes staff nurse, registered nurse and registered practitioner.
Nurse team leader £49 Includes deputy ward/unit manager, ward team leader and senior staff nurse.
Paramedic (qualified) £33
Community based GP £195 Patient contact, includes direct care staff cost. Does not include travel.
Hospital pharmacist £48
Hospital physiotherapist £38
Hospital occupational therapist
£36
Social worker £57
Source: Unit costs of health and social care 201449 including salary, salary-on-costs, overheads, qualifications and training (for non-consultant staff).
Table 83: Unit costs of emergency department attendances
Mean unit cost
Notes
ED admitted £138 Weighted average for type 01 (Emergency departments), Type 02(consultant-led monospeciality A&E departments) and Type 03(Other types of A&E or minor injury [include minor injury units and urgent care centres]).
Patients who are admitted for further investigation and treatment rather than discharged from A&E.
ED non-admitted £114 Weighted average for type 01 (Emergency departments), Type 02(consultant-led monospeciality A&E departments) and Type 03(Other types of A&E or minor injury [include minor injury units and urgent care centres]).
Patients who are not admitted but are discharged or die whilst in A&E.
Minor injury units/urgent care centre visit
£67 Weighted average for Type 03 (other types of A&E or minor injury [include minor injury units and urgent care centres]). Either stand-alone or co-located but reported separately from the ED activity.
Walk-in centre visit £46 Weighted average for Type 04 (walk-in centres). Walk-in centres are defined as predominantly nurse-led primary care facilities dealing with illnesses and injuries - including infections and rashes, fractures and lacerations, emergency contraception and advice, stomach upsets, cuts and bruises, or minor burns and strains - without the need to register or make an appointment. They are not designed for treating long-term conditions or immediately life-threatening problems.
Source: National Schedule for Reference Costs 2013-2014.55
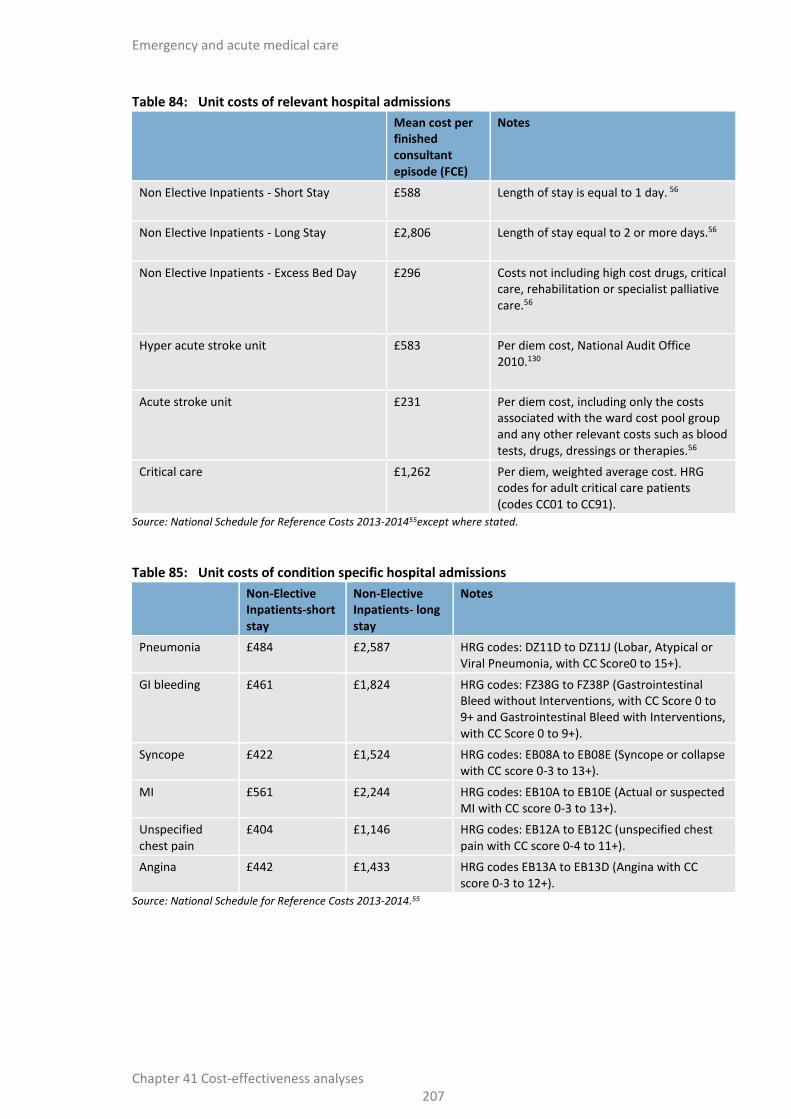
Emergency and acute medical care
Chapter 41 Cost-effectiveness analyses 207
Table 84: Unit costs of relevant hospital admissions
Mean cost per finished consultant episode (FCE)
Notes
Non Elective Inpatients - Short Stay £588 Length of stay is equal to 1 day. 56
Non Elective Inpatients - Long Stay £2,806 Length of stay equal to 2 or more days.56
Non Elective Inpatients - Excess Bed Day £296 Costs not including high cost drugs, critical care, rehabilitation or specialist palliative care.56
Hyper acute stroke unit £583 Per diem cost, National Audit Office 2010.130
Acute stroke unit £231 Per diem cost, including only the costs associated with the ward cost pool group and any other relevant costs such as blood tests, drugs, dressings or therapies.56
Critical care £1,262 Per diem, weighted average cost. HRG codes for adult critical care patients (codes CC01 to CC91).
Source: National Schedule for Reference Costs 2013-201455except where stated.
Table 85: Unit costs of condition specific hospital admissions
Non-Elective Inpatients-short stay
Non-Elective Inpatients- long stay
Notes
Pneumonia £484 £2,587 HRG codes: DZ11D to DZ11J (Lobar, Atypical or Viral Pneumonia, with CC Score0 to 15+).
GI bleeding £461 £1,824 HRG codes: FZ38G to FZ38P (Gastrointestinal Bleed without Interventions, with CC Score 0 to 9+ and Gastrointestinal Bleed with Interventions, with CC Score 0 to 9+).
Syncope £422 £1,524 HRG codes: EB08A to EB08E (Syncope or collapse with CC score 0-3 to 13+).
MI £561 £2,244 HRG codes: EB10A to EB10E (Actual or suspected MI with CC score 0-3 to 13+).
Unspecified chest pain
£404 £1,146 HRG codes: EB12A to EB12C (unspecified chest pain with CC score 0-4 to 11+).
Angina £442 £1,433 HRG codes EB13A to EB13D (Angina with CC score 0-3 to 12+).
Source: National Schedule for Reference Costs 2013-2014.55

Emergency and acute medical care
Chapter 41 Cost-effectiveness analyses 208
Table 86: UK costs of diagnostic tests and referrals
Staff type Unit cost
X-ray £30
Biochemistry £1
Haematology £3
Microbiology £7
Electrocardiography £52
Source: NHS National Schedule of Reference Costs.55
Table 87: Unit costs for ambulance service
Currency Description Activity
National Average Unit Cost
Lower Quartile Unit Cost
Upper Quartile Unit Cost
No. Data Submissions
Calls 8,926,215 £7 £6 £8 11
Hear and treat or refer 400,005 £44 £37 £44 11
See and treat or refer 2,113,757 £180 £155 £188 11
See and treat and convey 5,069,806 £231 £206 £254 11
Source: NHS National Schedule of Reference Costs.55