chapter 48 neurons, synapses, and signaling · sodium- potassium pump potassium channel sodium...
TRANSCRIPT

Chapter 48
Neurons, Synapses, and
Signaling

Overview: Lines of Communication
• The cone snail kills prey with venom that disables neurons
• Neurons are nerve cells that transfer information within the body
• Neurons use two types of signals to communicate: electrical signals (long-distance) and chemical signals (short-distance)
© 2011 Pearson Education, Inc.
• Interpreting signals in the nervous system involves sorting a complex set of paths and connections
• Processing of information takes place in simple clusters of neurons called ganglia or a more complex organization of neurons called a brain
© 2011 Pearson Education, Inc.
Concept 48.1: Neuron organization and
structure reflect function in information
transfer
• The squid possesses extremely large nerve cells
and has played a crucial role in the discovery of
how neurons transmit signals
© 2011 Pearson Education, Inc.

Ganglia
Brain
Arm
Nerve Eye Mantle
Nerves with giant axons
Figure 48.2

Introduction to Information Processing
• Nervous systems process information in three
stages: sensory input, integration, and motor
output
© 2011 Pearson Education, Inc.

• Sensors detect external stimuli and internal conditions and transmit information along sensory neurons
• Sensory information is sent to the brain or ganglia, where interneurons integrate the information
• Motor output leaves the brain or ganglia via motor neurons, which trigger muscle or gland activity
© 2011 Pearson Education, Inc.
• Many animals have a complex nervous system that consists of
– A central nervous system (CNS) where integration takes place; this includes the brain and a nerve cord
– A peripheral nervous system (PNS), which carries information into and out of the CNS
– The neurons of the PNS, when bundled together, form nerves
© 2011 Pearson Education, Inc.

Figure 48.3
Sensor
Effector
Sensory input
Motor output
Integration
Peripheral nervous
system (PNS)
Central nervous
system (CNS)

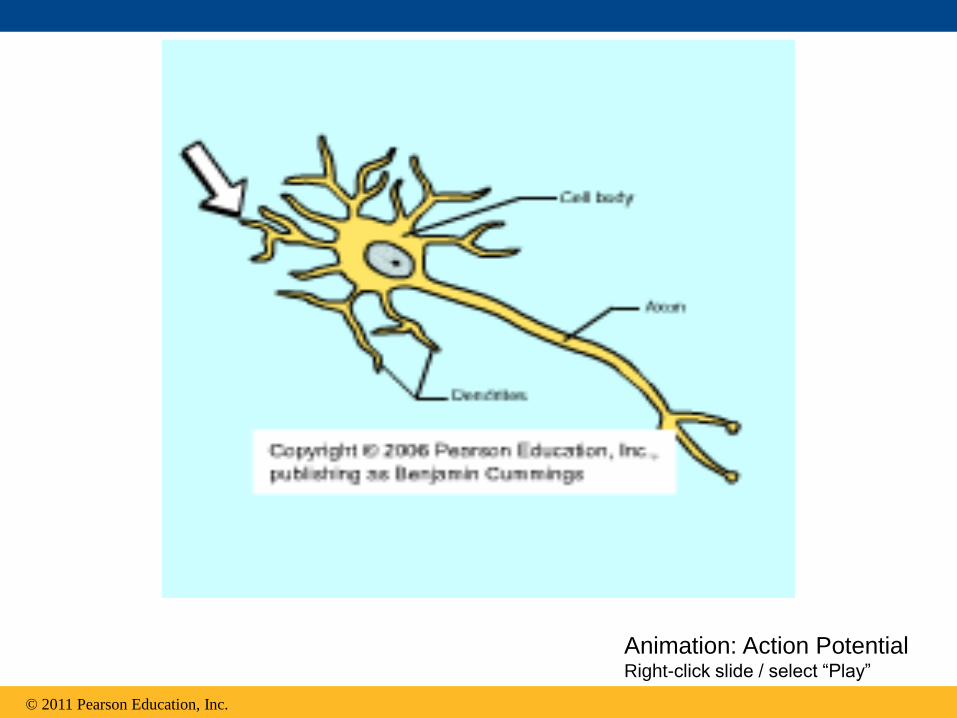
Neuron Structure and Function
• Most of a neuron’s organelles are in the cell body
• Most neurons have dendrites, highly branched extensions that receive signals from other neurons
• The axon is typically a much longer extension that transmits signals to other cells at synapses
• The cone-shaped base of an axon is called the axon hillock
© 2011 Pearson Education, Inc.

Figure 48.4
Nucleus
Dendrites
Stimulus
Axon hillock
Cell
body
Presynaptic
cell
Signal
direction
Axon
Synapse
Neurotransmitter
Synaptic terminals
Postsynaptic cell
Synaptic
terminals
• The synaptic terminal of one axon passes
information across the synapse in the form of
chemical messengers called neurotransmitters
• A synapse is a junction between an axon and
another cell
• Information is transmitted from a presynaptic
cell (a neuron) to a postsynaptic cell (a
neuron, muscle, or gland cell)
• Most neurons are nourished or insulated by
cells called glia
© 2011 Pearson Education, Inc.

Dendrites
Axon
Cell
body
Portion
of axon
Sensory neuron Interneurons Motor neuron
Figure 48.5

Figure 48.6
Glia
80 m
Cell bodies of neurons

Concept 48.2: Ion pumps and ion channels
establish the resting potential of a neuron
• Every cell has a voltage (difference in electrical
charge) across its plasma membrane called a
membrane potential
• The resting potential is the membrane potential
of a neuron not sending signals
• Changes in membrane potential act as signals,
transmitting and processing information
© 2011 Pearson Education, Inc.

Formation of the Resting Potential
• In a mammalian neuron at resting potential, the
concentration of K+ is highest inside the cell,
while the concentration of Na+ is highest outside
the cell
• Sodium-potassium pumps use the energy of
ATP to maintain these K+ and Na+ gradients
across the plasma membrane
• These concentration gradients represent
chemical potential energy
© 2011 Pearson Education, Inc.

• The opening of ion channels in the plasma
membrane converts chemical potential to electrical
potential
• A neuron at resting potential contains many open
K+ channels and fewer open Na+ channels; K+
diffuses out of the cell
• The resulting buildup of negative charge within the
neuron is the major source of membrane potential
© 2011 Pearson Education, Inc.

© 2011 Pearson Education, Inc.
Animation: Resting Potential Right-click slide / select “Play”

Table 48.1

Key Na
K
Sodium- potassium pump
Potassium channel
Sodium channel
OUTSIDE OF CELL
INSIDE OF CELL
Figure 48.7

Modeling the Resting Potential
• Resting potential can be modeled by an artificial membrane that separates two chambers
– The concentration of KCl is higher in the inner chamber and lower in the outer chamber
– K+ diffuses down its gradient to the outer chamber
– Negative charge (Cl–) builds up in the inner chamber
• At equilibrium, both the electrical and chemical gradients are balanced
© 2011 Pearson Education, Inc.

Figure 48.8
Inner chamber
90 mV 62 mV Outer chamber
Inner chamber
Outer chamber
140 mM
KCl
150 mM
NaCl
5 mM
KCl
15 mM
NaCl
Potassium channel
Sodium channel
Artificial membrane
K Na Cl
Cl
(a) Membrane selectively permeable to K
(b) Membrane selectively permeable to Na
EK 62 mV 90 mV ENa 62 mV 62 mV
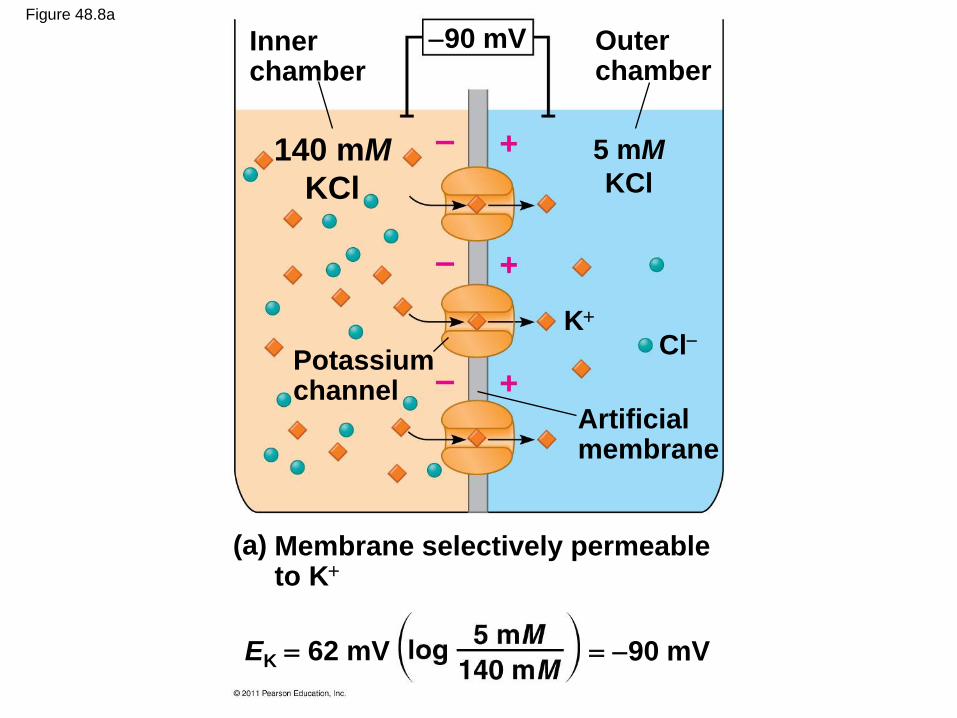
Figure 48.8a
Inner chamber
90 mV Outer chamber
140 mM
KCl
5 mM
KCl
Potassium channel
Artificial membrane
K Cl
(a) Membrane selectively permeable to K
EK 62 mV 90 mV

• The equilibrium potential (Eion) is the membrane voltage for a particular ion at equilibrium and can be calculated using the Nernst equation
Eion = 62 mV (log[ion]outside/[ion]inside)
• The equilibrium potential of K+ (EK) is negative, while the equilibrium potential of Na+ (ENa) is positive
© 2011 Pearson Education, Inc.
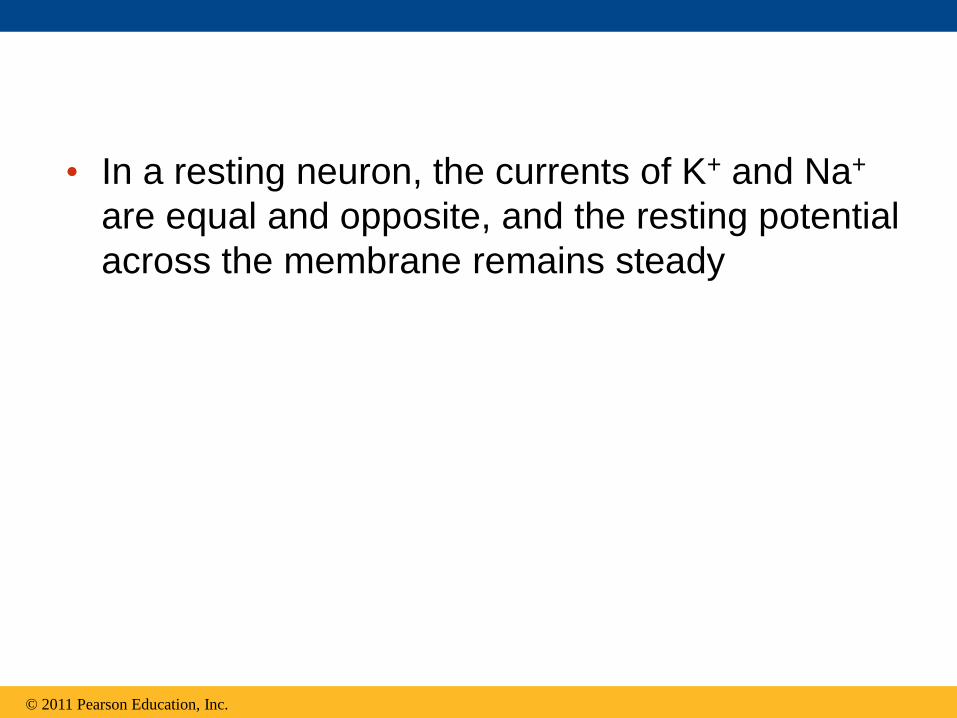
• In a resting neuron, the currents of K+ and Na+
are equal and opposite, and the resting potential
across the membrane remains steady
© 2011 Pearson Education, Inc.
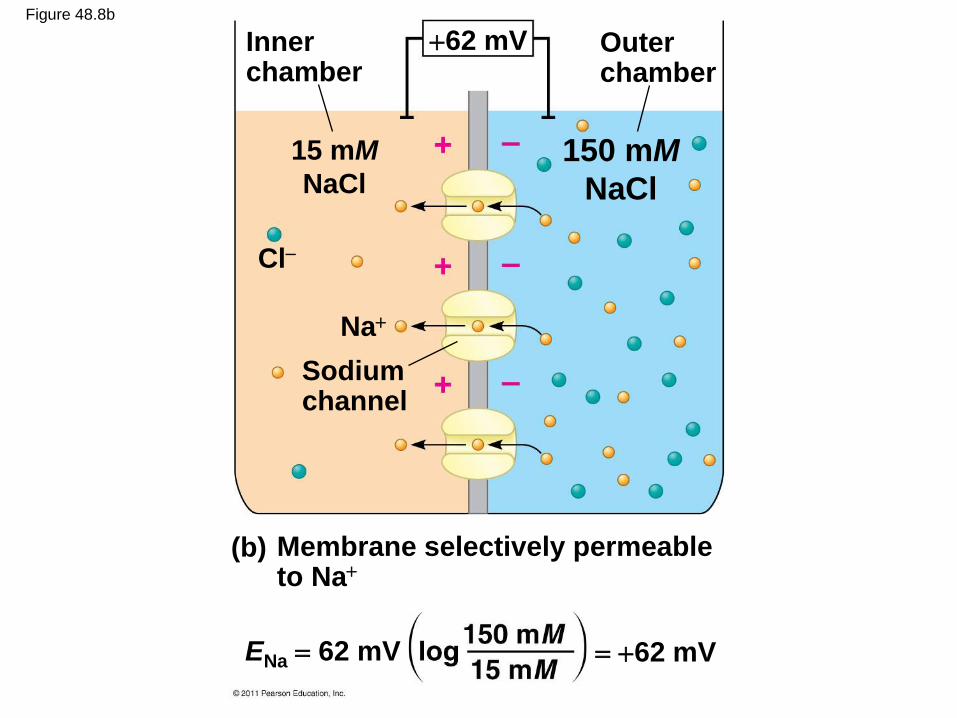
Figure 48.8b
62 mV Inner chamber
Outer chamber
150 mM
NaCl
15 mM
NaCl
Sodium channel
Na
Cl
(b) Membrane selectively permeable to Na
ENa 62 mV 62 mV

Concept 48.3: Action potentials are the
signals conducted by axons
• Changes in membrane potential occur because
neurons contain gated ion channels that open
or close in response to stimuli
© 2011 Pearson Education, Inc.
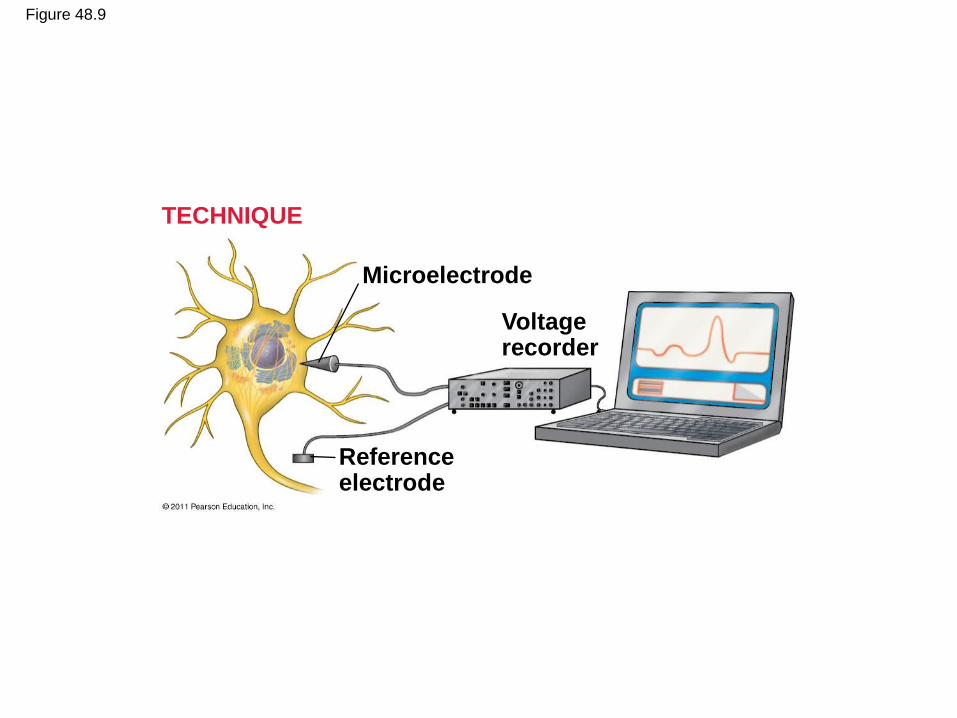
Figure 48.9
Microelectrode
Voltage recorder
Reference electrode
TECHNIQUE
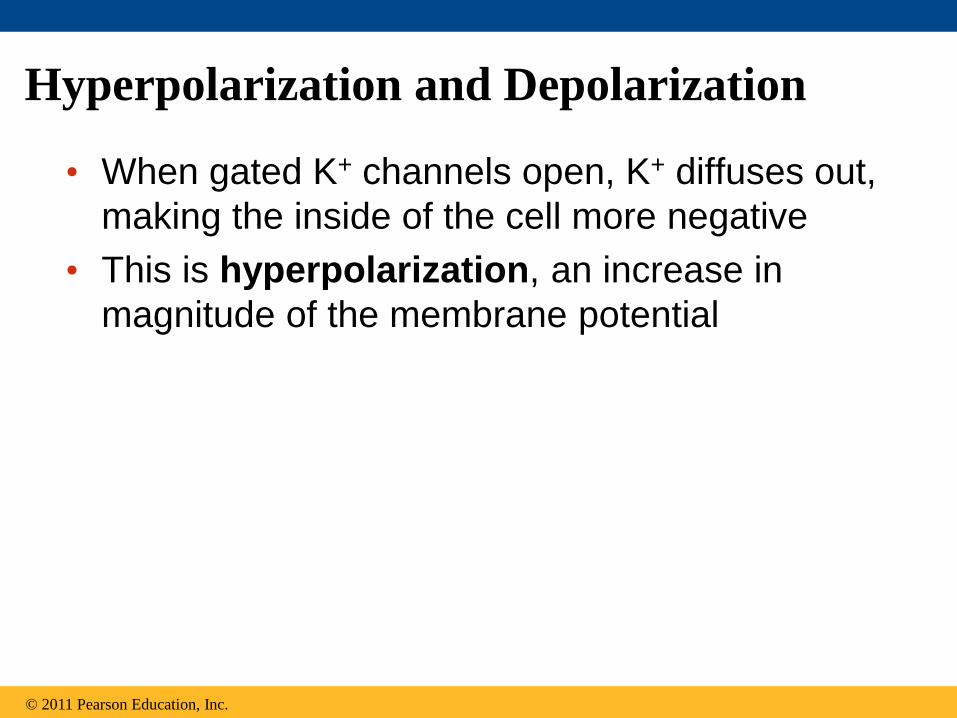
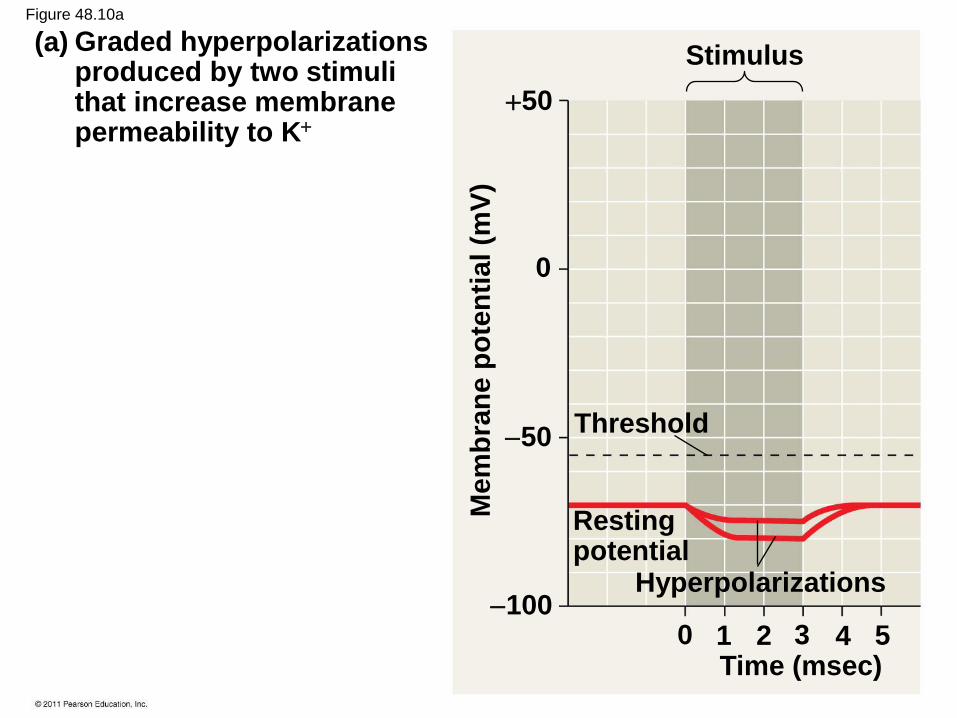
• When gated K+ channels open, K+ diffuses out,
making the inside of the cell more negative
• This is hyperpolarization, an increase in
magnitude of the membrane potential
© 2011 Pearson Education, Inc.
Hyperpolarization and Depolarization
Stimulus
Threshold
Resting potential
Hyperpolarizations
Time (msec)
50
0
50
100 1 0 2 3 4 5
50
0
50
100
50
0
50
100
Time (msec)
1 0 2 3 4 5 Time (msec) 1 0 2 3 4 5 6
Threshold
Resting potential
Threshold
Resting potential
Stimulus Strong depolarizing stimulus
Action potential
Depolarizations
Me
mb
ran
e p
ote
nti
al
(mV
)
Me
mb
ran
e p
ote
nti
al
(mV
)
Me
mb
ran
e p
ote
nti
al
(mV
)
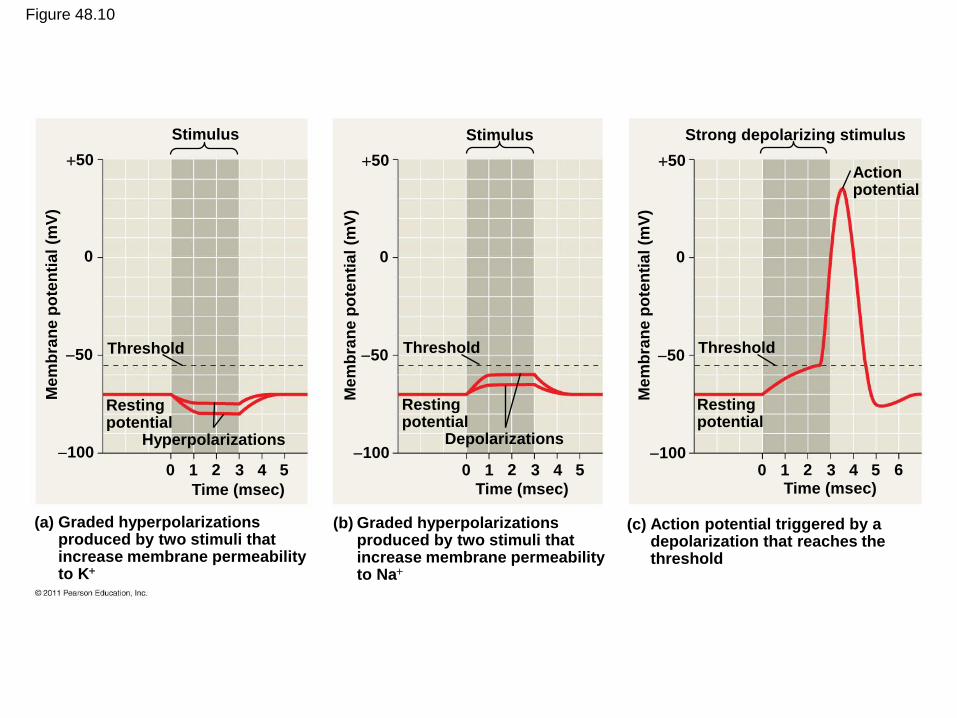
(a) Graded hyperpolarizations produced by two stimuli that increase membrane permeability to K
(b) Graded hyperpolarizations produced by two stimuli that increase membrane permeability to Na
(c) Action potential triggered by a depolarization that reaches the threshold
Figure 48.10
Stimulus
Threshold
Resting potential
Hyperpolarizations
Time (msec)
50
0
50
100 1 0 2 3 4 5
Me
mb
ran
e p
ote
nti
al
(mV
)
(a) Graded hyperpolarizations produced by two stimuli that increase membrane permeability to K
Figure 48.10a

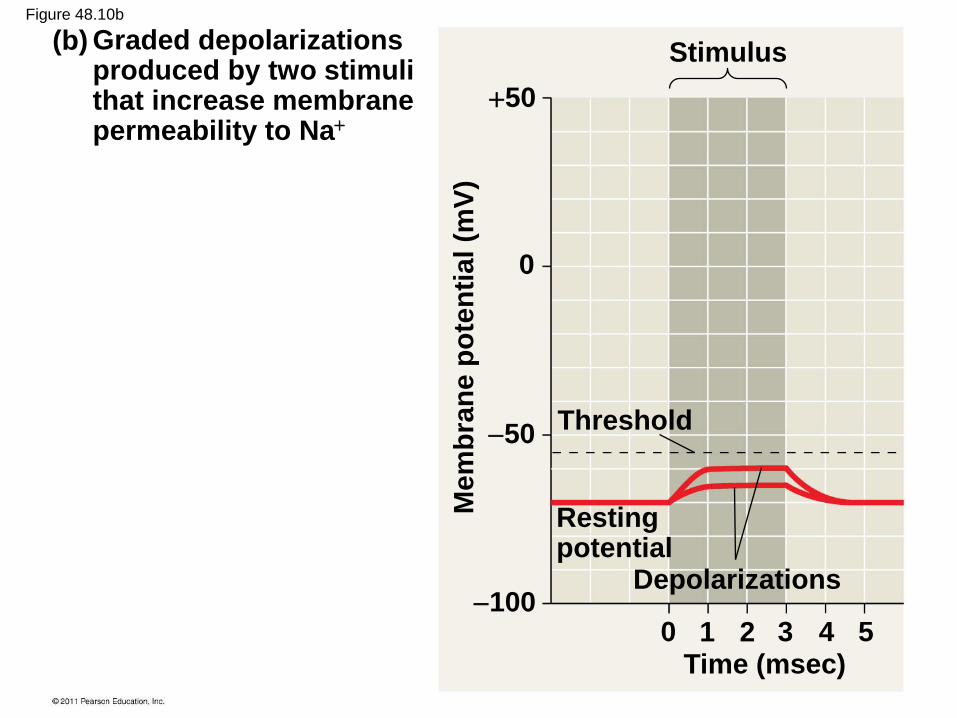
• Opening other types of ion channels triggers a
depolarization, a reduction in the magnitude of
the membrane potential
• For example, depolarization occurs if gated Na+
channels open and Na+ diffuses into the cell
© 2011 Pearson Education, Inc.
Stimulus
Threshold
Resting potential
Depolarizations
Time (msec)
50
0
50
100 1 0 2 3 4 5
Mem
bra
ne p
ote
nti
al
(mV
)
(b) Graded depolarizations produced by two stimuli that increase membrane permeability to Na
Figure 48.10b

• Graded potentials are changes in polarization where the magnitude of the change varies with the strength of the stimulus
• These are not the nerve signals that travel along axons, but they do have an effect on the generation of nerve signals
© 2011 Pearson Education, Inc.
Graded Potentials and Action Potentials
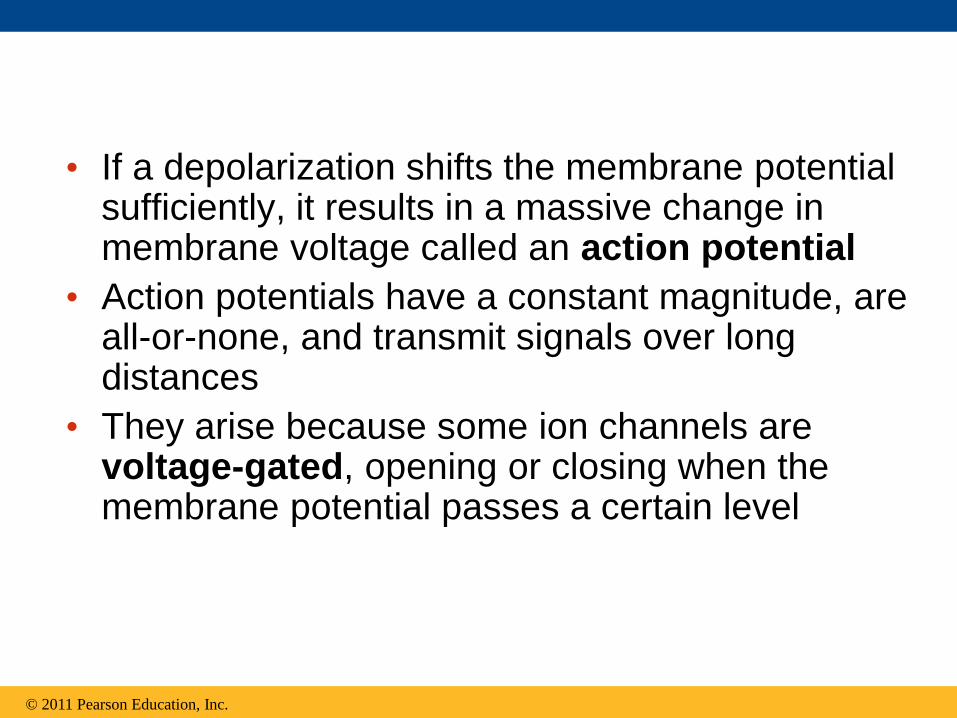
• If a depolarization shifts the membrane potential sufficiently, it results in a massive change in membrane voltage called an action potential
• Action potentials have a constant magnitude, are all-or-none, and transmit signals over long distances
• They arise because some ion channels are voltage-gated, opening or closing when the membrane potential passes a certain level
© 2011 Pearson Education, Inc.

Strong depolarizing stimulus
Threshold
Resting potential
Time (msec)
50
0
50
100 1 0 2 3 4 5
Mem
bra
ne
po
ten
tial
(mV
)
6
(c) Action potential triggered by a depolarization that reaches the threshold Action
potential
Figure 48.10c
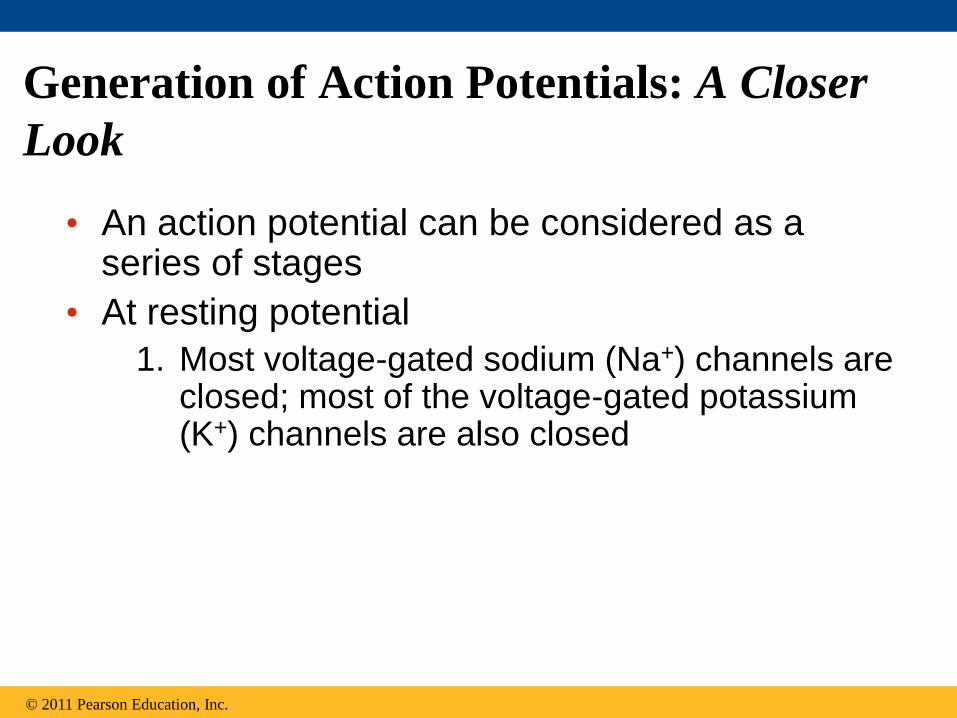
Generation of Action Potentials: A Closer
Look
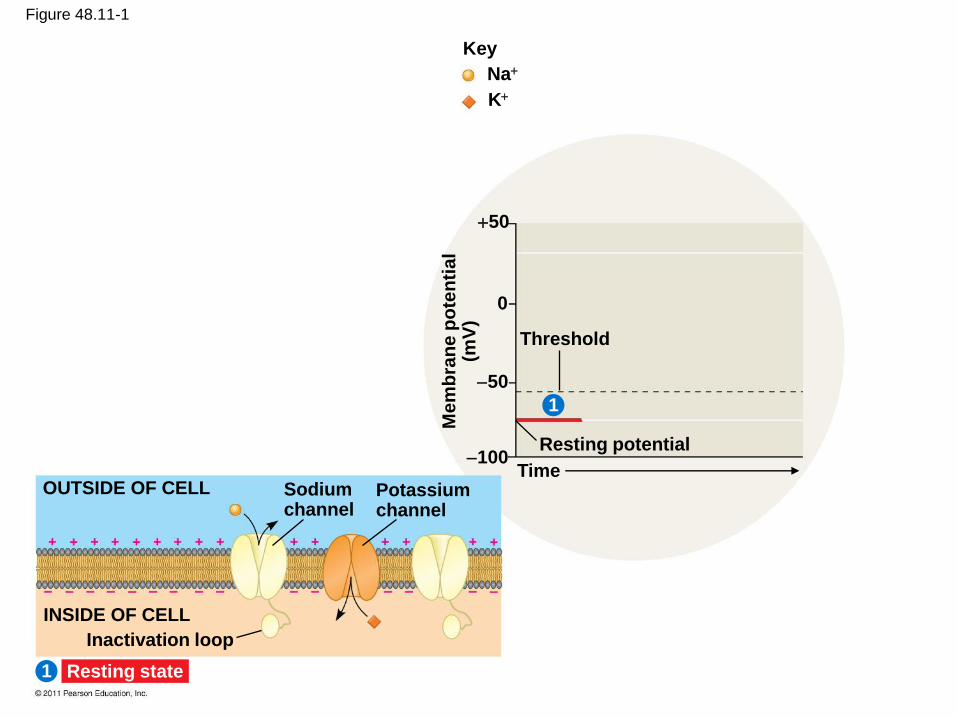
• An action potential can be considered as a series of stages
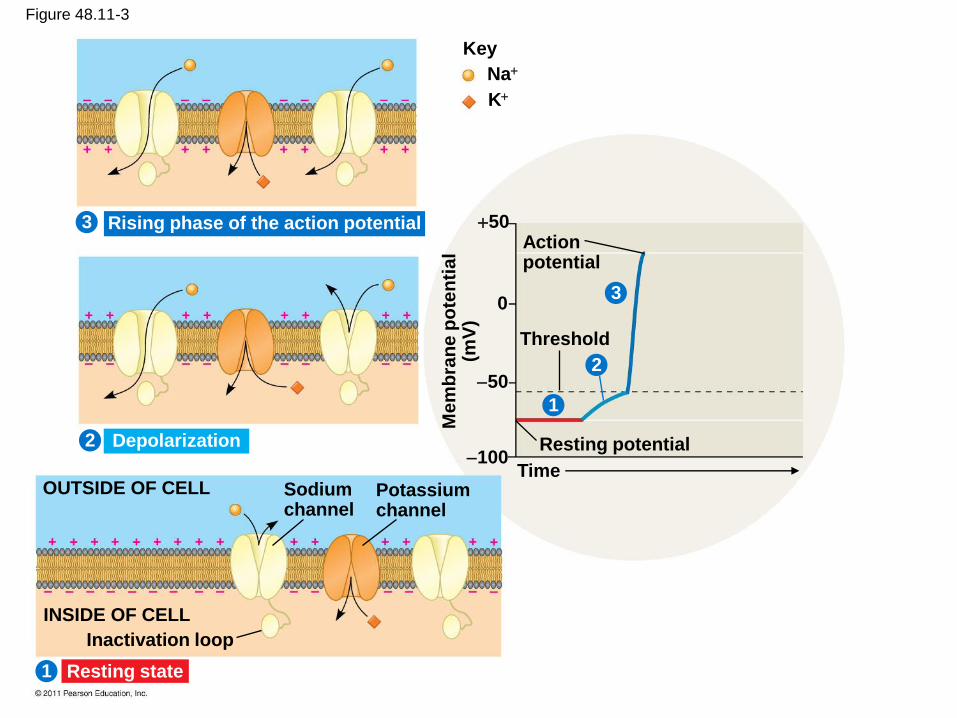
• At resting potential
1. Most voltage-gated sodium (Na+) channels are closed; most of the voltage-gated potassium (K+) channels are also closed
© 2011 Pearson Education, Inc.
OUTSIDE OF CELL
INSIDE OF CELL
Inactivation loop
Sodium channel
Potassium channel
Threshold
Resting potential
Time M
em
bra
ne p
ote
nti
al
(mV
)
50
100
50
0
Na
K
Key
1
1
Resting state
Figure 48.11-1

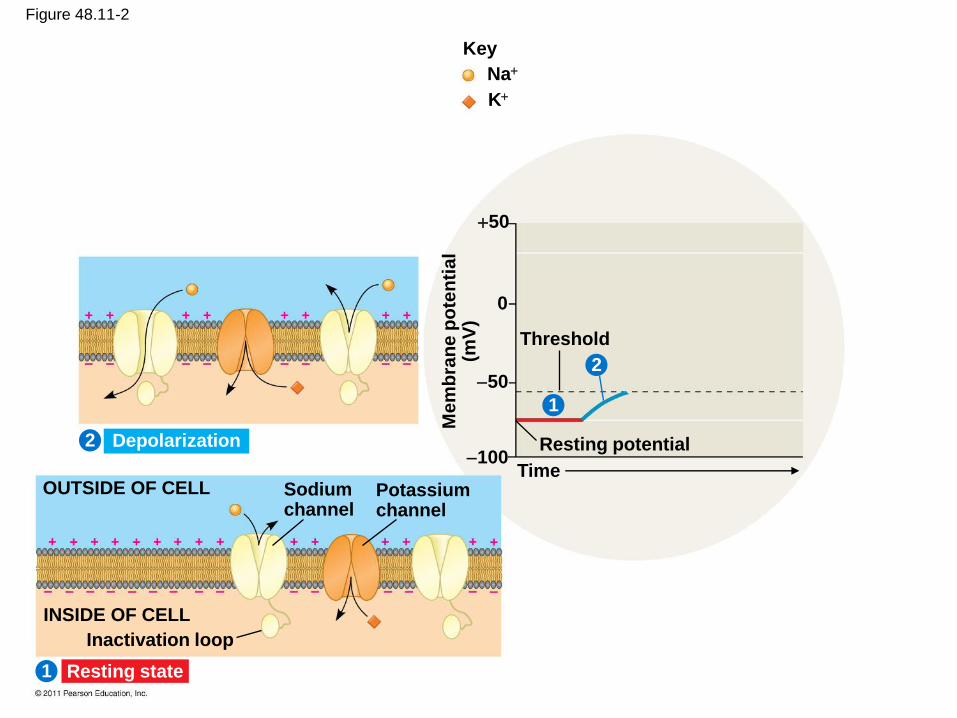
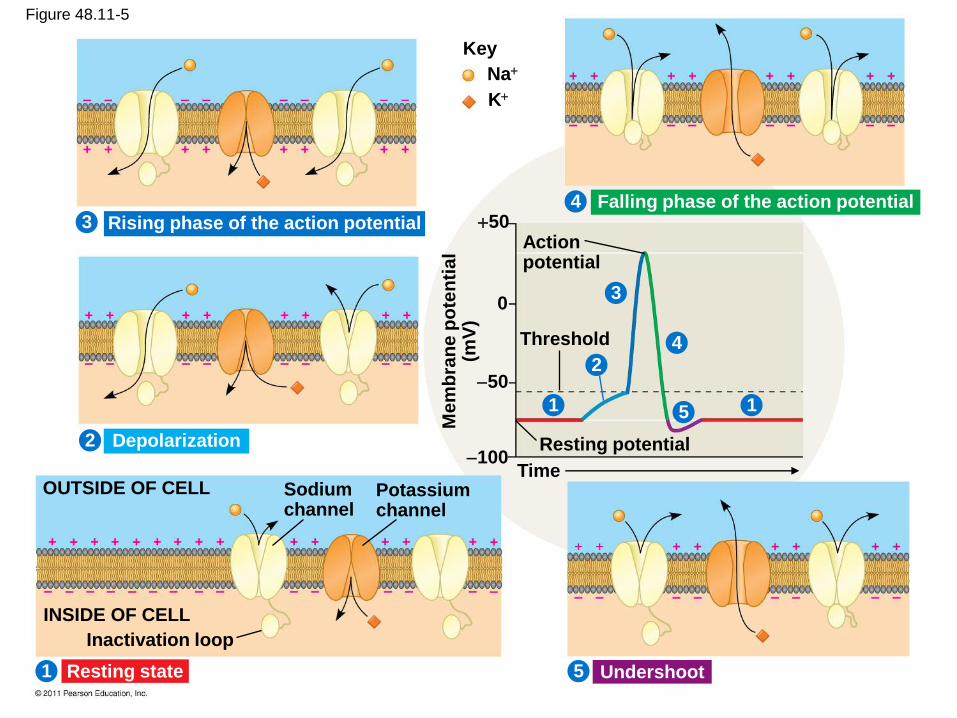
• When an action potential is generated
2. Voltage-gated Na+ channels open first and Na+
flows into the cell
3. During the rising phase, the threshold is
crossed, and the membrane potential increases
4. During the falling phase, voltage-gated Na+
channels become inactivated; voltage-gated K+
channels open, and K+ flows out of the cell
© 2011 Pearson Education, Inc.
OUTSIDE OF CELL
INSIDE OF CELL
Inactivation loop
Sodium channel
Potassium channel
Threshold
Resting potential
Time M
em
bra
ne p
ote
nti
al
(mV
)
50
100
50
0
Na
K
Key
2
1
1
2
Resting state
Depolarization
Figure 48.11-2
OUTSIDE OF CELL
INSIDE OF CELL
Inactivation loop
Sodium channel
Potassium channel
Action potential
Threshold
Resting potential
Time M
em
bra
ne p
ote
nti
al
(mV
)
50
100
50
0
Na
K
Key
2
1
3
1
2
3
Resting state
Depolarization
Rising phase of the action potential
Figure 48.11-3

OUTSIDE OF CELL
INSIDE OF CELL
Inactivation loop
Sodium channel
Potassium channel
Action potential
Threshold
Resting potential
Time M
em
bra
ne p
ote
nti
al
(mV
)
50
100
50
0
Na
K
Key
2
1
3 4
1
2
3
4
Resting state
Depolarization
Rising phase of the action potential Falling phase of the action potential
Figure 48.11-4
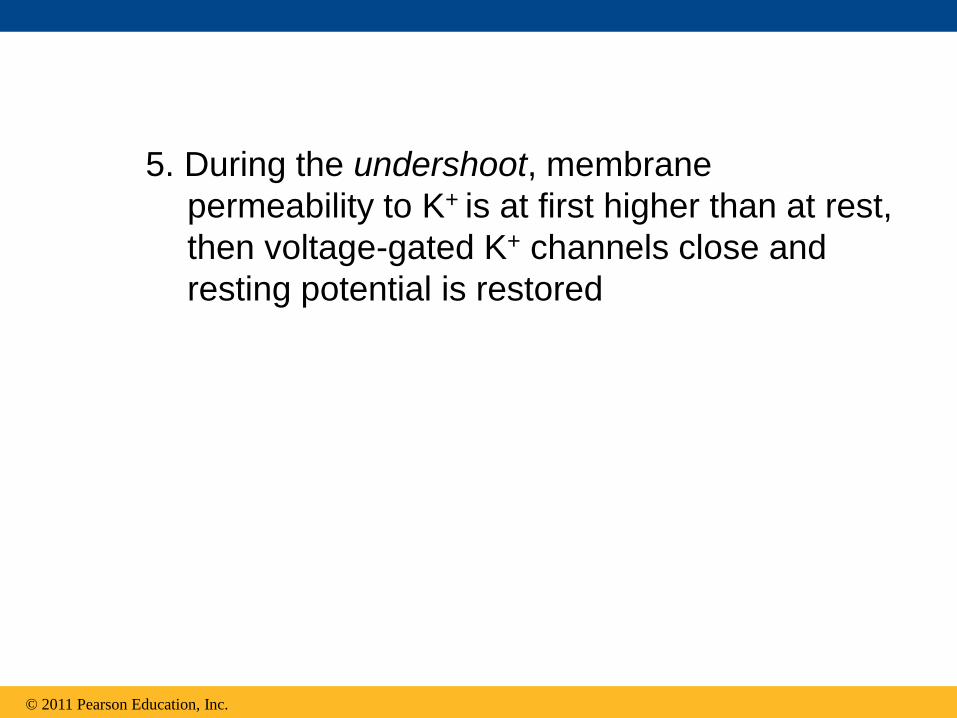
5. During the undershoot, membrane
permeability to K+ is at first higher than at rest,
then voltage-gated K+ channels close and
resting potential is restored
© 2011 Pearson Education, Inc.
OUTSIDE OF CELL
INSIDE OF CELL
Inactivation loop
Sodium channel
Potassium channel
Action potential
Threshold
Resting potential
Time M
em
bra
ne p
ote
nti
al
(mV
)
50
100
50
0
Na
K
Key
2
1
3 4
5
1
2
3
4
5 1
Resting state Undershoot
Depolarization
Rising phase of the action potential Falling phase of the action potential
Figure 48.11-5

Figure 48.11a
Action potential
Threshold
Resting potential
Time
Me
mb
ran
e p
ote
nti
al
(mV
)
50
100
50
0
1
2
3
4
5 1
• During the refractory period after an action
potential, a second action potential cannot be
initiated
• The refractory period is a result of a temporary
inactivation of the Na+ channels
© 2011 Pearson Education, Inc.
© 2011 Pearson Education, Inc.
Animation: Action Potential Right-click slide / select “Play”

Conduction of Action Potentials
• At the site where the action potential is generated, usually the axon hillock, an electrical current depolarizes the neighboring region of the axon membrane
• Action potentials travel in only one direction: toward the synaptic terminals
© 2011 Pearson Education, Inc.
• Inactivated Na+ channels behind the zone of
depolarization prevent the action potential from
traveling backwards
© 2011 Pearson Education, Inc.

Figure 48.12-1
Na
Action potential
Axon
Plasma membrane
Cytosol 1

Figure 48.12-2
K
K
Na
Na
Action potential
Axon
Plasma membrane
Cytosol
Action potential
2
1

Figure 48.12-3
K
K
K
K
Na
Na
Na
Action potential
Axon
Plasma membrane
Cytosol
Action potential
Action potential
2
1
3
Evolutionary Adaptation of Axon Structure
• The speed of an action potential increases with
the axon’s diameter
• In vertebrates, axons are insulated by a myelin
sheath, which causes an action potential’s
speed to increase
• Myelin sheaths are made by glia—
oligodendrocytes in the CNS and Schwann
cells in the PNS
© 2011 Pearson Education, Inc.
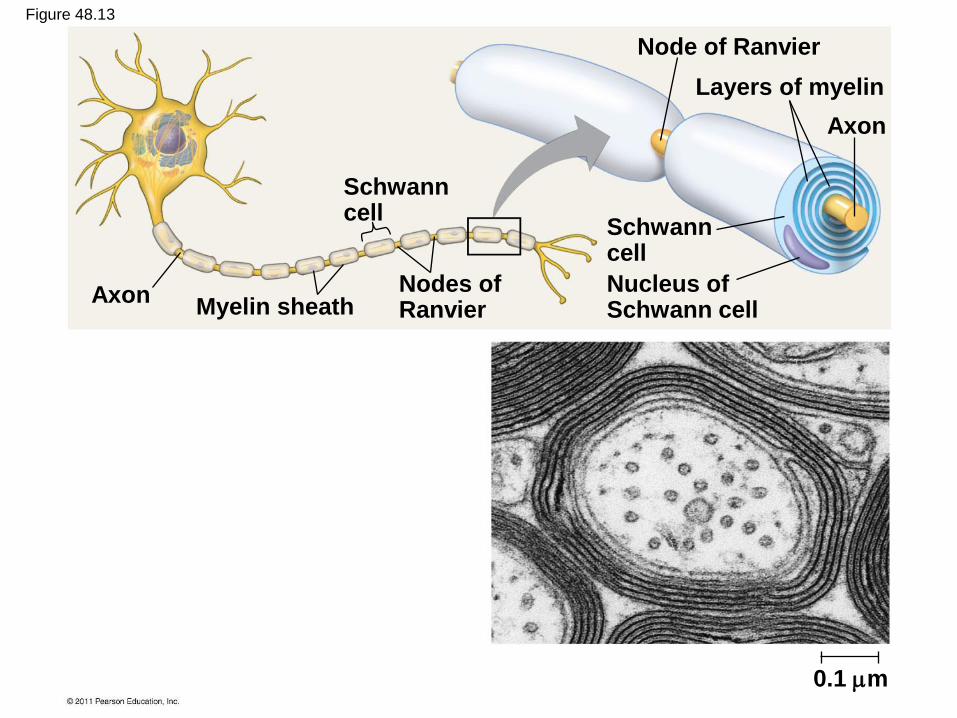
Axon Myelin sheath
Schwann cell
Nodes of Ranvier
Node of Ranvier
Layers of myelin
Axon
Schwann cell
Nucleus of Schwann cell
0.1 m
Figure 48.13

• Action potentials are formed only at nodes of
Ranvier, gaps in the myelin sheath where
voltage-gated Na+ channels are found
• Action potentials in myelinated axons jump
between the nodes of Ranvier in a process
called saltatory conduction
© 2011 Pearson Education, Inc.

Cell body
Schwann cell
Depolarized region (node of Ranvier)
Myelin sheath
Axon
Figure 48.14
Concept 48.4: Neurons communicate with
other cells at synapses
• At electrical synapses, the electrical current
flows from one neuron to another
• At chemical synapses, a chemical
neurotransmitter carries information across the
gap junction
• Most synapses are chemical synapses
© 2011 Pearson Education, Inc.
• The presynaptic neuron synthesizes and
packages the neurotransmitter in synaptic
vesicles located in the synaptic terminal
• The action potential causes the release of the
neurotransmitter
• The neurotransmitter diffuses across the
synaptic cleft and is received by the
postsynaptic cell
© 2011 Pearson Education, Inc.

© 2011 Pearson Education, Inc.
Animation: Synapse Right-click slide / select “Play”

Presynaptic cell
Postsynaptic cell
Axon
Presynaptic membrane
Synaptic vesicle containing neurotransmitter
Postsynaptic membrane
Synaptic cleft
Voltage-gated Ca2 channel
Ligand-gated ion channels
Ca2
Na
K
2
1
3
4
Figure 48.15
Generation of Postsynaptic Potentials
• Direct synaptic transmission involves binding of
neurotransmitters to ligand-gated ion channels
in the postsynaptic cell
• Neurotransmitter binding causes ion channels to
open, generating a postsynaptic potential
© 2011 Pearson Education, Inc.

• Postsynaptic potentials fall into two categories
– Excitatory postsynaptic potentials (EPSPs)
are depolarizations that bring the membrane
potential toward threshold
– Inhibitory postsynaptic potentials (IPSPs) are
hyperpolarizations that move the membrane
potential farther from threshold
© 2011 Pearson Education, Inc.

• After release, the neurotransmitter
– May diffuse out of the synaptic cleft
– May be taken up by surrounding cells
– May be degraded by enzymes
© 2011 Pearson Education, Inc.

Summation of Postsynaptic Potentials
• Most neurons have many synapses on their
dendrites and cell body
• A single EPSP is usually too small to trigger an
action potential in a postsynaptic neuron
© 2011 Pearson Education, Inc.
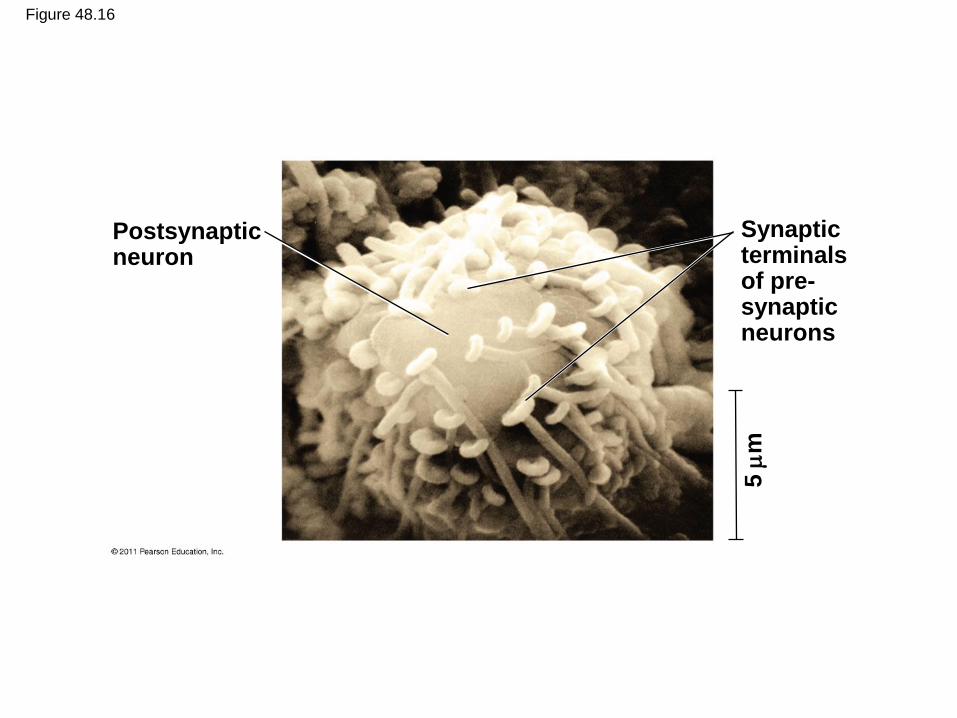
Figure 48.16
Postsynaptic neuron
Synaptic terminals of pre- synaptic neurons
5
m

Figure 48.17
Terminal branch of presynaptic neuron
Postsynaptic neuron
Axon hillock
E1
E2
E1
E2
E1
E2
E1
E2
I I I I
0
70
Me
mb
ran
e p
ote
nti
al (m
V)
Threshold of axon of postsynaptic neuron
Resting potential
Action potential
Action potential
I E1 E1 E1 E1 E1 E2 E1 I
Subthreshold, no summation
(a) (b) Temporal summation (c) Spatial summation Spatial summation of EPSP and IPSP
(d)
E1
• If two EPSPs are produced in rapid succession, an effect called temporal summation occurs
© 2011 Pearson Education, Inc.

Terminal branch of presynaptic neuron
Postsynaptic neuron
Axon hillock
E1
E2
E1
E2
I I
0
70
Mem
bra
ne p
ote
nti
al (m
V)
Threshold of axon of postsynaptic neuron
Resting potential
Action potential
E1 E1 E1 E1
Subthreshold, no summation
(a) (b) Temporal summation
Figure 48.17a

• In spatial summation, EPSPs produced nearly simultaneously by different synapses on the same postsynaptic neuron add together
• The combination of EPSPs through spatial and temporal summation can trigger an action potential
© 2011 Pearson Education, Inc.

E1
E2
E1
E2
I I
Action potential
I E1 E2 E1 I
(c) Spatial summation Spatial summation of EPSP and IPSP
(d)
E1
Figure 48.17b
• Through summation, an IPSP can counter the effect of an EPSP
• The summed effect of EPSPs and IPSPs determines whether an axon hillock will reach threshold and generate an action potential
© 2011 Pearson Education, Inc. © 2011 Pearson Education, Inc.
Modulated Signaling at Synapses
• In some synapses, a neurotransmitter binds to a
receptor that is metabotropic
• In this case, movement of ions through a
channel depends on one or more metabolic
steps
© 2011 Pearson Education, Inc.
• Binding of a neurotransmitter to a metabotropic
receptor activates a signal transduction pathway
in the postsynaptic cell involving a second
messenger
• Compared to ligand-gated channels, the effects
of second-messenger systems have a slower
onset but last longer
© 2011 Pearson Education, Inc.

Neurotransmitters
• There are more than 100 neurotransmitters,
belonging to five groups: acetylcholine, biogenic
amines, amino acids, neuropeptides, and gases
• A single neurotransmitter may have more than a
dozen different receptors
© 2011 Pearson Education, Inc.

Table 48.2

Acetylcholine
• Acetylcholine is a common neurotransmitter in vertebrates and invertebrates
• It is involved in muscle stimulation, memory formation, and learning
• Vertebrates have two major classes of acetylcholine receptor, one that is ligand gated and one that is metabotropic
© 2011 Pearson Education, Inc.

Amino Acids
• Amino acid neurotransmitters are active in the
CNS and PNS
• Known to function in the CNS are
– Glutamate
– Gamma-aminobutyric acid (GABA)
– Glycine
© 2011 Pearson Education, Inc.
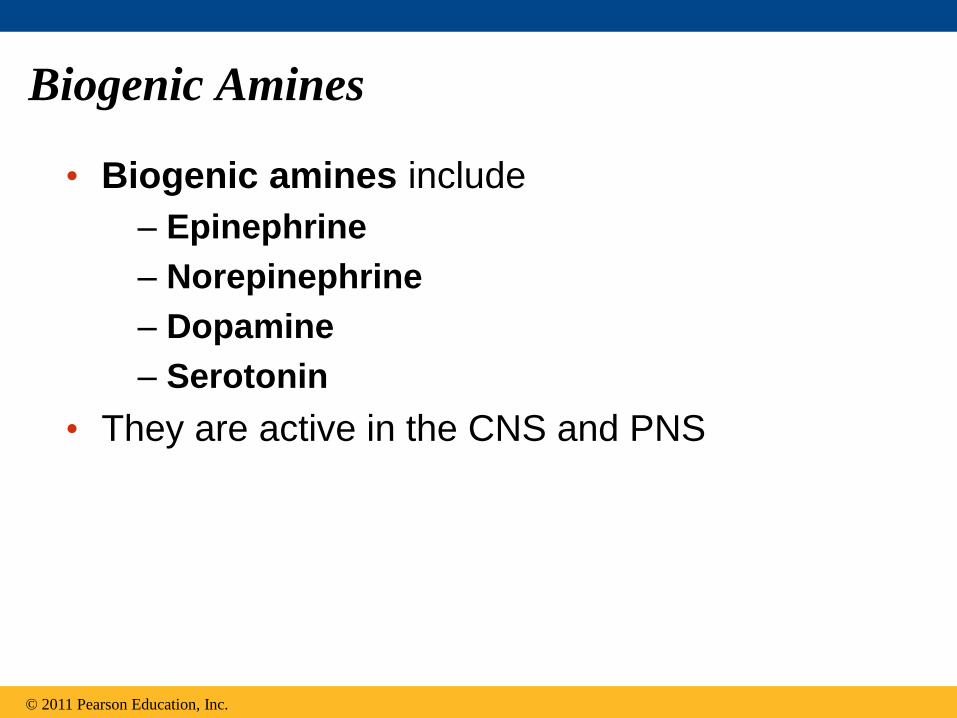
Biogenic Amines
• Biogenic amines include
– Epinephrine
– Norepinephrine
– Dopamine
– Serotonin
• They are active in the CNS and PNS
© 2011 Pearson Education, Inc.

Neuropeptides
• Several neuropeptides, relatively short chains of amino acids, also function as neurotransmitters
• Neuropeptides include substance P and endorphins, which both affect our perception of pain
• Opiates bind to the same receptors as endorphins and can be used as painkillers
© 2011 Pearson Education, Inc.
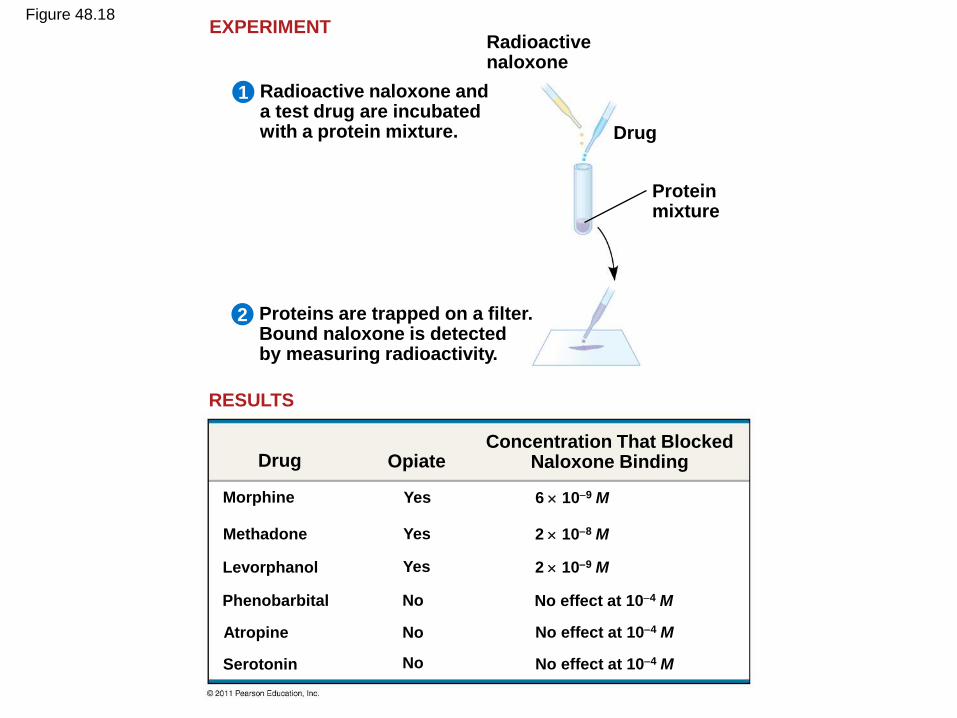
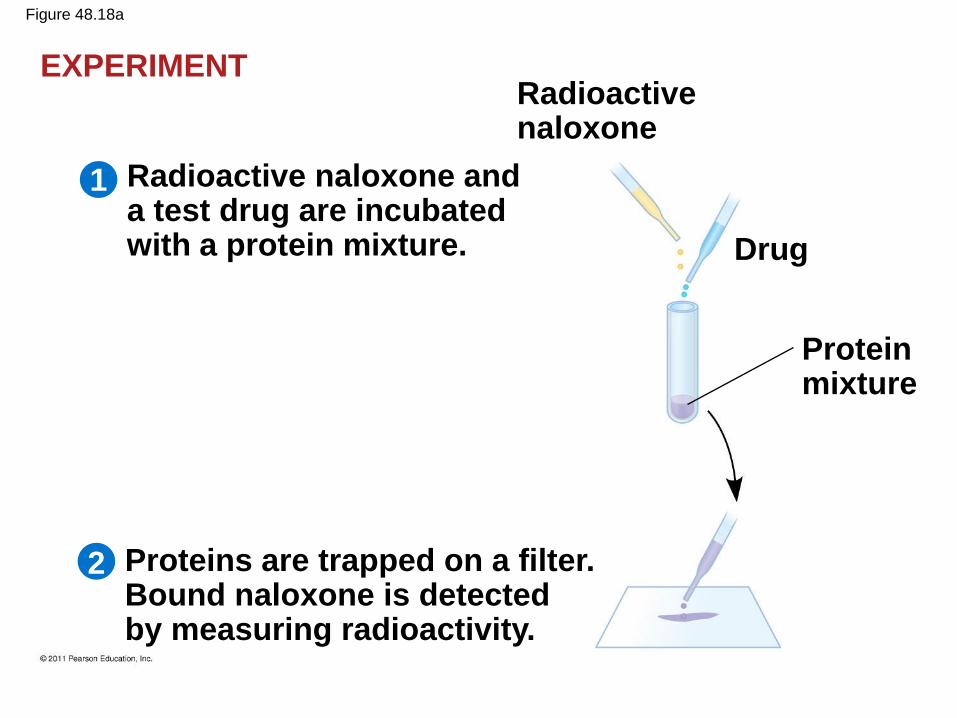
Figure 48.18
Radioactive naloxone
Drug
Protein mixture
Radioactive naloxone and a test drug are incubated with a protein mixture.
Proteins are trapped on a filter. Bound naloxone is detected by measuring radioactivity.
EXPERIMENT
RESULTS
2
1
Drug Opiate Concentration That Blocked
Naloxone Binding
Morphine
Methadone
Levorphanol
Phenobarbital
Atropine
Serotonin
Yes
Yes
Yes
No
No
No
6 109 M
2 108 M
2 109 M
No effect at 104 M
No effect at 104 M
No effect at 104 M
Radioactive naloxone
Drug
Protein mixture
Radioactive naloxone and a test drug are incubated with a protein mixture.
Proteins are trapped on a filter. Bound naloxone is detected by measuring radioactivity.
EXPERIMENT
2
1
Figure 48.18a

RESULTS
Drug Opiate Concentration That Blocked
Naloxone Binding
Morphine
Methadone
Levorphanol
Phenobarbital
Atropine
Serotonin
Yes
Yes
Yes
No
No
No
6 109 M
2 108 M
2 109 M
No effect at 104 M
No effect at 104 M
No effect at 104 M
Figure 48.18b

Gases
• Gases such as nitric oxide and carbon monoxide
are local regulators in the PNS
© 2011 Pearson Education, Inc.