chapter 5 appendix - amazon web services€¦ · chapter 5 appendix. world happiness report 2020...
TRANSCRIPT

Chapter 5 Appendix

World Happiness Report 2020
Local Environmental Quality and Happiness in Mega Cities: Additional Regression Models
As noted in the main text of the chapter, we
estimate several variations of our principal
model, plus a reduced-choice model that has a
stronger causal interpretation but includes a
much more limited range of environmental data.
Four variations of the main model are presented
in Table A4. These arise from the combination of
two treatments: first, whether or not we include
local-area (MSOA) fixed effects; and second,
whether or not we interact all environmental
characteristics with being outdoors. The inclusion
of local-area fixed effects makes little difference
to the results, which is encouraging for the
robustness of our findings. The interaction of
environmental characteristics with being outdoors
is important, however. In the absence of the
interaction, there are few significant effects.
Presumably this is because weather, green space,
and so on do not strongly affect people in the
indoor environments in which they spend most
of their time. By contrast, most environmental
characteristics do show significant effects in
interaction with being outdoors, where people
experience them more directly. The discussion in
the main text is focused on Model 4 in Table A4,
which has both local-area fixed effects and
environmental characteristics interacted with
being outdoors.
Our ‘low-choice’ model is presented in Table A5.
In terms of environmental characteristics, it
includes only weather conditions and average air
pollution concentrations, measured at the level of
the city as a whole. We take weather observations
from a single weather station (London Heathrow
airport) at the nearest available time and within
two hours before/after the response, and we link
each response with London Air Quality Network
(LAQN) estimates of background NO2 and PM10
concentrations across London as a whole for the
relevant date and hour. We deliberately exclude
other environmental characteristics, such as
green space, and other controls, such as activity
and location, over which individuals have a high
degree of choice. An element of choice, however,
remains – individuals might choose to escape the
city entirely, or wear a face mask to filter out
pollution, for example – but the effects estimated
in the low-choice model should nevertheless
bear somewhat stronger causal interpretation.
Weather effects in the low-choice model are very
similar to those of the main models that interact
weather conditions with being outdoors, but
with the effect sizes somewhat reduced, as we
might expect. Happiness is increased, and by
increasing margins, by cloudless skies, partial sun,
and continuous sunshine. The latter adds almost
one percentage point of happiness compared to
no sun at all. Happiness is also higher by just over
one percentage point when the air temperature
exceeds 25°C compared to temperatures below
freezing. Happiness falls slightly as wind speeds
rise, so that at 15 knots or more, happiness is
slightly over half a percentage point lower than
in still conditions. The effects of daylight and
rain are not significantly different from zero in
this specification.
As regards air quality, in the low-choice model
low NO2 is associated with a modest increase in
reported happiness: responses subject to the
lowest pollutant concentrations (the bottom 5%)
are 0.34 percentage points happier than those at
the middle quartiles, and those subject to low
concentrations (the next 20%) are 0.16 percentage
points happier. This is a small but meaningful
boost in well-being. Neither low nor high
concentrations of PM10 are seen to affect
happiness at the 5% significance level (though
there does appear to be a modest upward trend
with increasing concentration, which is not
intuitive). Note that the NO2 and PM10 variables
are not strongly correlated, and results obtained
when they are entered separately in their own
regressions (not shown) differ little from
these ones.
Table A7 presents some additional regression
estimates supporting Chapter 1. In this model,
which is run for the full sample (not just Greater
London responses), all activities are interacted
both with being with friend(s) and with being
with a partner.

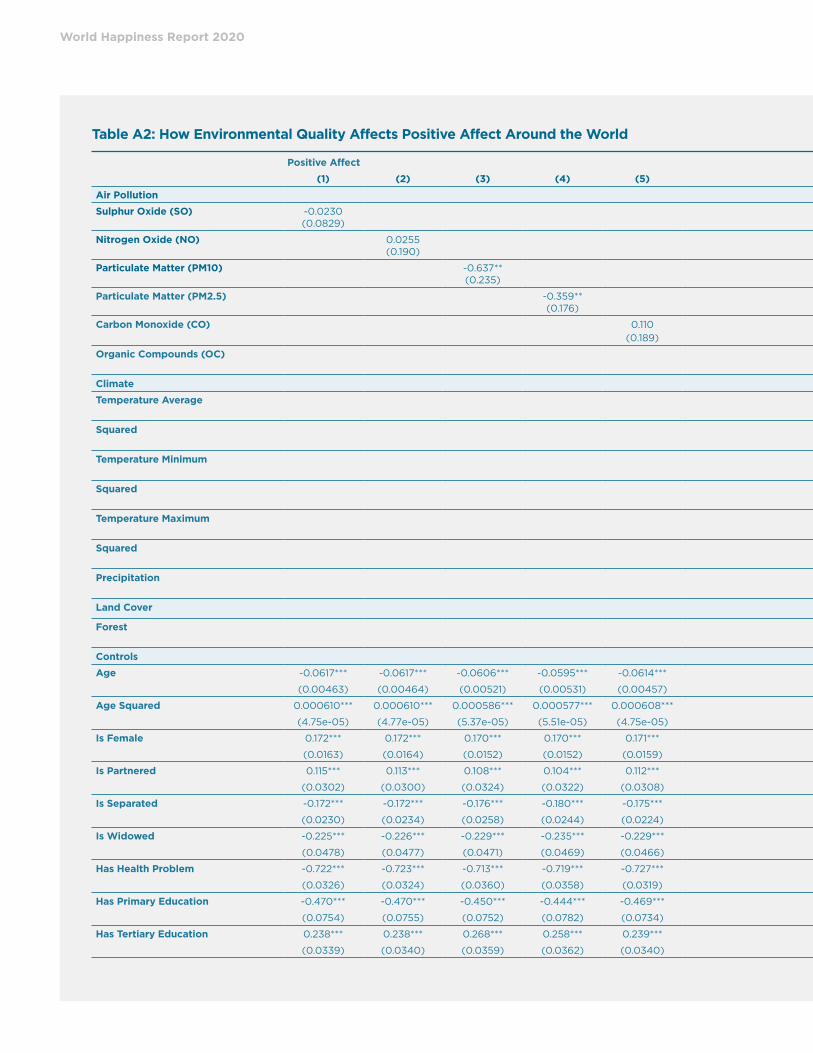
Figure A1: How Environmental Quality Affects Positive Affect Around the World
Notes: Plotted coefficients are obtained from separate models regressing positive affect on each environmental factor alongside controls at the individual, household, and country level. See Table A2 in this Appendix for the full regression table. Confidence bands are 95%.
Sources: Gallup World Poll, 2005 to 2015; OECD Environmental Database; World Bank and World Bank Climate Change Knowledge Portal.
Positive Affect
Air Pollution
Sulphur Oxide (SO)
Nitrogen Oxide (NO)
Particulate Matter (PM10)
Particulate Matter (PM2.5)
Carbon Monoxide (CO)
Organic Compounds (OC)
Climate
Temperature Average
Squared
Temperature Minimum
Squared
Temperature Maximum
Squared
Precipitation
Land Cover
Forest
-0.30
-0.48
0.96
0.34
-1.94
-1.85
-0.98
0.04
0.09
0.02
-3.69
0.08
0.01
-0.00
Sulphur Oxide (SO)Nitrogen Oxide (NO)
Particulate Matter (PM10)Particulate Matter (PM2.5)
Carbon Monoxide (CO)Organic Compounds (OC)
Temperature AverageSquared
Temperature MinimumSquared
Temperature MaximumSquared
Precipitation
Forest
Air Pollution
Climate
Land Cover
-10.00 -5.00 0.00 5.00 10.00
Positive Affect
-1.00 -0.50 0.00 0.50 1.00
-0.02
0.03
-0.64
-0.36
0.11
0.29
-0.13
0.00
-0.02
0.00
-0.30
0.01
-0.00
0.00
Sulphur Oxide (SO)Nitrogen Oxide (NO)
Particulate Matter (PM10)Particulate Matter (PM2.5)
Carbon Monoxide (CO)Organic Compounds (OC)
Temperature AverageSquared
Temperature MinimumSquared
Temperature MaximumSquared
Precipitation
Forest
Air Pollution
Climate
Land Cover
-1.00 -0.50 0.00 0.50 1.00
Life Evaluation

World Happiness Report 2020
Figure A2: How Environmental Quality Affects Negative Affect Around the World
Notes: Plotted coefficients are obtained from separate models regressing negative affect on each environmental factor alongside controls at the individual, household, and country level. See Table A3 in this Appendix for the full regression table. Confidence bands are 95%.
Sources: Gallup World Poll, 2005 to 2015; OECD Environmental Database; World Bank and World Bank Climate Change Knowledge Portal.
Negative Affect
Air Pollution
Sulphur Oxide (SO)
Nitrogen Oxide (NO)
Particulate Matter (PM10)
Particulate Matter (PM2.5)
Carbon Monoxide (CO)
Organic Compounds (OC)
Climate
Temperature Average
Squared
Temperature Minimum
Squared
Temperature Maximum
Squared
Precipitation
Land Cover
Forest
-0.48
-0.36
-0.59
1.19
-4.55
-4.27
0.70
0.01
0.54
0.01
-0.47
0.03
-0.01
-0.03
Sulphur Oxide (SO)Nitrogen Oxide (NO)
Particulate Matter (PM10)Particulate Matter (PM2.5)
Carbon Monoxide (CO)Organic Compounds (OC)
Temperature AverageSquared
Temperature MinimumSquared
Temperature MaximumSquared
Precipitation
Forest
Air Pollution
Climate
Land Cover
-10.00 -5.00 0.00 5.00 10.00
Negative Affect
-1.00 -0.50 0.00 0.50 1.00
-0.02
0.03
-0.64
-0.36
0.11
0.29
-0.13
0.00
-0.02
0.00
-0.30
0.01
-0.00
0.00
Sulphur Oxide (SO)Nitrogen Oxide (NO)
Particulate Matter (PM10)Particulate Matter (PM2.5)
Carbon Monoxide (CO)Organic Compounds (OC)
Temperature AverageSquared
Temperature MinimumSquared
Temperature MaximumSquared
Precipitation
Forest
Air Pollution
Climate
Land Cover
-1.00 -0.50 0.00 0.50 1.00
Life Evaluation

Figure A3: Happiness Impacts of Air Quality and Weather Conditions in Greater London, UK: Low-Choice Model
Notes: Plotted coefficients are obtained from a single model (see Table A4), regressing reported happiness (scaled 0 – 100) on all environmental factors, alongside date and time controls and individual fixed effects.
Sources: Mappiness data set; London Air Quality Network; UK Met Office.
Confidence bands are at the 95% level.
* p < 0.1, ** p < 0.05, *** p < 0.01
4
Figure A3. Happiness impacts of air quality and weather conditions in Greater London, UK: low-choice model
Notes: Plotted coefficients are obtained from a single model (see Table A4), regressing reported hap-piness (scaled 0 – 100) on all environmental factors, alongside date and time controls and individual fixed effects. Sources: Mappiness data set; London Air Quality Network; UK Met Office. Error bars represent the 95% confidence intervals. * p < 0.1, ** p < 0.05, *** p < 0.01
.34 **
.16 **
-.084
.0074
-.12
.021
.073
.22 *
-.12
.3 ***
.59 ***
.83 ***
-.12
-.33 ***
-.42 ***
-.62 ***
-.25
-.25
-.1
.12
.24
1.2 ***
Very low (<17.2)
Low (17.2 – <26.1)
High (49.8 – <75.2)
Very high (75.2+)
Very low (<9.1)
Low (9.1 – <13.7)
High (25.4 – <46.7)
Very high (46.7+)
Daylight
Clear skies
Partial sun
Continuous sun
Rain
4 – 8 kt
9 – 14 kt
15+ kt
0 – 4 °C
5 – 9 °C
10 – 14 °C
15 – 19 °C
20 – 24 °C
25+ °C
NO 2 , μg/m
3
PM10, μg/m
3
Conditions
Wind speed (base: 0 – 3 kt)
Air temp. (base: < 0 °C)
-1.00 0.00 1.00 2.00Coefficient with 95% CI

World Happiness Report 2020
Table A1: How Environmental Quality Affects Life Evaluation Around the World
Life Evaluation
(1) (2) (3) (4) (5) (6) (7) (8) (9) (10) (11)
Air Pollution
Sulphur Oxide (SO) -0.0230(0.0829)
Nitrogen Oxide (NO) 0.0255(0.190)
Particulate Matter (PM10) -0.637**(0.235)
Particulate Matter (PM2.5) -0.359**(0.176)
Carbon Monoxide (CO) 0.110(0.189)
Organic Compounds (OC) 0.287(0.178)
Climate
Temperature Average -0.131**(0.0495)
Squared 0.00354*(0.00193)
Temperature Minimum -0.0242(0.0150)
Squared 0.00134(0.00120)
Temperature Maximum -0.300**(0.122)
Squared 0.00602*(0.00299)
Precipitation -0.000297(0.000938)
Land Cover
Forest 0.00307(0.00694)
Controls
Age -0.0617*** -0.0617*** -0.0606*** -0.0595*** -0.0614*** -0.0611*** -0.0595*** -0.0599*** -0.0607*** -0.0618*** -0.0640***
(0.00463) (0.00464) (0.00521) (0.00531) (0.00457) (0.00462) (0.00491) (0.00477) (0.00466) (0.00459) (0.00516)
Age Squared 0.000610*** 0.000610*** 0.000586*** 0.000577*** 0.000608*** 0.000604*** 0.000585*** 0.000591*** 0.000595*** 0.000611*** 0.000627***
(4.75e-05) (4.77e-05) (5.37e-05) (5.51e-05) (4.75e-05) (4.76e-05) (5.18e-05) (5.05e-05) (4.89e-05) (4.68e-05) (5.46e-05)
Is Female 0.172*** 0.172*** 0.170*** 0.170*** 0.171*** 0.171*** 0.174*** 0.173*** 0.174*** 0.172*** 0.175***
(0.0163) (0.0164) (0.0152) (0.0152) (0.0159) (0.0162) (0.0163) (0.0165) (0.0159) (0.0161) (0.0158)
Is Partnered 0.115*** 0.113*** 0.108*** 0.104*** 0.112*** 0.111*** 0.118*** 0.113*** 0.122*** 0.113*** 0.117***
(0.0302) (0.0300) (0.0324) (0.0322) (0.0308) (0.0304) (0.0288) (0.0302) (0.0273) (0.0303) (0.0302)
Is Separated -0.172*** -0.172*** -0.176*** -0.180*** -0.175*** -0.177*** -0.174*** -0.178*** -0.166*** -0.173*** -0.178***
(0.0230) (0.0234) (0.0258) (0.0244) (0.0224) (0.0240) (0.0221) (0.0227) (0.0195) (0.0219) (0.0253)
Is Widowed -0.225*** -0.226*** -0.229*** -0.235*** -0.229*** -0.230*** -0.207*** -0.217*** -0.206*** -0.226*** -0.224***
(0.0478) (0.0477) (0.0471) (0.0469) (0.0466) (0.0479) (0.0379) (0.0402) (0.0403) (0.0475) (0.0470)
Has Health Problem -0.722*** -0.723*** -0.713*** -0.719*** -0.727*** -0.726*** -0.735*** -0.733*** -0.725*** -0.723*** -0.724***
(0.0326) (0.0324) (0.0360) (0.0358) (0.0319) (0.0325) (0.0310) (0.0318) (0.0288) (0.0324) (0.0333)
Has Primary Education -0.470*** -0.470*** -0.450*** -0.444*** -0.469*** -0.467*** -0.438*** -0.449*** -0.448*** -0.472*** -0.475***
(0.0754) (0.0755) (0.0752) (0.0782) (0.0734) (0.0752) (0.0605) (0.0624) (0.0615) (0.0749) (0.0807)
Has Tertiary Education 0.238*** 0.238*** 0.268*** 0.258*** 0.239*** 0.239*** 0.223*** 0.230*** 0.216*** 0.237*** 0.247***
(0.0339) (0.0340) (0.0359) (0.0362) (0.0340) (0.0337) (0.0389) (0.0371) (0.0358) (0.0339) (0.0377)

World Happiness Report 2020
Table A1: How Environmental Quality Affects Life Evaluation Around the World (continued)
Life Evaluation
(1) (2) (3) (4) (5) (6) (7) (8) (9) (10) (11)
Is Part-Time Employed 0.234*** 0.236*** 0.234*** 0.233*** 0.238*** 0.241*** 0.215*** 0.223*** 0.222*** 0.237*** 0.232***
(0.0246) (0.0249) (0.0233) (0.0224) (0.0244) (0.0245) (0.0220) (0.0238) (0.0205) (0.0234) (0.0255)
Is Underemployed -0.274*** -0.273*** -0.272*** -0.266*** -0.269*** -0.272*** -0.277*** -0.269*** -0.289*** -0.271*** -0.277***
(0.0436) (0.0440) (0.0423) (0.0427) (0.0426) (0.0439) (0.0400) (0.0416) (0.0383) (0.0425) (0.0456)
Is Self-Employed 0.0697* 0.0694* 0.0689* 0.0655* 0.0733** 0.0750** 0.0844** 0.0821** 0.0736** 0.0715** 0.0731*
(0.0349) (0.0356) (0.0365) (0.0371) (0.0344) (0.0344) (0.0340) (0.0341) (0.0328) (0.0326) (0.0383)
Is Unemployed -0.729*** -0.729*** -0.763*** -0.759*** -0.722*** -0.721*** -0.708*** -0.716*** -0.712*** -0.728*** -0.733***
(0.0432) (0.0439) (0.0448) (0.0464) (0.0397) (0.0438) (0.0392) (0.0394) (0.0380) (0.0429) (0.0425)
Is Out of Labour Force -0.0299 -0.0298 -0.0273 -0.0268 -0.0279 -0.0217 -0.0274 -0.0302 -0.0197 -0.0298 -0.0309
(0.0282) (0.0291) (0.0303) (0.0303) (0.0286) (0.0297) (0.0290) (0.0285) (0.0275) (0.0284) (0.0304)
Annual Household Income 0.534*** 0.535*** 0.514*** 0.525*** 0.534*** 0.537*** 0.502*** 0.517*** 0.513*** 0.536*** 0.517***
(0.0694) (0.0696) (0.0705) (0.0716) (0.0700) (0.0697) (0.0599) (0.0642) (0.0600) (0.0701) (0.0697)
Number of Individuals in Household -0.0589*** -0.0584*** -0.0595*** -0.0569*** -0.0586*** -0.0582*** -0.0372*** -0.0438*** -0.0447*** -0.0589*** -0.0589***
(0.0168) (0.0168) (0.0170) (0.0176) (0.0167) (0.0166) (0.0131) (0.0138) (0.0144) (0.0169) (0.0167)
Has Children in Household 0.0657*** 0.0660*** 0.0625*** 0.0637*** 0.0652*** 0.0659*** 0.0560*** 0.0564*** 0.0687*** 0.0658*** 0.0597***
(0.0144) (0.0146) (0.0140) (0.0142) (0.0140) (0.0148) (0.0135) (0.0137) (0.0147) (0.0144) (0.0144)
Is Urban -0.0451* -0.0463* -0.0498* -0.0517* -0.0459* -0.0482* -0.0319 -0.0375 -0.0364 -0.0459* -0.0442
(0.0263) (0.0251) (0.0285) (0.0291) (0.0263) (0.0259) (0.0234) (0.0249) (0.0233) (0.0265) (0.0268)
GDP Per Capita 2.12e-05 2.13e-05* 1.83e-05 1.92e-05* 2.21e-05 1.93e-05 2.01e-05* 2.19e-05* 1.85e-05* 2.19e-05 2.31e-05*
(1.32e-05) (1.21e-05) (1.08e-05) (1.12e-05) (1.34e-05) (1.27e-05) (1.01e-05) (1.14e-05) (1.01e-05) (1.30e-05) (1.36e-05)
Population Density 0.00106 0.00111 -0.00120 -0.000365 0.00129* 0.00145* 0.00175*** 0.00173*** 0.00117* 0.00111 0.00142*
(0.000708) (0.000725) (0.00102) (0.000916) (0.000697) (0.000766) (0.000553) (0.000615) (0.000631) (0.000688) (0.000721)
Population Level -2.15e-09** -2.06e-09** -4.48e-09*** -3.24e-09*** -2.04e-09** -1.55e-09* 2.02e-09 6.74e-10 1.03e-10 -2.02e-09*** -2.08e-09**
(8.00e-10) (7.99e-10) (1.06e-09) (8.61e-10) (7.75e-10) (8.38e-10) (2.25e-09) (2.30e-09) (1.27e-09) (7.19e-10) (8.66e-10)
Observations 258,212 258,212 231,695 231,695 258,212 258,212 258,212 258,212 258,212 258,212 226,052
Adjusted R Squared 0.224 0.224 0.231 0.229 0.224 0.225 0.232 0.228 0.232 0.224 0.223
Constant Yes Yes Yes Yes Yes Yes Yes Yes Yes Yes Yes
Region Fixed Effects Yes Yes Yes Yes Yes Yes Yes Yes Yes Yes Yes
Year Fixed Effects Yes Yes Yes Yes Yes Yes Yes Yes Yes Yes Yes
Region-Year Fixed Effects Yes Yes Yes Yes Yes Yes Yes Yes Yes Yes Yes
Robust standard errors clustered at country level in parentheses.
*** p<0.01, ** p<0.05, * p<0.1
Notes: We take the natural logarithm of our air pollution measures to reduce their skewedness while leaving all other environmental factors in their natural units.
Sources: Gallup World Poll, 2005 to 2015; OECD Environmental Database; World Bank and World Bank Climate Change Knowledge Portal.
World Happiness Report 2020
Table A2: How Environmental Quality Affects Positive Affect Around the World
Positive Affect
(1) (2) (3) (4) (5) (6) (7) (8) (9) (10) (11)
Air Pollution
Sulphur Oxide (SO) -0.0230(0.0829)
Nitrogen Oxide (NO) 0.0255(0.190)
Particulate Matter (PM10) -0.637**(0.235)
Particulate Matter (PM2.5) -0.359**(0.176)
Carbon Monoxide (CO) 0.110(0.189)
Organic Compounds (OC) 0.287(0.178)
Climate
Temperature Average -0.131**(0.0495)
Squared 0.00354*(0.00193)
Temperature Minimum -0.0242(0.0150)
Squared 0.00134(0.00120)
Temperature Maximum -0.300**(0.122)
Squared 0.00602*(0.00299)
Precipitation -0.000297(0.000938)
Land Cover
Forest 0.00307(0.00694)
Controls
Age -0.0617*** -0.0617*** -0.0606*** -0.0595*** -0.0614*** -0.0611*** -0.0595*** -0.0599*** -0.0607*** -0.0618*** -0.0640***
(0.00463) (0.00464) (0.00521) (0.00531) (0.00457) (0.00462) (0.00491) (0.00477) (0.00466) (0.00459) (0.00516)
Age Squared 0.000610*** 0.000610*** 0.000586*** 0.000577*** 0.000608*** 0.000604*** 0.000585*** 0.000591*** 0.000595*** 0.000611*** 0.000627***
(4.75e-05) (4.77e-05) (5.37e-05) (5.51e-05) (4.75e-05) (4.76e-05) (5.18e-05) (5.05e-05) (4.89e-05) (4.68e-05) (5.46e-05)
Is Female 0.172*** 0.172*** 0.170*** 0.170*** 0.171*** 0.171*** 0.174*** 0.173*** 0.174*** 0.172*** 0.175***
(0.0163) (0.0164) (0.0152) (0.0152) (0.0159) (0.0162) (0.0163) (0.0165) (0.0159) (0.0161) (0.0158)
Is Partnered 0.115*** 0.113*** 0.108*** 0.104*** 0.112*** 0.111*** 0.118*** 0.113*** 0.122*** 0.113*** 0.117***
(0.0302) (0.0300) (0.0324) (0.0322) (0.0308) (0.0304) (0.0288) (0.0302) (0.0273) (0.0303) (0.0302)
Is Separated -0.172*** -0.172*** -0.176*** -0.180*** -0.175*** -0.177*** -0.174*** -0.178*** -0.166*** -0.173*** -0.178***
(0.0230) (0.0234) (0.0258) (0.0244) (0.0224) (0.0240) (0.0221) (0.0227) (0.0195) (0.0219) (0.0253)
Is Widowed -0.225*** -0.226*** -0.229*** -0.235*** -0.229*** -0.230*** -0.207*** -0.217*** -0.206*** -0.226*** -0.224***
(0.0478) (0.0477) (0.0471) (0.0469) (0.0466) (0.0479) (0.0379) (0.0402) (0.0403) (0.0475) (0.0470)
Has Health Problem -0.722*** -0.723*** -0.713*** -0.719*** -0.727*** -0.726*** -0.735*** -0.733*** -0.725*** -0.723*** -0.724***
(0.0326) (0.0324) (0.0360) (0.0358) (0.0319) (0.0325) (0.0310) (0.0318) (0.0288) (0.0324) (0.0333)
Has Primary Education -0.470*** -0.470*** -0.450*** -0.444*** -0.469*** -0.467*** -0.438*** -0.449*** -0.448*** -0.472*** -0.475***
(0.0754) (0.0755) (0.0752) (0.0782) (0.0734) (0.0752) (0.0605) (0.0624) (0.0615) (0.0749) (0.0807)
Has Tertiary Education 0.238*** 0.238*** 0.268*** 0.258*** 0.239*** 0.239*** 0.223*** 0.230*** 0.216*** 0.237*** 0.247***
(0.0339) (0.0340) (0.0359) (0.0362) (0.0340) (0.0337) (0.0389) (0.0371) (0.0358) (0.0339) (0.0377)

World Happiness Report 2020
Table A2: How Environmental Quality Affects Positive Affect Around the World (continued)
Positive Affect
(1) (2) (3) (4) (5) (6) (7) (8) (9) (10) (11)
Is Part-Time Employed 0.234*** 0.236*** 0.234*** 0.233*** 0.238*** 0.241*** 0.215*** 0.223*** 0.222*** 0.237*** 0.232***
(0.0246) (0.0249) (0.0233) (0.0224) (0.0244) (0.0245) (0.0220) (0.0238) (0.0205) (0.0234) (0.0255)
Is Underemployed -0.274*** -0.273*** -0.272*** -0.266*** -0.269*** -0.272*** -0.277*** -0.269*** -0.289*** -0.271*** -0.277***
(0.0436) (0.0440) (0.0423) (0.0427) (0.0426) (0.0439) (0.0400) (0.0416) (0.0383) (0.0425) (0.0456)
Is Self-Employed 0.0697* 0.0694* 0.0689* 0.0655* 0.0733** 0.0750** 0.0844** 0.0821** 0.0736** 0.0715** 0.0731*
(0.0349) (0.0356) (0.0365) (0.0371) (0.0344) (0.0344) (0.0340) (0.0341) (0.0328) (0.0326) (0.0383)
Is Unemployed -0.729*** -0.729*** -0.763*** -0.759*** -0.722*** -0.721*** -0.708*** -0.716*** -0.712*** -0.728*** -0.733***
(0.0432) (0.0439) (0.0448) (0.0464) (0.0397) (0.0438) (0.0392) (0.0394) (0.0380) (0.0429) (0.0425)
Is Out of Labour Force -0.0299 -0.0298 -0.0273 -0.0268 -0.0279 -0.0217 -0.0274 -0.0302 -0.0197 -0.0298 -0.0309
(0.0282) (0.0291) (0.0303) (0.0303) (0.0286) (0.0297) (0.0290) (0.0285) (0.0275) (0.0284) (0.0304)
Annual Household Income 0.534*** 0.535*** 0.514*** 0.525*** 0.534*** 0.537*** 0.502*** 0.517*** 0.513*** 0.536*** 0.517***
(0.0694) (0.0696) (0.0705) (0.0716) (0.0700) (0.0697) (0.0599) (0.0642) (0.0600) (0.0701) (0.0697)
Number of Individuals in Household -0.0589*** -0.0584*** -0.0595*** -0.0569*** -0.0586*** -0.0582*** -0.0372*** -0.0438*** -0.0447*** -0.0589*** -0.0589***
(0.0168) (0.0168) (0.0170) (0.0176) (0.0167) (0.0166) (0.0131) (0.0138) (0.0144) (0.0169) (0.0167)
Has Children in Household 0.0657*** 0.0660*** 0.0625*** 0.0637*** 0.0652*** 0.0659*** 0.0560*** 0.0564*** 0.0687*** 0.0658*** 0.0597***
(0.0144) (0.0146) (0.0140) (0.0142) (0.0140) (0.0148) (0.0135) (0.0137) (0.0147) (0.0144) (0.0144)
Is Urban -0.0451* -0.0463* -0.0498* -0.0517* -0.0459* -0.0482* -0.0319 -0.0375 -0.0364 -0.0459* -0.0442
(0.0263) (0.0251) (0.0285) (0.0291) (0.0263) (0.0259) (0.0234) (0.0249) (0.0233) (0.0265) (0.0268)
GDP Per Capita 2.12e-05 2.13e-05* 1.83e-05 1.92e-05* 2.21e-05 1.93e-05 2.01e-05* 2.19e-05* 1.85e-05* 2.19e-05 2.31e-05*
(1.32e-05) (1.21e-05) (1.08e-05) (1.12e-05) (1.34e-05) (1.27e-05) (1.01e-05) (1.14e-05) (1.01e-05) (1.30e-05) (1.36e-05)
Population Density 0.00106 0.00111 -0.00120 -0.000365 0.00129* 0.00145* 0.00175*** 0.00173*** 0.00117* 0.00111 0.00142*
(0.000708) (0.000725) (0.00102) (0.000916) (0.000697) (0.000766) (0.000553) (0.000615) (0.000631) (0.000688) (0.000721)
Population Level -2.15e-09** -2.06e-09** -4.48e-09*** -3.24e-09*** -2.04e-09** -1.55e-09* 2.02e-09 6.74e-10 1.03e-10 -2.02e-09*** -2.08e-09**
(8.00e-10) (7.99e-10) (1.06e-09) (8.61e-10) (7.75e-10) (8.38e-10) (2.25e-09) (2.30e-09) (1.27e-09) (7.19e-10) (8.66e-10)
Observations 258,212 258,212 231,695 231,695 258,212 258,212 258,212 258,212 258,212 258,212 226,052
Adjusted R Squared 0.224 0.224 0.231 0.229 0.224 0.225 0.232 0.228 0.232 0.224 0.223
Constant Yes Yes Yes Yes Yes Yes Yes Yes Yes Yes Yes
Region Fixed Effects Yes Yes Yes Yes Yes Yes Yes Yes Yes Yes Yes
Year Fixed Effects Yes Yes Yes Yes Yes Yes Yes Yes Yes Yes Yes
Region-Year Fixed Effects Yes Yes Yes Yes Yes Yes Yes Yes Yes Yes Yes
Robust standard errors clustered at country level in parentheses.
*** p<0.01, ** p<0.05, * p<0.1
Notes: We take the natural logarithm of our air pollution measures to reduce their skewedness while leaving all other environmental factors in their natural units.
Sources: Gallup World Poll, 2005 to 2015; OECD Environmental Database; World Bank and World Bank Climate Change Knowledge Portal.

World Happiness Report 2020
Table A3: How Environmental Quality Affects Positive Affect Around the World
Negative Affect
(1) (2) (3) (4) (5) (6) (7) (8) (9) (10) (11)
Air Pollution
Sulphur Oxide (SO) -0.476(0.909)
Nitrogen Oxide (NO) -0.355(1.891)
Particulate Matter (PM10) -0.586(2.968)
Particulate Matter (PM2.5) 1.186(2.116)
Carbon Monoxide (CO) -4.547**(2.088)
Organic Compounds (OC) -4.273*(2.499)
Climate
Temperature Average 0.697*(0.348)
Squared 0.00693(0.0180)
Temperature Minimum 0.543***(0.117)
Squared 0.0109(0.00761)
Temperature Maximum -0.474(1.216)
Squared 0.0319(0.0341)
Precipitation -0.00725(0.0130)
Land Cover
Forest -0.0267(0.0391)
Controls
Age 0.509*** 0.509*** 0.510*** 0.508*** 0.500*** 0.502*** 0.485*** 0.478*** 0.496*** 0.508*** 0.510***
(0.0592) (0.0591) (0.0636) (0.0636) (0.0577) (0.0602) (0.0583) (0.0574) (0.0564) (0.0609) (0.0634)
Age Squared -0.00634*** -0.00634*** -0.00633*** -0.00630*** -0.00626*** -0.00625*** -0.00606*** -0.00602*** -0.00617*** -0.00631*** -0.00630***
(0.000519) (0.000520) (0.000570) (0.000572) (0.000513) (0.000542) (0.000528) (0.000527) (0.000502) (0.000537) (0.000575)
Is Female 3.271*** 3.273*** 3.350*** 3.339*** 3.318*** 3.284*** 3.246*** 3.267*** 3.258*** 3.267*** 3.368***
(0.230) (0.231) (0.242) (0.240) (0.228) (0.229) (0.227) (0.225) (0.231) (0.228) (0.250)
Is Partnered -0.116 -0.123 -0.107 -0.136 -0.0528 -0.0827 -0.177 -0.0874 -0.220 -0.148 -0.139
(0.285) (0.278) (0.317) (0.306) (0.303) (0.287) (0.280) (0.295) (0.273) (0.288) (0.267)
Is Separated 2.512*** 2.508*** 2.434*** 2.403*** 2.615*** 2.573*** 2.622*** 2.709*** 2.561*** 2.475*** 2.503***
(0.371) (0.367) (0.382) (0.372) (0.352) (0.370) (0.327) (0.311) (0.333) (0.354) (0.389)
Is Widowed 2.392*** 2.383*** 2.519*** 2.454*** 2.508*** 2.441*** 2.330*** 2.511*** 2.305*** 2.357*** 2.394***
(0.304) (0.306) (0.359) (0.346) (0.323) (0.320) (0.313) (0.337) (0.302) (0.318) (0.306)
Has Health Problem 16.03*** 16.02*** 16.05*** 16.03*** 16.18*** 16.07*** 16.24*** 16.32*** 16.16*** 16.01*** 15.91***
(0.628) (0.634) (0.682) (0.692) (0.611) (0.633) (0.574) (0.586) (0.565) (0.626) (0.654)
Has Primary Education 4.031*** 4.020*** 4.266*** 4.208*** 3.984*** 3.962*** 3.517*** 3.451*** 3.596*** 3.967*** 4.018***
(0.871) (0.876) (0.928) (0.936) (0.822) (0.903) (0.585) (0.614) (0.622) (0.892) (0.898)
Has Tertiary Education -0.731* -0.730** -0.764* -0.778* -0.787** -0.742** -0.520 -0.633** -0.488 -0.750** -0.825**
(0.363) (0.359) (0.397) (0.403) (0.340) (0.342) (0.311) (0.301) (0.309) (0.352) (0.377)

World Happiness Report 2020
Table A3: How Environmental Quality Affects Positive Affect Around the World (continued)
Negative Affect
(1) (2) (3) (4) (5) (6) (7) (8) (9) (10) (11)
Is Part-Time Employed -2.061*** -2.051*** -1.852*** -1.762*** -2.166*** -2.126*** -1.817*** -1.905*** -1.863*** -2.010*** -2.145***
(0.271) (0.274) (0.286) (0.306) (0.287) (0.291) (0.303) (0.308) (0.305) (0.297) (0.311)
Is Underemployed 3.734*** 3.752*** 3.879*** 3.931*** 3.586*** 3.727*** 3.642*** 3.449*** 3.718*** 3.801*** 3.623***
(0.512) (0.517) (0.562) (0.549) (0.498) (0.518) (0.449) (0.446) (0.465) (0.500) (0.526)
Is Self-Employed 2.536*** 2.522*** 2.669*** 2.718*** 2.355*** 2.437*** 2.320*** 2.249*** 2.414*** 2.581*** 2.415***
(0.375) (0.373) (0.391) (0.384) (0.318) (0.363) (0.288) (0.278) (0.303) (0.348) (0.353)
Is Unemployed 7.965*** 7.975*** 8.134*** 8.208*** 7.682*** 7.865*** 7.510*** 7.485*** 7.563*** 7.988*** 7.869***
(0.807) (0.806) (0.842) (0.838) (0.713) (0.765) (0.650) (0.661) (0.641) (0.805) (0.794)
Is Out of Labour Force -0.390 -0.400 -0.356 -0.355 -0.490 -0.521 -0.477 -0.461 -0.495 -0.386 -0.470
(0.401) (0.401) (0.448) (0.448) (0.394) (0.418) (0.355) (0.364) (0.365) (0.400) (0.416)
Annual Household Income -2.925*** -2.917*** -2.934*** -2.856*** -2.888*** -2.945*** -2.654*** -2.775*** -2.728*** -2.877*** -2.806***
(0.365) (0.353) (0.416) (0.403) (0.357) (0.355) (0.306) (0.338) (0.309) (0.369) (0.351)
Number of Individuals in Household 0.666*** 0.673*** 0.710*** 0.679*** 0.678*** 0.671*** 0.541*** 0.574*** 0.599*** 0.664*** 0.683***
(0.121) (0.122) (0.141) (0.147) (0.118) (0.119) (0.107) (0.107) (0.109) (0.117) (0.135)
Has Children in Household -1.871*** -1.869*** -1.981*** -1.959*** -1.842*** -1.868*** -1.762*** -1.717*** -1.857*** -1.867*** -1.887***
(0.173) (0.173) (0.176) (0.177) (0.164) (0.179) (0.166) (0.163) (0.173) (0.175) (0.171)
Is Urban 1.436*** 1.436*** 1.410*** 1.420*** 1.440*** 1.465*** 1.138*** 1.181*** 1.150*** 1.420*** 1.504***
(0.304) (0.285) (0.322) (0.329) (0.278) (0.299) (0.215) (0.228) (0.220) (0.316) (0.294)
GDP Per Capita -3.41e-05 -1.82e-05 -2.99e-05 -1.85e-05 -4.11e-05 1.20e-05 -4.62e-06 -2.39e-05 1.30e-05 -2.02e-05 -2.32e-05
(4.87e-05) (6.54e-05) (5.26e-05) (4.97e-05) (5.71e-05) (4.99e-05) (2.94e-05) (4.05e-05) (3.15e-05) (4.70e-05) (4.84e-05)
Value Added in Agriculture 0.000816 0.00113 1.03e-05 0.00530 -0.00707 -0.00397 -0.00801 -0.0114* -0.000422 0.00188 -0.00144
(0.00518) (0.00490) (0.0107) (0.00845) (0.00662) (0.00677) (0.00515) (0.00630) (0.00485) (0.00508) (0.00647)
Value Added in Industry 7.04e-09 6.46e-09 4.31e-09 1.26e-08 3.83e-09 -1.31e-09 -1.46e-08 -2.55e-09 -2.67e-09 1.02e-08 3.77e-09
(8.70e-09) (8.69e-09) (1.60e-08) (1.29e-08) (9.66e-09) (1.11e-08) (1.46e-08) (1.47e-08) (9.02e-09) (9.24e-09) (8.89e-09)
Population Density 0.509*** 0.509*** 0.510*** 0.508*** 0.500*** 0.502*** 0.485*** 0.478*** 0.496*** 0.508*** 0.510***
(0.0592) (0.0591) (0.0636) (0.0636) (0.0577) (0.0602) (0.0583) (0.0574) (0.0564) (0.0609) (0.0634)
Environmental Tax Revenue -0.00634*** -0.00634*** -0.00633*** -0.00630*** -0.00626*** -0.00625*** -0.00606*** -0.00602*** -0.00617*** -0.00631*** -0.00630***
(0.000519) (0.000520) (0.000570) (0.000572) (0.000513) (0.000542) (0.000528) (0.000527) (0.000502) (0.000537) (0.000575)
Observations 259,254 259,254 232,659 232,659 259,254 259,254 259,254 259,254 259,254 259,254 226,933
Adjusted R Squared 0.107 0.107 0.107 0.107 0.110 0.108 0.115 0.114 0.114 0.107 0.106
Constant Yes Yes Yes Yes Yes Yes Yes Yes Yes Yes Yes
Region Fixed Effects Yes Yes Yes Yes Yes Yes Yes Yes Yes Yes Yes
Year Fixed Effects Yes Yes Yes Yes Yes Yes Yes Yes Yes Yes Yes
Region-Year Fixed Effects Yes Yes Yes Yes Yes Yes Yes Yes Yes Yes Yes
Robust standard errors clustered at country level in parentheses.
*** p<0.01, ** p<0.05, * p<0.1
Notes: We take the natural logarithm of our air pollution measures to reduce their skewedness while leaving all other environmental factors in their natural units.
Sources: Gallup World Poll, 2005 to 2015; OECD Environmental Database; World Bank and World Bank Climate Change Knowledge Portal.

World Happiness Report 2020
Table A4: Happiness Impacts of Environmental Characteristics and Controls in Greater London, UK: Regression Models
Happiness (0 – 100)
1 2 3 4
Coeff SE Coeff SE Coeff SE Coeff SE
Green and blue space
Public green space 0.458** (0.226) 0.522*** (0.183)
Street trees 0.281 (0.260) 0.112 (0.189)
Thames, <10m 0.556 (0.353) 0.814*** (0.299)
Thames, 10 – 50m 3.320 (2.197) 1.950*** (0.711)
Canal centreline, <20m -0.0746 (0.785) -0.0245 (0.815)
Pond/lake, <10m 1.396 (0.971) 1.358 (1.240)
Pond/lake, 10 - 50m 0.352 (0.835) 0.506 (0.720)
Public green space x outdoors 1.118*** (0.298) 1.029*** (0.351)
Street trees x outdoors 0.993*** (0.330) 0.981*** (0.336)
Thames, <10m x outdoors 1.157** (0.511) 1.284*** (0.378)
Thames, 10 – 50m x outdoors 2.548** (1.264) 2.198** (0.938)
Canal centreline, <20m x outdoors 1.610* (0.872) 1.767** (0.719)
Pond/lake, <10m x outdoors 1.601 (1.143) 1.295 (1.191)
Pond/lake, 10 - 50m x outdoors 0.892 (0.991) 0.947 (1.039)
NO2, μg/m3
Very low (<16.4) 0.214 (0.179) 0.292* (0.149)
Low (16.4 – <28.4) 0.0888 (0.0899) 0.137* (0.0799)
High (57.2 – <95.8) 0.0102 (0.0819) -0.0338 (0.0769)
Very high (95.8+) -0.0185 (0.158) -0.140 (0.152)
Very low (<16.4) x outdoors -0.230 (0.383) -0.130 (0.370)
Low (16.4 – <28.4) x outdoors 0.164 (0.220) 0.236 (0.220)
High (57.2 – <95.8) x outdoors -0.0972 (0.217) -0.154 (0.246)
Very high (95.8+) x outdoors -0.0456 (0.355) -0.290 (0.320)
PM10, μg/m3
Very low (<5.5) -0.136 (0.137) -0.133 (0.136)
Low (5.5 – <8.1) 0.0274 (0.0719) 0.0328 (0.0694)
High (17.1 – <38.4) -0.0156 (0.0756) -0.0171 (0.0715)
Very high (38.4+) 0.101 (0.138) 0.115 (0.132)
Very low (<5.5) x outdoors 0.0922 (0.432) 0.118 (0.415)
Low (5.5 – <8.1) x outdoors 0.110 (0.216) 0.106 (0.215)
High (17.1 – <38.4) x outdoors -0.148 (0.211) -0.139 (0.211)
Very high (38.4+) x outdoors 0.224 (0.350) 0.269 (0.374)
Noise
Quiet -0.902*** (0.0751) -0.918*** (0.0749)
Loud 0.769*** (0.0995) 0.781*** (0.105)
Quiet x outdoors -0.619* (0.371) -0.667* (0.372)
Loud x outdoors 0.238 (0.220) 0.251 (0.220)
Conditions
Daylight 0.00748 (0.0990) 0.000809 (0.107)
Clear skies 0.189* (0.106) 0.299*** (0.0898)

Table A4: Happiness Impacts of Environmental Characteristics and Controls in Greater London, UK: Regression Models (continued)
Happiness (0 – 100)
1 2 3 4
Coeff SE Coeff SE Coeff SE Coeff SE
Rain -0.0602 (0.0809) -0.0546 (0.0855)
Partial sun 0.542*** (0.0618) 0.537*** (0.0597)
Continuous sun 0.879*** (0.0916) 0.861*** (0.103)
Daylight x outdoors -0.277 (0.254) -0.262 (0.249)
Clear skies x outdoors 0.229 (0.277) 0.378 (0.272)
Rain x outdoors -1.018*** (0.318) -0.983*** (0.309)
Partial sun x outdoors 0.976*** (0.188) 0.967*** (0.201)
Continuous sun x outdoors 1.712*** (0.262) 1.676*** (0.280)
Wind speed (base: 0 – 3 kt)
4 – 8 kt -0.225*** (0.0829) -0.221*** (0.0811)
9 – 14 kt -0.284*** (0.0965) -0.303*** (0.0889)
15+ kt -0.430*** (0.131) -0.454*** (0.118)
4 – 8 kt x outdoors -0.347 (0.285) -0.417 (0.259)
9 – 14 kt x outdoors -0.602** (0.294) -0.708** (0.288)
15+ kt x outdoors -0.734* (0.411) -0.870** (0.364)
Air temperature (base: < 0¬ ºC)
0 – 4 °C -0.264 (0.184) -0.284 (0.184)
5 – 9 °C -0.318 (0.202) -0.368* (0.208)
10 – 14 °C -0.135 (0.217) -0.194 (0.222)
15 – 19 °C -0.00285 (0.231) -0.0775 (0.239)
20 – 24 °C 0.0545 (0.256) -0.0548 (0.271)
25+ °C 1.081*** (0.366) 1.004*** (0.360)
0 – 4 °C x outdoors 0.725 (0.688) 0.719 (0.747)
5 – 9 °C x outdoors 0.531 (0.683) 0.442 (0.688)
10 – 14 °C x outdoors 0.528 (0.671) 0.433 (0.696)
15 – 19 °C x outdoors 1.147* (0.679) 1.011 (0.712)
20 – 24 °C x outdoors 0.746 (0.704) 0.626 (0.715)
25+ °C x outdoors 2.871*** (0.806) 2.847*** (0.805)
Selected activities
Walking, hiking 2.032*** (0.270) 2.087*** (0.276) 1.968*** (0.271) 2.032*** (0.275)
Sports, running, exercise 6.902*** (0.291) 6.951*** (0.298) 6.904*** (0.291) 6.955*** (0.299)
Gardening, allotment 6.348*** (0.646) 6.197*** (0.591) 6.201*** (0.645) 6.016*** (0.590)
Birdwatching, nature watching 4.414*** (0.627) 4.406*** (0.631) 3.901*** (0.636) 3.905*** (0.629)
Other activities
Working, studying -1.242*** (0.129) -1.193*** (0.123) -1.305*** (0.134) -1.250*** (0.123)
In a meeting, seminar, class 0.408** (0.171) 0.348** (0.168) 0.464*** (0.173) 0.401** (0.169)
Travelling, commuting -1.712*** (0.151) -1.658*** (0.165) -1.530*** (0.151) -1.471*** (0.163)
Cooking, preparing food 2.346*** (0.175) 2.367*** (0.166) 2.374*** (0.175) 2.397*** (0.167)
Housework, chores, DIY -0.186 (0.176) -0.153 (0.174) -0.180 (0.177) -0.148 (0.175)
Waiting, queueing -3.214*** (0.279) -3.211*** (0.281) -3.186*** (0.280) -3.179*** (0.281)
Shopping, errands 0.603*** (0.153) 0.599*** (0.166) 0.671*** (0.155) 0.675*** (0.166)

World Happiness Report 2020
Table A4: Happiness Impacts of Environmental Characteristics and Controls in Greater London, UK: Regression Models (continued)
Happiness (0 – 100)
1 2 3 4
Coeff SE Coeff SE Coeff SE Coeff SE
Admin, finances, organising -1.448*** (0.240) -1.440*** (0.230) -1.480*** (0.241) -1.472*** (0.231)
Childcare, playing with children 2.427*** (0.300) 2.486*** (0.281) 2.438*** (0.301) 2.505*** (0.281)
Pet care, playing with pets 4.031*** (0.426) 3.966*** (0.415) 3.996*** (0.432) 3.928*** (0.418)
Care or help for adults -2.437* (1.369) -2.477** (1.256) -2.428* (1.389) -2.478* (1.269)
Sleeping, resting, relaxing 0.701*** (0.176) 0.766*** (0.159) 0.612*** (0.179) 0.682*** (0.159)
Sick in bed -16.66*** (0.588) -16.66*** (0.585) -16.73*** (0.594) -16.73*** (0.589)
Meditating, religious activities 4.084*** (0.558) 4.088*** (0.523) 4.040*** (0.561) 4.059*** (0.523)
Washing, dressing, grooming 1.786*** (0.154) 1.829*** (0.146) 1.739*** (0.155) 1.781*** (0.147)
Talking, chatting, socialising 4.475*** (0.148) 4.472*** (0.155) 4.511*** (0.149) 4.509*** (0.154)
Intimacy, making love 11.40*** (0.473) 11.43*** (0.540) 11.41*** (0.473) 11.43*** (0.538)
Eating, snacking 2.011*** (0.122) 2.037*** (0.118) 2.048*** (0.123) 2.075*** (0.120)
Drinking tea/coffee 1.774*** (0.129) 1.762*** (0.123) 1.783*** (0.129) 1.774*** (0.122)
Drinking alcohol 3.566*** (0.197) 3.565*** (0.196) 3.630*** (0.197) 3.624*** (0.197)
Smoking -0.167 (0.363) -0.186 (0.338) -0.135 (0.363) -0.149 (0.339)
Texting, email, social media 1.221*** (0.138) 1.196*** (0.129) 1.196*** (0.138) 1.169*** (0.129)
Browsing the Internet 0.612*** (0.126) 0.634*** (0.127) 0.560*** (0.126) 0.580*** (0.128)
Watching TV, film 2.316*** (0.131) 2.313*** (0.125) 2.314*** (0.131) 2.313*** (0.125)
Listening to music 3.375*** (0.205) 3.319*** (0.205) 3.416*** (0.205) 3.360*** (0.205)
Listening to speech/podcast 1.932*** (0.259) 1.946*** (0.253) 1.963*** (0.260) 1.978*** (0.253)
Reading 1.900*** (0.214) 1.897*** (0.212) 1.856*** (0.217) 1.849*** (0.211)
Theatre, dance, concert 5.886*** (0.443) 5.851*** (0.403) 6.022*** (0.445) 5.971*** (0.405)
Exhibition, museum, library 4.727*** (0.366) 4.871*** (0.377) 4.747*** (0.364) 4.871*** (0.384)
Match, sporting event 2.483*** (0.753) 2.660*** (0.642) 2.517*** (0.742) 2.696*** (0.641)
Computer games, iPhone games 2.502*** (0.238) 2.485*** (0.231) 2.456*** (0.239) 2.445*** (0.231)
Hunting, fishing 0.171 (2.885) 0.396 (2.959) 0.376 (2.883) 0.581 (2.954)
Other games, puzzles 2.621*** (0.446) 2.647*** (0.438) 2.632*** (0.443) 2.665*** (0.433)
Gambling, betting -0.794 (1.288) -0.712 (1.255) -0.661 (1.289) -0.591 (1.255)
Hobbies, arts, crafts 5.154*** (0.483) 5.111*** (0.462) 5.145*** (0.490) 5.087*** (0.463)
Singing, performing 4.985*** (0.535) 4.943*** (0.530) 5.047*** (0.539) 5.006*** (0.535)
Something else (version < 1.0.2) -0.993** (0.393) -1.024*** (0.387) -1.017*** (0.393) -1.045*** (0.387)
Something else (version >= 1.0.2) -2.633*** (0.247) -2.642*** (0.271) -2.660*** (0.247) -2.666*** (0.272)
Companionship
Spouse, partner, girl/boyfriend 3.949*** (0.217) 3.927*** (0.198) 3.980*** (0.219) 3.964*** (0.198)
Children 0.338 (0.266) 0.394 (0.258) 0.380 (0.265) 0.441* (0.257)
Friends 3.956*** (0.150) 3.920*** (0.155) 4.017*** (0.150) 3.984*** (0.156)
Other family members 0.633*** (0.214) 0.668*** (0.200) 0.671*** (0.214) 0.709*** (0.200)
Colleagues, classmates 0.135 (0.160) 0.172 (0.136) 0.188 (0.164) 0.227* (0.134)
Clients, customers 1.771*** (0.362) 1.662*** (0.313) 1.820*** (0.371) 1.713*** (0.319)
Others -0.293 (0.240) -0.264 (0.245) -0.276 (0.241) -0.243 (0.245)
Location (base: indoors)
Outdoors 2.209*** (0.134) 2.213*** (0.137) 1.393* (0.746) 1.564** (0.763)
In a vehicle -0.695*** (0.180) -0.555*** (0.184) -0.779*** (0.182) -0.640*** (0.182)

Table A4: Happiness Impacts of Environmental Characteristics and Controls in Greater London, UK: Regression Models (continued)
Happiness (0 – 100)
1 2 3 4
Coeff SE Coeff SE Coeff SE Coeff SE
Location (base: at home)
Work -1.849*** (0.198) -2.025*** (0.202) -1.754*** (0.195) -1.942*** (0.201)
Elsewhere 1.121*** (0.154) 0.968*** (0.157) 1.290*** (0.151) 1.136*** (0.158)
Hour of day x weekend/ weekend dummies (46)
Yes Yes Yes Yes
Day of week/public holiday dummies (7)
Yes Yes Yes Yes
Month dummies (11) Yes Yes Yes Yes
Year dummies (8) Yes Yes Yes Yes
Christmas week dummy Yes Yes Yes Yes
Number of earlier responses (3rd order polynomial)
Yes Yes Yes Yes
Individual fixed effects Yes Yes Yes Yes
Local area (MSOA) fixed effects No Yes No Yes
Constant 62.49*** (1.109) 63.63*** (1.203) 61.69*** (1.102) 62.92*** (1.193)
N 503814 501325 503814 501325
Clusters: individuals 15466 12977 15466 12977
Clusters: local areas (MSOAs) — 982 — 982
Model 4 is the preferred specification presented in the main text.
Robust standard errors, clustered at individual level and (for models 2 and 4) local-area level, in parentheses.
Sources: Mappiness data set; London Air Quality Network; OS Open Greenspace; OS Open Rivers; ONS boundary data; EU EEA European Urban Atlas, Street Tree layer; Centre for Ecology & Hydrology, Lakes Portal; UK Met Office.
* p < 0.1, ** p < 0.05, *** p < 0.01

World Happiness Report 2020
Table A5. Happiness Impacts of Air Quality and Weather Conditions in Greater London, UK: Low-Choice Regression Model
Happiness (0 – 100)
Background NO2, μg/m3
Very low (<17.2) 0.342** (0.139)
Low (17.2 – <26.1) 0.159** (0.0731)
High (49.8 – <75.2) -0.0840 (0.0710)
Very high (75.2+) 0.00739 (0.127)
Background PM10, μg/m3
Very low (<9.1) -0.118 (0.107)
Low (9.1 – <13.7) 0.0212 (0.0619)
High (25.4 – <46.7) 0.0726 (0.0656)
Very high (46.7+) 0.219* (0.129)
Conditions
Daylight -0.122 (0.0959)
Clear skies 0.298*** (0.0680)
Partial sun 0.591*** (0.0617)
Continuous sun 0.833*** (0.0964)
Rain -0.122 (0.0834)
Wind speed (base: 0 – 3kt)
4 – 8 kt -0.328*** (0.0854)
9 – 14 kt -0.415*** (0.0973)
15+ kt -0.624*** (0.126)
Air temperature (base: < 0°C)
0 – 4 °C -0.252 (0.180)
5 – 9 °C -0.252 (0.202)
10 – 14 °C -0.0998 (0.217)
15 – 19 °C 0.118 (0.230)
20 – 24 °C 0.239 (0.252)
25+ °C 1.241*** (0.333)
Hour of day x weekend/weekend dummies (46)
Yes
Day of week/public holiday dummies (7)
Yes
Month dummies (11) Yes
Year dummies (8) Yes
Christmas week dummy Yes
Number of earlier responses (3rd order polynomial)
Yes
Individual fixed effects (15,839) Yes
Constant 67.29*** (1.074)
N 606,479
Individuals 15,839
Robust standard errors, clustered at individual level, in parentheses.
Sources: Mappiness data set; London Air Quality Network; UK Met Office.
* p < 0.1, ** p < 0.05, *** p < 0.01

Table A6. Descriptive Statistics: Environmental Characteristics of Mappiness Observations, Greater London
Binary variableProportion of
observations (%)Number of
observations
Green and blue spaces
Public green space 2.74 13,731
Street trees 5.64 28,294
Thames, <10m 1.68 8,434
Thames, 10 – 50m 0.86 4,305
Canal centreline, <20m 0.27 1,362
Pond/lake, <10m 0.12 610
Pond/lake, 10 - 50m 0.18 893
Public green space x outdoors 0.82 4,098
Street trees x outdoors 0.61 3,071
Thames, <10m x outdoors 0.21 1,060
Thames, 10 – 50m x outdoors 0.08 414
Canal centreline, <20m x outdoors 0.05 228
Pond/lake, <10m x outdoors 0.03 135
Pond/lake, 10 - 50m x outdoors 0.05 226
NO2, μg/m3
Very low (<16.4) 5.02 25,158
Low (16.4 – <28.4) 20.12 100,867
High (57.2 – <95.8) 19.79 99,231
Very high (95.8+) 4.85 24,291
Very low (<16.4) x outdoors 0.56 2,822
Low (16.4 – <28.4) x outdoors 2.03 10,161
High (57.2 – <95.8) x outdoors 1.84 9,229
Very high (95.8+) x outdoors 0.61 3,068
PM10, μg/m3
Very low (<5.5) 5.06 25,388
Low (5.5 – <8.1) 20.3 101,746
High (17.1 – <38.4) 19.92 99,878
Very high (38.4+) 5.04 25,281
Very low (<5.5) x outdoors 0.39 1,936
Low (5.5 – <8.1) x outdoors 1.8 9,000
High (17.1 – <38.4) x outdoors 2.08 10,434
Very high (38.4+) x outdoors 0.58 2,887
Noise
Quiet 21.74 108,993
Loud 23.38 117,224
Quiet x outdoors 0.52 2,608
Loud x outdoors 2.57 12,897
Conditions
Daylight 78.91 395,582
Clear skies 8.65 43,354
Rain 9.61 48,185
No sun 57.34 287,476
Partial sun 29.81 149,439
Continuous sun 12.85 64,410
Daylight x outdoors 7.9 39,588
Clear skies x outdoors 0.94 4,704

World Happiness Report 2020
Table A6. Descriptive Statistics: Environmental Characteristics of Mappiness Observations, Greater London (continued)
Binary variableProportion of
observations (%)Number of
observations
Rain x outdoors 0.64 3,215
No sun x outdoors 4.51 22,586
Partial sun x outdoors 3.25 16,313
Continuous sun x outdoors 1.61 8,063
Wind speed
0 – 3 kt 9.95 49,894
4 – 8 kt 41.68 208,963
9 – 14 kt 40.22 201,613
15+ kt 8.15 40,855
0 – 3 kt x outdoors 0.86 4,331
4 – 8 kt x outdoors 4 20,032
9 – 14 kt x outdoors 3.81 19,122
15+ kt x outdoors 0.69 3,477
Air temperature
< 0 °C 2.84 14,253
0 – 4 °C 11.35 56,885
5 – 9 °C 22.9 114,783
10 – 14 °C 28.24 141,561
15 – 19 °C 26.68 133,766
20 – 24 °C 6.86 34,381
25+ °C 1.14 5,696
< 0 °C x outdoors 0.17 839
0 – 4 °C x outdoors 0.73 3,682
5 – 9 °C x outdoors 1.65 8,252
10 – 14 °C x outdoors 2.54 12,737
15 – 19 °C x outdoors 3.01 15,093
20 – 24 °C x outdoors 1.06 5,299
25+ °C x outdoors 0.21 1,060
Selected activities
Walking, hiking 1.5 7,496
Sports, running, exercise 1.22 6,127
Gardening, allotment 0.19 974
Birdwatching, nature watching 0.14 686
Location
Indoors 84.53 423,788
Outdoors 9.37 46,962
In a vehicle 6.1 30,575
Location
At home 42.31 212,096
At work 32.4 162,446
Elsewhere 25.29 126,783
Notes: Statistics are reported here for all responses included in our preferred model specification (N = 501,325) as presented in Model 4, Table A4.

Table A7. Companionship-Activity Interactions, Full Sample
Happiness (0 – 100)
Binary variable Coeff SE
Activities
Working, studying -1.398*** (0.0942)
In a meeting, seminar, class 0.693*** (0.138)
Travelling, commuting -1.888*** (0.116)
Cooking, preparing food 2.756*** (0.119)
Housework, chores, DIY 0.494*** (0.105)
Waiting, queueing -3.539*** (0.159)
Shopping, errands 0.977*** (0.111)
Admin, finances, organising -0.817*** (0.157)
Childcare, playing with children 4.285*** (0.182)
Pet care, playing with pets 3.866*** (0.235)
Care or help for adults -3.679*** (0.798)
Sleeping, resting, relaxing 0.466*** (0.115)
Sick in bed -18.33*** (0.372)
Meditating, religious activities 5.561*** (0.443)
Washing, dressing, grooming 2.601*** (0.106)
Talking, chatting, socialising 5.375*** (0.103)
Intimacy, making love 10.18*** (0.497)
Eating, snacking 2.008*** (0.0786)
Drinking tea/coffee 2.016*** (0.0972)
Drinking alcohol 3.903*** (0.155)
Smoking -0.188 (0.227)
Texting, email, social media 1.280*** (0.0924)
Browsing the Internet 1.019*** (0.103)
Watching TV, film 2.338*** (0.0827)
Listening to music 3.449*** (0.113)
Listening to speech/podcast 1.937*** (0.142)
Reading 2.299*** (0.158)
Theatre, dance, concert 8.013*** (0.386)
Exhibition, museum, library 6.116*** (0.373)
Match, sporting event 3.896*** (0.366)
Walking, hiking 2.157*** (0.167)
Sports, running, exercise 7.604*** (0.178)
Gardening, allotment 5.910*** (0.319)
Birdwatching, nature watching 5.350*** (0.387)
Computer games, iPhone games 3.016*** (0.125)
Hunting, fishing 4.246** (1.725)
Other games, puzzles 3.062*** (0.391)
Gambling, betting 0.775 (0.895)
Hobbies, arts, crafts 5.932*** (0.249)
Singing, performing 6.835*** (0.379)
Something else (version < 1.0.2) -2.558*** (0.192)
Something else (version >= 1.0.2) -3.597*** (0.699)

World Happiness Report 2020
Table A7. Companionship-Activity Interactions, Full Sample (continued)
Happiness (0 – 100)
Binary variable Coeff SE
Companionship
Spouse, partner, girl/boyfriend 4.680*** (0.139)
Children 0.378*** (0.135)
Other family members 0.669*** (0.0856)
Colleagues, classmates -0.438*** (0.115)
Clients, customers 0.880*** (0.289)
Friends 6.296*** (0.132)
Others -0.713*** (0.145)
Friend x activity interactions
Friend x Working, studying -0.943*** (0.194)
Friend x In a meeting, seminar, class -1.310*** (0.260)
Friend x Travelling, commuting 0.867*** (0.173)
Friend x Cooking, preparing food -1.928*** (0.198)
Friend x Housework, chores, DIY -1.787*** (0.281)
Friend x Waiting, queueing 0.753*** (0.285)
Friend x Shopping, errands -0.266 (0.230)
Friend x Admin, finances, organising -0.380 (0.334)
Friend x Childcare, playing with children -2.412*** (0.234)
Friend x Pet care, playing with pets -1.600*** (0.414)
Friend x Care or help for adults 1.540 (0.984)
Friend x Sleeping, resting, relaxing -0.702*** (0.195)
Friend x Sick in bed 0.550 (0.804)
Friend x Meditating, religious activities -3.515*** (0.676)
Friend x Washing, dressing, grooming -1.534*** (0.289)
Friend x Talking, chatting, socialising -2.372*** (0.112)
Friend x Intimacy, making love -0.436 (0.814)
Friend x Eating, snacking -0.536*** (0.106)
Friend x Drinking tea/coffee -1.271*** (0.161)
Friend x Drinking alcohol 0.371** (0.161)
Friend x Smoking 1.385*** (0.328)
Friend x Texting, email, social media -1.009*** (0.218)
Friend x Browsing the Internet -1.491*** (0.260)
Friend x Watching TV, film -1.977*** (0.142)
Friend x Listening to music -1.262*** (0.164)
Friend x Listening to speech/podcast -2.104*** (0.436)
Friend x Reading -2.518*** (0.339)
Friend x Theatre, dance, concert -3.153*** (0.407)
Friend x Exhibition, museum, library -3.296*** (0.499)
Friend x Match, sporting event -3.064*** (0.377)
Friend x Walking, hiking -0.882*** (0.262)
Friend x Sports, running, exercise -3.535*** (0.292)
Friend x Gardening, allotment -2.825*** (0.765)
Friend x Birdwatching, nature watching -1.972** (0.786)
Friend x Computer games, iPhone games -1.129*** (0.282)
Friend x Hunting, fishing 1.614 (1.797)
Friend x Other games, puzzles -0.572 (0.462)

Table A7. Companionship-Activity Interactions, Full Sample (continued)
Happiness (0 – 100)
Binary variable Coeff SE
Friend x Gambling, betting 1.941* (1.101)
Friend x Hobbies, arts, crafts -2.730*** (0.425)
Friend x Singing, performing -2.335*** (0.485)
Friend x Something else (version < 1.0.2) 3.822*** (0.393)
Friend x Something else (version >= 1.0.2) 3.489*** (0.659)
Partner x activity interactions
Partner x Working, studying -0.710*** (0.198)
Partner x In a meeting, seminar, class -1.348*** (0.498)
Partner x Travelling, commuting 0.861*** (0.145)
Partner x Cooking, preparing food -0.789*** (0.148)
Partner x Housework, chores, DIY -2.784*** (0.153)
Partner x Waiting, queueing -0.265 (0.264)
Partner x Shopping, errands -0.569*** (0.175)
Partner x Admin, finances, organising -1.794*** (0.239)
Partner x Childcare, playing with children -3.019*** (0.213)
Partner x Pet care, playing with pets -1.208*** (0.327)
Partner x Care or help for adults -2.253 (1.422)
Partner x Sleeping, resting, relaxing 1.890*** (0.149)
Partner x Sick in bed -0.972 (0.743)
Partner x Meditating, religious activities -2.424** (0.974)
Partner x Washing, dressing, grooming -1.439*** (0.163)
Partner x Talking, chatting, socialising -1.598*** (0.130)
Partner x Intimacy, making love 2.850*** (0.534)
Partner x Eating, snacking 0.351*** (0.104)
Partner x Drinking tea/coffee -1.417*** (0.147)
Partner x Drinking alcohol -1.017*** (0.170)
Partner x Smoking 1.271*** (0.377)
Partner x Texting, email, social media -1.438*** (0.180)
Partner x Browsing the Internet -0.559*** (0.168)
Partner x Watching TV, film 0.410*** (0.110)
Partner x Listening to music 0.0153 (0.166)
Partner x Listening to speech/podcast -0.683** (0.335)
Partner x Reading -0.716*** (0.191)
Partner x Theatre, dance, concert -0.997** (0.426)
Partner x Exhibition, museum, library -0.395 (0.472)
Partner x Match, sporting event -2.150*** (0.465)
Partner x Walking, hiking 2.097*** (0.245)
Partner x Sports, running, exercise -1.998*** (0.315)
Partner x Gardening, allotment -2.298*** (0.451)
Partner x Birdwatching, nature watching -0.814 (0.576)
Partner x Computer games, iPhone games -0.828*** (0.196)
Partner x Hunting, fishing 0.804 (2.229)
Partner x Other games, puzzles -0.671 (0.463)
Partner x Gambling, betting 0.395 (1.278)
Partner x Hobbies, arts, crafts -1.584*** (0.349)
Partner x Singing, performing -1.189** (0.507)

World Happiness Report 2020
Table A7. Companionship-Activity Interactions, Full Sample (continued)
Happiness (0 – 100)
Binary variable Coeff SE
Partner x Something else (version < 1.0.2) 2.794*** (0.377)
Partner x Something else (version >= 1.0.2) -0.911** (0.409)
Conditions
Daylight 0.0292 (0.0488)
Clear skies 0.144*** (0.0392)
Rain -0.241*** (0.0399)
Partial sun 0.460*** (0.0304)
Continuous sun 0.900*** (0.0454)
Wind speed (base: 0 – 3 kt)
4 – 8 kt -0.0248 (0.0375)
9 – 14 kt -0.102** (0.0419)
15+ kt -0.220*** (0.0559)
Air temperature (base: < 0¬ ºC)
0 – 4 °C -0.386*** (0.0961)
5 – 9 °C -0.349*** (0.116)
10 – 14 °C -0.242* (0.127)
15 – 19 °C -0.208 (0.136)
20 – 24 °C -0.0113 (0.159)
25+ °C 0.747*** (0.249)
Location (base: indoors)
Outdoors 2.834*** (0.0979)
In a vehicle 0.0128 (0.107)
Location (base: home)
Work -2.066*** (0.110)
Elsewhere 1.591*** (0.0698)
Hour of day x weekend/weekend dummies (46)
Yes
Day of week/public holiday dummies (7) Yes
Month dummies (11) Yes
Year dummies (8) Yes
Christmas week dummy Yes
Number of earlier responses (3rd order polynomial)
Yes
Individual fixed effects (35,543) Yes
Constant 62.45*** (0.711)
N 2385711
Clusters: individuals 35,543
Notes: Standard errors in parentheses.
* p < 0.10, ** p < 0.05, *** p < 0.01