chapter 5 - ncdirindia.org€¦ · basis of diagnosis chapter 5 the relative proportion (%) of...
TRANSCRIPT
35
Basis of Diagnosis
Chapter 5
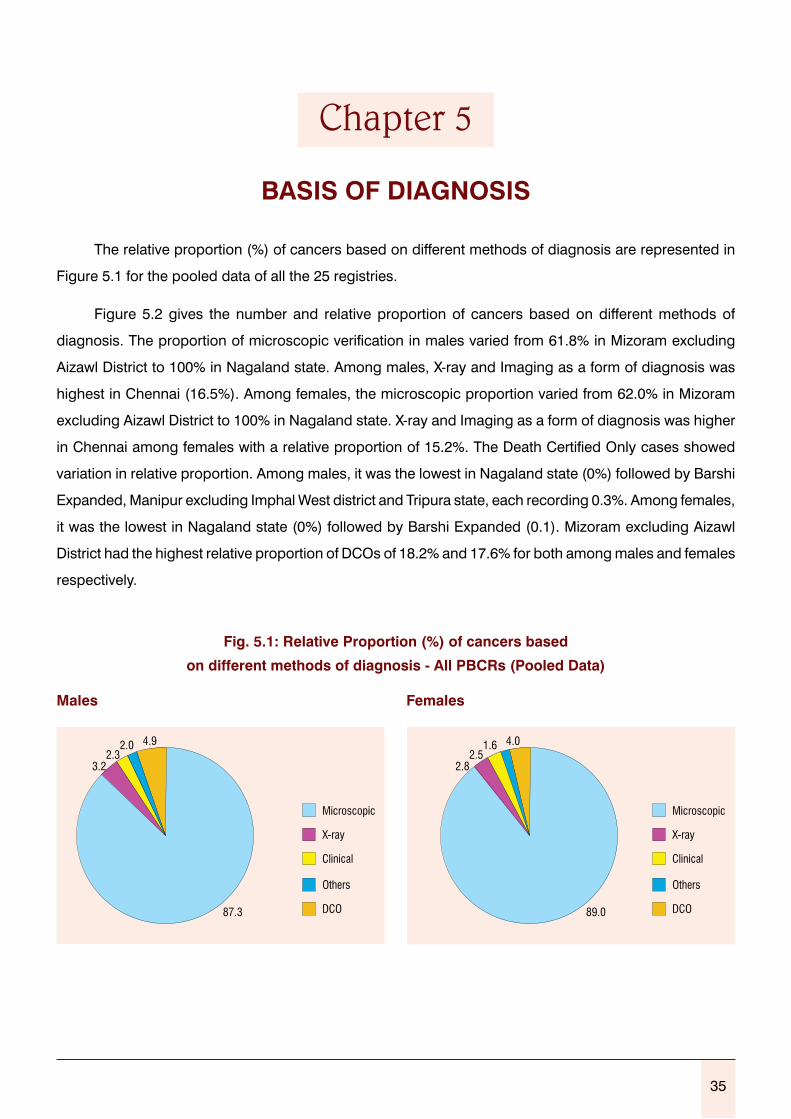
The relative proportion (%) of cancers based on different methods of diagnosis are represented in
Figure 5.1 for the pooled data of all the 25 registries.
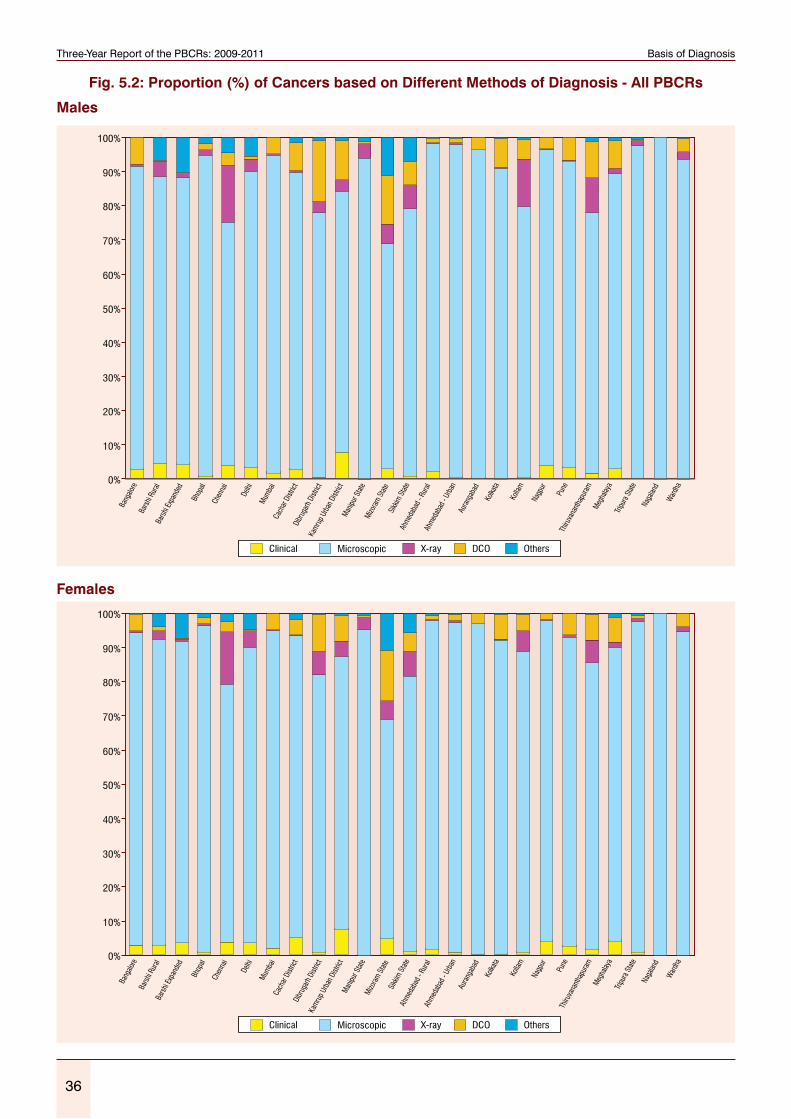
Figure 5.2 gives the number and relative proportion of cancers based on different methods of
diagnosis. The proportion of microscopic verification in males varied from 61.8% in Mizoram excluding
Aizawl District to 100% in Nagaland state. Among males, X-ray and Imaging as a form of diagnosis was
highest in Chennai (16.5%). Among females, the microscopic proportion varied from 62.0% in Mizoram
excluding Aizawl District to 100% in Nagaland state. X-ray and Imaging as a form of diagnosis was higher
in Chennai among females with a relative proportion of 15.2%. The Death Certified Only cases showed
variation in relative proportion. Among males, it was the lowest in Nagaland state (0%) followed by Barshi
Expanded, Manipur excluding Imphal West district and Tripura state, each recording 0.3%. Among females,
it was the lowest in Nagaland state (0%) followed by Barshi Expanded (0.1). Mizoram excluding Aizawl
District had the highest relative proportion of DCOs of 18.2% and 17.6% for both among males and females
respectively.
fig. 5.1: Relative Proportion (%) of cancers based
on different methods of diagnosis - all PBCRs (Pooled Data)
Males females
36
fig. 5.2: Proportion (%) of Cancers based on Different Methods of Diagnosis - all PBCRs
Males
females
Three-Year Report of the PBCRs: 2009-2011 Basis of Diagnosis