chapter 5 gathering information and measuring market demand by
DESCRIPTION
Chapter 5 Gathering Information and Measuring Market Demand by. PowerPoint by Milton M. Pressley University of New Orleans. Kotler on Marketing. Marketing is becoming a battle based more on information than on sales power. Chapter Objectives. - PowerPoint PPT PresentationTRANSCRIPT
5-1Copyright © 2003 Prentice-Hall, Inc.
Chapter 5Chapter 5Gathering Information and Gathering Information and Measuring Market DemandMeasuring Market Demandbyby
PowerPoint byPowerPoint byMilton M. PressleyMilton M. Pressley
University of New OrleansUniversity of New Orleans

5-2Copyright © 2003 Prentice-Hall, Inc.
Kotler on Marketing
Marketing is Marketing is becoming a battle becoming a battle based more on based more on information than information than on sales power.on sales power.
5-3Copyright © 2003 Prentice-Hall, Inc.
Chapter Objectives In this chapter, we focus on the following In this chapter, we focus on the following
questions: questions: What are the components of a modern What are the components of a modern
marketing information system?marketing information system? What constitutes good marketing research?What constitutes good marketing research? How can marketing decision support systems How can marketing decision support systems
help marketing managers make better help marketing managers make better decisions?decisions?
How can demand be more accurately How can demand be more accurately measured and forecasted?measured and forecasted?
5-4Copyright © 2003 Prentice-Hall, Inc.
Marketing Information System (MIS) Marketing Information System (MIS) 10 useful questions for determining the 10 useful questions for determining the
information needs of marketing information needs of marketing managers.managers. What decisions do you regularly make?What decisions do you regularly make? What information do you need to make these What information do you need to make these
decisions?decisions? What information do you regularly get?What information do you regularly get? What special studies do you periodically request?What special studies do you periodically request?
The Components of a Modern Marketing Information System

5-5Copyright © 2003 Prentice-Hall, Inc.
The Components of a Modern Marketing Information System
What information would you want that you are not What information would you want that you are not getting now?getting now?
What information would you want daily? Weekly? What information would you want daily? Weekly? Monthly? Yearly?Monthly? Yearly?
What magazines and trade reports would you like to What magazines and trade reports would you like to see on a regular basis? see on a regular basis?
What topics would you like to be kept informed of?What topics would you like to be kept informed of? What data analysis programs would you want?What data analysis programs would you want? What are the four most helpful improvements that What are the four most helpful improvements that
could be made in the present marketing information could be made in the present marketing information system?system?

5-6Copyright © 2003 Prentice-Hall, Inc.
Internal Record Systems
The Order-to-Payment CycleThe Order-to-Payment Cycle Sales Information SystemsSales Information Systems Databases, Data Warehouses Databases, Data Warehouses
And Data-MiningAnd Data-Mining

5-7Copyright © 2003 Prentice-Hall, Inc.
The Marketing Intelligence System
A Marketing Intelligence System A Marketing Intelligence System is a set of procedures and sources is a set of procedures and sources used by managers to obtain used by managers to obtain everyday information about everyday information about developments in the marketing developments in the marketing environment.environment.

5-8Copyright © 2003 Prentice-Hall, Inc.
The Marriott Vacation Club International Web site The Marriott Vacation Club International Web site gives interested customers the opportunity to sell gives interested customers the opportunity to sell
themselves on the Marriott offeringsthemselves on the Marriott offerings

5-9Copyright © 2003 Prentice-Hall, Inc.
CEOExpress.com is a portal to information–a user CEOExpress.com is a portal to information–a user clicks on a listing and is then connected to that siteclicks on a listing and is then connected to that site

5-10Copyright © 2003 Prentice-Hall, Inc.
Table 5-1: Secondary-Data Sources
Secondary-Secondary-Data SourcesData Sources
A.A. Internal SourcesInternal Sources
Company profit-loss statements, balance Company profit-loss statements, balance sheets, sales figures, sales-call reports, sheets, sales figures, sales-call reports, invoices, inventory records, and prior invoices, inventory records, and prior research reports.research reports.
B.B. Government PublicationsGovernment Publications• Statistical Abstract of the United StatesStatistical Abstract of the United States• County and City Data BookCounty and City Data Book• Industrial OutlookIndustrial Outlook• Marketing Information GuideMarketing Information Guide
C.C. Periodicals and BooksPeriodicals and Books• Business Periodicals IndexBusiness Periodicals Index• Standard and Poor’s IndustryStandard and Poor’s Industry
See text for complete table

5-11Copyright © 2003 Prentice-Hall, Inc.
Marketing Research System Marketing ResearchMarketing Research Suppliers of Marketing ResearchSuppliers of Marketing Research
Engaging students or professors to Engaging students or professors to design and carry out projectsdesign and carry out projects
Using the InternetUsing the Internet Checking out rivalsChecking out rivals Syndicated-service research firmsSyndicated-service research firms Custom marketing research firmsCustom marketing research firms Specialty-line marketing research Specialty-line marketing research
firmsfirms
5-12Copyright © 2003 Prentice-Hall, Inc.
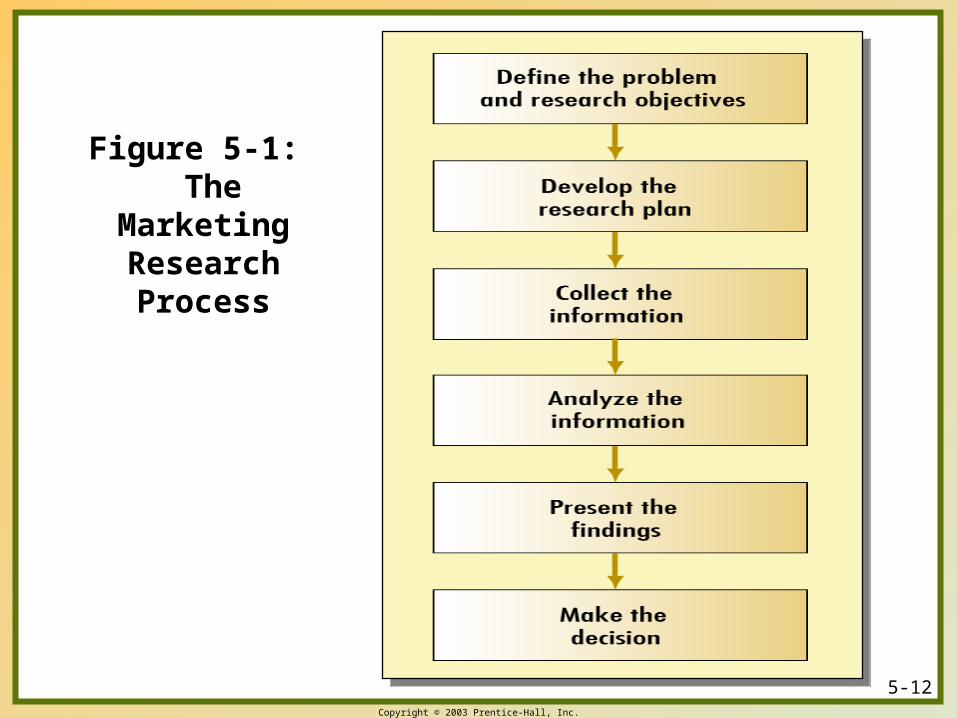
Figure 5-1: The Marketing
Research Process

5-13Copyright © 2003 Prentice-Hall, Inc.
Marketing Research System The Marketing Research ProcessThe Marketing Research Process
Step 1: Define the Problem, the Step 1: Define the Problem, the Decision Alternatives, and the Decision Alternatives, and the Research ObjectivesResearch Objectives
Step 2: Develop the Step 2: Develop the
Research PlanResearch Plan Data SourcesData Sources Research ApproachesResearch Approaches
Observational researchObservational research Focus group researchFocus group research
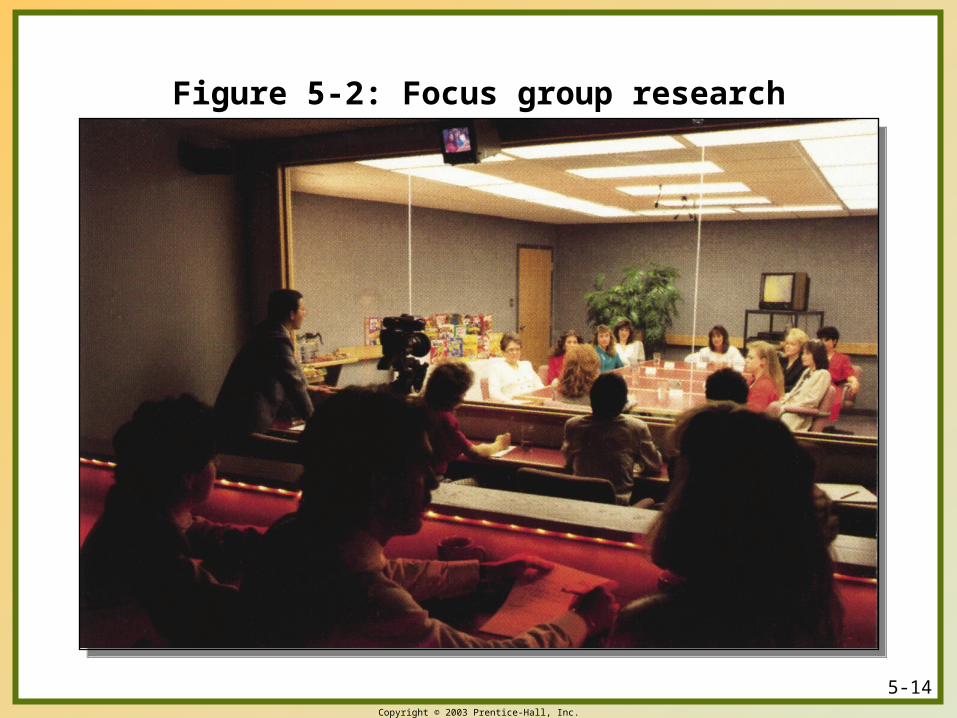
5-14Copyright © 2003 Prentice-Hall, Inc.
Figure 5-2: Focus group research
5-15Copyright © 2003 Prentice-Hall, Inc.
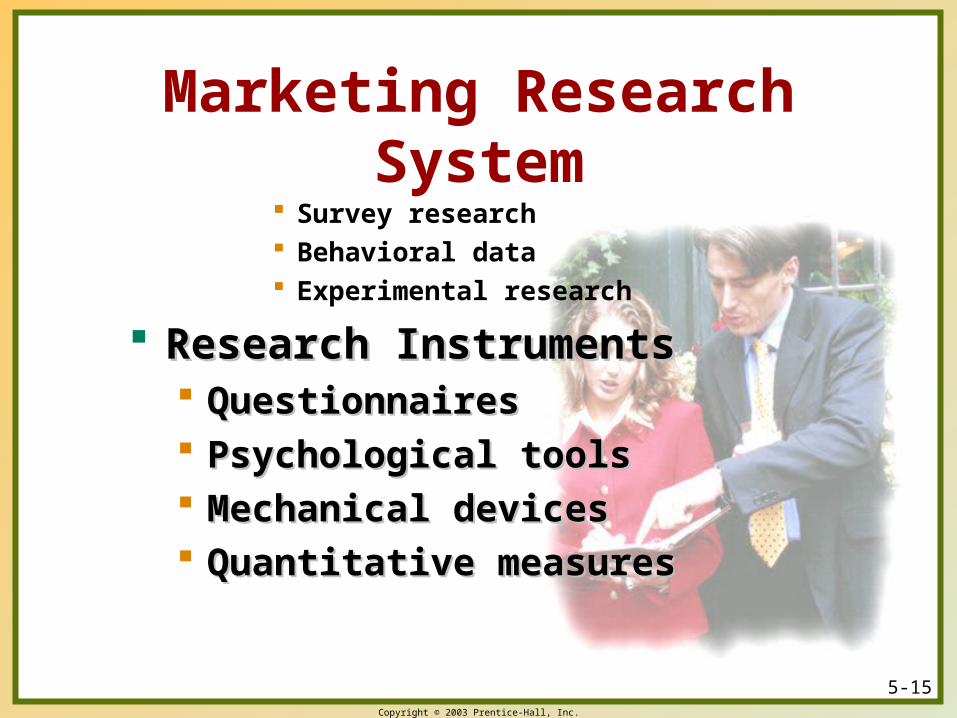
Marketing Research System Survey research Behavioral data Experimental research
Research InstrumentsResearch Instruments QuestionnairesQuestionnaires Psychological toolsPsychological tools Mechanical devicesMechanical devices Quantitative measuresQuantitative measures
5-16Copyright © 2003 Prentice-Hall, Inc.
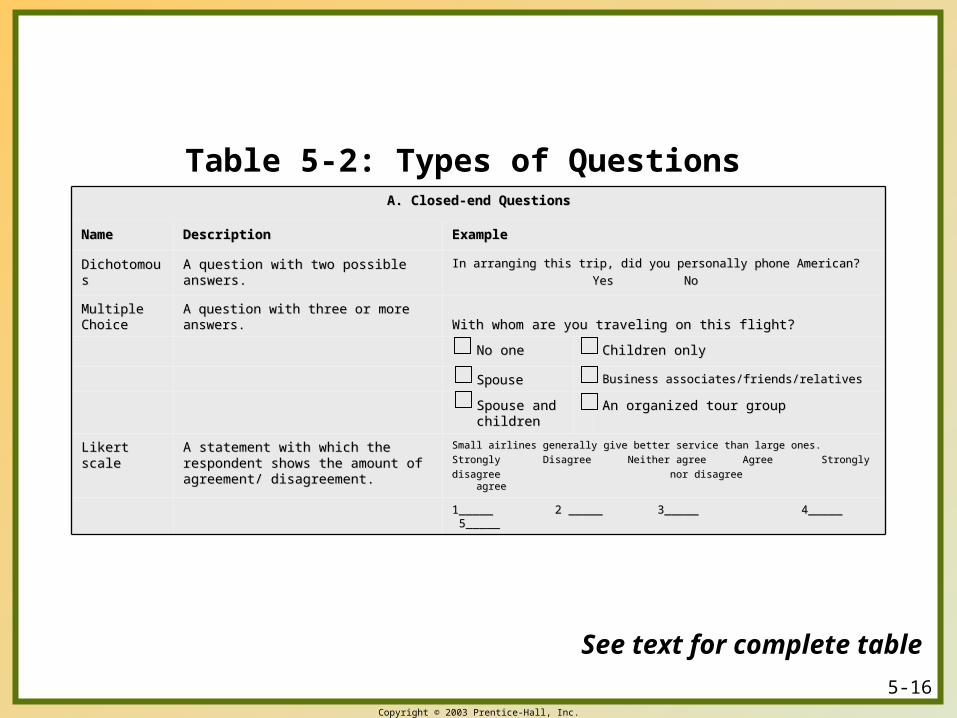
Table 5-2: Types of Questions
See text for complete table
1_____ 2 _____ 3_____ 4_____ 5_____1_____ 2 _____ 3_____ 4_____ 5_____
Small airlines generally give better service than large ones.Small airlines generally give better service than large ones.
Strongly Disagree Neither agree Agree StronglyStrongly Disagree Neither agree Agree Strongly
disagree nor disagree agreedisagree nor disagree agree
A statement with which the respondent A statement with which the respondent shows the amount of agreement/ shows the amount of agreement/ disagreement.disagreement.
Likert scaleLikert scale
An organized tour groupAn organized tour groupSpouse and Spouse and childrenchildren
Business associates/friends/relativesBusiness associates/friends/relativesSpouseSpouse
Children onlyChildren onlyNo oneNo one
With whom are you traveling on this flight?With whom are you traveling on this flight?A question with three or more answers.A question with three or more answers.Multiple Multiple ChoiceChoice
In arranging this trip, did you personally phone American?In arranging this trip, did you personally phone American?
Yes NoYes No
A question with two possible answers.A question with two possible answers.DichotomousDichotomous
ExampleExampleDescriptionDescriptionNameName
A. Closed-end QuestionsA. Closed-end Questions
5-17Copyright © 2003 Prentice-Hall, Inc.
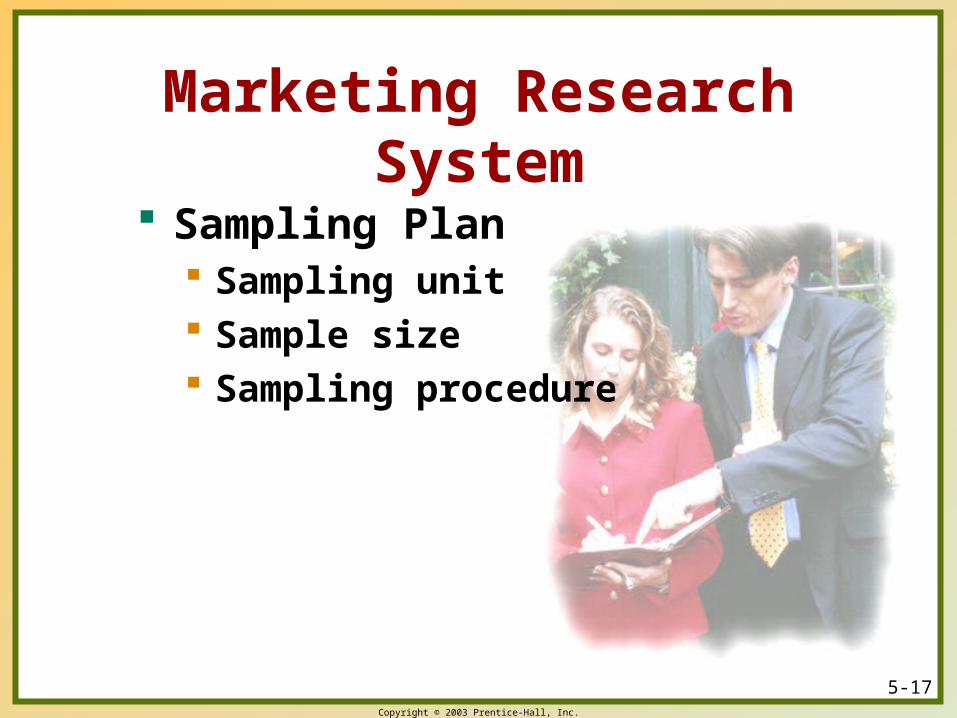
Marketing Research System
Sampling Plan Sampling unit Sample size Sampling procedure
5-18Copyright © 2003 Prentice-Hall, Inc.
www.wansink.com is a consumer psychology Web site set up by Dr. Brian Wansink of the
University of Illinois

5-19Copyright © 2003 Prentice-Hall, Inc.
A.A. Probability SampleProbability Sample
Simple random sampleSimple random sample Every member of the population has an Every member of the population has an equal chance of selectionequal chance of selection
Stratified random Stratified random samplesample
The population is divided into mutually The population is divided into mutually exclusive groups (such as age groups), exclusive groups (such as age groups), and random samples are drawn from and random samples are drawn from each groupeach group
Cluster (area) sampleCluster (area) sample The population is divided into mutually The population is divided into mutually exclusive groups (such as city blocks), exclusive groups (such as city blocks), and the researcher draws a sample of and the researcher draws a sample of the groups to interviewthe groups to interview
Table 5-3: Probability and Nonprobability Samples
Continued on next slide . . .
5-20Copyright © 2003 Prentice-Hall, Inc.
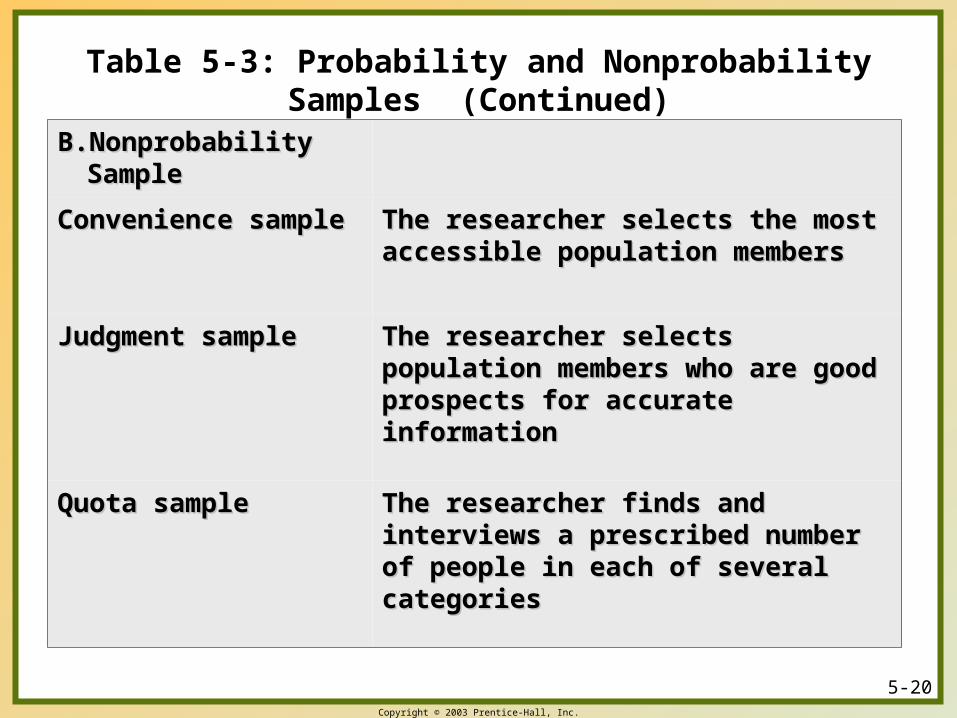
B.B. Nonprobability Nonprobability SampleSample
Convenience sampleConvenience sample The researcher selects the most The researcher selects the most accessible population membersaccessible population members
Judgment sampleJudgment sample The researcher selects population The researcher selects population members who are good prospects for members who are good prospects for accurate informationaccurate information
Quota sampleQuota sample The researcher finds and interviews a The researcher finds and interviews a prescribed number of people in each of prescribed number of people in each of several categoriesseveral categories
Table 5-3: Probability and Nonprobability Samples (Continued)

5-21Copyright © 2003 Prentice-Hall, Inc.
Marketing Research System Contact Methods
Mail questionnaire Personal interviewing
Arranged interviews Intercept interviews Online methods
Click-stream Cookies Automated
telephone surveys

5-22Copyright © 2003 Prentice-Hall, Inc.
Marketing Research System Step 3: Collect the
Information Step 4: Analyze the
Information Step 5: Present the
Findings Step 6: Make the
Decision
5-23Copyright © 2003 Prentice-Hall, Inc.
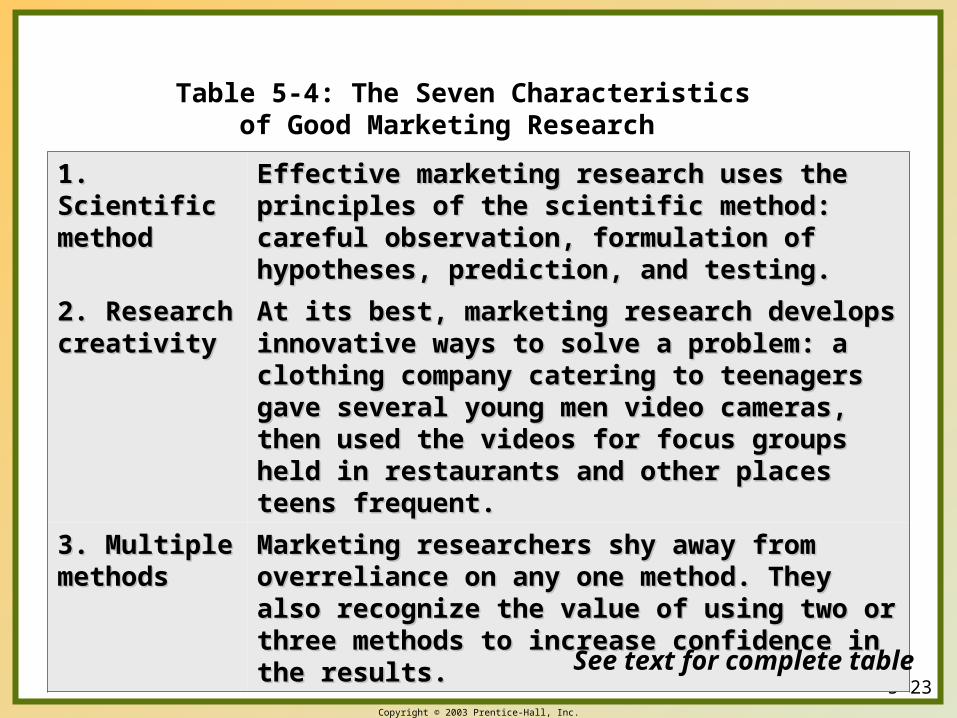
Table 5-4: The Seven Characteristics of Good Marketing Research
1. Scientific 1. Scientific methodmethod
Effective marketing research uses the principles Effective marketing research uses the principles of the scientific method: careful observation, of the scientific method: careful observation, formulation of hypotheses, prediction, and testing.formulation of hypotheses, prediction, and testing.
2. Research 2. Research creativitycreativity
At its best, marketing research develops At its best, marketing research develops innovative ways to solve a problem: a clothing innovative ways to solve a problem: a clothing company catering to teenagers gave several company catering to teenagers gave several young men video cameras, then used the videos young men video cameras, then used the videos for focus groups held in restaurants and other for focus groups held in restaurants and other places teens frequent.places teens frequent.
3. Multiple 3. Multiple methodsmethods
Marketing researchers shy away from overreliance Marketing researchers shy away from overreliance on any one method. They also recognize the value on any one method. They also recognize the value of using two or three methods to increase of using two or three methods to increase confidence in the results.confidence in the results.
See text for complete table
5-24Copyright © 2003 Prentice-Hall, Inc.
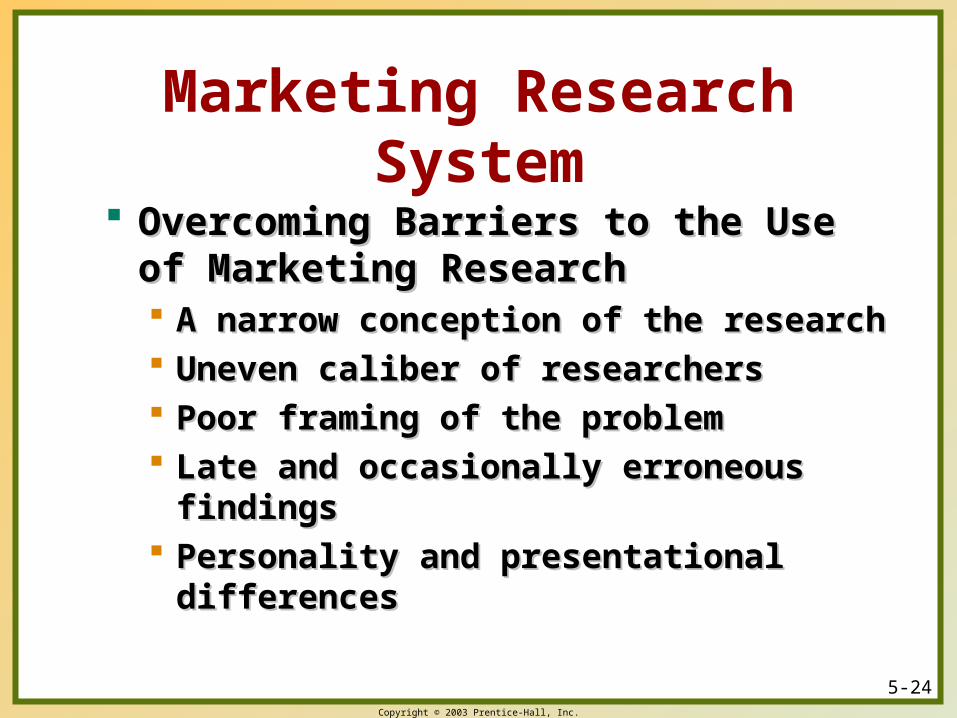
Marketing Research System
Overcoming Barriers to the Use of Overcoming Barriers to the Use of Marketing ResearchMarketing Research A narrow conception of the researchA narrow conception of the research Uneven caliber of researchersUneven caliber of researchers Poor framing of the problemPoor framing of the problem Late and occasionally erroneous findingsLate and occasionally erroneous findings Personality and presentational differencesPersonality and presentational differences
5-25Copyright © 2003 Prentice-Hall, Inc.
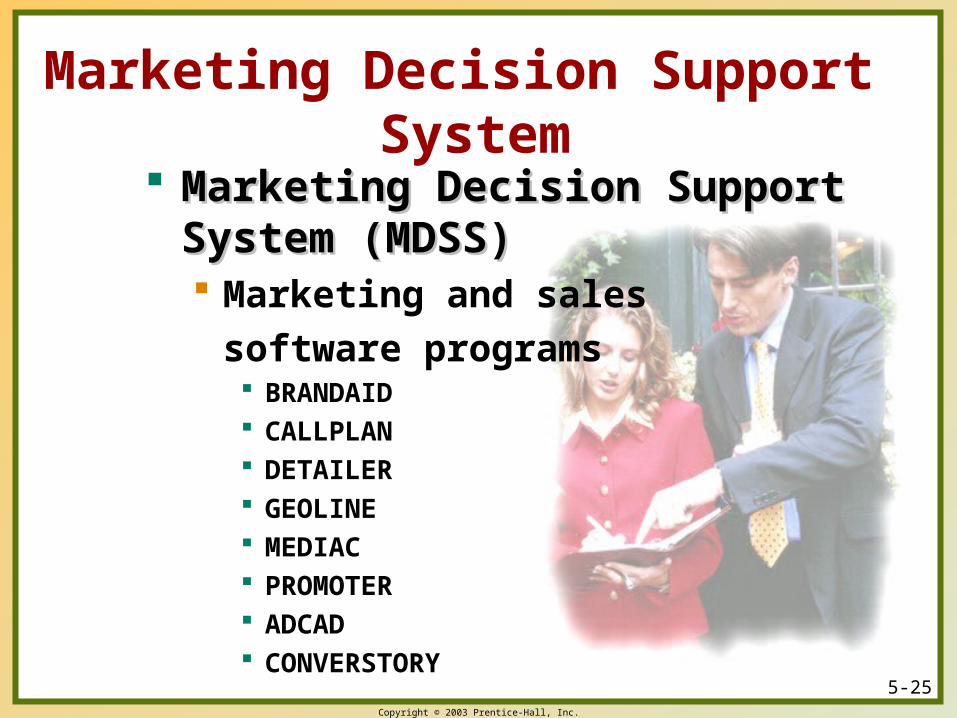
Marketing Decision Support System
Marketing Decision Support Marketing Decision Support System (MDSS)System (MDSS) Marketing and sales
software programs BRANDAID CALLPLAN DETAILER GEOLINE MEDIAC PROMOTER ADCAD CONVERSTORY

5-26Copyright © 2003 Prentice-Hall, Inc.
Table 5-5: Quantitative Tools Used in Marketing Decision Support Systems
Statistical ToolsStatistical Tools
1. Multiple 1. Multiple regression:regression:
A statistical technique for estimating a “best fitting” A statistical technique for estimating a “best fitting” equation showing how the value of a dependent variable equation showing how the value of a dependent variable varies with changing values in a number of independent varies with changing values in a number of independent variables. variables. ExampleExample: A company can estimate how unit : A company can estimate how unit sales are influenced by changes in the level of company sales are influenced by changes in the level of company advertising expenditures, sales force size, and price.advertising expenditures, sales force size, and price.
2. Discriminant 2. Discriminant analysis:analysis:
A statistical technique for classifying an object or A statistical technique for classifying an object or persons into two or more categories. persons into two or more categories. ExampleExample: A large : A large retail chain store can determine the variables that retail chain store can determine the variables that discriminate between successful and unsuccessful store discriminate between successful and unsuccessful store locations.locations.
3. Factor 3. Factor analysis:analysis:
A statistical technique used to determine the few A statistical technique used to determine the few underlying dimensions of a larger set of intercorrelated underlying dimensions of a larger set of intercorrelated variables. variables. ExampleExample: A broadcast network can reduce a : A broadcast network can reduce a large set of TV programs down to a small set of basic large set of TV programs down to a small set of basic program types.program types.
See text for complete table
5-27Copyright © 2003 Prentice-Hall, Inc.
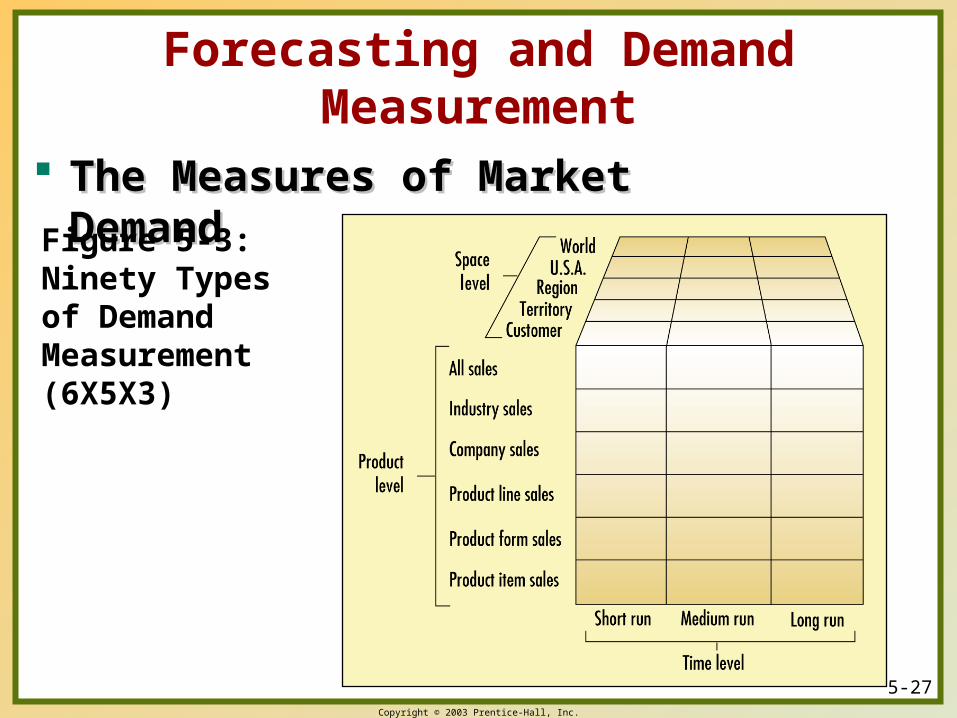
Forecasting and Demand Measurement
The Measures of Market DemandThe Measures of Market Demand
Figure 5-3: Ninety Types of Demand Measurement (6X5X3)
5-28Copyright © 2003 Prentice-Hall, Inc.
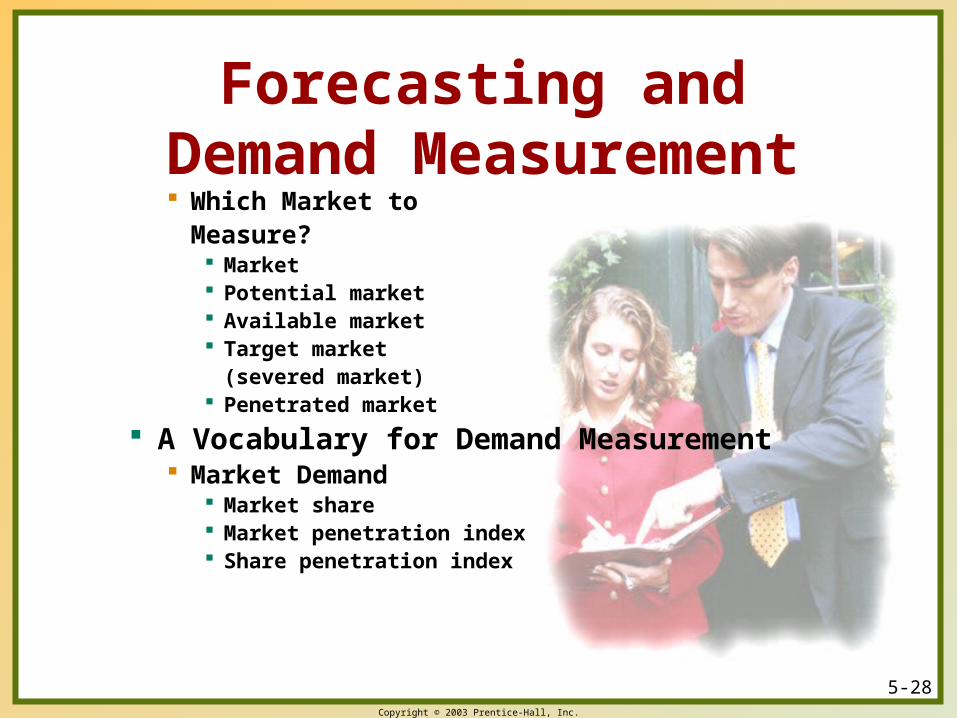
Which Market to Measure? Market Potential market Available market Target market
(severed market) Penetrated market
A Vocabulary for Demand Measurement Market Demand
Market share Market penetration index Share penetration index
Forecasting and Demand Measurement
5-29Copyright © 2003 Prentice-Hall, Inc.
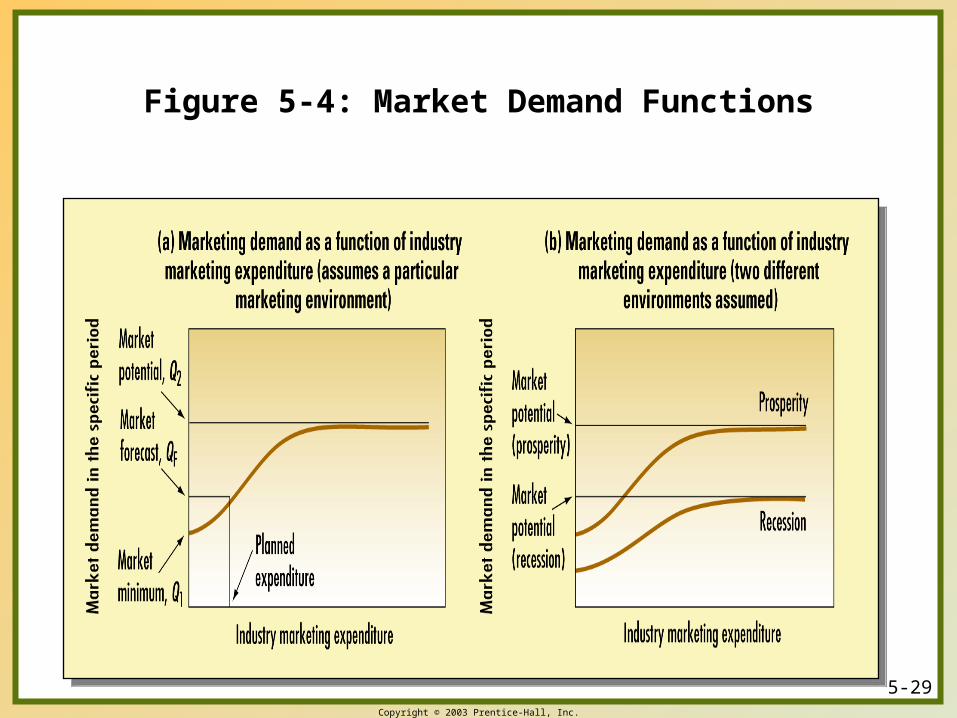
Figure 5-4: Market Demand Functions
5-30Copyright © 2003 Prentice-Hall, Inc.
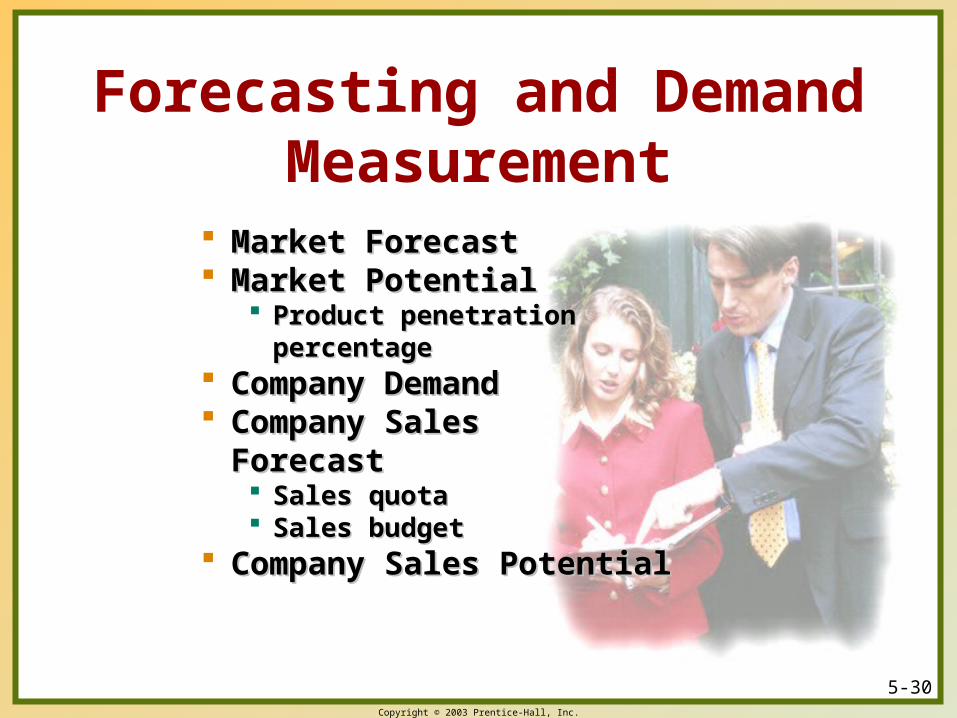
Forecasting and Demand Measurement
Market ForecastMarket Forecast Market PotentialMarket Potential
Product penetration Product penetration percentagepercentage
Company DemandCompany Demand Company Sales Company Sales
ForecastForecast Sales quotaSales quota Sales budgetSales budget
Company Sales PotentialCompany Sales Potential

5-31Copyright © 2003 Prentice-Hall, Inc.
Estimating Current demandEstimating Current demand Total Market PotentialTotal Market Potential Area Market PotentialArea Market Potential
Market-Buildup MethodMarket-Buildup Method
Forecasting and Demand Measurement
5-32Copyright © 2003 Prentice-Hall, Inc.
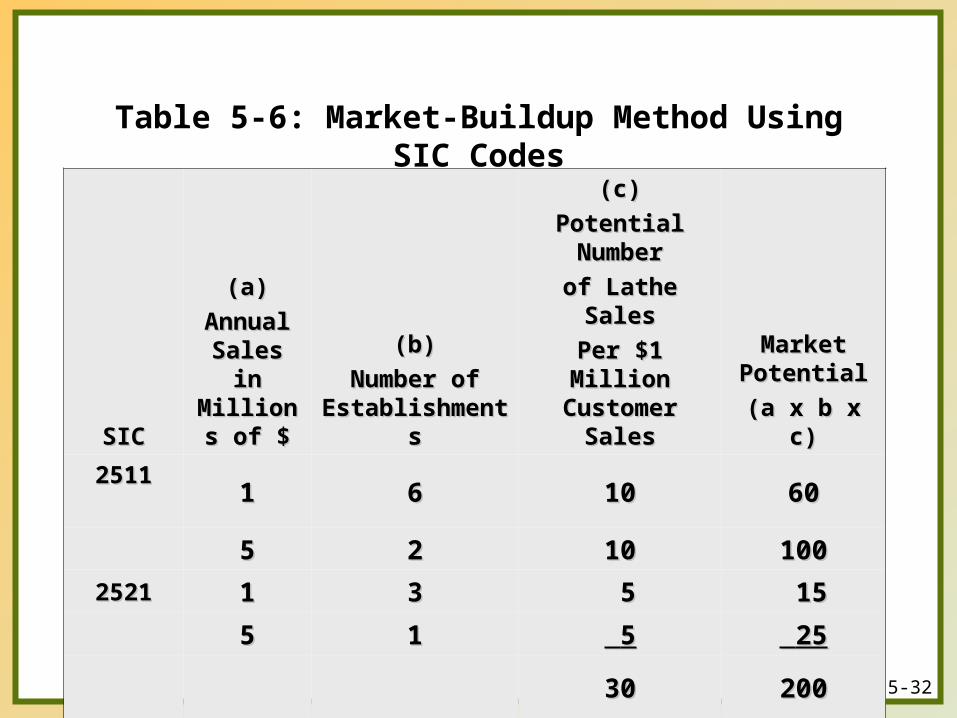
Table 5-6: Market-Buildup Method Using SIC Codes
SICSIC
(a)(a)
Annual Annual Sales in Sales in Millions Millions
of $of $
(b)(b)
Number of Number of EstablishmentsEstablishments
(c)(c)
Potential Potential NumberNumber
of Lathe Salesof Lathe Sales
Per $1 Million Per $1 Million Customer SalesCustomer Sales
Market Market PotentialPotential
(a x b x c)(a x b x c)
2511251111 66 1010 6060
55 22 1010 100100
25212521 11 33 55 1515
55 11 55 2525
3030 200200
5-33Copyright © 2003 Prentice-Hall, Inc.
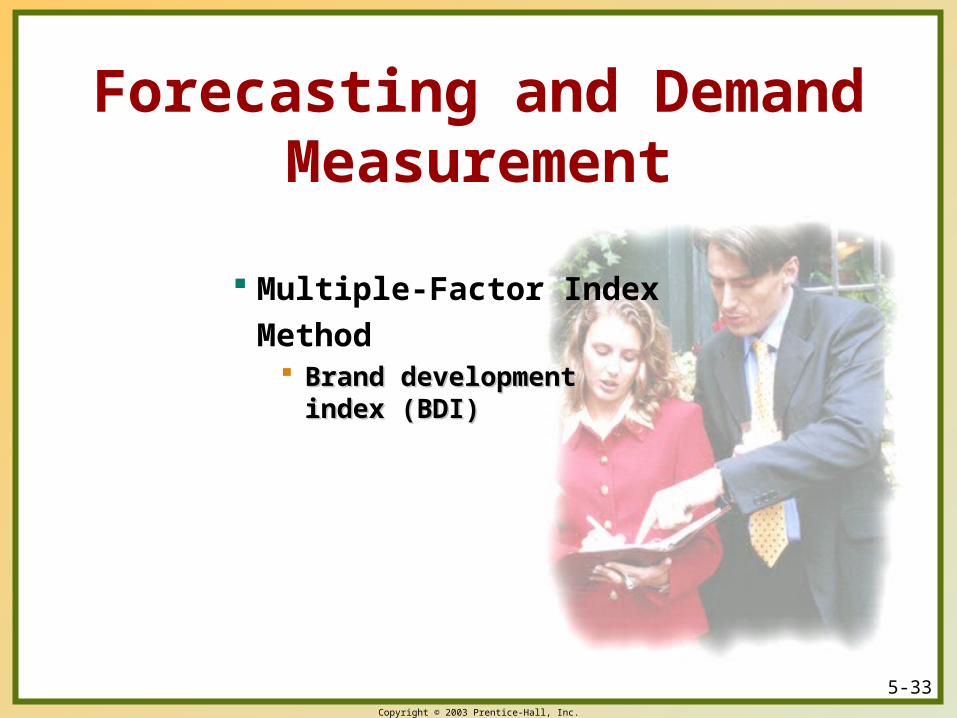
Forecasting and Demand Measurement
Multiple-Factor Index
Method Brand development Brand development
index (BDI)index (BDI)

5-34Copyright © 2003 Prentice-Hall, Inc.
Table 5-7: Calculating the Brand Development Index (BDI)
(a)(a)
Percent of Percent of
U.S. BrandU.S. Brand
(b)(b)
Percent of Percent of
U.S. CategoryU.S. Category BDIBDI
TerritoryTerritory SalesSales SalesSales (a (a b) x 100 b) x 100
SeattleSeattle 3.093.09 2.712.71 114114
PortlandPortland 6.746.74 10.4110.41 6565
BostonBoston 3.493.49 3.853.85 9191
ToledoToledo .97.97 .81.81 120120
ChicagoChicago 1.131.13 .81.81 140140
BaltimoreBaltimore 3.123.12 3.003.00 104104
5-35Copyright © 2003 Prentice-Hall, Inc.
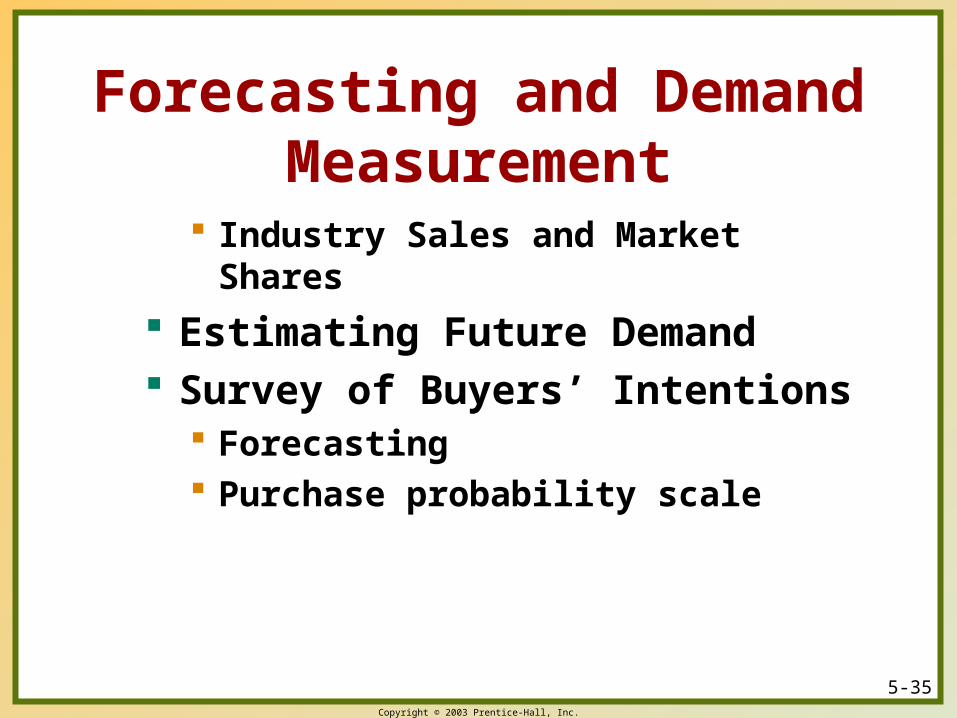
Forecasting and Demand Measurement
Industry Sales and Market Shares
Estimating Future Demand Survey of Buyers’ Intentions
Forecasting Purchase probability scale
5-36Copyright © 2003 Prentice-Hall, Inc.
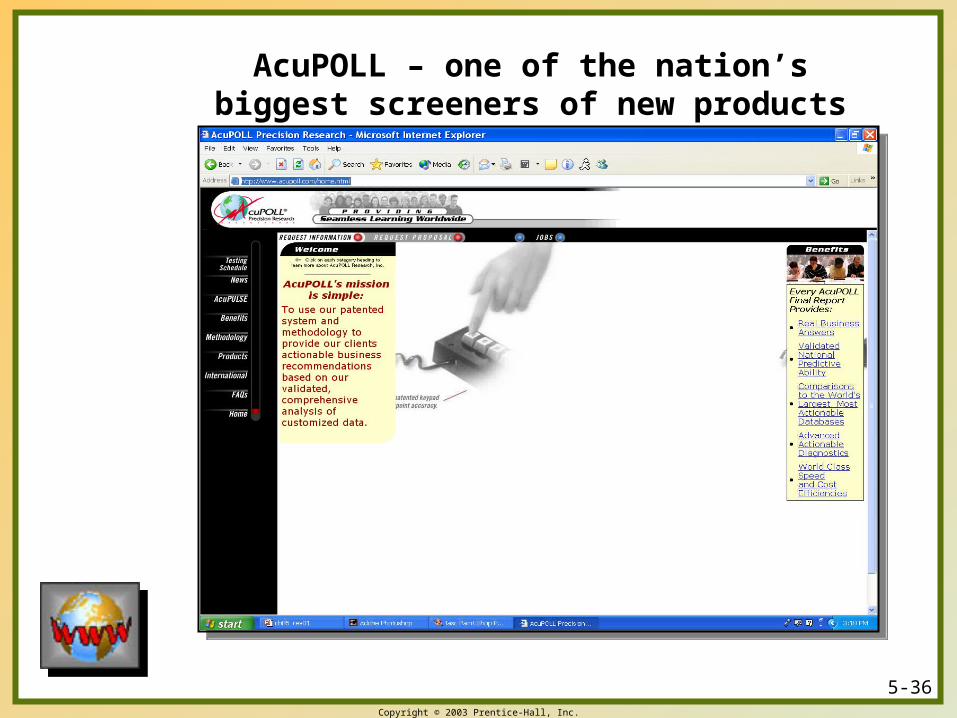
AcuPOLL – one of the nation’s biggest screeners of new products
5-37Copyright © 2003 Prentice-Hall, Inc.
Forecasting and Demand Measurement
Composite of Sales Force Opinions Expert Opinion
Group discussion method Pooling of individual estimates Past-Sales Analysis
Time-series analysis Exponential smoothing Statistical demand analysis Econometric analysis
Market-Test Method