chapter 5 income, income sources, and employment
TRANSCRIPT

1 Unless noted specifically in the text, all comparisons are statistically significant at p = .10 or better, andall percentages presented by themselves have a 90 percent confidence interval no larger than + 4 percentage points. A confidence interval of + 4 percentage points means that if the reported percent is 60, 60 is the best estimate of thetrue value and the probability is 90 percent that the true value falls between 56 and 64 percent. Confidence intervalsgreater than + 4 percentage points will noted in a footnote as: 90% C.I.= + X percentage points.
5-1
CHAPTER 5INCOME, INCOME SOURCES, AND EMPLOYMENT
Highlights: Homeless Clients1
C Over the last 30 days, homeless clients’ mean income was $367 and median income was$300. In 1996, the federal poverty level was $680 in monthly income for a single person,indicating the extreme poverty of homeless clients.
• 13 percent of homeless clients report no income at all during the past 30 days.
C 44 percent did some type of paid work during the last 30 days, with the majority earningmoney from short-term jobs.
C 65 percent worked all or most of the time since age 16. However, 19 percent neverworked or had not worked for more than five years.
C Besides receiving income from work, day labor, or unemployment insurance over the last30 days, clients received income from AFDC (10 percent of all clients and 52 percent ofclients in families) or General Assistance (9 percent) and food stamps (37 percent).
C Homeless clients in families are less likely than single homeless clients to have donesome type of paid work during the last 30 days (29 percent versus 46 percent).
C Forty-five percent of all homeless clients report receiving some type of means-testedgovernment assistance. Omitting food stamps from this calculation drops this figure to28 percent. Eighty-one percent of homeless clients report that at some time in their livesthey have received some type of means-tested government assistance, a figure that dropsto 58 percent if food stamps are left out of the calculation.
• Homeless families are more likely than single homeless clients to have received AFDC(52 versus 3 percent) and food stamps (71 versus 31 percent).

5-2
Highlights: Currently and Formerly Homeless Clients and Other Service Users Compared
• Currently homeless clients report the lowest median income over the last month ($300,versus $462 for formerly homeless clients and $480 and $599 for other service users 64and younger and 65 and older, respectively). At $599, the median income of otherservice users 65 and older is higher than that for any other group during the same period.
• Currently homeless clients are more likely than formerly homeless clients to reportincome from working during the past 30 days, but more of the jobs held by currentlyhomeless clients are short term, compared to those held by formerly homeless clients.
C Other service users 65 and older are much less likely than clients from the three othergroups to have received income from working over the last 30 days. Instead, older otherservice users are much more likely to have received social security benefits in the lastmonth (87 versus 3 to 11 percent).
• Lifetime employment patterns do not differ substantially among currently and formerlyhomeless clients and other service users 64 and younger. However, other service users 65and older are more likely than clients in the other three groups to report working all of thetime since age 16 (48 percent versus 35 to 40 percent).
INTRODUCTION
A primary point of agreement among students of homelessness is that lack of money is one factorunderlying virtually all homelessness, independent of other factors that may push a person intothis condition. Therefore, homeless clients’ income level over the last 30 days is the first aspectof their economic situation examined in this chapter. The survey collected information aboutclients’ income from several sources, including work and a variety of government benefitprograms.
This chapter also examines the reasons given by homeless and unemployed clients for notworking at present, and also looks at work histories to see whether or not clients have hadsubstantial work experience. It also reports lifetime involvement with government benefitprograms and experiences with these programs during the year before becoming homeless.
The chapter then examines income, employment, and government benefits for specific subgroupsof homeless clients, including: whether or not the client lives with his/her own minor children,whether or not the client has had an alcohol, drug, or mental health (ADM) problem in the pastmonth, and the client’s race/ethnicity. Past studies have varied in their reports of employmentand work levels, government benefits, and other income sources among homeless people. Explanations for this variation have usually included discussions of special populationcharacteristics such as the percent of female-headed households with children or ADM status

5-3
(which affect the likelihood of receiving particular types of government benefits). However,most studies have not had enough variety in their settings and samples to examine theseexplanations in detail. NSHAPC offers an excellent opportunity to do so. The chapter ends bycomparing the situations of currently and formerly homeless clients and other service users.
HOMELESS RESPONDENTS
Current Income Levels and Sources
The incomes of homeless clients are extremely low (table 5.1 and figure 5.1). Mean incomeduring the last 30 days was $367. Mean income for clients in families was higher ($475), butwas still only 46 percent of the federal poverty line of $1,023 for a family of three and had tosupport the parent and two children (on average). All other homeless clients reported lessincome, averaging $348 during the past month, or just 51 percent of the federal poverty line of$680/month for one person in 1996. Note also that the median monthly income for all Americanhouseholds was $2,840 in 1995, indicating the extreme poverty of homeless clients whether theybe families or singles.
Many homeless clients report supplementing their cash income with food stamps. Thirty-sevenpercent of homeless clients report receiving food stamps. Two-thirds of these clients (24 percentof all homeless clients) receive under $121 per month in food stamps and one-third (12 percentof all homeless clients) receive $121 to $399 per month in food stamps.
Besides asking clients about their total income, the survey asked clients about the sources of theirincome, probing for access to a variety of sources (table 5.2 and figure 5.2). Homeless clientsreport receiving income from many sources during the 30 day period prior to the NSHAPCinterview. These sources include work, government programs, and friends and family members.
Forty-nine percent of homeless clients have received income from work (including day labor,peddling, and selling personal belongings). The next most common income source is means-tested government benefits, including Aid to Families with Dependent Children (AFDC) GeneralAssistance (GA), and Supplemental Security Income (SSI). Twenty-eight percent of all homelessclients received income from one or more of these sources during the 30 days prior to interview. Twenty-seven percent of homeless clients report income from one or more of: asking for moneyon the streets, a blood or plasma center, illegal activities, and sources other than those askedabout. Also, 21 percent of homeless clients report receiving money from family, relatives,friends, a spouse, and/or in child support.
Looking at income sources individually, 11 percent of homeless clients receive income from SSI,3 percent from Social Security (Survivors and Retirement), and 8 percent Social SecurityDisability Insurance (SSDI). Social Security and SSDI are federal programs for which people’s

Table 5.1Income, by Homeless Status
Homeless StatusOther Service Users,
by Age Category
Currently Homeless
Clients (N=2938)
Formerly Homeless
Clients (N=677)
Other Service Users
(N=518)
Other Service
Users Under Age 65 (N=410)
Other Service Users 65 and Older (N=108)
Mean Income $367 $470 $575 $538 $668
Median Income 300 462 514 480 599
Over the Last 30 Days, Total Income From All Sources
No Income 13(%) 5(%) 5(%) 7(%) 0(%)Less than $100 17 9 6 8 1$100 to 299 19 16 10 14 2$300 to 499 18 30 25 23 30$500 to 699 14 20 21 18 29$700 to 799 4 6 7 4 15$800 to 999 5 6 7 6 8$1,000 to 1,199 3 2 3 4 2$1,200 or more 4 5 12 12 11
Income Below $500 67 60 41 52 33
Currently Receive Food Stamps 37 48 37 42 25
Amount of Food Stamps Per Month$1-10 1 2 2 1 3$11-60 4 6 11 9 17$61-114 6 12 8 11 3$115-120 13 16 5 6 2$121-199 4 4 4 6 1$200-299 5 3 4 6 0$300-399 3 3 2 3 0
Currently Receive Housing Subsidy or Housing Assistance Not Asked 27 15 15 16Source: Urban Institute analysis of weighted 1996 NSHAPC client data. Note: Percentages do not sum to 100% or other total due to rounding. * Denotes a value that is greater than 0 but less than .5.
5-4

Amount of Income Received by Homeless Clients in the Last 30 DaysFigure 5.1
13%
37%
19%
14%
9%
7%
Income Received in the Last 30 DaysNone $1 to $299 $300 to $499 $500 to $699 $700 to $999 $1000 or more
Source: Urban Institute analysis of weighted 1996 NSHAPC client data.
5-5

Table 5.2Income Sources, by Homeless Status
Homeless StatusOther Service Users, by
Age Category
Currently Homeless
Clients (N=2938)
Formerly Homeless
Clients (N=677)
Other Service Users
(N=518)
Other Service
Users Under Age 65 (N=410)
Other Service
Users 65 and Older (N=108)
Have Received Any Money From The FollowingSources In the Last Month (Large Categories)
Working 49(%) 37(%) 32(%) 42(%) 5(%)Means-tested benefits 28 51 41 44 34Other Social Security programs 11 22 42 22 91Veteran's benefits 2 4 7 2 20Other pensions, benefits, compensation 2 3 9 5 20Family or friends 21 17 17 22 3Other 27 18 14 15 12
Have Received Any Money From The Following Sources In the Last Month
WorkingWorking (other than day labor or peddling) 36 29 28 37 4Day Labor 18 8 7 10 1Peddling or selling personal belongings 9 5 3 4 0
Means-tested cash benefitsAid to Families with Dependent Children (AFDC) 10 8 10 14 0General assistance such as CA, PA, HR, GR 9 16 7 8 6Supplemental Security Income (SSI) 11 29 26 26 28
Other Social Security programsSocial Security 3 6 33 11 87SSDI 8 16 10 11 6
Veteran's benefitsVeteran's disability payments 1 3 3 2 7Veteran's pension (not disability related) 1 1 4 * 13
Other pensions, benefits, compensationOther pensions * * 7 2 19Other survivor benefits 0 * * * 1Private disability insurance * 0 * 1 0Unemployment compensation 1 1 1 1 *Other spousal benefits * 1 1 1 0
Family or friendsSpouse 2 3 5 6 3Parents 9 4 6 8 0Other relatives 5 5 2 3 *Friends (includes boyfriends or girlfriends) 12 9 5 7 0Child support 1 1 4 5 0
OtherAsking for money on the streets 8 3 * * 0Blood or plasma center 3 3 * * 0Illegal activities 4 * * * 0Any other income 17 14 14 14 12
Ever Received Any of the Following BenefitsAid to Families with Dependent Children (AFDC) 22 24 24 30 10General Assistance 28 38 19 22 10Supplemental Security Income (SSI) 14 32 27 24 34Social Security Disability Insurance (SSDI) 9 17 11 12 7Social Security Benefits 7 13 33 9 93Veterans Benefits 6 7 8 6 16Food Stamps 73 84 62 68 47Medicaid 37 59 50 52 45Housing Assistance (e.g., Section 8, Public Housing, Tenant Assistance, Housing Vouchers) 20 29 18 22 7
Currently Receiving Means-Tested Government Benefitsa
Any, including food stamps 45 70 56 60 48Any other than food stamps 28 57 47 49 40
Ever Received Means-Tested Government Benefitsa
Any, including food stamps 81 93 74 78 65Any other than food stamps 58 78 61 62 59
Source: Urban Institute analysis of weighted 1996 NSHAPC client data. * Denotes a value that is greater than 0 but less than .5. a AFDC, GA, SSI, Food Stamps, and housing assistance.
5-6

Sources of Income Reported by Clients, by Homeless StatusFigure 5.2
49
37
42
5
28
51
44
34
11
22 22
91
21
17
22
3
31
2522
52
Currently Homeless Formerly Homeless Other Service UsersUnder Age 65
Other Service Users65 and Older
0
20
40
60
80
100
Per
cent
age
Sources of IncomeWorkingMeans-tested benefitsOther Social Security programsFamily or friends*Other
Source: Urban Institute analysis of weighted 1996 NSHAPC client data . *"Other" includes veterans benefits, pensions, survivor benefits or disability and other.
5-7

2 These data were collected in 1996, when AFDC was still operating and before the development of anysubstantial changes due to federal welfare reform. Homeless clients (those answering Section 2 of the survey) werenot asked about current receipt of housing assistance.
3 90% C.I.= + 8 percentage points.
5-8
work activity over a lifetime determines their levels of benefits; receipt does not depend onmeeting a particular (low) income threshold. SSI, on the other hand, is a means-tested federalprogram for the aged, blind, and disabled; usually only people 65 and older, or with documentedchronic and relatively severe disabilities, are able to establish eligibility for SSI, in addition towhich they have to have incomes well below the poverty line.
The survey also asked about clients’ receipt of two other means-tested government benefits, Aidto Families with Dependent Children (AFDC) and General Assistance (GA).2 Ten percent ofhomeless clients received AFDC and 9 percent reported receiving GA over the last 30 days. Eligibility for AFDC, which is a federal/state program, requires that a person has child(ren) under18 in their care, and also meets strict income guidelines. As only 15 percent of homeless clientslive with their minor children, it is not surprising that receipt of AFDC is so low for all homelessclients. Among the 15 percent of homeless clients who live with their minor children, 52percent3 report receiving AFDC.
General Assistance, where it exists, is a state and sometimes a local government program. Usually families with children are eligible, as are single adults with disabilities, but many statesand localities do not allow able-bodied adults without children to receive General Assistance. These eligibility rules help explain why receipt of General Assistance is also quite low amonghomeless clients, although it is about equal for clients in families (10 percent) and singlehomeless clients (9 percent).
While relatively small shares of clients receive benefits from any single government program, amuch larger share, 45 percent, receive benefits from at least one means-tested governmentprogram. Fewer than one-third (28 percent), however, receive benefits from a means-testedprogram other than food stamps. Among homeless clients in families, these figures increase to79 and 62 percent, respectively. Thus, the majority of these clients are participating ingovernment programs designed to assist poor people.
Current Employment and Unemployment Patterns
Forty-four percent of homeless clients did some type of paid work during the 30 days beforebeing interviewed (table 5.3). However, only 20 percent of all homeless clients report having atleast one job that has lasted or is expected to last more than three months, while 27 percent reportearning money in the last 30 days only from short-term jobs such as temporary non-farm or farmwork, a day or pick-up job, or peddling (figure 5.3; clients could name more than one type ofjob).

Table 5.3Employment Characteristics, by Homeless Status
Homeless StatusOther Service Users, by
Age Category
Currently Homeless
Clients (N=2938)
Formerly Homeless
Clients (N=677)
Other Service Users
(N=518)
Other Service
Users Under Age 65 (N=410)
Other Service Users 65 and Older (N=108)
Did Any Type of Paid Work During the Last 30 Days 44(%) 34(%) 28(%) 37(%) 5(%)
Types of Work Over the Last 30 DaysAt a job has had for three months or more with the same employer 13 14 16 21 2At a job has had for less than three months but which expects to continue for three or more months 7 7 4 5 0At a temporary job (expect to last less than three months), non-farmwork 8 6 3 4 0A temporary job, farmwork 3 * 1 2 0At a day job or pick-up job that lasts only a few hours, or one or two days 14 5 5 6 1Peddling 2 2 * * 0Other 3 3 2 3 1
During the Last 30 Days, The Amount of Hours Usually Worked Per Week
1-10 7 7 4 5 011-20 7 6 4 6 121-30 6 4 6 8 131-40 12 10 8 11 1More than 40 3 2 2 3 0Don't Know 6 3 2 3 0
Since 16 Years Old, the Amountof Time in Life Have Had A Job or Done Some Work for Pay
All of the time 35 35 42 40 48Most of the time 30 27 23 23 25Half of the time 14 11 8 7 9Some of the time 14 17 17 17 16Almost none of the time 4 7 5 7 2Never 4 3 5 7 1
Source: Urban Institute analysis of weighted 1996 NSHAPC client data. Note: Percentages do not sum to 100% or other total due to rounding. * Denotes a value that is greater than 0 but less than .5.
5-9

Type of Work Reported by Homeless Clients Who WorkFigure 5.3
13
7
8
3
14
2
3
Job
Lasti
ng
3+ M
onth
s
Job
Lasti
ng
<3 M
onth
s
Tempo
rary
,
Non-F
arm
Job
Tempo
rary
,
Farm
Job
Day L
abor
Peddli
ng
Other
0
2
4
6
8
10
12
14
16
Per
cent
age
Source: Urban Institute analysis of weighted 1996 NSHAPC client data .
5-10

4 It is important to realize that NSHAPC did not ask this question of homeless clients who report any paidemployment in the last 30 days, but did ask it of those who reported only peddling or some “other” type of work. Recall that the majority of these homeless clients have only temporary jobs, so they too may not have long-lastingjobs even though they work for pay. Had these homeless clients been asked when they last had a job of two or moreweeks duration, the percentages reported here would almost certainly be larger.
5-11
Hours per week spent working followed the same pattern. Over the last 30 days, 15 percent ofhomeless clients worked in paid employment other than peddling or “other” for 31 or more hoursa week and another 13 percent of homeless clients worked in paid employment for 11 to 30 hoursa week.
The survey asked the 56 percent of homeless clients who were not in paid employment, includingthose who reported that their paid work was only peddling or “other,” to provide the primaryreasons they were not currently working. The most common responses are “other” reasons (14percent), health reasons (9 percent), personal/family/school issues (9 percent), being firedbecause their employer considered their performance to be unsatisfactory (7 percent), and slackwork or business conditions, resulting in layoffs (7 percent).
In addition to the 44 percent of homeless clients who reported paid employment, another 43percent do not have a regular job but want one. Twenty-eight percent of all homeless clients areunemployed and are currently looking for work. Among the 28 percent of homeless clients whodo not currently have work and are not looking for a job, the most common reason given forbeing out of the labor market is an illness/physical disability (14 percent).
Lifetime Employment Patterns
It is also interesting to consider how lifetime employment patterns compare to homeless clients’employment situation at the time they were interviewed for NSHAPC. A large proportion ofhomeless clients report having worked for most of their lives, even though they are not workingnow (figure 5.4). Sixty-five percent of homeless clients have worked all or most of their livessince the age of 16. Thirty-five percent of homeless clients have worked at a steady job or atleast done some work for pay all of the time, 30 percent have worked most of the time, 14percent have worked half of the time, 18 percent have worked less than half to almost none of thetime, and only 4 percent have never worked.
The survey also asked the 56 percent of clients who are not currently in paid employment toreport when they last worked for pay at a full-time job or business lasting two consecutive weeksor more (table 5.4).4 Nineteen percent of all homeless clients have never worked or have notworked in a job lasting two or more consecutive weeks for at least five years. Another 20percent did not work at such a job during the year before their NSHAPC interview, but did do soone to five years before the interview. Finally, 21 percent of homeless clients worked at the samejob for more than two consecutive weeks during the year before participating in NSHAPC.

Proportion of Time Since Age 16 that Homeless Clients Spent WorkingFigure 5.4
35%
30%
14%
14%
4%4%
Amount of TimeAll Most Half Some Almost None Never
Source: Urban Institute analysis of weighted 1996 NSHAPC client data.
5-12

Table 5.4
Characteristics of Clients Who Did Not Have Paid Employment Over the Last 30 Days, by Homeless Status
Homeless StatusOther Service Users, by
Age Category
Currently Homeless
Clients (N=2938)
Formerly Homeless
Clients (N=677)
Other Service Users
(N=518)
Other Service
Users Under Age 65 (N=410)
Other Service Users 65 and
Older (N=108)
Did Not Have Paid Employment Over the Last 30 Days 56(%) 66(%) 72(%) 63(%) 95(%)
When Last Worked for Pay at a Full-Time Job or Business Lasting2 Consecutive Weeks or More
Within past 3 months 8 7 4 5 13 months to 6 months ago 8 3 4 5 26 months to a year ago 5 3 4 6 11 to 2 years ago 8 8 5 7 *2 to 3 years ago 4 4 3 4 13 to 4 years ago 4 4 3 3 54 to 5 years ago 4 4 4 3 75 or more years ago 15 33 41 26 80Never worked 4 3 5 7 1
Why Left Last Job or BusinessLasting 2 Consecutive Weeks or More
Personal, family (including pregnancy) or school 9 9 7 8 7Health 9 17 29 21 49Retirement or old age 1 2 9 1 29Seasonal job completed 2 3 1 2 0Seasonal farmwork ended * 0 1 1 0Slack work or business conditions, laid off 7 6 7 8 6Temporary-nonseasonal job completed 3 4 2 2 *Unsatisfactory work arrangements (hours, pay, etc.) 4 7 3 4 1Fired because employer considered performance to be unsatisfactory 7 5 1 1 *Other 14 15 9 12 4
Want a Regular Job Now, Either Full- or Part-Time
Yes 43 40 23 26 16Maybe 3 6 6 7 4
Looking for Work Now 28 22 18 24 1
Reasons Not Looking For WorkAlready have a job 1 * * * 0Believe no work available in line of work or area * 1 2 * 6Couldn't find any work 1 2 * * 0Lack necessary schooling, training, skills or experience 2 4 3 4 0Ill health, physical disability 14 25 38 28 62Can't arrange child care 1 1 2 2 0Family responsibilities 2 1 4 5 2In school or other training 2 2 * 1 0Other 13 15 13 5 32
Source: Urban Institute analysis of weighted 1996 NSHAPC client data. Note: Percentages do not sum to other total due to rounding. * Denotes a value that is greater than 0 but less than .5.
5-13

5 Clients were asked only a general question about receipt of housing assistance in their lifetime. Thequestion used “Section 8, Public Housing, Tenant Assistance, Housing Vouchers” as examples, but clients were notasked which specific programs they used.
5-14
Lifetime Receipt of Government Benefits
One hypothesis about immediate precursors to homelessness is that people who were receivingsome type of government benefits lost them for various reasons, and the loss of this income (orother resource, in the case of food stamps) left them without sufficient resources to maintainthemselves in housing. Therefore all clients were asked whether they had ever participated inany of a variety of government benefit programs (table 5.2). If they had, and if they were alsoclassified as ever having been homeless, they were also asked whether they were receivingbenefits when they became homeless. If they said they were not, they were asked whether anybenefits had been terminated during the year before they became homeless. Appendix table 5.A2reports detailed results for lifetime receipt of government benefits for all homeless clients; chartsand graphs highlight the clearest differences. Appendix table 5.A5 reports findings for the moredetailed questions, although these are not discussed in detail here.
In general, only small shares of homeless clients have participated in specific governmentprograms at any time in their life (figure 5.5). The one government program that has benefited73 percent of homeless clients is the Food Stamp Program. The next most common benefits areMedicaid (which 37 percent of homeless clients have ever received), General Assistance/PublicAssistance/Home Relief/General Relief (28 percent), AFDC (22 percent), housing assistance5 (20percent), and SSI (14 percent). When one considers lifetime use of any means-tested program,however, the majority of clients are able to report that they have received government benefits,even if one excludes food stamps. Eighty-one percent of homeless clients have used at least onemeans-tested program at some point in time and 58 percent have used a program other than foodstamps.
One issue of some concern to policy makers is whether loss of cash or other benefits precipitatesa homeless episode; NSHAPC asked clients about this possibility. Results indicate that very fewclients lost benefits during the year preceding their current homeless episode; 3 percent lostAFDC, 10 percent lost food stamps, 5 percent lost general assistance, and 1 percent each lost SSIand housing assistance. However, results also indicate that equal or higher proportions ofhomeless clients are receiving particular benefits now than were doing so when they becamehomeless. For AFDC, 10 percent receive it now versus 8 percent who did so when their presenthomeless episode began; for general assistance the proportions are 9 and 7 percent; and for SSIthey are 11 and 7 percent. The only significant change in proportion receiving a benefit occursfor food stamps, and that proportion is significantly higher (37 percent) at the time of theNSHAPC interview than it was when the clients became homeless (28 percent). Thus forNSHAPC clients, termination of government benefits does not appear to have immediatelypreceded their current homeless episode. Because the sample sizes are small and estimates
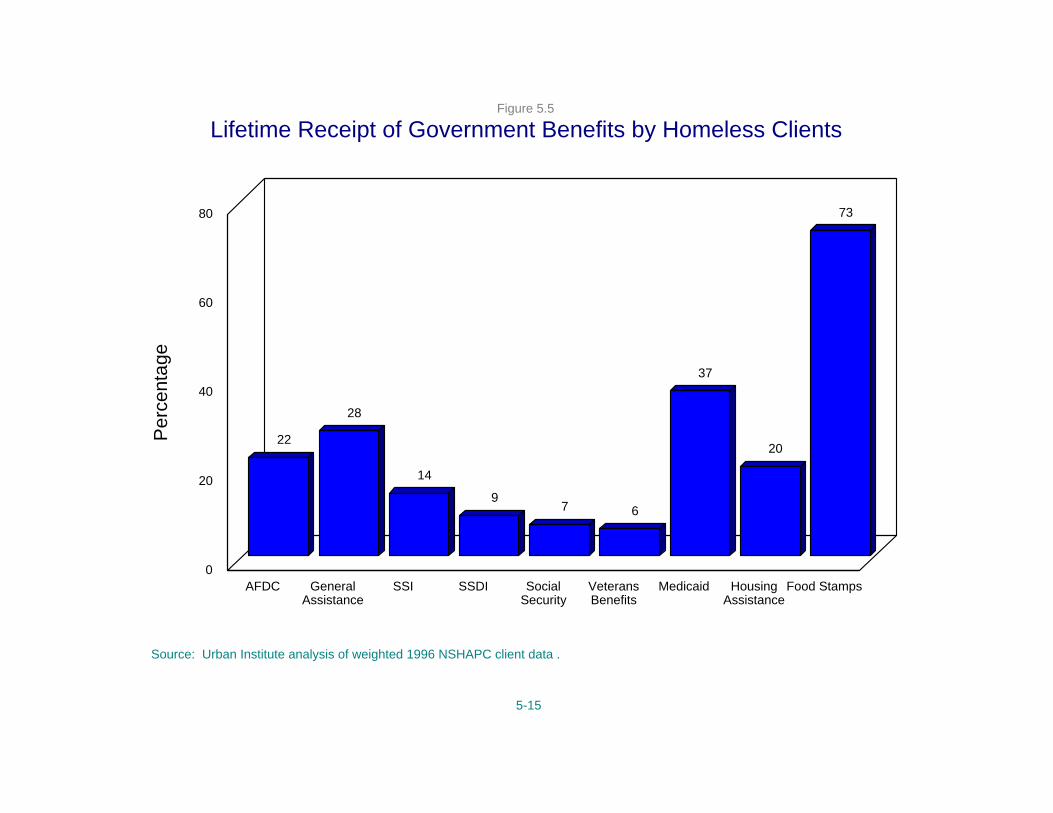
Lifetime Receipt of Government Benefits by Homeless ClientsFigure 5.5
22
28
14
97 6
37
20
73
AFDC GeneralAssistance
SSI SSDI Social Security
VeteransBenefits
Medicaid HousingAssistance
Food Stamps0
20
40
60
80
Per
cent
age
Source: Urban Institute analysis of weighted 1996 NSHAPC client data .
5-15

5-16
unstable for questions on the receipt or stoppage of benefits prior to becoming homeless, theseresults are not discussed further.
Differences by Family Status
Not surprisingly, there are differences in income, income sources, and employment of homelessclients by clients’ family status (Appendix tables 5.A1 through 5.A4). Clients in families havehigher current incomes, receive more public assistance, and work less compared to singlehomeless clients. There are also large differences in lifetime measures of income andemployment. Homeless clients in families have received more government assistance in the pastwhile single homeless clients have more extensive work histories.
Income Level and Sources. Homeless clients in families report an average income of$475 and a median income of $418 compared to single homeless clients, who have an averageincome of $348 and median income of $230. While they have higher income, homeless familiesalso have children to take care of. These income levels mean that homeless families had amedian income during the past month of 41 percent of the 1996 federal poverty level of $1,023for a family of three. Single homeless clients’ median income constitutes 34 percent of the 1996federal poverty level of $680 for a single person.
In addition to income levels, income sources vary by family status (figure 5.6). Homeless clientswho live with their minor children are less likely than single homeless clients to have receivedincome from working (31 versus 52 percent) and other sources (14 versus 30 percent). They arefar more likely, however, to be receiving means-tested benefits (62 versus 22 percent), incomefrom family, friends, or a spouse (32 versus 19 percent), and food stamps. Homeless clients infamilies are also more likely than single homeless clients to supplement their income with foodstamps (71 versus 31 percent).
Current Employment and Unemployment Patterns. While homeless clients in familiesare less likely than single homeless clients to have worked over the past 30 days, they are morelikely to report wanting paid work. Sixty percent want a regular job now, compared to 40 percentof single homeless clients.
The reasons homeless clients are not looking for work also vary by family status. Homelessclients in families are more likely than single homeless clients to report not looking for workbecause of family responsibilities (10 percent compared to less than 1 percent) and less likelythan single homeless clients to report ill health or physical disability as the reason they are notlooking for work (5 percent compared to 16 percent).
Lifetime Employment and Unemployment Patterns. As with current employmentpatterns, homeless clients in families are less likely than single homeless clients to have workedall or most of their lives since age 16 (56 versus 66 percent). The two groups also provide

Sources of Income Reported by Homeless Clients, by Family StatusFigure 5.6
31
52
62
22
4
13
32
1917
33
Clients in Families Single Clients0
10
20
30
40
50
60
70
Per
cent
age
Sources of IncomeWorkingMeans-tested benefitsOther Social Security programsFamily or friends*Other
Source: Urban Institute analysis of weighted 1996 NSHAPC client data . *"Other" includes veterans benefits, pensions, survivor benefits or disability and other.
5-17

6 90% C.I.= + 5 percentage points.
7 90% C.I.= + 5 percentage points.
5-18
different reasons for having left their last job. Twenty-six percent of homeless clients in familiesreport that they left their last job because of personal reasons compared to 6 percent of singlehomeless clients.
Lifetime Receipt of Government Benefits. Besides being far more likely to receive publicbenefits, homeless clients in families are far more likely than single homeless clients to havereceived various government benefits over their lifetime. For AFDC the figures are 80 versus 12percent; for Medicaid, 76 versus 30 percent; for food stamps, 95 versus 69 percent; and forhousing assistance, 32 versus 18 percent.
Differences by Alcohol, Drug, or Mental Health Problems
Homeless clients with an alcohol, drug, or mental health (ADM) problem in the past monthreport making less money over the past 30 days than homeless clients without such problems,although the two groups report similar employment patterns and income sources during thatperiod. Over their lifetime, however, clients with past month ADM problems are more likely tohave received general assistance, while those without ADM problems are more likely to havereceived AFDC.
Income Level and Sources. Homeless clients with and without ADM problems in thepast month have very different incomes (figure 5.7). Homeless clients with past month ADMproblems had an average total income over the last 30 days of $337 and a median income of$221, compared to an average income of $427 and a median income of $395 among thosewithout such problems.
Current and Lifetime Employment Patterns. Homeless clients with and without ADMproblems have very similar current and lifetime employment patterns. A comparable share ofboth groups (43 percent with past month ADM problems and 466 percent without them) did anytype of paid work during the last 30 days. Additionally, similar proportions of both groups haveworked all or most of the time since age 16 (66 percent of homeless clients with past monthADM problems and 637 percent of homeless clients without these problems).
Lifetime Receipt of Government Benefits. Unlike their similar employment patterns,homeless clients with past month ADM problems are more likely than homeless clients withoutthese problems to have received government benefits over their lifetime. Thirty-two percent ofclients with one or more such problems report ever receiving General Assistance compared to 19percent of homeless clients without such problems.

13 13
41
2729
36
15
19
With ADM Problems Without ADM Problems0
10
20
30
40
50
Per
cent
age
Amount of IncomeNoneLess than $299$300 to $699$700 or more
Figure 5.7
Amount of Income Received by Clients in the Last 30 Days, by ADM Status
Source: Urban Institute analysis of weighted 1996 NSHAPC client data.
5-19

5-20
Differences by Race/Ethnicity
Income, income sources, and employment patterns over the last 30 days also vary by the client’srace/ethnicity. These differences persist when examining lifetime measures of employment andreceipt of government benefits.
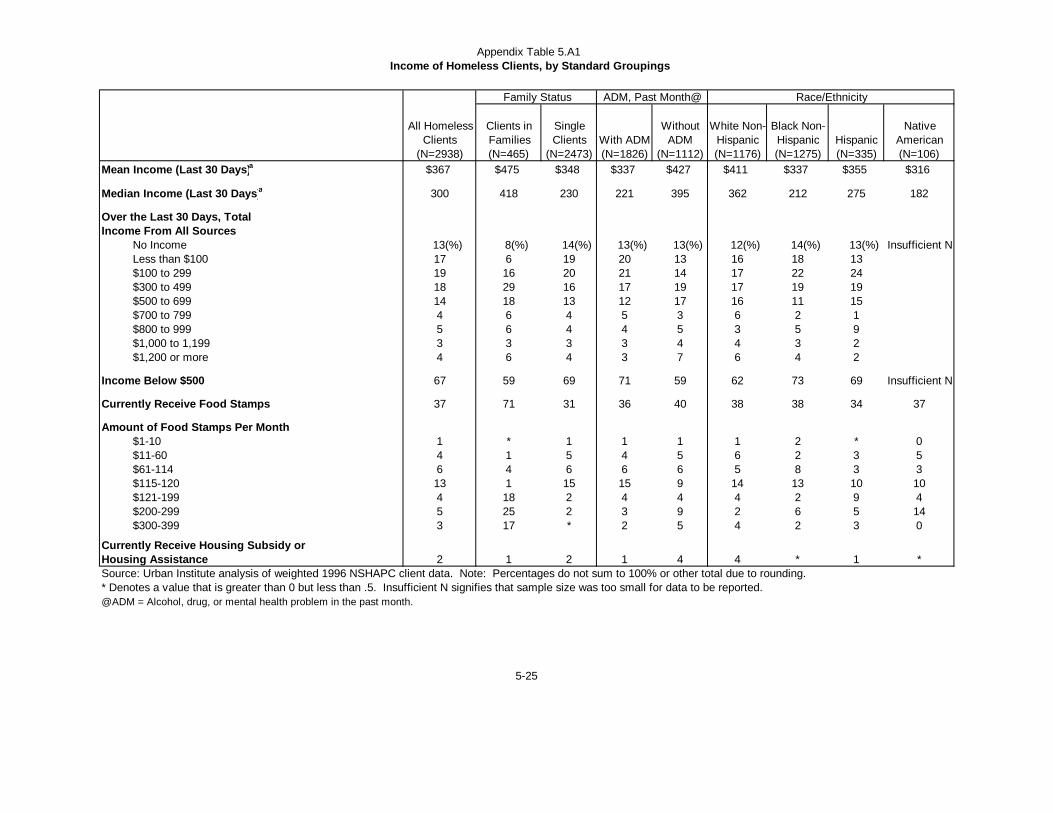
Income Level and Sources. Appendix table 5.A1 shows that white non-Hispanichomeless clients have a higher average and median income than that of black non-Hispanic,Hispanic, or Native American homeless clients (average incomes of $411, $337, $355, $316 andmedian incomes of $362, $212, $275, and $182, respectively).
Large differences are also found in income sources over the past 30 days. Whites are less likelythan black non-Hispanic homeless clients to have received AFDC or GA (23 percent comparedto 30 percent). However, white and Hispanic homeless clients are more likely than black non-Hispanic homeless clients to have received income from “other” sources (31, 34, and 22 percent,respectively). Also, homeless Hispanic clients are more likely than their white or black non-Hispanic counterparts to receive income from family, relatives, friends, or a spouse (29, 20, and19 percent, respectively).
Current Employment and Unemployment Patterns. Unemployed homeless clients fromdifferent racial/ethnic groups also report very different reasons for why they are not currentlyworking. Twelve percent of homeless Hispanic clients report that they left their last job becauseof unsatisfactory work arrangements, compared to 2 and 4 percent of white and black clients,respectively. Also, black non-Hispanic homeless clients are more likely to report having lefttheir last job because slack work or business conditions caused layoffs, compared to white non-Hispanic and Hispanic homeless clients (12 percent versus 3-4 percent).
Lifetime Receipt of Government Benefits. Differences by race/ethnicity are also found inlifetime receipt of government benefits. White non-Hispanic homeless clients, for example, aremore likely than black non-Hispanic and Hispanic homeless clients to have ever receivedgovernment housing assistance (26 percent compared to 14 to 17 percent) and SSI (14 comparedto approximately 5 percent). Also, black non-Hispanic homeless clients are more likely thanhomeless clients of other races to have ever received GA (32 percent compared to 23 to 24percent). Only 19 percent of Native Americans have ever received Medicaid compared to 37 to40 percent of clients in other racial groups. Also, Hispanic homeless clients are less likely toreport receiving food stamps in their lifetime than white or black non-Hispanic homeless clients(54 percent compared to 77 and 75 percent of white and black clients).
CURRENTLY AND FORMERLY HOMELESS CLIENTS AND OTHER SERVICE USERS COMPARED
Many people are interested in understanding how the income, income sources, and employmentpatterns of currently homeless clients compare to formerly homeless and other service users. In

8 See page 2-6 for the reasons why the group of other service users is split into two groups by age fortextual discussions.
5-21
addition, it is interesting to learn what differences and similarities in income and employmentcharacteristics exist between formerly homeless clients and other service users. Tables 5.1-5.4show the relevant comparisons.8
Current Income Levels and Sources
Income, income sources, and participation in public benefit programs all vary by homelessnessstatus. Currently homeless clients reported receiving an average income of $367 and a medianincome of $300 over the last month, which is significantly lower than for any other group. Formerly homeless clients took in an average of $470 and a median of $462 and other serviceusers under 65 got an average of $538 and a median of $480 (figure 5.8). Note, however, thatnone of these monthly incomes and only the mean income of other service users 65 and older($688 mean and $599 median) reach the federal poverty line for a single-person household (thelowest level possible).
Homelessness status also affects food stamp receipt. Formerly homeless clients report rates offood stamp receipt that, at 48 percent, are higher than those for currently homeless clients (37percent) or other service users 65 and older (25 percent). Other service users 65 and older arethe least likely of any group to receive food stamps.
In addition to having very different income levels, clients report very different income sourcesdepending on their homelessness status (figure 5.2). Currently homeless clients are more likelythan clients in any other group to have received income from work, while other service users 65and above are more likely to have received income from Social Security. Forty-nine percent ofcurrently homeless clients received income over the last 30 days from work, compared to only 5percent of other service users 65 and older. In contrast, 91 percent of other service users 65 yearsof age and above received income from other Social Security programs over the last 30 dayscompared to 11 to 22 percent of all other clients. There are also differences in current receipt ofwelfare benefits between currently and formerly homeless clients. Twenty-eight percent ofcurrently homeless clients report receiving means-tested benefits over the last 30 days, comparedto 51 percent of formerly homeless individuals in the NSHAPC sample. Additionally, otherservice users 65 and older are the most likely to be receiving veteran benefits (20 versus 2 to 4percent).
In addition to differences in income sources, there are large variations in government housingassistance. Currently homeless clients are the least likely to report they are currently receivinghousing assistance or a subsidy (2 versus 15 to 27 percent).

Mean and Median Income Reported by Clients For Last 30 Days, by Homeless StatusFigure 5.8
367
470
538
668
300
462480
599
Currently Homeless Formerly Homeless Other Service UsersUnder Age 65
Other Service Users65 and Older
0
100
200
300
400
500
600
700
800
Do
llars
Income, in DollarsMeanMedian
Source: Urban Institute analysis of weighted 1996 NSHAPC client data .
5-22

5-23
Current Employment and Unemployment Patterns
While currently homeless clients are more likely than other clients to report paid work, they areno more likely than formerly homeless clients or other service users under 65 to be in long term-employment. Approximately 20 percent of each group reports long-term employment over thelast 30 days. However, again, other service users 65 and older display a distinctly differentpattern with only 2 percent reporting long-term employment. Additionally, this group is the leastlikely to hold short-term employment (1 versus 12 to 27 percent). By contrast, currentlyhomeless clients are the most likely to report only making money in the last 30 days from short-term jobs (27 versus 1 to 13 percent).
Depending on their homelessness status and age, clients also report different reasons for leavingtheir last job. A much larger proportion of other service users 65 and older left their last jobbecause of retirement/old age (29 percent) than is true for all other clients. In addition, 49percent of other service users 65 and older left their last job because of health problems,compared to 9 to 21 percent of clients in the remaining three groups.
Respondents who are currently or formerly homeless are also far more likely to want a regularjob now (43 and 40 percent, respectively) than other service users 65 and older (16 percent). Finally, other service users 65 and older are much more likely than other clients to report they donot look for work due to health or disability reasons (62 versus 14 to 28 percent).
Lifetime Employment Patterns
There are no significant differences in lifetime employment patterns of currently homelessclients, formerly homeless clients, and other service users (table 5.3). Similar proportions of allfour groups report working all or most of their time since the age of 16 (62 to 73 percent).
While other service users 65 and older report working as much since the age of 16 as all otherclients, they are less likely than all other clients to have worked within the last several years in ajob for two consecutive weeks or more. Eighty-one percent of other service users 65 and olderhave never worked or have not worked for five or more years, compared to 19 to 36 percent of allother clients. Their greater age probably accounts for much of this difference.
Lifetime Receipt of Government Benefits
In addition to large differences in current receipt of public benefits by homeless status, one cansee that homelessness status affects lifetime receipt of various governmental benefits (table 5.2). For example, 84 percent of formerly homeless clients have received food stamps in their lifetime

5-24
compared to only 47 percent of other service users 65 years of age and older. Similarly, only 7percent of other service users 65 and over received housing assistance compared to 20 to 29percent of all other clients. For Social Security programs, currently homeless clients are the leastlikely to have ever received Supplemental Security Income (14 versus 24 to 34 percent). Inaddition, other service users have the highest lifetime receipt of Social Security benefits, with 93percent receiving them compared only 7 to 13 percent of all other clients.
Appendix Table 5.A1Income of Homeless Clients, by Standard Groupings
Family Status ADM, Past Month@ Race/Ethnicity
All Homeless Clients
(N=2938)
Clients in Families (N=465)
Single Clients
(N=2473)With ADM (N=1826)
Without ADM
(N=1112)
White Non-Hispanic (N=1176)
Black Non-Hispanic (N=1275)
Hispanic (N=335)
Native American (N=106)
Mean Income (Last 30 Days)a $367 $475 $348 $337 $427 $411 $337 $355 $316
Median Income (Last 30 Days)a 300 418 230 221 395 362 212 275 182
Over the Last 30 Days, Total Income From All Sources
No Income 13(%) 8(%) 14(%) 13(%) 13(%) 12(%) 14(%) 13(%) Insufficient NLess than $100 17 6 19 20 13 16 18 13$100 to 299 19 16 20 21 14 17 22 24$300 to 499 18 29 16 17 19 17 19 19$500 to 699 14 18 13 12 17 16 11 15$700 to 799 4 6 4 5 3 6 2 1$800 to 999 5 6 4 4 5 3 5 9$1,000 to 1,199 3 3 3 3 4 4 3 2$1,200 or more 4 6 4 3 7 6 4 2
Income Below $500 67 59 69 71 59 62 73 69 Insufficient N
Currently Receive Food Stamps 37 71 31 36 40 38 38 34 37
Amount of Food Stamps Per Month$1-10 1 * 1 1 1 1 2 * 0$11-60 4 1 5 4 5 6 2 3 5$61-114 6 4 6 6 6 5 8 3 3$115-120 13 1 15 15 9 14 13 10 10$121-199 4 18 2 4 4 4 2 9 4$200-299 5 25 2 3 9 2 6 5 14$300-399 3 17 * 2 5 4 2 3 0
Currently Receive Housing Subsidy or Housing Assistance 2 1 2 1 4 4 * 1 *Source: Urban Institute analysis of weighted 1996 NSHAPC client data. Note: Percentages do not sum to 100% or other total due to rounding. * Denotes a value that is greater than 0 but less than .5. Insufficient N signifies that sample size was too small for data to be reported.@ADM = Alcohol, drug, or mental health problem in the past month.
5-25

Appendix Table 5.A2Income Sources of Homeless Clients, by Standard Groupings
Family Status ADM, Past Month@ Race/Ethnicity
All Homeless Clients
(N=2938)
Clients in Families (N=465)
All Others Clients
(N=2473)With ADM (N=1826)
Without ADM
(N=1112)
White Non-Hispanic (N=1176)
Black Non-Hispanic (N=1275)
Hispanic (N=335)
Native American (N=106)
Received Any Money From The FollowingSources In the Last Month (Large Categories)
Working 49(%) 31(%) 52(%) 49(%) 50(%) 46(%) 51(%) 50(%) 62(%)Means-tested benefits 28 62 22 26 31 23 30 30 33Other Social Security programs 11 4 13 13 9 18 7 6 6Veteran's benefits 2 1 2 2 2 3 2 1 1Other pensions, benefits, compensation 2 2 1 2 2 3 1 1 *Family or friends 21 32 19 21 19 20 19 29 19Other 27 14 30 30 23 31 22 34 23
Received Any Money From The Following Sources In the Last Month
WorkingWorking 36 26 38 34 42 37 36 32 40Day Labor 18 3 20 20 13 13 17 23 40Peddling or selling personal belongings 9 6 10 11 6 11 9 9 5
Means-tested cash benefitsAid to Families with Dependent Children (AFDC) 10 52 3 7 15 6 11 14 16General assistance such as CA, PA, HR, GR 9 10 9 9 8 7 12 8 8Supplemental Security Income (SSI) 11 11 11 11 10 13 9 12 10
Other Social Security programsSocial Security (Survivors and Retirement) 3 1 4 2 6 5 3 1 1Social Security Disability Insurance (SSDI) 8 3 9 11 3 13 4 5 5
Veteran's benefitsVeteran's disability payments 1 1 2 1 1 2 1 1 1Veteran's pension (not disability related) 1 0 1 1 1 1 1 0 0
Other pensions, benefits, compensationOther pensions * 0 * * 1 1 * * 0Other survivor benefits * 0 * * 0 0 * 0 *Private disability insurance * * * * * * * * 0Unemployment compensation 1 2 1 1 1 1 1 * 0Other spousal benefits * * * * * * 0 * 0
Family or friendsParents 9 15 8 10 6 8 6 18 13Spouse 2 8 1 1 3 3 1 2 *Other relatives 5 7 5 5 5 6 5 6 *Friends (includes boyfriends or girlfriends) 12 11 12 14 8 11 13 10 19Child support 1 6 * 1 3 2 1 1 0
OtherAsking for money on the streets 8 1 9 10 4 8 8 7 6Blood or plasma center 3 3 4 4 2 4 4 1 3Illegal activities 4 2 4 5 1 4 4 6 4Any other income 17 9 18 17 20 20 12 24 13
Ever Received Any of the Following BenefitsAid to Families with Dependent Children (AFDC) 22 80 12 18 29 21 23 22 18General Assistance 28 25 28 32 19 24 32 23 32Supplemental Security Income (SSI) 14 13 14 15 11 16 13 11 10Social Security Disability Insurance Benefits (SSDI) 9 3 10 11 5 14 5 4 5Social Security Benefits 7 5 8 6 10 10 6 6 1Veterans Benefits 6 3 7 8 4 8 6 4 1Food Stamps 73 95 69 74 69 77 75 54 64Medicaid 37 76 30 39 32 37 40 39 19Housing Assistance (e.g., Section 8 Public Housing, Tenant Assistance, Housing Vouchers) 20 32 18 20 22 26 17 14 18
Currently Receiving Means-Tested Government Benefits a
Any, including food stamps 45 79 39 45 46 45 46 42 45Any other than food stamps 28 62 22 26 32 25 30 30 33
Ever Received Means-Tested Government Benefits a
Any, including food stamps 81 97 78 83 76 84 81 63 93Any other than food stamps 58 93 53 58 59 57 59 53 72
Source: Urban Institute analysis of weighted 1996 NSHAPC client data. * Denotes a value that is greater than 0 but less than .5. a AFDC, GA, SSI, Food Stamps, and housing assistance.@ADM = Alcohol, drug, or mental health problem in the past month.
5-26

Appendix Table 5.A3Employment Characteristics of Homeless Clients, by Standard Groupings
Family Status ADM, Past Month@ Race/Ethnicity
All Homeless Clients
(N=2938)
Clients in Families (N=465)
Single Clients
(N=2473)With ADM (N=1826)
Without ADM
(N=1112)
White Non-Hispanic (N=1176)
Black Non-Hispanic (N=1275)
Hispanic (N=335)
Native American (N=106)
Did Any Type of Paid Work During the Last 30 Days 44(%) 29(%) 46(%) 43(%) 46(%) 41(%) 44(%) 45(%) 58(%)
Sources of Earned Income in Last 30 DaysJob lasting 3 or more months 13 14 13 12 15 13 17 11 2Job expected to last 3 or more months 7 5 7 6 8 7 7 8 1Temporary job, non-farm work 8 3 9 8 10 11 6 8 6Temporary job, farm work 3 * 3 3 3 1 2 7 16Day Job or pick-up job 14 6 15 15 11 11 14 16 24Peddling or selling personal belongings 2 0 3 3 1 2 2 3 3Other 3 1 3 2 4 1 2 1 16
During the Last 30 Days, The Amount of Hours Usually Worked Per Week
1-10 7 3 8 8 6 8 6 11 411-20 7 4 7 8 4 6 7 10 521-30 6 7 6 5 9 7 5 12 331-40 12 9 12 11 13 9 16 6 17More than 40 3 4 2 2 3 3 3 1 1Don't Know 6 3 7 6 7 7 4 4 16
Since 16 Years Old, the Amountof Time in Life Have Had A Job or Done Some Work for Pay
All of the time 35 32 35 33 37 37 32 40 25Most of the time 30 24 31 30 29 28 28 24 57Half of the time 14 18 13 16 10 11 19 11 6Some of the time 14 20 13 14 14 17 13 13 5Almost none of the time 4 3 4 4 4 2 5 6 6Never 4 4 5 4 6 6 3 6 2
Source: Urban Institute analysis of weighted 1996 NSHAPC client data. Note: Percentages do not sum to 100% or other total due to rounding. * Denotes a value that is greater than 0 but less than .5. @ADM = Alcohol, drug, or mental health problem in the past month.
5-27
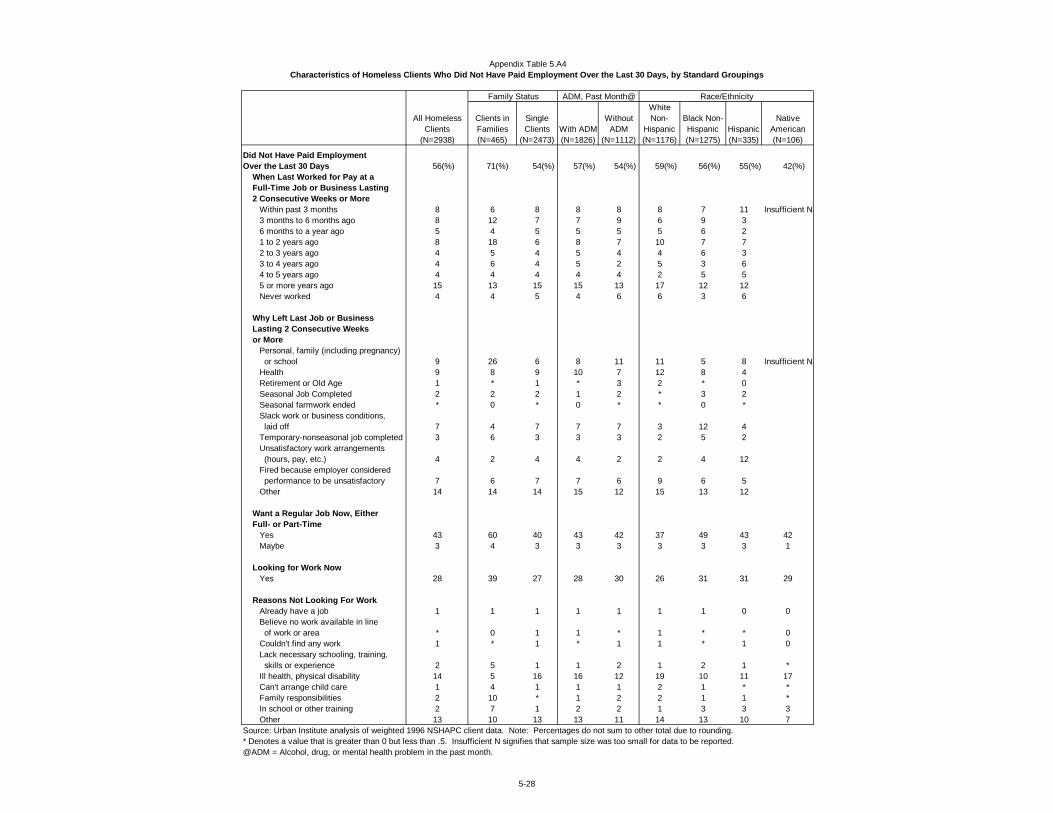
Appendix Table 5.A4Characteristics of Homeless Clients Who Did Not Have Paid Employment Over the Last 30 Days, by Standard Groupings
Family Status ADM, Past Month@ Race/Ethnicity
All Homeless Clients
(N=2938)
Clients in Families (N=465)
Single Clients
(N=2473)With ADM (N=1826)
Without ADM
(N=1112)
White Non-
Hispanic (N=1176)
Black Non-Hispanic (N=1275)
Hispanic (N=335)
Native American (N=106)
Did Not Have Paid Employment Over the Last 30 Days 56(%) 71(%) 54(%) 57(%) 54(%) 59(%) 56(%) 55(%) 42(%)
When Last Worked for Pay at a Full-Time Job or Business Lasting2 Consecutive Weeks or More
Within past 3 months 8 6 8 8 8 8 7 11 Insufficient N3 months to 6 months ago 8 12 7 7 9 6 9 36 months to a year ago 5 4 5 5 5 5 6 21 to 2 years ago 8 18 6 8 7 10 7 72 to 3 years ago 4 5 4 5 4 4 6 33 to 4 years ago 4 6 4 5 2 5 3 64 to 5 years ago 4 4 4 4 4 2 5 55 or more years ago 15 13 15 15 13 17 12 12Never worked 4 4 5 4 6 6 3 6
Why Left Last Job or BusinessLasting 2 Consecutive Weeks or More
Personal, family (including pregnancy) or school 9 26 6 8 11 11 5 8 Insufficient NHealth 9 8 9 10 7 12 8 4Retirement or Old Age 1 * 1 * 3 2 * 0Seasonal Job Completed 2 2 2 1 2 * 3 2Seasonal farmwork ended * 0 * 0 * * 0 *Slack work or business conditions, laid off 7 4 7 7 7 3 12 4Temporary-nonseasonal job completed 3 6 3 3 3 2 5 2Unsatisfactory work arrangements (hours, pay, etc.) 4 2 4 4 2 2 4 12Fired because employer considered performance to be unsatisfactory 7 6 7 7 6 9 6 5Other 14 14 14 15 12 15 13 12
Want a Regular Job Now, Either Full- or Part-Time
Yes 43 60 40 43 42 37 49 43 42Maybe 3 4 3 3 3 3 3 3 1
Looking for Work NowYes 28 39 27 28 30 26 31 31 29
Reasons Not Looking For WorkAlready have a job 1 1 1 1 1 1 1 0 0Believe no work available in line of work or area * 0 1 1 * 1 * * 0Couldn't find any work 1 * 1 * 1 1 * 1 0Lack necessary schooling, training, skills or experience 2 5 1 1 2 1 2 1 *Ill health, physical disability 14 5 16 16 12 19 10 11 17Can't arrange child care 1 4 1 1 1 2 1 * *Family responsibilities 2 10 * 1 2 2 1 1 *In school or other training 2 7 1 2 2 1 3 3 3Other 13 10 13 13 11 14 13 10 7
Source: Urban Institute analysis of weighted 1996 NSHAPC client data. Note: Percentages do not sum to other total due to rounding. * Denotes a value that is greater than 0 but less than .5. Insufficient N signifies that sample size was too small for data to be reported.@ADM = Alcohol, drug, or mental health problem in the past month.
5-28

Appendix Table 5.A5Income Receipt and Termination of Government Benefits
Among Homeless Clients
All Homeless Clients
(N=2938) Time of AFDC Receipt
Receiving Benefit When Became Homeless 8(%)Stopped Receiving Benefit Within the Year Before Became Homeless 3
Time of Food Stamp ReceiptReceiving Benefit When Became Homeless 28Stopped Receiving Benefit Within the Year Before Became Homeless 10
Time of General Assistance ReceiptReceiving Benefit When Became Homeless 7Stopped Receiving Benefit Within the Year Before Became Homeless 5
Time of Housing Assistance ReceiptReceiving Benefit When Became Homeless 6Stopped Receiving Benefit Within the Year Before Became Homeless 1
Time of SSI ReceiptReceiving Benefit When Became Homeless 7Stopped Receiving Benefit Within the Year Before Became Homeless 1
Time of SSDI ReceiptReceiving Benefit When Became Homeless 5Stopped Receiving Benefit Within the Year Before Became Homeless *
Time of Social Security Benefits ReceiptReceiving Benefit When Became Homeless 3Stopped Receiving Benefit Within the Year Before Became Homeless *
Time of Medicaid ReceiptReceiving Benefit When Became Homeless 21Stopped Receiving Benefit Within the Year Before Became Homeless 3
Source: Urban Institute analysis of weighted 1996 NSHAPC client data.* Denotes a value that is greater than 0 but less than .5.
5-29