chapter 5 load balancing of low-voltage...
TRANSCRIPT
167
CHAPTER 5
LOAD BALANCING OF LOW-VOLTAGE DISTRIBUTION
NETWORK BY HEURISTIC METHODOLOGY
5.1 INTRODUCTION
The reduction of energy losses in the distribution of low voltage
distribution network has been achieved by using fuzzy logic based load
balancing in chapter 4. Though it is effective, further optimization by
reducing neutral current in the LV network is attempted and explained in this
chapter. This work presents load balancing using the heuristic methodology.
The main task of this investigation is how unbalance due to uneven
distribution of single phase loads at the secondary side of the distribution
network can be minimized further, as compared with fuzzy logic based load
balancing.
The unequal distribution of loads between the three phases of the
supply system determines the flow of unbalanced currents that produce
unbalanced voltage drops on the electric lines. This increase in neutral current
due to unbalance produces more line losses. Neutral flow will be less on a
system that has been phase balanced. The savings from reduced neutral flow
may range anywhere from thousands to millions of rupees in wasted fuel
costs, depending on the scale of distribution system and the imbalances that
exist. Hence this method analyzes the propagation of unbalance in LV
distribution network resulting in increase of neutral current.
168
The suggested heuristic method reduces unbalance resulting in
decrease of neutral current value and ultimately reducing the losses of LV
network. Low voltage distribution systems need phase specific approach with
the neutral conductor as the fourth wire due to unbalance. Hence, the analysis
becomes more difficult than that of transmission systems which can be
represented by single phase equivalent diagrams. Additively, actual load data
collection is vitally important for the design at low voltage level. It will also
give a chance to observe the basic characteristics of the load and find the
consumer factors correctly. In this study, a comprehensive approach is
presented for the determination of span-by-span current distribution along low
voltage feeders. The actual distribution transformer with its LV network is
presented in this thesis in all chapters. Hence model developed is realistic.
The simulations are performed by utilizing actual data in order to take the
diversity between consumers into account. The literature survey indicates the
following procedures.
5.2 LITERATURE SURVEY
Distribution feeder line models that can be used in power flow and
short circuit analysis of balanced and unbalanced three phase distribution
feeders have been presented by Kersting and Phillips (1994). The major
conclusion drawn from the comparative studies is that there are significant
differences in phase power losses for balanced and unbalanced operating
conditions. Modeling of unbalanced three phase distribution feeders introduce
large errors making modeling a tough task.
Nevzat et al (1994) states that accurate determination of the neutral
conductor current distribution along a low voltage feeder is vitally important
due to two perspectives. The first one is to investigate the voltage profile
along the feeder. The second one is directly related with the economic
feasibility of the system (i.e. total losses occurred on the feeder). Results
169
show that the unbalance results in considerable induced voltages and currents
through the neutral conductor. The suggestion of the paper is that the neutral
conductor should be selected in the same size with the phase conductors as
current flowing through neutral is sometimes more than the base phase
current.
Tsai-Hsiang Chen and Jeng Cherng (2000) present an effective
approach to optimize the phase arrangement of the distribution transformers
connected to a primary feeder for system unbalance improvement and loss
reduction. This method is specific to Taiwan electrical utility where
distribution transformer used is asymmetrical with an open wye-open delta
connection to obtain a 3 phase 4 wire service and also does not handle
secondary LV network.
5.3 ADVENT OF THE HEURISTIC METHODOLOGY
Fuzzy logic based load balancing discussed in earlier chapter 4 takes
the overall low voltage distribution network for load balancing and it balances
R, Y and B phase’s currents in the entire network. The results are fruitful, but
it does not guarantee reduction of neutral current in each section of the
network.
Fuzzy logic based load balancing effects load transfer between poles
by reconfiguring consumers in different poles of the selected LV network.
This will balance loads in the entire network but fails to balance loads in each
section of entire LV network. The approach which will guarantee reduction of
neutral current in each section that is in each span length of the entire low
voltage distribution network will bring down line losses to greater extent. To
solve the problem arising out of unbalance current in LV network more
effectively, the heuristic method has been developed, tested and validated in
this thesis.

170
5.4 HEURISTIC METHOD LOAD BALANCING OF LV
NETWORK
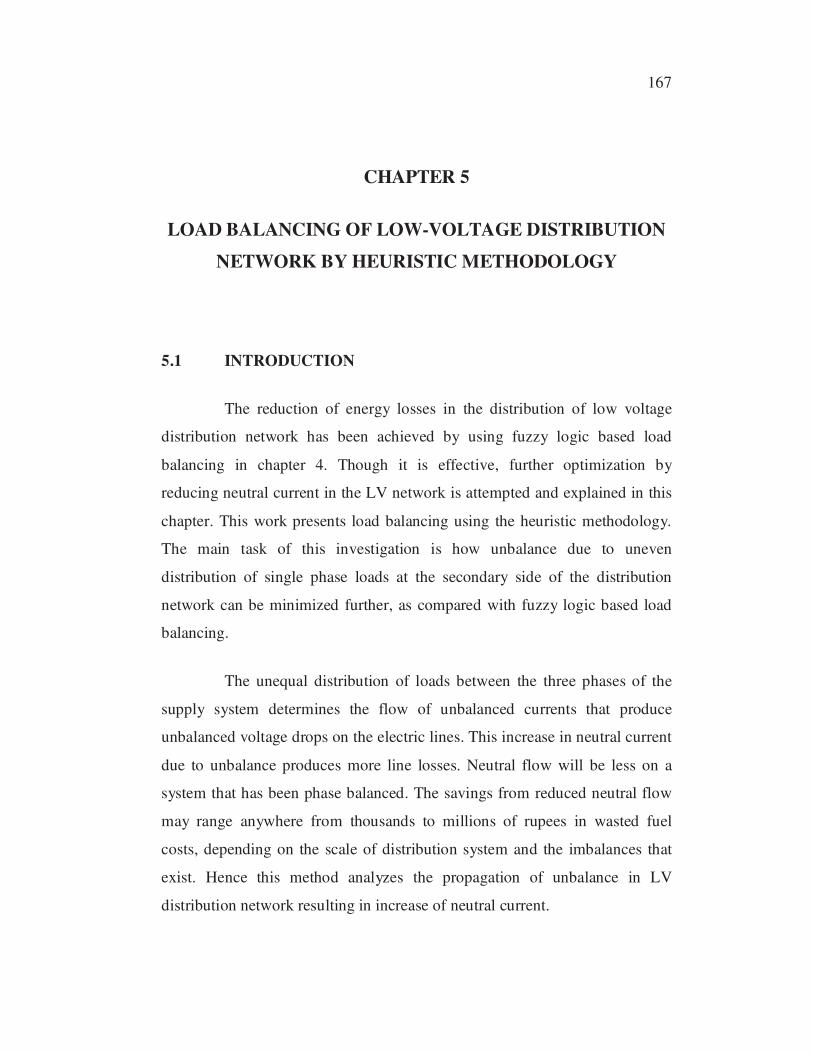
Types of load conditions, load combinations and prediction of
unbalance currents in LV network have been discussed earlier elaborately in
the chapter 2 and chapter 4. For the different combination of loads described
consumers are shifted pole-wise so that all the individual poles of the
distribution transformer remains balanced after the process. By this approach,
the neutral current in all sections of LV distribution network gets reduced.
The flow chart explaining the procedure to shift consumers is shown in
Figure 5.1.
All load combinations and load conditions considered for overall
LV network has been adopted for each and every pole of the LV network in
which consumers (node) are connected. The objective of the switching logic
is to minimize neutral current. The difference between optimum current and
phase current is calculated. Each consumer’s current is compared with the
“difference value” and single consumer matching the difference value is
tabulated. Similar exercise is done for sum of currents of two consumers
taken at a time and three consumers taken at a time and results are tabulated.
The sum of currents of consumers which almost matches the “difference
value” is found out. The suggestion is given by consumer shifting logic to
shift those consumers from overloaded phase to under loaded phase. The
same logic is adopted for all the poles with connected consumers of entire LV
distribution network. The entire logic has been developed in c-program.
171
Figure 5.1(a) Flow chart for Consumer Shifting Technique
F
Start
Read the consumer details from the excel file
and save them in the structure consumer
Find the number of poles, total number of
consumers and no. of consumers in each pole
For a pole, find IR, IY and IB ,
sum of currents in R, Y, B phase respectively
IR= IY = IB ? Pole is balanced
Iopt= (IR +IY + IB)/3
Find
r = IR – Iopt
y = IY – Iopt
b = IB – Iopt
Stop
A
YES
NO

172
Figure 5.1(b) Flow chart for Consumer Shifting Technique
A
Check r, y, and b. If one of them is positive and
one is negative, set case = 1. Assign
corresponding phases as posphase and negphase.
If two phases are positive and one is negative,
set case = 2. Assign corresponding phases as
posphase, posphase1 and negphase.
If one phase is positive and two are negative,
set case = 3. Assign corresponding phases
as posphase, negphase and negphase1.
Is case=1? B
= posvalue
Find min1 = min [ | (∆ – current of
any consumer) | ]
C
YES
NO
∆
173
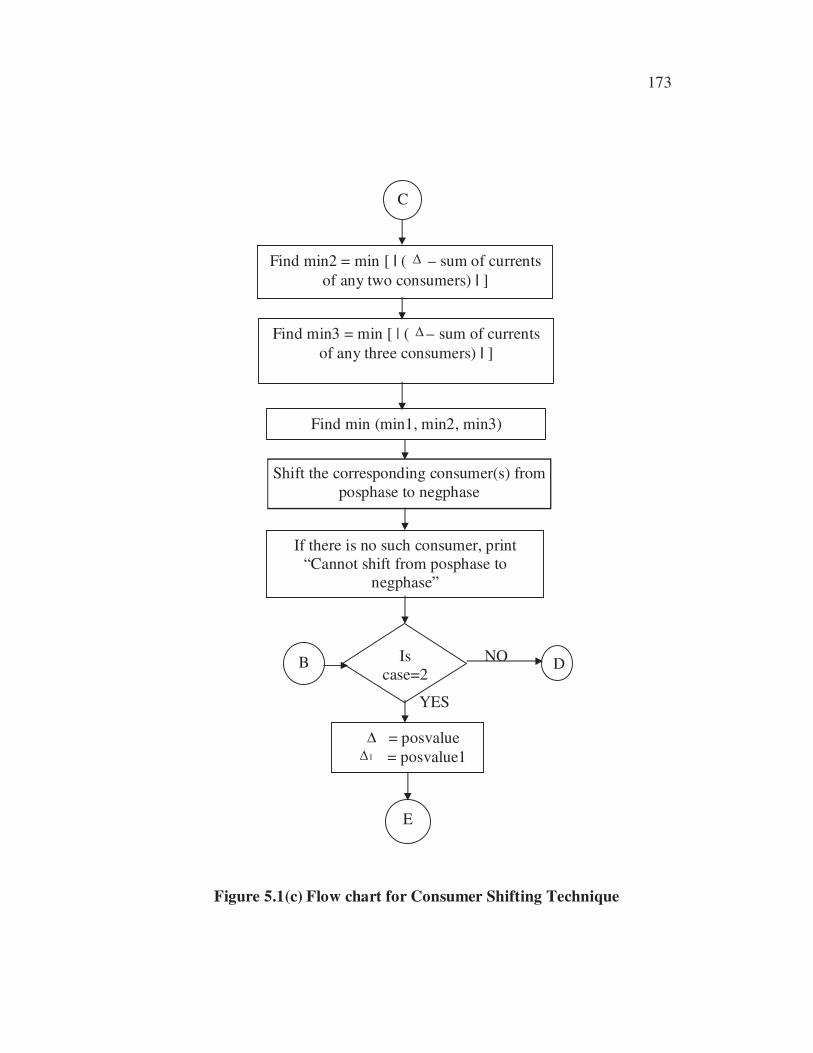
Figure 5.1(c) Flow chart for Consumer Shifting Technique
YES
YES
C
Find min2 = min [ | ( ∆ – sum of currents
of any two consumers) | ]
Find min3 = min [ | ( ∆– sum of currents
of any three consumers) | ]
Find min (min1, min2, min3)
If there is no such consumer, print
“Cannot shift from posphase to
negphase”
Is
case=2D B NO
= posvalue
1∆ = posvalue1
E
∆
Shift the corresponding consumer(s) from
posphase to negphase
174
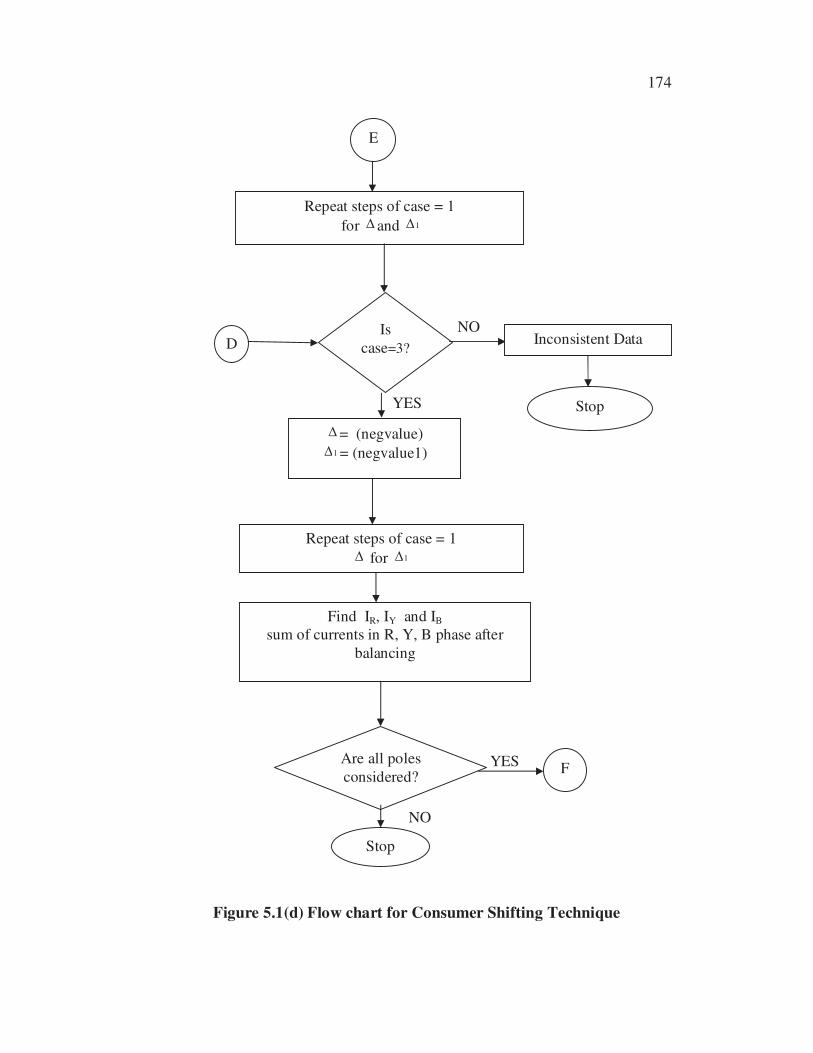
Figure 5.1(d) Flow chart for Consumer Shifting Technique
E
Repeat steps of case = 1
for ∆ and 1∆
Is
case=3? D
∆= (negvalue) 1∆ = (negvalue1)
Repeat steps of case = 1 ∆ for 1∆
Find IR, IY and IB
sum of currents in R, Y, B phase after
balancing
Are all poles
considered?
Stop
F
Inconsistent Data
Stop YES
NO
YES
NO
175
5.5 RECONFIGURATION USING HEURISTIC
METHODOLOGY
Three transformers have been examined for unbalanced condition of
LV network and overall balanced (between sections, between poles) condition
of LV network and results are studied in chapter 4. For analyzing with
heuristic method, two numbers of distribution transformers, Urban DT2 and
Urban DT3 are taken for study. Load balancing is effected within sections
taking into consideration all sections in the LV network. Based on the
analysis, the results obtained in simulation software by reconfiguring the
consumers (nodes) of Urban DT2 and Urban DT3 so as to balance the system
is presented in this section.
5.6 CASE STUDY 1: RECONFIGURATION OF URBAN DT2
The schematic diagram, low voltage distribution album (LV album)
and load analysis by distribution simulation package of urban DT 2 has been
already presented in the section 4.6. It contains twenty poles and the
consumers connected in different phases of each pole. It caters to the needs of
103 consumers with 96 single phase consumers connected in different phases
R, Y, B and 7 three phase consumers with balanced loads. The inputs to the
c-program are the single phase consumers for balancing suggestion. The three
phase consumers are industrial consumers whose loads are already balanced.
Though there are twenty poles, the c-program displays number of poles with
single phase consumers.
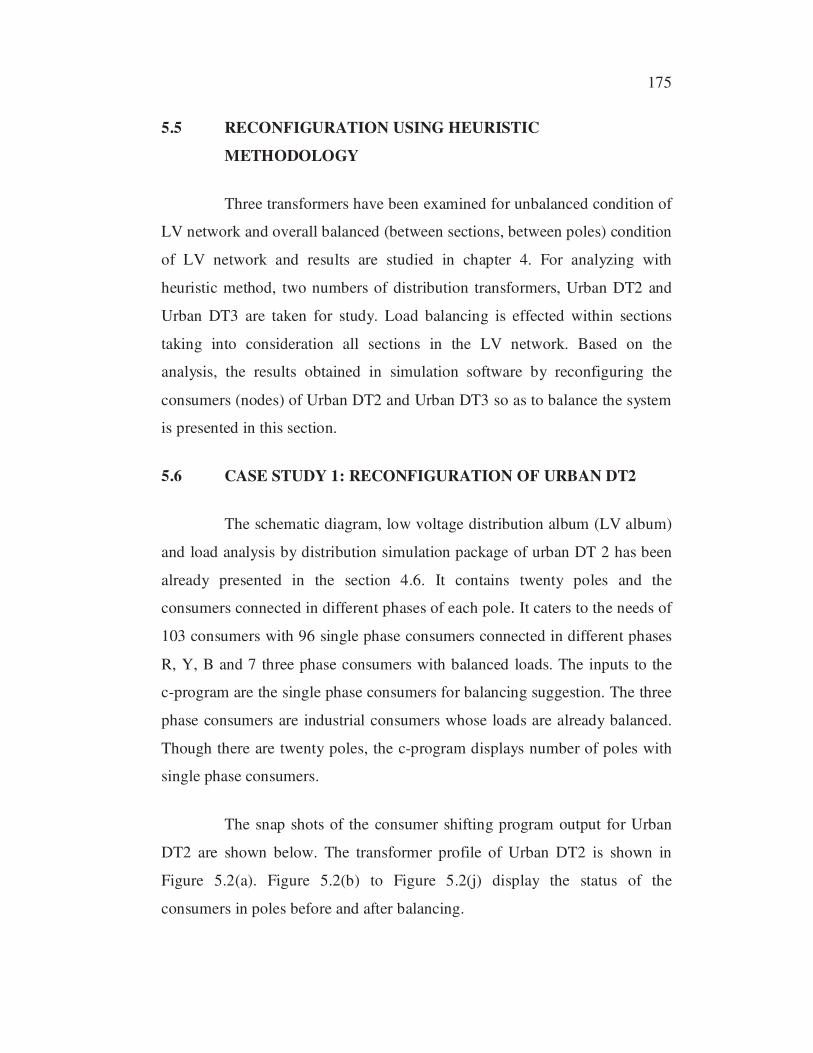
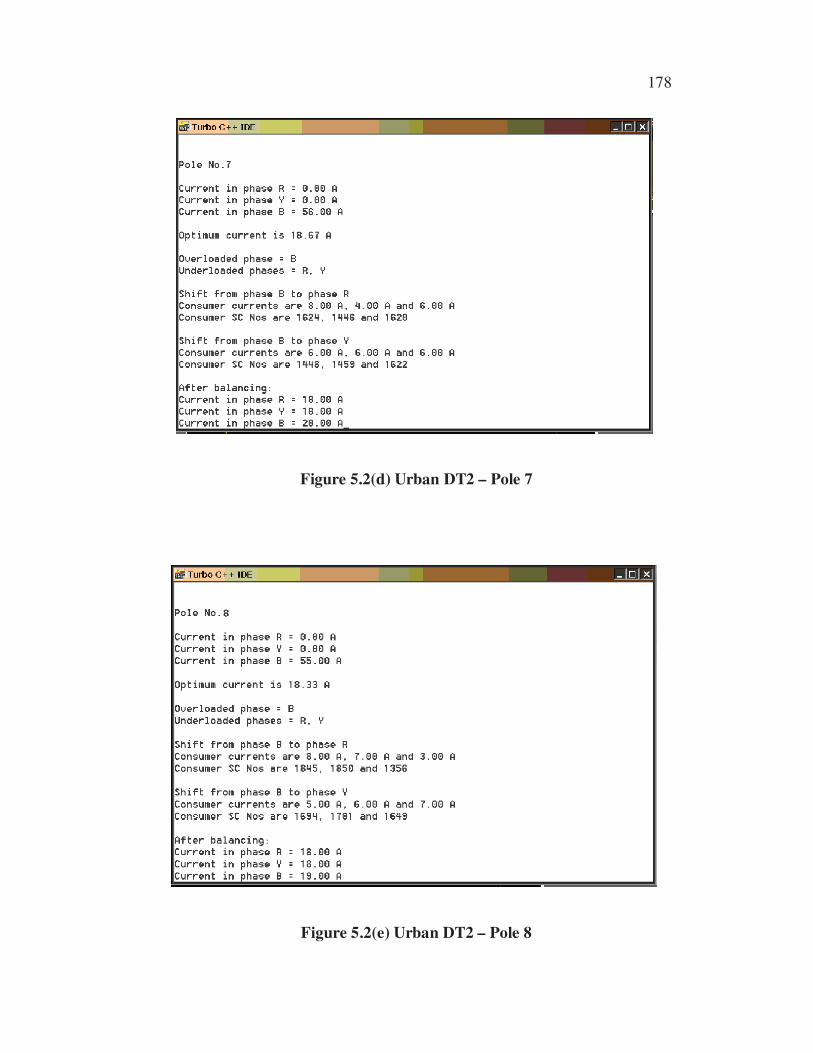
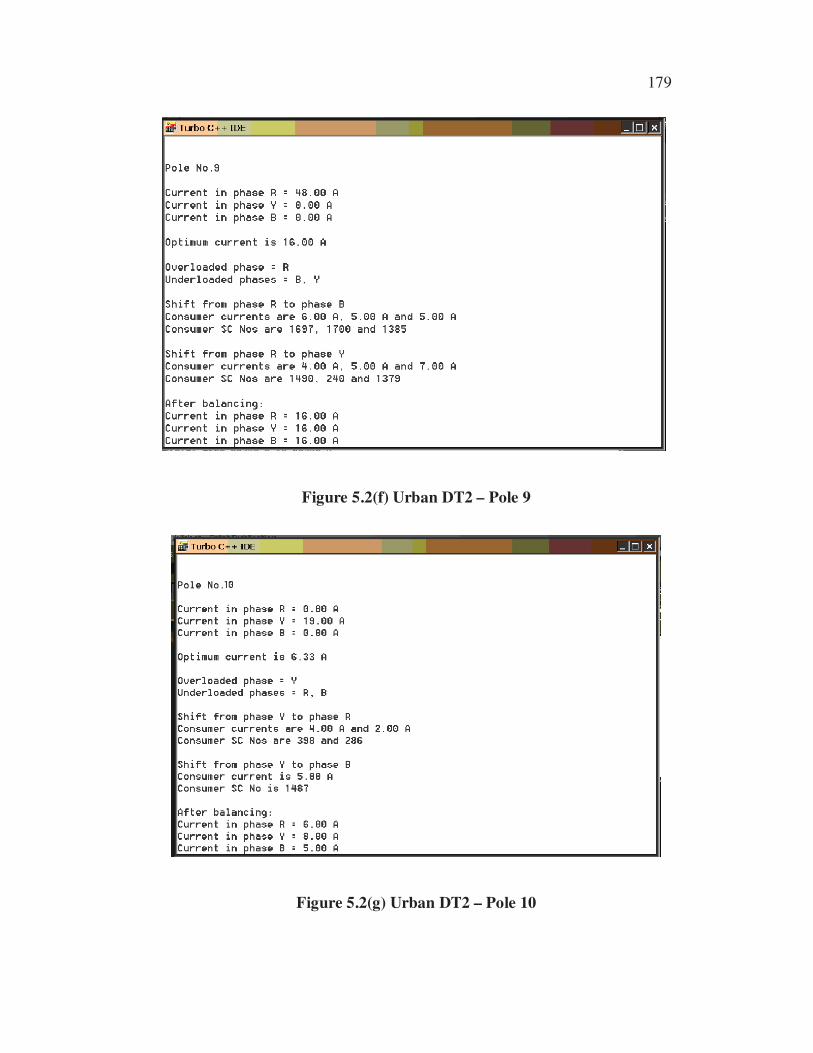
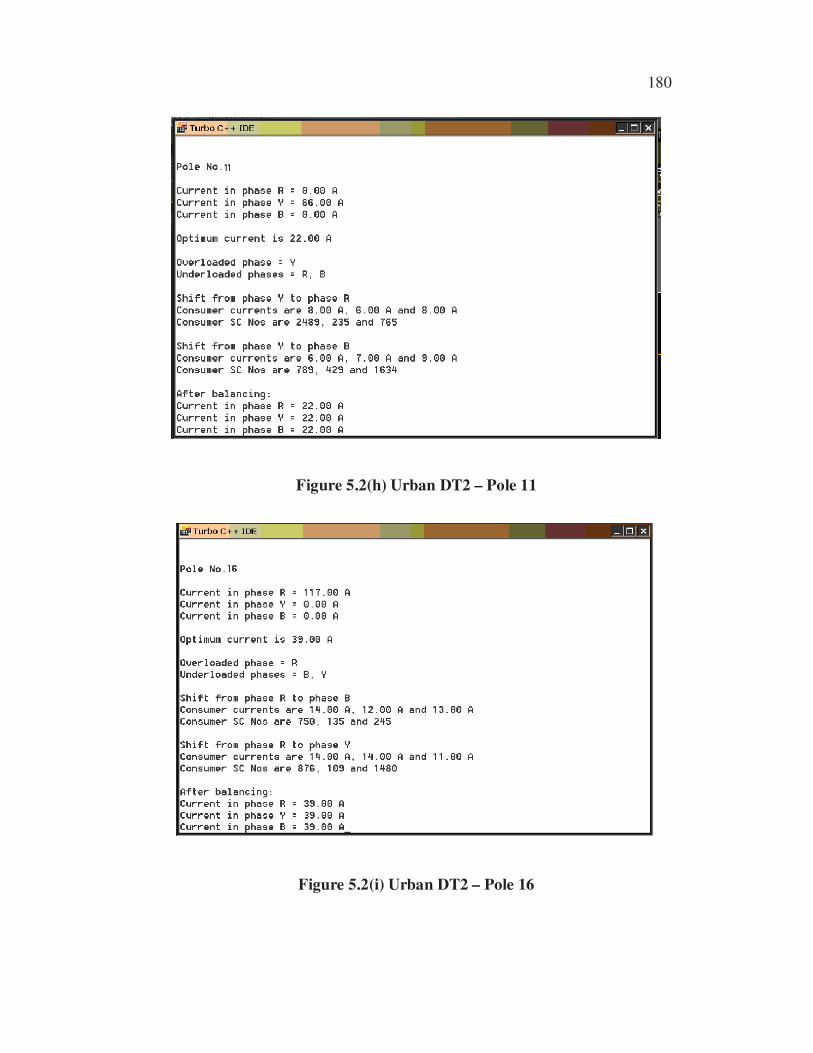
The snap shots of the consumer shifting program output for Urban
DT2 are shown below. The transformer profile of Urban DT2 is shown in
Figure 5.2(a). Figure 5.2(b) to Figure 5.2(j) display the status of the
consumers in poles before and after balancing.
176
Figure 5.2(a) Urban DT2 Profile
Out of 20 poles in the LV network, the consumers are connected in
13 poles. 7 numbers of three phase consumers are connected in 4 poles and 96
numbers of single phase consumers are connected in 9 poles. Unbalance is
created due to the presence of 96 service connection single phase consumers
in 9 poles. The total number of consumers connected in each pole is as shown
in Figure 5.2(a), Urban DT2. By heuristic approach, balancing is suggested in
all 9 poles as shown in below figures (Figure 5.2(b) to Figure 5.2(j)) by
displaying service connection numbers of consumers to be shifted between
phases in each pole.

177
Figure 5.2(b) Urban DT2 – Pole 5
Figure 5.2(c) Urban DT2 – Pole 6
178
Figure 5.2(d) Urban DT2 – Pole 7
Figure 5.2(e) Urban DT2 – Pole 8
179
Figure 5.2(f) Urban DT2 – Pole 9
Figure 5.2(g) Urban DT2 – Pole 10
180
Figure 5.2(h) Urban DT2 – Pole 11
Figure 5.2(i) Urban DT2 – Pole 16
181
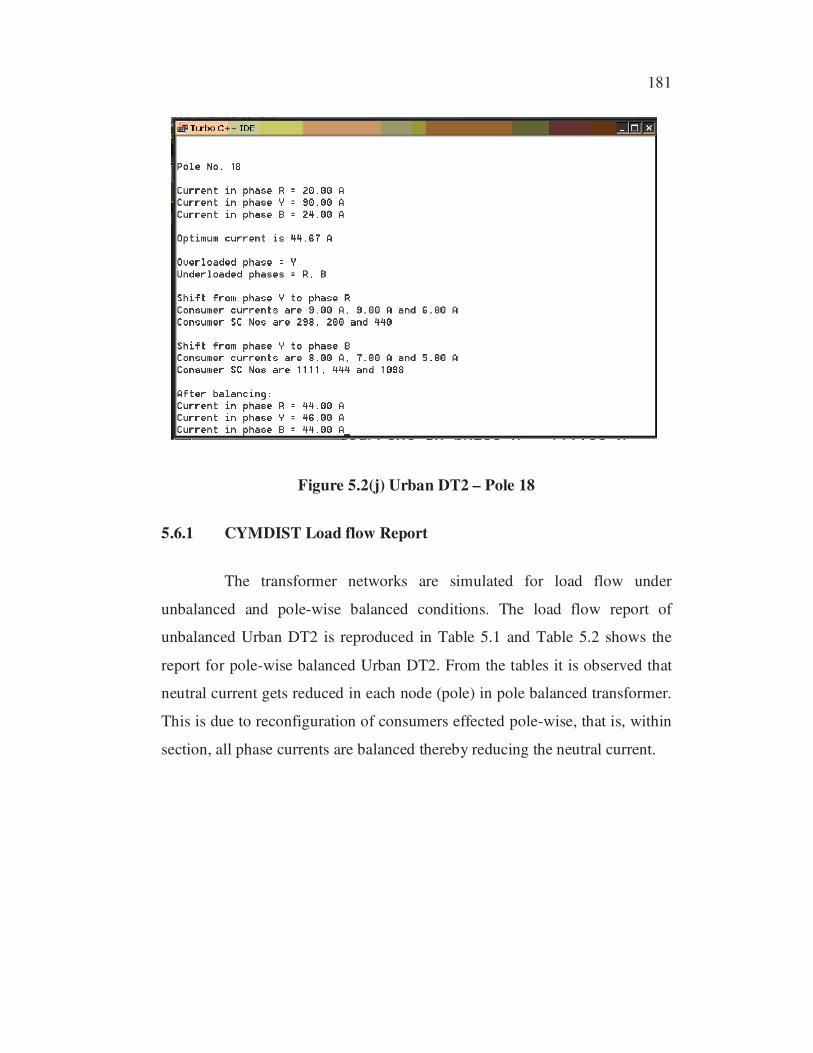
Figure 5.2(j) Urban DT2 – Pole 18
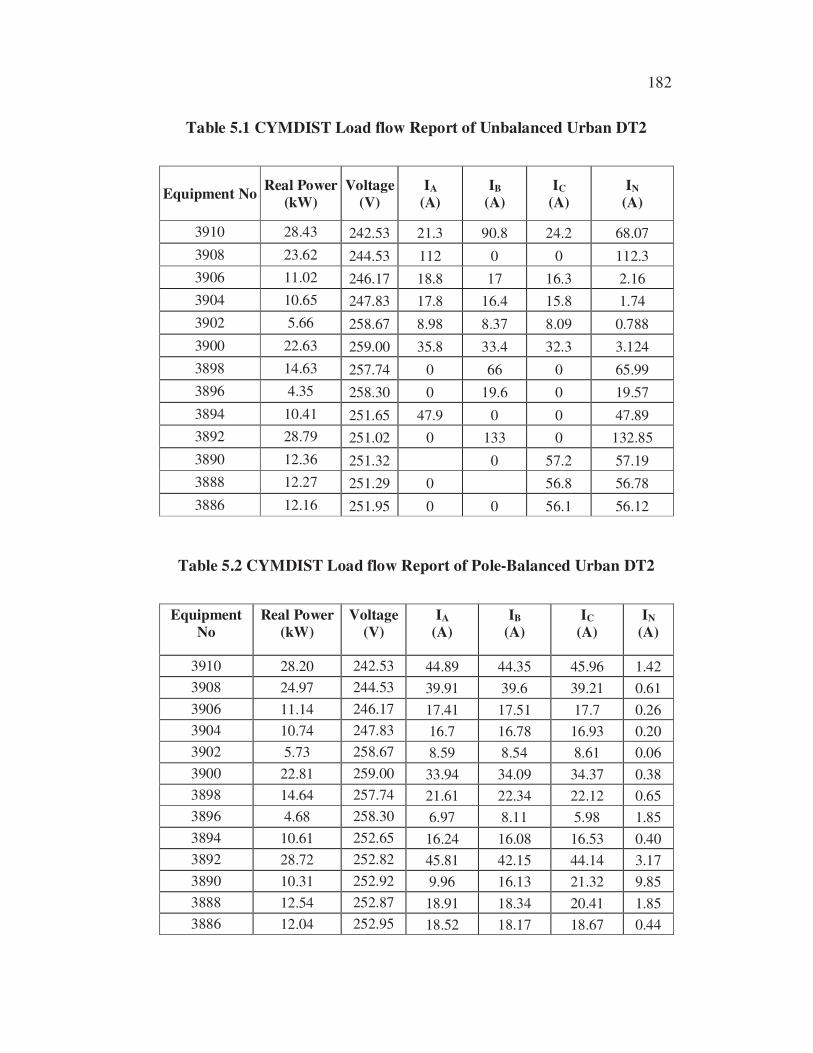
5.6.1 CYMDIST Load flow Report
The transformer networks are simulated for load flow under
unbalanced and pole-wise balanced conditions. The load flow report of
unbalanced Urban DT2 is reproduced in Table 5.1 and Table 5.2 shows the
report for pole-wise balanced Urban DT2. From the tables it is observed that
neutral current gets reduced in each node (pole) in pole balanced transformer.
This is due to reconfiguration of consumers effected pole-wise, that is, within
section, all phase currents are balanced thereby reducing the neutral current.
182
Table 5.1 CYMDIST Load flow Report of Unbalanced Urban DT2
Equipment No Real Power
(kW)
Voltage
(V)
IA
(A)
IB
(A)
IC
(A)
IN
(A)
3910 28.43 242.53 21.3 90.8 24.2 68.07
3908 23.62 244.53 112 0 0 112.3
3906 11.02 246.17 18.8 17 16.3 2.16
3904 10.65 247.83 17.8 16.4 15.8 1.74
3902 5.66 258.67 8.98 8.37 8.09 0.788
3900 22.63 259.00 35.8 33.4 32.3 3.124
3898 14.63 257.74 0 66 0 65.99
3896 4.35 258.30 0 19.6 0 19.57
3894 10.41 251.65 47.9 0 0 47.89
3892 28.79 251.02 0 133 0 132.85
3890 12.36 251.32 0 57.2 57.19
3888 12.27 251.29 0 56.8 56.78
3886 12.16 251.95 0 0 56.1 56.12
Table 5.2 CYMDIST Load flow Report of Pole-Balanced Urban DT2
Equipment
No
Real Power
(kW)
Voltage
(V)
IA
(A)
IB
(A)
IC
(A)
IN
(A)
3910 28.20 242.53 44.89 44.35 45.96 1.42
3908 24.97 244.53 39.91 39.6 39.21 0.61
3906 11.14 246.17 17.41 17.51 17.7 0.26
3904 10.74 247.83 16.7 16.78 16.93 0.20
3902 5.73 258.67 8.59 8.54 8.61 0.06
3900 22.81 259.00 33.94 34.09 34.37 0.38
3898 14.64 257.74 21.61 22.34 22.12 0.65
3896 4.68 258.30 6.97 8.11 5.98 1.85
3894 10.61 252.65 16.24 16.08 16.53 0.40
3892 28.72 252.82 45.81 42.15 44.14 3.17
3890 10.31 252.92 9.96 16.13 21.32 9.85
3888 12.54 252.87 18.91 18.34 20.41 1.85
3886 12.04 252.95 18.52 18.17 18.67 0.44
183
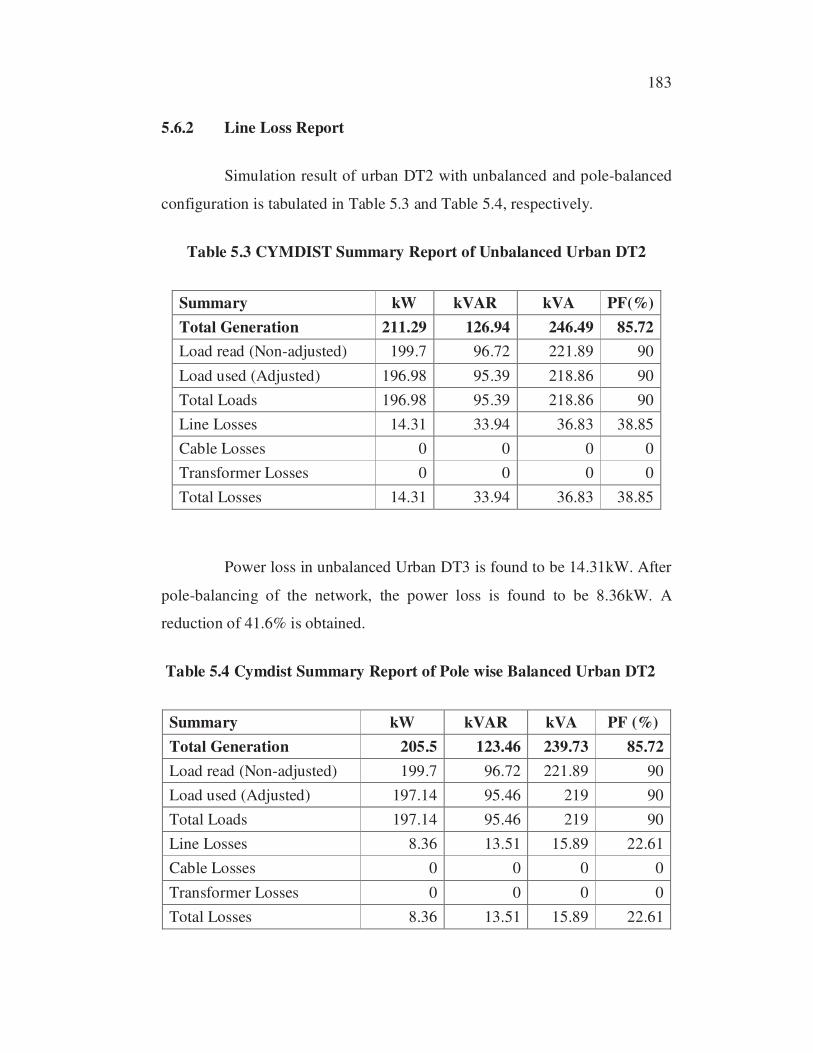
5.6.2 Line Loss Report
Simulation result of urban DT2 with unbalanced and pole-balanced
configuration is tabulated in Table 5.3 and Table 5.4, respectively.
Table 5.3 CYMDIST Summary Report of Unbalanced Urban DT2
Summary kW kVAR kVA PF(%)
Total Generation 211.29 126.94 246.49 85.72
Load read (Non-adjusted) 199.7 96.72 221.89 90
Load used (Adjusted) 196.98 95.39 218.86 90
Total Loads 196.98 95.39 218.86 90
Line Losses 14.31 33.94 36.83 38.85
Cable Losses 0 0 0 0
Transformer Losses 0 0 0 0
Total Losses 14.31 33.94 36.83 38.85
Power loss in unbalanced Urban DT3 is found to be 14.31kW. After
pole-balancing of the network, the power loss is found to be 8.36kW. A
reduction of 41.6% is obtained.
Table 5.4 Cymdist Summary Report of Pole wise Balanced Urban DT2
Summary kW kVAR kVA PF (%)
Total Generation 205.5 123.46 239.73 85.72
Load read (Non-adjusted) 199.7 96.72 221.89 90
Load used (Adjusted) 197.14 95.46 219 90
Total Loads 197.14 95.46 219 90
Line Losses 8.36 13.51 15.89 22.61
Cable Losses 0 0 0 0
Transformer Losses 0 0 0 0
Total Losses 8.36 13.51 15.89 22.61
184
The total power delivered from the transformer is 211.29 kW and
the total loss is 14.31 kW which is 6.77% of total power. After load balancing
the loss is arrived as 8.36kW, which is 4.0% of total power and there is
significant reduction of power loss up to 2.77%. If a condition is presumed in
which the transformer is operated with 211.29 kW of total power for the
period of 10 hours in a day then the energy delivered would be 2112.9 kWhr.
Loss reduction of 2.72% is equivalent to 58 units which is saving
met out from load balancing. An average cost of `3.20 is adopted to compute
the saving per transformer. The saving per transformer is 58*3.20=185 and
for one year 365*185= `67525 is arrived at. For 1,92,000 distribution
transformers in one electrical utility, the total saving per year will be
67525*1,92,000=12964.8 million rupees/annum.
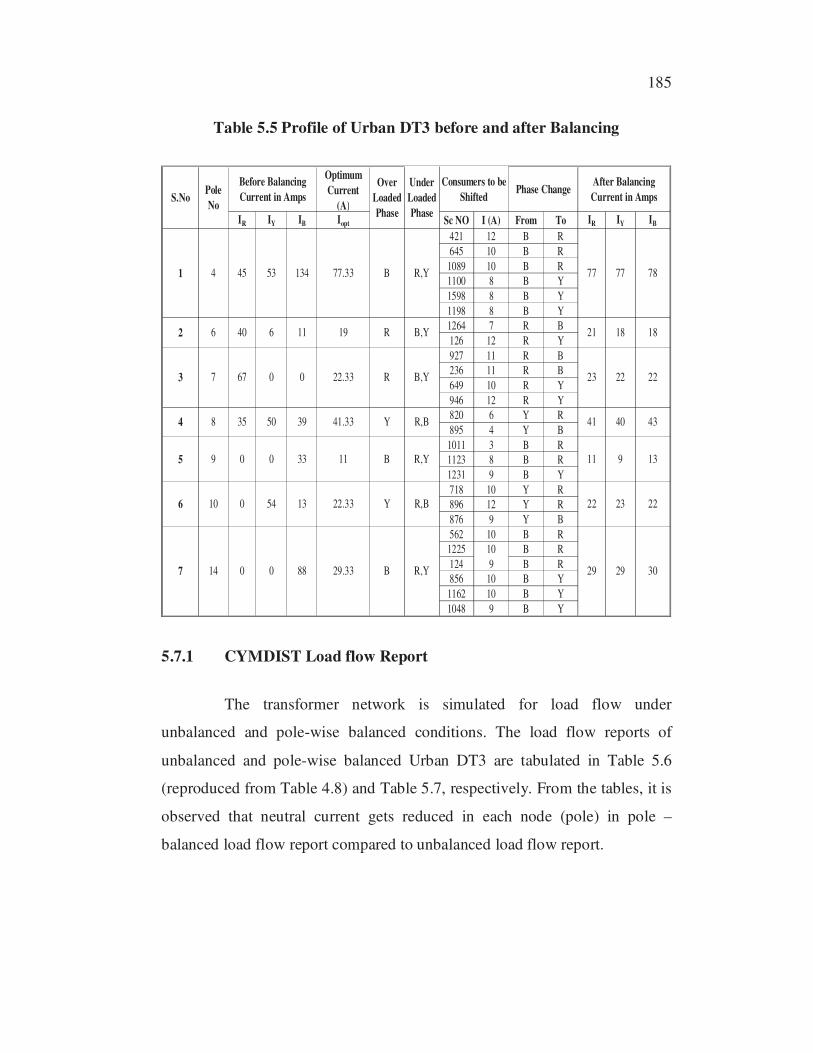
5.7 CASE STUDY 2: RECONFIGURATION OF URBAN DT3
The schematic diagram, low voltage distribution album (LV album)
and load analysis by distribution simulation package of Urban DT 3 has been
already presented in the section 4.7. It contains fourteen poles and the
consumers connected in different phases of each pole. It caters to the needs of
83 single phase consumers connected in different phases R, Y, B in 7 poles
and 6 three phase consumers with balanced loads in 2 poles. The result of
consumer shifting logic is tabulated in Table 5.5.
185
Table 5.5 Profile of Urban DT3 before and after Balancing
Optimum
Current
(A)
IR IY IB Iopt Sc NO I (A) From To IR IY IB
421 12 B R
645 10 B R
1089 10 B R
1100 8 B Y
1598 8 B Y
1198 8 B Y
1264 7 R B
126 12 R Y
927 11 R B
236 11 R B
649 10 R Y
946 12 R Y
820 6 Y R
895 4 Y B
1011 3 B R
1123 8 B R
1231 9 B Y
718 10 Y R
896 12 Y R
876 9 Y B
562 10 B R
1225 10 B R
124 9 B R
856 10 B Y
1162 10 B Y
1048 9 B Y
R,Y 29 29 30
22 23 22
7 14 0 0 88 29.33 B
5 13911B11330
41 40 43
R,Y09
35 50 39 41.33 Y R,B
R,BY22.3313540
22.3300
6
6773
10
4 8
18 18
B,YR 23 22 22
6 11 19 R B,Y 21
77 78134 77.33 B R,Y53
6
Pole
NoS.No
1 774 45
2 40
Phase ChangeAfter Balancing
Current in Amps
Over
Loaded
Phase
Under
Loaded
Phase
Before Balancing
Current in Amps
Consumers to be
Shifted
5.7.1 CYMDIST Load flow Report
The transformer network is simulated for load flow under
unbalanced and pole-wise balanced conditions. The load flow reports of
unbalanced and pole-wise balanced Urban DT3 are tabulated in Table 5.6
(reproduced from Table 4.8) and Table 5.7, respectively. From the tables, it is
observed that neutral current gets reduced in each node (pole) in pole –
balanced load flow report compared to unbalanced load flow report.

186
Table 5.6 CYMDIST Load flow Report of Unbalanced Urban DT3
Equipment
No
Real
Power
(kW)
Voltage
(V)
IA
(A)
IB
(A)
IC
(A)
IN
(A)
3884 24.03 234.45 35.12 50.58 36.32 14.90
3883 11.80 237.70 40.33 6.76 11.99 31.28
3881 13.48 238.41 67.30 0.00 0.00 67.30
3878 48.74 239.33 45.02 53.99 143.45 94.27
3876 17.97 242.31 0.00 0.00 88.28 88.28
3874 20.07 243.46 32.88 33.73 31.53 1.92
3868 14.25 248.06 0.00 54.76 13.61 49.38
3866 7.07 248.43 0.00 0.00 33.86 33.86
3871 23.67 248.58 37.88 36.76 38.74 1.72
Table 5.7 CYMDIST Load flow Report of Pole wise Balanced Urban DT3
Equipment
No
Real
Power
(kW)
Voltage
(V)
IA
(A)
IB
(A)
IC
(A)
IN
(A)
3884 25.47 242.5 41.12 40.58 43.32 2.51
3883 12.09 244.5 21.33 18.76 18.75 2.58
3881 14.49 246.2 23.01 23.92 23.14 0.85
3878 48.84 247.8 77.31 78.56 78.76 1.36
3876 19.33 258.7 29.5 29.82 29.63 0.28
3874 21.35 259 32.88 33.73 31.53 1.92
3868 14.52 257.7 22.4 22.71 21.96 0.65
3866 7.41 258.3 11.53 9.41 13.21 3.30
3871 24.06 252.7 37.88 36.76 38.74 1.72
187
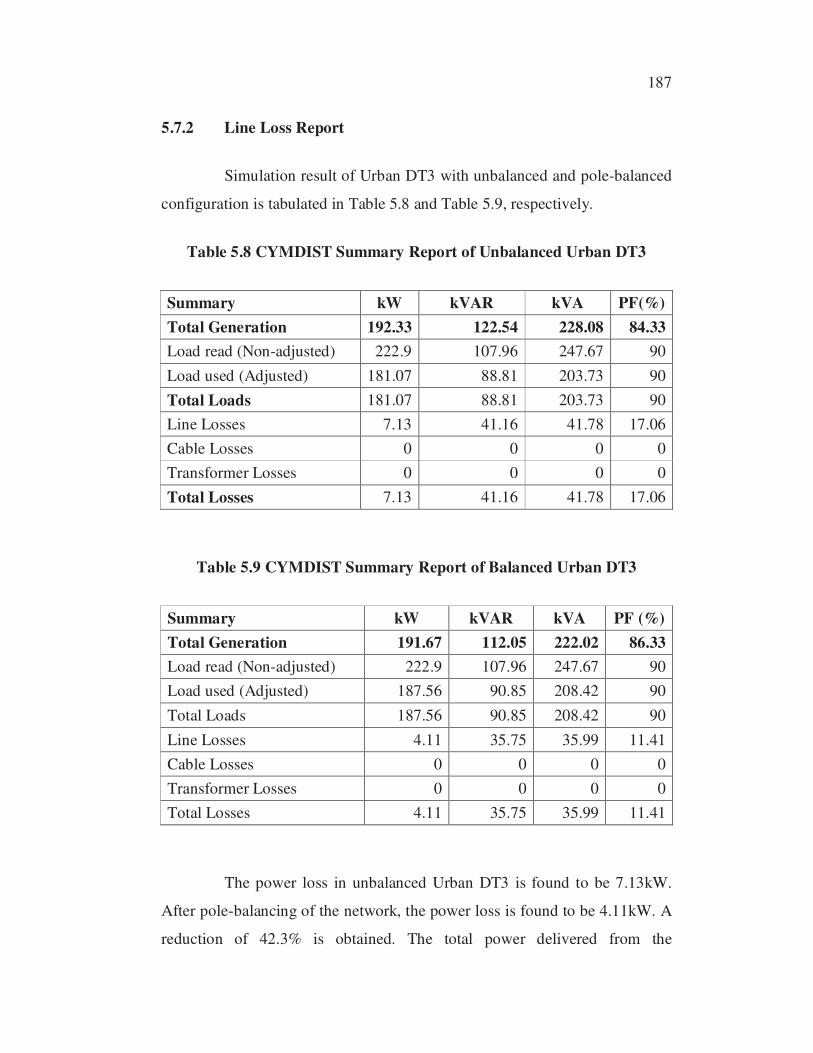
5.7.2 Line Loss Report
Simulation result of Urban DT3 with unbalanced and pole-balanced
configuration is tabulated in Table 5.8 and Table 5.9, respectively.
Table 5.8 CYMDIST Summary Report of Unbalanced Urban DT3
Summary kW kVAR kVA PF(%)
Total Generation 192.33 122.54 228.08 84.33
Load read (Non-adjusted) 222.9 107.96 247.67 90
Load used (Adjusted) 181.07 88.81 203.73 90
Total Loads 181.07 88.81 203.73 90
Line Losses 7.13 41.16 41.78 17.06
Cable Losses 0 0 0 0
Transformer Losses 0 0 0 0
Total Losses 7.13 41.16 41.78 17.06
Table 5.9 CYMDIST Summary Report of Balanced Urban DT3
Summary kW kVAR kVA PF (%)
Total Generation 191.67 112.05 222.02 86.33
Load read (Non-adjusted) 222.9 107.96 247.67 90
Load used (Adjusted) 187.56 90.85 208.42 90
Total Loads 187.56 90.85 208.42 90
Line Losses 4.11 35.75 35.99 11.41
Cable Losses 0 0 0 0
Transformer Losses 0 0 0 0
Total Losses 4.11 35.75 35.99 11.41
The power loss in unbalanced Urban DT3 is found to be 7.13kW.
After pole-balancing of the network, the power loss is found to be 4.11kW. A
reduction of 42.3% is obtained. The total power delivered from the

188
transformer is 192.33 kW and the total loss is 7.13 kW which is 3.7% of total
power. After load balancing the loss is arrived as 4.11kW, which is 2.1% of
total power and there is reduction of power loss up to 1.6%. If a condition is
presumed in which the transformer is operated with 192.33 kW of total power
for the period of 10 hours in a day then the unit delivered would be
1923.3 kWhr.
The loss reduction of 1.6% is 31 units which is saving met out from
load balancing. The average cost of Rs.3.20 is adopted to compute the saving
per transformer. The saving per transformer for one year 365*99= `36135 is
arrived at. For 1,92,000 distribution transformers in one electrical utility the
total saving per year will be 36135*1,92,000 = 6937.9 million rupees/annum.
In this thesis, a complete off-line package has been designed by
using heuristic methodology. The proposed load balancing technique
effectively meets the criteria to minimize energy loss which has been proved
by CYMDIST simulation. On an average, 41% power loss reduction is
accomplished in the case studies undertaken. Significant reduction in energy
losses and hence a huge savings in cost is ascertained by the aforesaid
approach.
Both the distribution transformers taken as case study belong to
urban area. Hence they represent worst-case study for the proof of the
method. If rural area or semi-urban area distribution transformer is load
balanced using heuristic method, the result will be very much beneficial to
electrical utility due to the presence of lengthy distribution lines in LV
network and scattered consumers.