chapter 5 trade, technology, foreign firms and wage … · chapter 5 trade, technology, foreign...
TRANSCRIPT

Chapter 5
Trade, Technology, Foreign Firms and Wage
Gap: Case of Vietnam Manufacturing Firms
Shandre M. Thangavelu
National University of Sintapore
March 2013
This chapter should be cited as
Thangavelu, S. (2013), ‘Trade, Technology, Foreign Firms and Wage Gap: Case of
Vietnam Manufacturing Firms’, in Hahn, C. H. and D. A. Narjoko (eds.), Impact of
Globalization on Labor Market. ERIA Research Project Report 2012, no.4, pp.107-133.
Available at: http:/www.eria.org/RPR_FY2012_No.4_Chapter_5.pdf
107
CHAPTER 5
Trade, Technology, Foreign Firms and Wage Gap: Case of
Vietnam Manufacturing Firms
SHANDRE M. THANGAVELU*
National University of Singapore
In this study we explore the effects of trade and technology on the impact of wage
gap in the Vietnamese manufacturing industries using the enterprise level data. We
explore the impact of skill-biased technological change on the wage differential
between the skilled and unskilled workers. The results indicate that firms experienced
neutral technological change affecting both skilled and unskilled in a neutral fashion.
However, trade tends to have skilled-biased effects in terms of increasing the returns
of skilled workers relative to unskilled workers. This has implications for Vietnam in
terms of increasing skills and human capital of workers and reducing any job
mismatch that might emanate from the economic restructuring of the economy. The
importance of domestic capacity building and linkages will be crucial to increase the
technological development and innovation capabilities of domestic economy. In
particular, the next phase of development for Vietnam will be based on how well they
are able to harness the development of local human capital and domestic enterprises.
Keywords: Wage inequality, Technological Change, Trade
JEL Classification: J23; J31; L24.
* Department of Economics, National University of Singapore, Email: [email protected]

108
1. Introduction
The growing amount of recent research in the area of international economics has
associated the phenomenon of widening wage differentials between skilled and
unskilled workers in developed countries due to technological changes and
globalization. The recent studies highlights that the rising wage differentials in most
developed countries are mainly due to technological advances and skill-biased
technological change that increased the demand for skilled workers (Autor, et al., 1998;
Acemoglu & Autor, 2011; Card & DiNardo, 2002). However, Card & DiNardo (2002)
highlights that the key issue for the skill-biased technology change is that it failed to
explain wage inequality due to gender and racial wage gaps and the age gradient in the
returns to education.
In contrast, with the prevalence of globalization and trade activities, Feenstra &
Hanson (1996, 1999) highlights that we can observe widening wage differentials occur
when production stages shift to higher value-added activities due to competition in the
global markets. Several empirical studies examined a relationship between trade
(outsourcing) and wage inequality using information on a wide range of industries in
various economies such as Anderton & Brenton (1999) for the United Kingdom (UK),
Geishecker (2002) for Germany, Chongvilaivan & Thangavelu (2012) for Thailand,
and Hsieh & Woo (2005) for Hong Kong. These studies produce rather consistent
evidence that points to trade and international outsourcing – the uses of parts and
components imports that allow firms to specialise their core-competent activities, to
enhance cost efficiency, and to maintain competitiveness in the globalised market – as
a key catalyst of mounting wage inequality. This development is attributed to
advancement of information and communication technology and closer trade ties to
the international market that have led to substantial surges in outsourcing of less skill-
intensive activities to developing countries in which unskilled workers are relatively
abundant.
The objective of this study is to examine the impact of trade and technology on
the wage gap of skilled and unskilled workers for the Vietnamese manufacturing firm
level data. In particular, we will examine the skill-biased technological changes
induced by globalization that increases the demand for skilled workers relative to the
unskilled workers. In addition, we also examine the impact of trade on the wage gap
109
of skilled and unskilled. It is expected that the impact of imports is likely to have a
different impact on the demand of skilled and unskilled workers as compared to
exports. In particular, if technology is embodied in imported intermediate inputs such
as machines and equipments, than the impact on skilled workers is expected to be
greater than the unskilled workers. In this study, we examined the impact of capital
investment, imported intermediate inputs and exports on the wage gap of the skilled
and unskilled workers.
The organisation of paper is as follows. Section 2 depicts the recent trends and
developments in Vietnam. Section 3 develops the empirical methodology based on
the translog cost function approach. Section 4 presents and discusses the empirical
results. Section 5 concludes.
2. Overview of Globalization and Vietnamese Manufacturing
Industry
The key to strong growth of the Vietnamese economy is the liberalization policy
of the government to increase the competitiveness of the domestic economy by
opening it to foreign competition and investment. Since its economic liberalization,
the government has put in market friendly policy to attract foreign activities in the
domestic economy. In 2007, Vietnam joined the WTO and hence increasing its
participation in the global economy.
The role of the government is also emerging as an important factor for economic
stability of the Vietnamese economy. The pro-business approach of the government
tends to attract significant foreign direct investment activities in the economy. Current
economic policies were triggered by a series of reform in the 1980s known as doi moi
(new thought). The government is now more receptive to the involvement of foreign
governments in its domestic economy, especially in the key sectors such as the IT
sector.

110
Figure 1: Real Growth Rate of GDP of Vietnam and Selected Asian Countries
Source: ADB, Macroeconomic Indicators.
Recent evidence also indicates that the Vietnamese government is liberalizing key
sectors such as IT sector for foreign investment and export competitiveness. The
deregulation is taking the form of restructuring state-owned enterprise into private
enterprises and increasing foreign ownership in domestic industries. In terms of
infrastructure, the government has devoted resources into building Vietnam’s most
modern industrial parks.
The effects of liberalization of the Vietnamese economy are reflected in terms of
real GDP growth at Figure 1. Vietnam tends to have experienced an average real
growth of around 7.1% from 2000-2011, which is much higher than the ASEAN 5
countries and it is only surpassed by recently liberalized economies of Cambodia and
Myanmar. The real growth rate peaked before the Global Financial Crisis at 8.4 in
2006. However, we do observe a downward trend in real GDP after the Global
Financial crisis in 2008, where the average growth rate is 5.9% from 2008-2011.
The growth of the Vietnamese economy also reflects the rising importance of
manufacturing for the domestic economy. Table 1 clearly shows the rising of share of
111
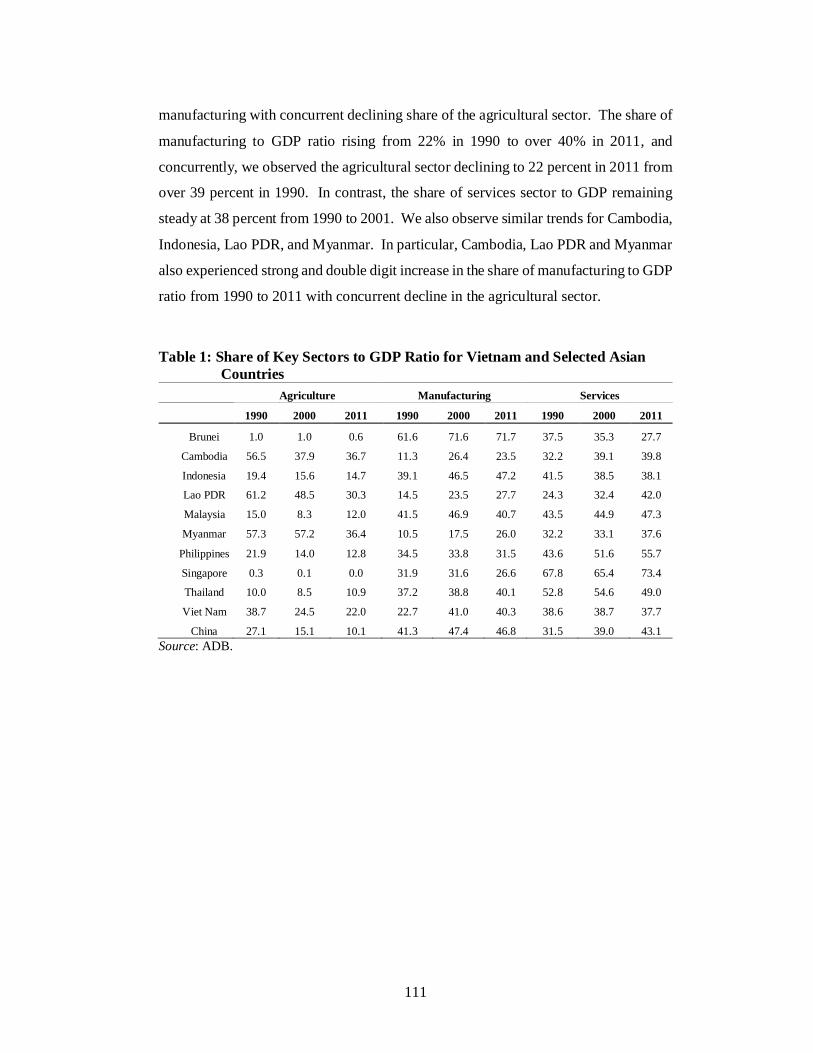
manufacturing with concurrent declining share of the agricultural sector. The share of
manufacturing to GDP ratio rising from 22% in 1990 to over 40% in 2011, and
concurrently, we observed the agricultural sector declining to 22 percent in 2011 from
over 39 percent in 1990. In contrast, the share of services sector to GDP remaining
steady at 38 percent from 1990 to 2001. We also observe similar trends for Cambodia,
Indonesia, Lao PDR, and Myanmar. In particular, Cambodia, Lao PDR and Myanmar
also experienced strong and double digit increase in the share of manufacturing to GDP
ratio from 1990 to 2011 with concurrent decline in the agricultural sector.
Table 1: Share of Key Sectors to GDP Ratio for Vietnam and Selected Asian Countries
Agriculture Manufacturing Services
1990 2000 2011 1990 2000 2011 1990 2000 2011
Brunei 1.0 1.0 0.6 61.6 71.6 71.7 37.5 35.3 27.7
Cambodia 56.5 37.9 36.7 11.3 26.4 23.5 32.2 39.1 39.8
Indonesia 19.4 15.6 14.7 39.1 46.5 47.2 41.5 38.5 38.1
Lao PDR 61.2 48.5 30.3 14.5 23.5 27.7 24.3 32.4 42.0
Malaysia 15.0 8.3 12.0 41.5 46.9 40.7 43.5 44.9 47.3
Myanmar 57.3 57.2 36.4 10.5 17.5 26.0 32.2 33.1 37.6
Philippines 21.9 14.0 12.8 34.5 33.8 31.5 43.6 51.6 55.7
Singapore 0.3 0.1 0.0 31.9 31.6 26.6 67.8 65.4 73.4
Thailand 10.0 8.5 10.9 37.2 38.8 40.1 52.8 54.6 49.0
Viet Nam 38.7 24.5 22.0 22.7 41.0 40.3 38.6 38.7 37.7
China 27.1 15.1 10.1 41.3 47.4 46.8 31.5 39.0 43.1
Source: ADB.

112
Figure 2: Share of Gross Domestic Capital Formation of Vietnam and Selected Asian Countries
Source: ADB.
0.0
10.0
20.0
30.0
40.0
50.0
60.0
1990 1995 2000 2001 2002 2003 2004 2005 2006 2007 2008 2009 2010 2011
Figure 2: Share of Gross Domestic Capital Formation of Vietnam and Selected Asian Countries
Brunei
Cambodia
Indonesia
Malaysia
Myanmar
Philippines
Singapore
Thailand
Viet Nam
China

113
Figure 3: Labour Productivity of Vietnam and Selected Asian Countries
Source: Statistics from ADB.
A recent study by the World Bank (Vietnam Development Report, 2012) reports
the importance of declining labour productivity growth for Vietnam and its impact on
sustaining the economic growth momentum in the region. The trend of labour
productivity for Vietnam and selected ASEAN countries are given at Figure 3. The
labour productivity is fairly stable for Vietnam but is showing a downward trend after
the Global Financial Crisis. The average labour productivity is around 4.9 percent
from 2000-2007 and it declined to nearly 3.2 percent in 2008-2011. Although the
decline in labour productivity in the post-crisis period is of a concern, as compared to
other selected ASEAN countries, the productivity for Vietnam is quite stable and
shows similar trend as other ASEAN countries.
The more important consideration other than productivity growth is the
distribution of growth in the economy. Together with the declining labour productivity,
as of greater concern is the widening income (wage) gap between the top 20 percentile
income earners with lower 20th percentile income earners (see Table 2). The income
gap between the high income earners as compared to the low income earners has
widened over the years. We also noted the widening income gap across most selected
1995 1996 1997 1998 1999 2000 2001 2002 2003 2004 2005 2006 2007 2008 2009 2010 2011
Vietnam 7.1% 7.0% 5.9% 3.5% 2.6% 2.2% 4.4% 4.4% 4.4% 5.2% 5.5% 5.3% 5.5% 3.4% 2.5% 3.9% 3.1%
Thailand 5.9% 5.1% -4.4% -3.3% 2.7% 2.4% 0.8% 3.1% 4.7% 3.6% 2.6% 3.7% 3.8% -0.5% -2.9% 6.6% -1.0%
Indonesia 10.8% 0.8% 5.1% -15.4% -0.5% 0.8% 2.5% 3.5% 3.5% 4.0% 5.4% 3.8% 1.6% 3.3% 2.3% 2.9% 5.0%
Philippines 2.9% -0.6% 8.9% 10.2% -0.5% 4.6% -2.9% 1.9% 3.9% 4.1% 2.2% 3.3% 3.9% 1.9% -2.9% 5.1% 0.1%
-20.0%
-15.0%
-10.0%
-5.0%
0.0%
5.0%
10.0%
15.0%
Figure 3: Labour Productivity of Vietnam and Selected Asian Countries
Vietnam
Thailand
Indonesia
Philippines

114
Asian countries except for Indonesia, Malaysia and Philippines. The widening income
(wage) gap might be driven by technological innovation and trade as the economy
transits to higher value-added activities, thus increasing the demand for more skilled
workers.
Table 2a: The Income Gap in Vietnam and Selected ASEAN Countries
Income Ratio of Highest
20% to Lowest 20%
1995 Latest year
China 5.0 9.6 (2005)
Cambodia 5.8 (1994) 6.1 (2008)
Indonesia 5.0 (1996) 5.1 (2005)
Lao PDR 5.4 (1997) 5.9 (2008)
Malaysia 12.0 11.3 (2009)
Philippines 8.3 (1994) 8.3 (2009)
Thailand 8.1 (1996) 7.1 (2009)
Viet Nam 5.6 (1993) 5.9 (2008) Source: ADB.
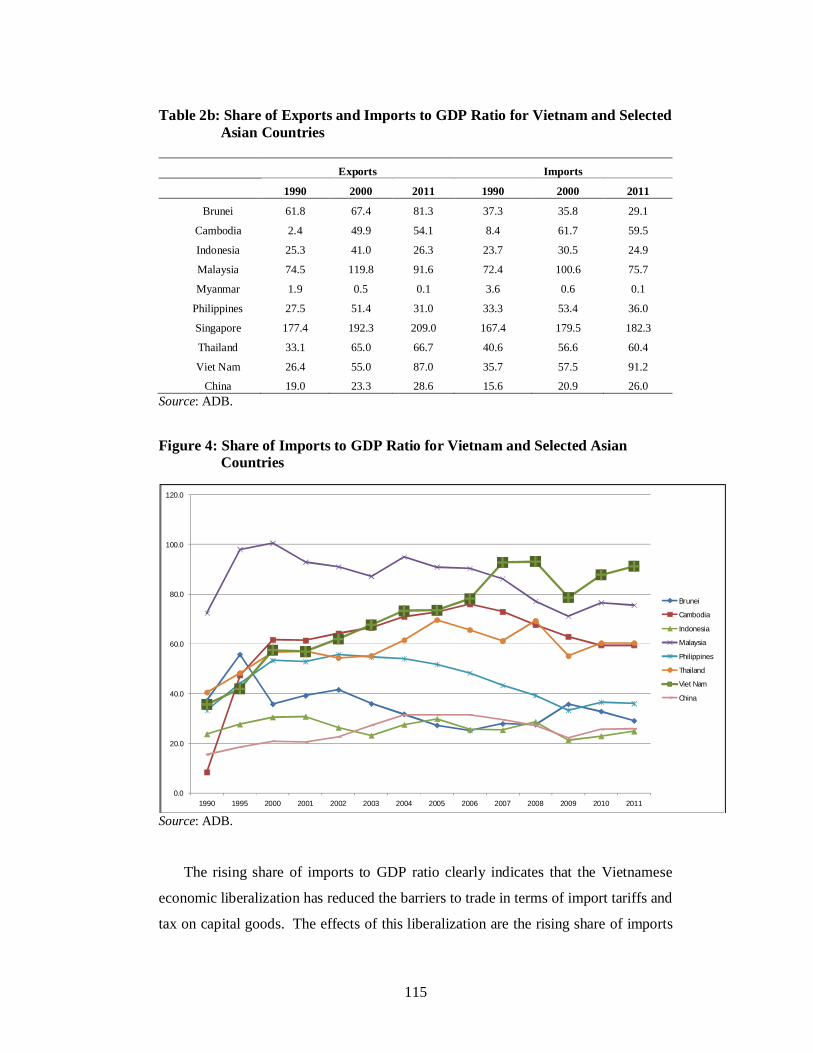
It is important to highlight that the economic liberalization of Vietnam is mainly
driven by the growth in global trade. The share of export to GDP increased to 87
percent in 2011 from 26 percent in 1990. The impact of openness is also observed
with the rising share of imports to GDP, whereby it increased from 36 percent in 1990
to nearly 91 percent in 2011. The rising trend of the imports suggests that Vietnamese
and foreign firms might be increasing their outsourcing activities in the domestic
economy.
115
Table 2b: Share of Exports and Imports to GDP Ratio for Vietnam and Selected Asian Countries
Exports Imports
1990 2000 2011 1990 2000 2011
Brunei 61.8 67.4 81.3 37.3 35.8 29.1
Cambodia 2.4 49.9 54.1 8.4 61.7 59.5
Indonesia 25.3 41.0 26.3 23.7 30.5 24.9
Malaysia 74.5 119.8 91.6 72.4 100.6 75.7
Myanmar 1.9 0.5 0.1 3.6 0.6 0.1
Philippines 27.5 51.4 31.0 33.3 53.4 36.0
Singapore 177.4 192.3 209.0 167.4 179.5 182.3
Thailand 33.1 65.0 66.7 40.6 56.6 60.4
Viet Nam 26.4 55.0 87.0 35.7 57.5 91.2
China 19.0 23.3 28.6 15.6 20.9 26.0
Source: ADB.
Figure 4: Share of Imports to GDP Ratio for Vietnam and Selected Asian Countries
Source: ADB.
The rising share of imports to GDP ratio clearly indicates that the Vietnamese
economic liberalization has reduced the barriers to trade in terms of import tariffs and
tax on capital goods. The effects of this liberalization are the rising share of imports
0.0
20.0
40.0
60.0
80.0
100.0
120.0
1990 1995 2000 2001 2002 2003 2004 2005 2006 2007 2008 2009 2010 2011
Countries
Brunei
Cambodia
Indonesia
Malaysia
Philippines
Thailand
Viet Nam
China

116
to GDP, where domestic firms are likely to outsource some of their key services and
other activities to the global production value-chain. The rising share of imports and
hence outsourcing is given at Figure 2, where the share of imports increased from 36
percent in 1990 to nearly 91 percent in 2011.
2.1. Impact of Trade on Wage Gap
Vietnam also has strong labour force and human capital. The wages in Vietnam
is much lower than that of India and the recent investment in education is increasing
the share of skilled workers. Increasingly the Vietnamese workforce is improving their
skills in technical and science education, thereby increasing the incentive for the firms
to adopt new technologies. Further, recent evidence indicates that Vietnamese workers
are educated in English, thus enabling Vietnam to absorb and diffuse new technologies
faster.
Vietnam has an educated and young labour force. The young population less than
aged 25 years old consist of nearly 60 percent of the population. It also has very high
literacy rate of nearly 97 percent. Primary education focuses on mathematics and the
sciences, and cultivates the interest of the students in technology fields. Annually,
about 20,000 Vietnamese graduate as technical engineers. Another key characteristic
of the Vietnamese labour force is the low turnover, which helps to create strong
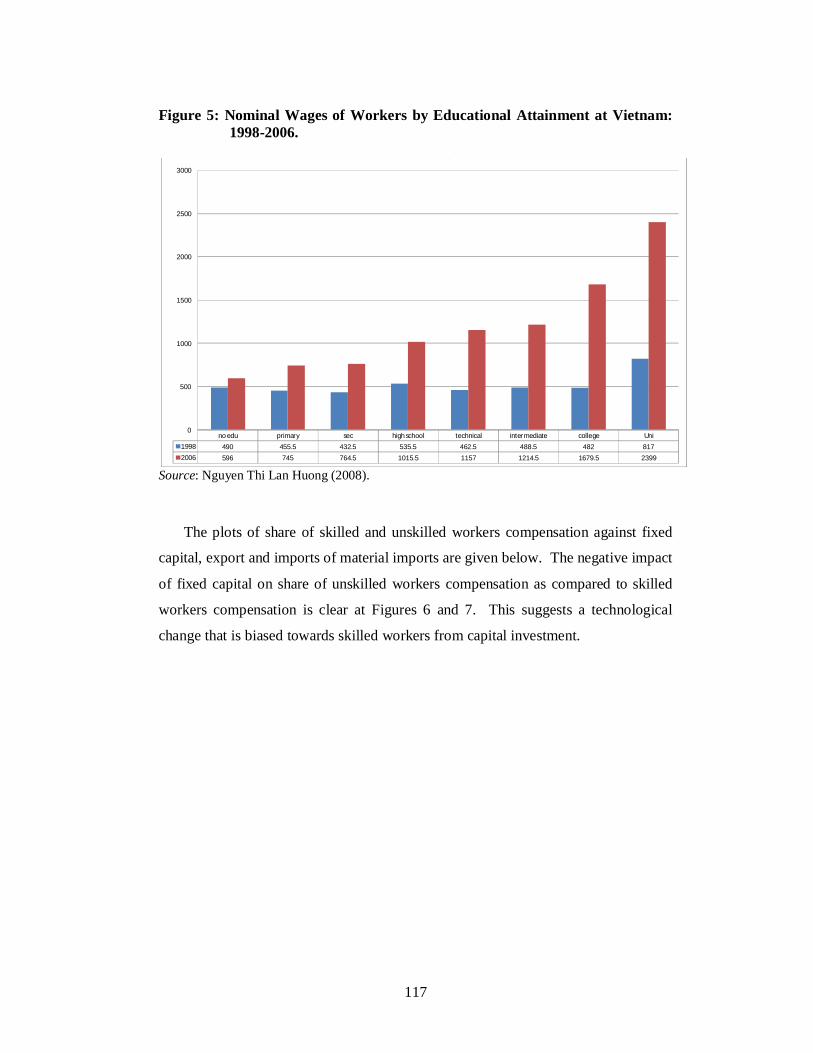
clientele and customer relationships. The nominal wages of workers by educational
attainment from 1998 to 2006 is given at Figure 5. It is clear that wages of the educated
workers have increased significantly for the Vietnamese workers, where the tertiary
and higher educated workers experienced nearly average annual wage increase of 16%
from 1998 to 2006. In contrast, the annual average wages of primary and secondary
and high school is increasing at 5% and 6.5% from 1998 to 2006. This clearly indicates
that the demand for skilled and educated workers is rising over the years and the wage
gap between the skilled and unskilled workers are widening.
117
Figure 5: Nominal Wages of Workers by Educational Attainment at Vietnam: 1998-2006.
Source: Nguyen Thi Lan Huong (2008).
The plots of share of skilled and unskilled workers compensation against fixed
capital, export and imports of material imports are given below. The negative impact
of fixed capital on share of unskilled workers compensation as compared to skilled
workers compensation is clear at Figures 6 and 7. This suggests a technological
change that is biased towards skilled workers from capital investment.
no edu primary sec high school technical intermediate college Uni
1998 490 455.5 432.5 535.5 462.5 488.5 482 817
2006 596 745 764.5 1015.5 1157 1214.5 1679.5 2399
0
500
1000
1500
2000
2500
3000
1998-2006

118
Figure 6: Share of Unskilled Compensation to Fixed Capital
Figure 7: Share of Skilled Workers Compensation to Fixed Capital
0
2
4
6
8
10
12
14
16
18
20
0 0.1 0.2 0.3 0.4 0.5 0.6 0.7 0.8 0.9 1
Ln C
apit
al
Share of Unskilled Workers Compensation
Figure 6: Share of Unskilled Compensation to Fixed Capital
0
2
4
6
8
10
12
14
16
18
20
0 0.1 0.2 0.3 0.4 0.5 0.6 0.7 0.8 0.9 1
Ln C
api
tal
Share of Skilled Workers Compensation
Figure 7:Share of Skilled Workers Compensation to Fixed Captial
119
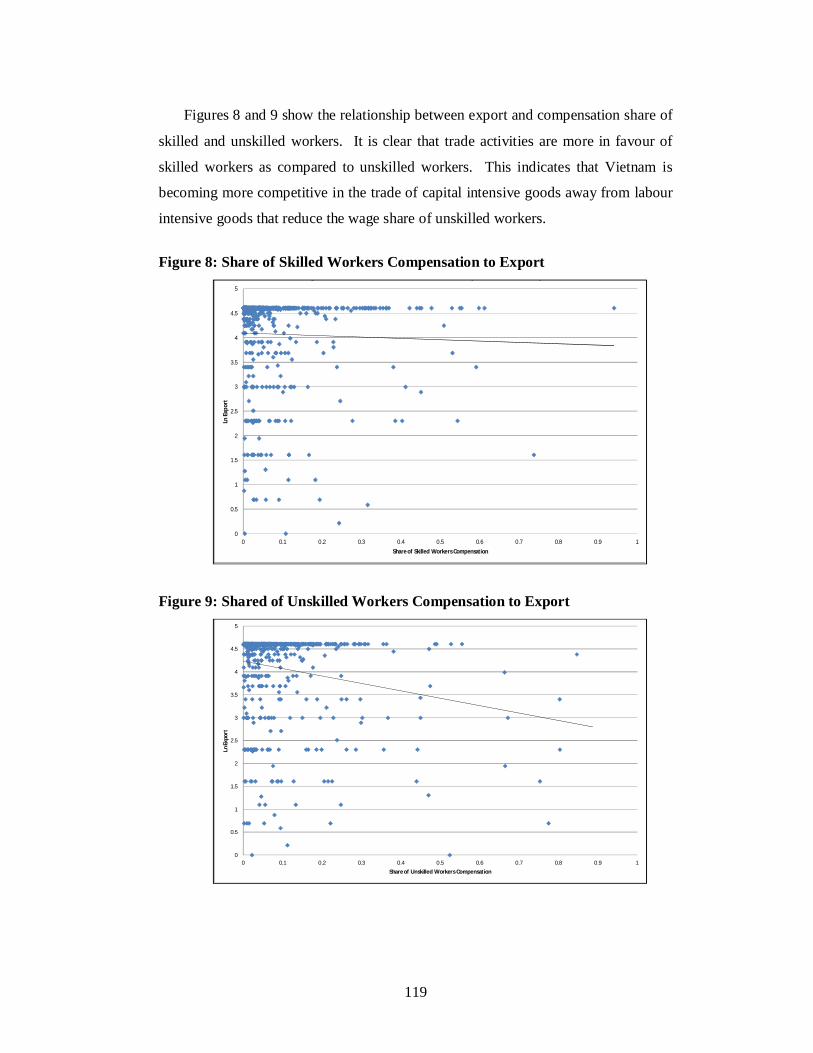
Figures 8 and 9 show the relationship between export and compensation share of
skilled and unskilled workers. It is clear that trade activities are more in favour of
skilled workers as compared to unskilled workers. This indicates that Vietnam is
becoming more competitive in the trade of capital intensive goods away from labour
intensive goods that reduce the wage share of unskilled workers.
Figure 8: Share of Skilled Workers Compensation to Export
Figure 9: Shared of Unskilled Workers Compensation to Export
0
0.5
1
1.5
2
2.5
3
3.5
4
4.5
5
0 0.1 0.2 0.3 0.4 0.5 0.6 0.7 0.8 0.9 1
Ln E
xpo
rt
Share of Skilled Workers Compensation
Figure 7: Share of Skilled Workers Compensation to Export
0
0.5
1
1.5
2
2.5
3
3.5
4
4.5
5
0 0.1 0.2 0.3 0.4 0.5 0.6 0.7 0.8 0.9 1
Ln
Ex
po
rt
Share of Unskilled Workers Compensation
120
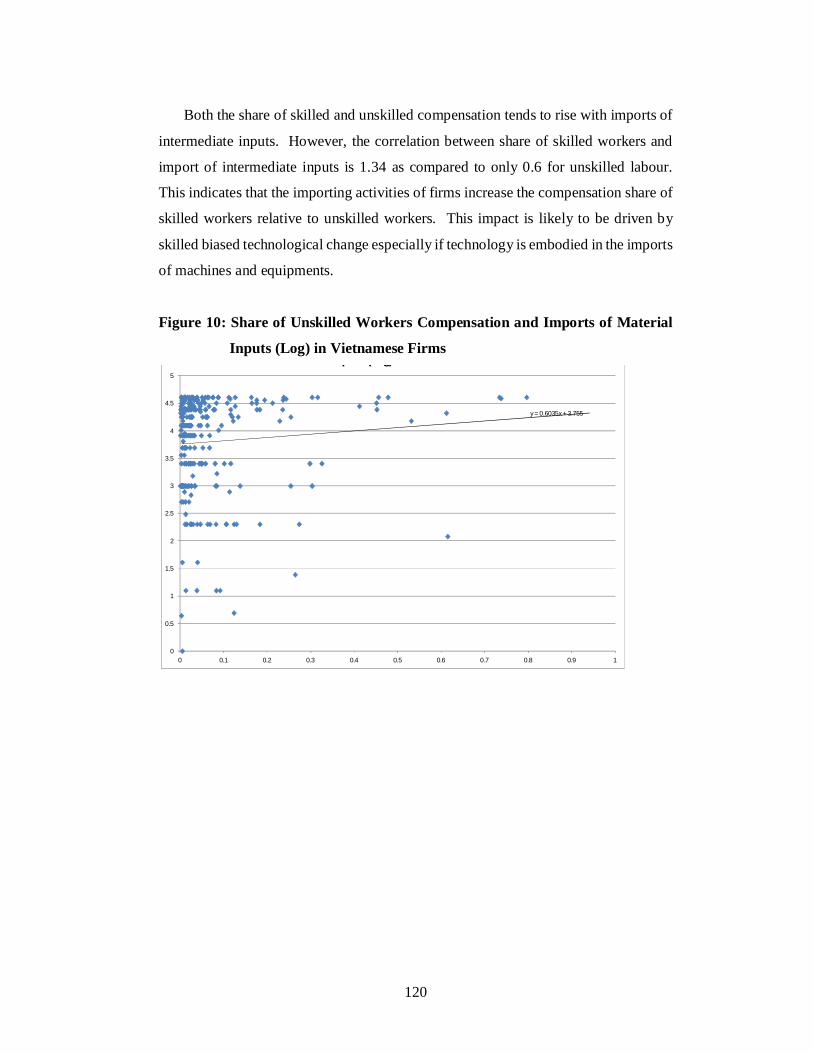
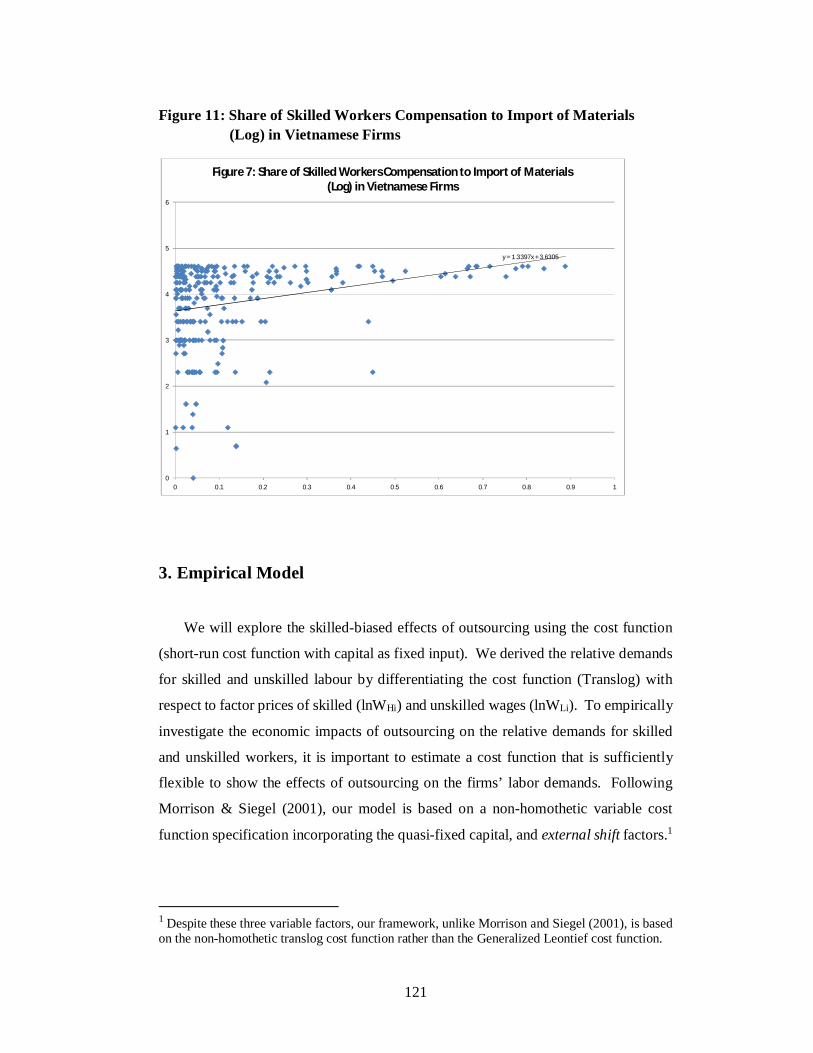
Both the share of skilled and unskilled compensation tends to rise with imports of
intermediate inputs. However, the correlation between share of skilled workers and
import of intermediate inputs is 1.34 as compared to only 0.6 for unskilled labour.
This indicates that the importing activities of firms increase the compensation share of
skilled workers relative to unskilled workers. This impact is likely to be driven by
skilled biased technological change especially if technology is embodied in the imports
of machines and equipments.
Figure 10: Share of Unskilled Workers Compensation and Imports of Material
Inputs (Log) in Vietnamese Firms
y = 0.6035x + 3.755
0
0.5
1
1.5
2
2.5
3
3.5
4
4.5
5
0 0.1 0.2 0.3 0.4 0.5 0.6 0.7 0.8 0.9 1
Material Inputs (Log) in Vietnamese Firms
121
Figure 11: Share of Skilled Workers Compensation to Import of Materials
(Log) in Vietnamese Firms
3. Empirical Model
We will explore the skilled-biased effects of outsourcing using the cost function
(short-run cost function with capital as fixed input). We derived the relative demands
for skilled and unskilled labour by differentiating the cost function (Translog) with
respect to factor prices of skilled (lnWHi) and unskilled wages (lnWLi). To empirically
investigate the economic impacts of outsourcing on the relative demands for skilled
and unskilled workers, it is important to estimate a cost function that is sufficiently
flexible to show the effects of outsourcing on the firms’ labor demands. Following
Morrison & Siegel (2001), our model is based on a non-homothetic variable cost
function specification incorporating the quasi-fixed capital, and external shift factors.1
1
Despite these three variable factors, our framework, unlike Morrison and Siegel (2001), is based on the non-homothetic translog cost function rather than the Generalized Leontief cost function.
y = 1.3397x + 3.6305
0
1
2
3
4
5
6
0 0.1 0.2 0.3 0.4 0.5 0.6 0.7 0.8 0.9 1
Figure 7: Share of Skilled Workers Compensation to Import of Materials (Log) in Vietnamese Firms

122
For a given industry i, where i = 1,…, N, the short-run (dual) cost function can be
expressed in an implicit form as:
),,,(ii
Twiii
YKGG = (1)
where is a vector of variable input prices, including unskilled workers, skilled
workers, and raw materials; iK is quasi-fixed capital stock; i
Y is output; and iT is a
vector of external trade and technological factors, including the indexes of material
and service outsourcing. Therefore, the short-run total cost function is equal to
iKiiiKwYKGC += ),,,(
iiTw , where Kw is the price of capital stock.
Following Berman, et al. (1994), by assuming that capital is a quasi-fixed factor,
we will employ the non-homothetic translog functional form of a variable cost function.
By assuming symmetry such that jiijγγ = , jiij
φφ = , and jiijδδ = and temporarily
dropping the time and industry subscripts, the cost function is given as:
MHHMLHHLMMHHLLwwwwwwwG lnlnlnln)ln()ln()ln(ln
0γγαααα +++++=
Kwwwww KMMMLLLHHHMLLM ln)(ln2
1)(ln
2
1)(ln
2
1lnln 222 βγγγγ +++++
YKKwKwKw YKKMMKHHKLLK ln)(ln2
1lnlnlnlnlnln 2 βδφφφ +++++
2)(ln2
1lnlnlnlnlnlnlnln YYKYwYwYw YYKYMMYHHYLLY δδφφφ +++++
OKOwOwOwO KoMMoHHoLLoo lnlnlnlnlnlnlnlnln δφφφβ +++++
TwTwTOOY HHTLLTTooYo lnlnlnlnln)(ln2
1lnln 2 φφβδδ +++++
2)(ln2
1lnlnlnlnlnlnlnln TTOTYTKTw TToTYTKTMMT δδδδφ +++++ (2)
where O is the indexes of outsourcing, and T is the index of technological progress.
For a well defined cost function, it must satisfy the condition of linear homogeneity in
iw
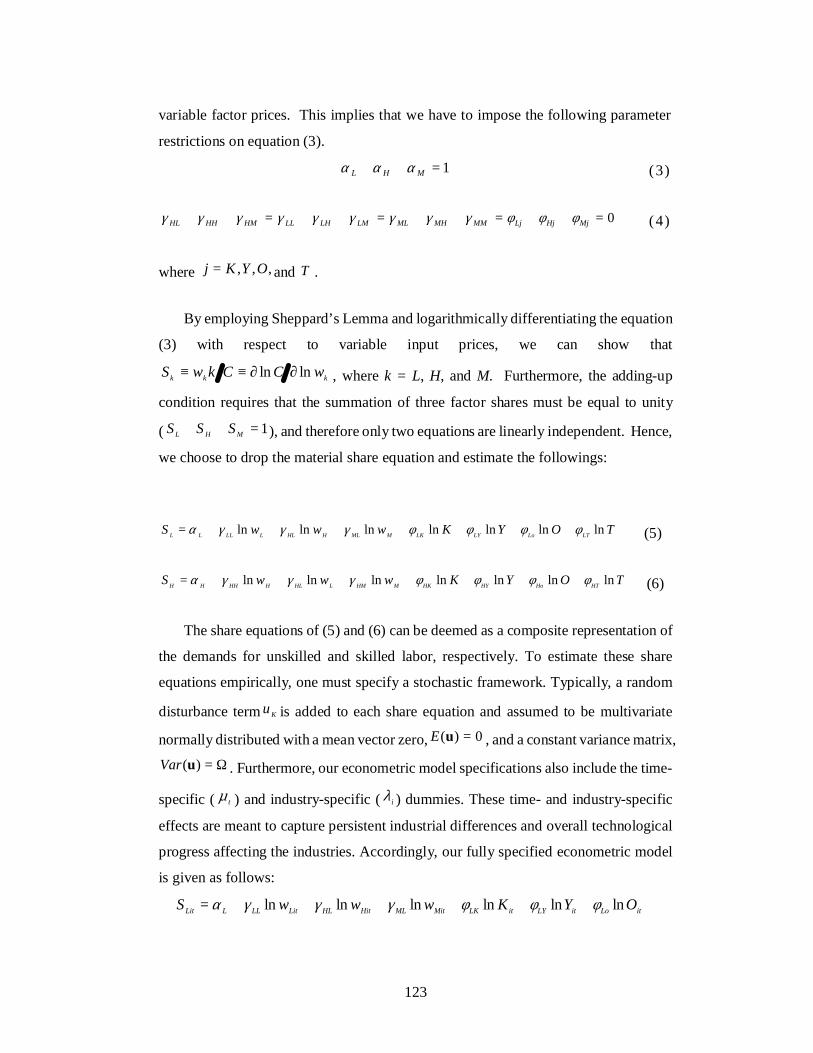
123
variable factor prices. This implies that we have to impose the following parameter
restrictions on equation (3).
1=++ MHL ααα (3)
0=++=++=++=++ MjHjLjMMMHMLLMLHLLHMHHHL φφφγγγγγγγγγ (4)
where ,,, OYKj = and T .
By employing Sheppard’s Lemma and logarithmically differentiating the equation
(3) with respect to variable input prices, we can show that
kkkwCCkwS lnln ∂∂≡≡ , where k = L, H, and M. Furthermore, the adding-up
condition requires that the summation of three factor shares must be equal to unity
( 1=++ MHL SSS ), and therefore only two equations are linearly independent. Hence,
we choose to drop the material share equation and estimate the followings:
TOYKwwwSLTLoLYLKMMLHHLLLLLL
lnlnlnlnlnlnln φφφφγγγα +++++++= (5)
TOYKwwwSHTHoHYHKMHMLHLHHHHH
lnlnlnlnlnlnln φφφφγγγα +++++++= (6)
The share equations of (5) and (6) can be deemed as a composite representation of
the demands for unskilled and skilled labor, respectively. To estimate these share
equations empirically, one must specify a stochastic framework. Typically, a random
disturbance term Ku is added to each share equation and assumed to be multivariate
normally distributed with a mean vector zero, 0)( =uE , and a constant variance matrix,
Ω=)(uVar . Furthermore, our econometric model specifications also include the time-
specific ( tµ ) and industry-specific ( iλ ) dummies. These time- and industry-specific
effects are meant to capture persistent industrial differences and overall technological
progress affecting the industries. Accordingly, our fully specified econometric model
is given as follows:
itLoitLYitLKMitMLHitHLLitLLLLit OYKwwwS lnlnlnlnlnln φφφγγγα ++++++=

124
LitititLT uT ++++ λµφ ln (5A)
itHoitHYitHKMitHMLitHLHitHHHHit OYKwwwS lnlnlnlnlnln φφφγγγα ++++++=
HitititLTuT ++++ λµφ ln (6B)
One attractive feature of the non-homothetic translog functional form of the dual
cost equation (2) is that it does not impose any restrictions on the elasticities of
substitution between two variable inputs in priori. It may also be interesting to
investigate the impacts of outsourcing on substitution among unskilled labor, skilled
labor, and raw materials.
In the above analysis we have three variable inputs: skilled, unskilled and material
inputs. For the adding-up condition to hold, the summation of shares of the factor
inputs should add to unity. To account for the adding-up condition, we dropped the
share of material inputs and estimated only the labour share equations given above.
We introduced dummies for technology adoption, number of branches and foreign
ownership, respectively. They take the value of unity if a firm adopts new technology,
has at least one branch, and is foreign-owned; and nil otherwise.
The data for the estimation is from Annual Statistical Censuses & Surveys:
Enterprises, gathered by General Statistics Office of Vietnam. It provides firm-level
information on foreign ownership and production characteristics, like the number of
workers, gross revenue, working capital, materials, profits, level of export and import.
However, the survey does not provide any information on the wages of workers by
occupation. We also obtained wage data from the World Bank Business Survey at the
occupational level to derive the wages for the skilled and unskilled workers. Since
wage data is only available for 2006, we are only able to implement the model for
2006. As with other studies (Amiti & Wei, 2009: Chongvilaivan & Thangavelu, 2012),
we define the imports of intermediate inputs as:
∑=j
iiindustrybyusedinputsermediateinttotal
iindustrybyjinputermediateintimportedOM .
125
The skilled labour share ( HS ) is measured by the ratio of the non-production wage
bill to total cost as in Feenstra & Hanson (1996 and 1999). Likewise, production
workers represent unskilled labour. By definition, non-production workers are those
who are engaged in factory supervision, executives, financing, legal, professional and
technical services, whereas production workers are those who are engaged in
assembling, packaging, inspecting, repair and maintenance. Therefore, non-
production and production workers are conventionally acknowledged as promising
candidates of proxies for skilled and unskilled workers, respectively. Since wage data
by occupation is not available in the survey, we derived the occupation wage data by
industry from the World Bank Business Survey. This information is matched to
workers at the industry to derive the weighted wages for the skilled ( Hw ) and unskilled
( Lw ). Furthermore, capital stock ( K ) is measured by the values of land, building and
construction, and machinery and equipment at the end of each consecutive year,
whereas total output (Y ) is proxied by the total sales of goods produced.

126
Figure 12: Share of Unskilled and Skilled Labour in Vietnamese Manufacturing Sector
The share of skilled and unskilled compensation to total cost is given at Figure 9.
As expected the share of skilled compensation to total cost is much higher for both
domestic and foreign firms relative to the share of the unskilled compensation. We
also observed that the share of skilled compensation is much higher for the foreign
firms as compared to local firms suggesting that allowing more foreign firms tends to
push the wages of skilled workers higher. It is likely that the foreign workers work
with more advance technology that complements the skilled workers and hence
increase the demand and wages for skilled workers.
Two issues should be highlighted. First, since we have three variable factors of
production, it follows that the summation of the three factor shares must be unity; that
is, the adding-up condition must be satisfied: ∑ =++=k
MLHk SSSS 1 . This
condition requires us to drop one out of three equations from the system estimation to
make it linearly independent. In doing so, we choose to drop the material share
equation and estimate only the labour share equations. In light of this, we employ the
two-step Iterative Seemingly Unrelated Regression (ISUR) to estimate the labour
share equations (5A and 6A). The major advantage of ISUR is that the ISUR estimates
are invariant to the choices of factor share equations dropped.
0
0.02
0.04
0.06
0.08
0.1
0.12
0.14
Total Domestic Foreign
Share of Unskilled Workers to Total Cost
Share of Skilled Workers to Total Cost

127
4. Empirical Results
Table 3 portrays the ISUR estimates of (5A and 6A) with the perturbed
specifications. We also undertook 3SLS-SURE estimation to address any endogeniety
issues in the estimation. The results for the 3SLS-SURE are given at Table 4. We
find that our estimates are robust with respect to the inclusion of the trade and
technology variables for ISUR and 3SLS-SURE.
Table 3: Impact of Technology and Trade on Skilled and Unskilled Labour in Vietnamese Firms (ISUR).
Share of Skilled Wages Share of Unskilled Wages 1 2 3 1 2 3 Log(Skilled wages/Price of Materials)
0.006 (0.008)
0.011 (0.007)
-0.011 (0.013)
0.004 (0.007)
-0.0004 (0.007)
0.012 (0.011)
Log(Unskilled wages/Price of Materials)
0.004 (0.007)
-0.0004 (0.007)
0.012 (0.011)
0.011 (0.007)
0.0149** (0.007)
0.001 (0.012)
Log of Material Imports
- - 0.037** (0.010)
- - 0.009 (0.008)
Log(Capital) 0.199*** (0.046)
0.2004*** (0.043)
0.189** (0.073)
0.201*** (0.040)
0.151*** (0.041)
0.192** (0.053)
Log of Export - 0.112** (0.039)
- - -0.139*** (0.037)
-
Adopted Technology Dummy
0.007 (0.107)
0.010 (0.009)
0.024 (0.020)
-0.0008 (0.009)
-0.0009 (0.009)
-0.009 (0.014)
Branches Dummy
-0.033* (0.017)
0.002 (0.015)
-0.051* (0.027)
0.0029 (0.015)
-0.010 (0.015)
-0.0007 (0.020)
Foreign Owned
-0.0001 (0.002)
-0.0004 (0.002)
-0.0003 (0.002)
-0.001 (0.001)
-0.0012 (0.0023)
-0.0008 (0.002)
Constant -0.696 (0.051)
-0.070 (0.044)
-0.181** (0.087)
-0.117** (0.044)
-0.1222** (0.042)
-0.156** (0.063)
Industry Dummies
Yes Yes Yes Yes Yes Yes
Observations 623 535 535 623 535 535 R-Square 0.074 0.089 0.118 0.116 0.166 0.121
Notes: * 10 percent level of statistical significance, ** 5 percent level of statistical significance,
*** 1 percent level of statistical significance. The parenthesis indicates standard
errors.
Source: Authors’ compilation.

128
Table 4: Impact of Technology and Trade on Skilled and Unskilled Labour in
Vietnamese Firms (3SLS- SURE).
Share of Skilled Wages Share of Unskilled Wages 1 2 3 1 2 3 Log(Skilled wages/Price of Materials)
0.005 (0.007)
0.014 (0.008)
-0.012 (0.013)
0.004 (0.008)
-0.0002 (0.007)
0.012 (0.012)
Log(Unskilled wages/Price of Materials)
0.004 (0.007)
-0.0002 (0.007)
0.012 (0.011)
0.011 (0.008)
0.0143** (0.007)
0.004 (0.013)
Log of Material Imports
- - 0.012** (0.012)
- - 0.008 (0.007)
Log(Capital) 0.176*** (0.048)
0.198*** (0.044)
0.167** (0.074)
0.200*** (0.042)
0.150*** (0.042)
0.190** (0.054)
Log of Export - 0.115** (0.040)
- - -0.138*** (0.038)
-
Adopted Technology Dummy
0.007 (0.018)
0.010 (0.009)
0.024 (0.020)
-0.0008 (0.009)
-0.0009 (0.010)
-0.008 (0.015)
Branches Dummy
-0.034* (0.018)
0.002 (0.016)
-0.055* (0.028)
0.0029 (0.015)
-0.010 (0.015)
-0.0005 (0.020)
Foreign Owned
-0.0001 (0.003)
-0.0004 (0.002)
-0.0003 (0.002)
-0.001 (0.001)
-0.0011 (0.002)
-0.0008 (0.002)
Constant -0.047 (0.053)
-0.067 (0.044)
-0.151** (0.088)
-0.116** (0.045)
-0.119** (0.049)
-0.153** (0.065)
Industry Dummies
Yes Yes Yes Yes Yes Yes
Observations 623 535 535 623 535 535 R-Square 0.070 0.094 0.112 0.120 0.167 0.117
Notes: * 10 percent level of statistical significance, ** 5 percent level of statistical significance,
*** 1 percent level of statistical significance. The parenthesis indicates standard
errors.
Source: Authors’ compilation.
We observed very interesting results from Tables 3 and 4. The results are robust
and consistent for both ISUR and 3SLS-SURE. We observe technological changes in
the Vietnamese firms (statistically significant) and it tends to be neutral in terms of
increasing both the skilled and unskilled wage shares. This suggests that technological
changes are neutral and it is not the key factor for the widening wage gap observed in
the Vietnamese economy. Nevertheless, this result is not surprising as capital
accumulation like automated machineries; computers and equipments typically require
skilled workers to work with. As the Vietnamese firms are moving towards
industrialization through high-tech capital investment, one would expect the

129
complimentary effect whereby building up capital escalates the demand for skilled
workers and thus wage inequality between skilled and unskilled workers.
The results based on trade variables of export and import is very interesting. The
import of intermediate inputs increase the skilled wage share and it is statistically
significant. In contrast, the impact of import of intermediate inputs is not statistically
significance. This is intuitive as technology is embodied in imports of machines and
equipments that complements and increase the returns for skilled workers. This
complementary effects increase the demand for skilled workers.
The impact of export on wage share of skilled and unskilled workers indicates that
it increase the demand for skilled workers relative to unskilled workers. The
coefficient of export is positive and statistically significant for the wage share of
skilled workers. The results clearly indicates that trade tend to increase the returns for
skilled workers as both import and export tend to have positive impact on wage share
of skilled workers.
The Vietnamese firms with branches tend to employ less skilled workers than do
those without branches. The coefficient of the branches dummy is negative and
statistically significant at the 5 percent level. This evidence may be explained by the
fact that skill-intensive activities like research and development (R&D) and product
design are typically subject to knowledge spillovers, and therefore the Vietnamese
firms strategically retain them within a single location.
Lastly, we find only weak evidence that foreign-owned firms tend to employ more
skilled workers than local firms. Even though the coefficients of the foreign ownership
dummy are positive and negative in the skilled and unskilled share equations
respectively, both are statistically insignificant.
5. Policy Conclusion
In this study we explore impact of trade and in particular the effects of
international activities among Vietnamese firms. The results indicate that firms that
adopt new technologies and restructure their organization are likely to move part of
their activities to more value-added and skill based. This restructuring activities

130
increase the wage gap between the skilled and unskilled workers due to the increase in
demand for skilled workers.
We also observe that firms that are part of the production networks and value-
chain are likely to undertake more restructuring and international activities. As
Vietnam liberalises and integrates with the ASEAN community, we should expect
more international activities among Vietnamese firms.
The implications of economic liberalisation to foreign investment and competition
are that it is likely to increase restructuring activities in the domestic firms. It is clear
from our results that trade related activities are skill-biased towards the skilled workers,
thereby increasing their demand and wages. Thus, we are likely to see a more
widening wage gap between skilled and unskilled workers in the Vietnamese economy.
This has implications for Vietnam in terms of increasing skills and human capital of
workers and reducing any job mismatch that might emanate from the economic
restructuring in the economy.
Several key challenges still exist in Vietnam. Firstly, there is still rent-seeking in
the Vietnamese economy and this is likely to create inefficiencies in the economy. The
importance of transparency and protection of property rights are important for
conducting business in the country. Thus, the flow of foreign investment is slow-
moving, and there are concerns that the government’s economic reform has been
sluggish.
The other challenge for Vietnam is the inadequate investment in public
infrastructure such as IT and telecommunications. The IT and telecommunication
industry is heavily regulated by the government, and there are restrictions on foreign
ownership. Greater economic liberalisation of this sector is expected to increase the
competitive and efficiency of the domestic sector.
There are several important policy implications from the study. If the
manufacturing activities in Vietnam are moving to more capital- and technology-
intensive activities, the impact of globalization will have important implications on the
rising wage inequality and also on the skilled developments in the economy.
Our results indicate that there are negative effects on unskilled workers, and thus
the government has an important role in managing the negative effects without
sacrificing the positive effects from trade and globalization. This clearly reflects
131
domestic human capital development as a key component of growth in an open
economy to globalisation. The training and upgrading of skills programmes will be
crucial to move unskilled workers to more productive sectors in the economy. The
improvement and upgrading of the education and innovation systems in Vietnam’s
economy will be important factors to augment the potential benefits of globalization.
The government should focus on retraining of the unskilled workers as they are
displaced from technological changes and globalization. As new jobs are created from
structural changes, it is important to train and move workers to the competitive
industries. Thus, the government could consider policies to continuing education such
as Industrial Education for working population to upgrade their skills and remain
relevant in the labour market.
The importance of domestic capacity building and linkages will be crucial to
increase the technological development and innovation capabilities of domestic
economy. In particular, the next phase of development for Vietnam will be based on
how well they are able to harness the development of local human capital and domestic
enterprises.
References
Acemoglu, D. (2002), ‘Technical Change, Inequality and the Labor Market’, Journal of Economic Literature 40, pp.7-72.
Acemoglu, D. and D. H. Autor (2011), ‘Skills, Tasks and Technologies: Implications for Employment and Earnings’, in Ashenfelter, O. and D. Card, (eds.) Handbook of Labor Economics, Vol. 4B, Amsterdam: North Holland.
Ahn S., K. Fukao, and K. Ito (2008), ‘Outsourcing in East Asia and Its Impact on the Japanese and Korean Labor Markets’, OECD Trade Policy Working Papers, No. 65, Paris: OECD.
Amiti, M. and S. Wei. (2009), ‘Services Offshoring and Productivity: Evidence from the United States’, The World Economy, Blackwell Publishing, 32(2), pp.203-220.
Anderton, B. and P. Brenton, (1999), ‘Outsourcing and Low-skilled Workers in the UK’, Bulletin of Economic Research; 51(4), pp.267-285.
Arndt, S. W. and H. Kierzkowski (2001), ‘Fragmentation: New Production Patterns in the World Economy’, Oxford: Oxford University Press.

132
Autor, D., L. Katz and A. Krueger (1998), ‘Computing Inequality: Have Computers Changed the Labor Market?’, Quarterly Journal of Economics 113, pp.1169-1213.
Autor, D. H., F. Levy, and R. J. Murnane (2003), ‘The Skill Content of Recent Technological Change: An Empirical Exploration’, Quarterly Journal of Economics, 116, pp.1279-1334.
Card, D. and J. E. DiNardo (2002), ‘Skill Biased Technological Change and Rising Wage Inequality: Some Problems and Puzzles’, Journal of Labour Economics, 20(4), pp.733-783.
Chongvilaivan, A. and S. M. Thangavelu (2012), ‘Does Outsourcing Provision leads to Wage Inequality? New Evidence from Thailand’s Establishment-Level Data’, Review of International Economics, 20, pp. 364-376.
Christensen, L. R., D. W. Jorgenson and L. J. Lau(1973), ‘Transcendental Logarithmic Production Frontiers’, Review of Economics and Statistics 55(1), pp.28-45.
Dell’mour, R., P. Egger, K. Gugler, and M. Pfaffermayr (1990), ‘Outsourcing of Austrian Manufacturing to Eastern European Countries: Effects on Productivity and the Labor Market’, in Arndt, S., H. Handler, and D. Salvatore (eds.), Fragmentation of the Value-Added Chain. Vienna: Austrian Ministry for Economic Affairs and Labour, pp. 249-302.
Egger, H. and P. Egger (2004), ‘International Outsourcing and the Productivity of Low-skilled Labor in the EU’, Economic Inquiry 44(1), pp.98-108.
Feenstra, R. C. and G. H. Hanson (1996), ‘Foreign Direct Investment, Outsourcing, and Relative Wages’, in Feenstra, R. C., G. M. Grossman, and D. A. Irwin (eds.), The Political Economy of Trade Policy: Papers in Honor of Jagdish Bhagwati, Cambridge: MIT Press, pp. 89-127.
Feenstra, R. C. and G. H. Hanson (1997), ‘Productivity Measurement and the Impact of Trade and Technology on Wages: Estimates for the U.S., 1972-1990’, NBER Working Paper, No. 6052.
Feenstra, R. C. and G. H. Hanson (1999), ‘The Impact of Outsourcing and High-technology Capital on Wages: Estimates for the United States, 1979-1990’, Quarterly Journal of Economics 114(3), pp. 907-940.
Geishecker, I. (2002), ‘Outsourcing and the Relative Demand for Low-skilled Labour in German Manufacturing: New Evidence’, Discussion Paper No. 313, DIW-Berlin: German Institute for Economic Research.
Geishecker, I. and H. Görg (2008), ‘Winners and Losers: A Micro-level Analysis of International Outsourcing and Wages’, Canadian Journal of Economics 41(1), pp. 243-270.
Girma, S. and H. Görg (2004), ‘Outsourcing, Foreign Ownership, and Productivity: Evidence from UK Establishment-level Data’, Review of International Economics, 12(5), pp. 817-832.
Greene, W. H. (2003), Econometric Analysis. 5th edition; New Jersey: Pearson Education.

133
Hanson, G. H. and A. E. Harrison, (1999), ‘Trade, Technology, and Wage Inequality in Mexico’, Industrial and Labor Relation Review 52(2), pp.271-288.
Hijzen, A. (2007), ‘International Outsourcing, Technological Change, and Wage Inequality’, Review of International Economics 15(1), pp.188-205.
Hijzen, A., H. Görg, and R. C. Hine (2005), ‘International Outsourcing and the Skill Structure of Labour Demand in the United Kingdom’, Economic Journal 115(506), pp.860-878.
Holmes, T. J. (1999), ‘Localization of Industry and Vertical Disintegration’, Review of Economics and Statistics 81(2), pp. 314-325.
Hsieh, C. and K. T. Woo (2005), ‘The Impact of Outsourcing to China on Hong Kong’s Labor Market’, American Economic Review 95(5), pp.1673-1687.
Morrison, C. J. Paul and D. S. Siegel (2001), ‘The Impacts of Technology, Trade, and Outsourcing on Employment and Labor Composition’, Scandinavian Journal of Economics, 103(20, pp. 241-264.
Mundlak, Y. (1996), ‘Production Function Estimation: Reviving the Primal’, Econometrica, 64(2), pp.431-438.
Olsen, K. B. (2006), ‘Productivity Impacts of Offshoring and Outsourcing: A Review’, STI Working Paper 2006, Paris: OECD.
Paisittanand, S. and D. L. Olson (2006), ‘A Simulation Study of IT Outsourcing in the Credit Card Business’, European Journal of Operation Research, 175(2), pp. 1248-1261.
Slaughter, M. J. (1995), ‘Multinational Corporations, Outsourcing, and American Wage Divergence’, NBER Working Paper, No. 5253, Cambridge: NBER.
Thangavelu, S. M. and A. Chongvilaivan, (2011), ‘Impacts of Outsourcing on Employment and Labour Substitution: New Firm level Evidence from Manufacturing Industries in Thailand’, Applied Economics, 43(27), pp. 3931-3944.
World Bank (2012), ‘Vietnam Development Report 2012: Market Economy for Middle Income Vietnam’, Joint Donor Report to the Vietnam Consultative Group Meeting, December 2011.
Vu, Khuong M., (2012), ‘Challenges to Vietnam’s Long-term Economic Growth: From Symptomatic Problems to Institutional Root Cause’, LKY Public Policy School, Singapore: NUS.