chapter 5.2 water quality improvement - sawpa
TRANSCRIPT

Chapter 5.2 Water Quality ImprovementIntroduction This chapter presents a general overview of water quality issues in the Santa Ana River Watershed and programs to improve water quality. The three focus areas of this chapter, surface water, groundwater, and ocean water quality, are described from the top of the Watershed downstream to the ocean. This discussion includes the significant impact of imported water supplies and stormwater runoff on water quality.
Surface water discharges to the ocean impact ocean water quality. Ocean water, defined as the zone from the beach to three miles offshore, and bays and estuaries near the coast, are included in this report, reflecting the comprehensive, integrated approach utilized in the development of the new Integrated Regional Water Management Plan (IRWMP).
This chapter also includes coastal watersheds such as Anaheim Bay‐Huntington Harbor, Newport Bay, and Newport Coastal streams as well as Coyote Creek and Carbon Creek in the San Gabriel River Watershed in the northern part of the Watershed. Although outside the Santa Ana River Watershed boundaries, these areas are within the jurisdiction of the Santa Ana Regional Water Quality Control Board (Region 8).
Brief History of Santa Ana River Watershed The Santa Ana River (SAR), its tributary streams, and the groundwater basins provided adequate water for early inhabitants of the Watershed. By the late nineteenth century, the region had developed a successful agricultural economy. By the early twentieth century, expanding farms and orchards along with increased population began to outgrow available water supplies. The Colorado River Aqueduct (CRA) was the first facility to bring imported water into the region, followed by the State Water Project (SWP).
By the time of passage of the California Porter‐Cologne Water Quality Act in 1969, population growth, agriculture, and industry already had created a legacy of water quality problems. Agricultural irrigation, fertilizer use, and dairy operations added nutrients and salts to groundwater supplies. Use of pesticides contributed to the contamination of soils and groundwater. In some areas, chemicals used in military facilities and industrial processes were improperly disposed of, resulting in the migration of hazardous substances into groundwater. Impacts from urbanization of the Watershed included stormwater runoff from urban areas, non‐storm nuisance flows from landscape irrigation, increased salt concentrations, and elevated levels of nutrients.
Local agencies, non‐governmental organizations, and other stakeholders, with the support of regulatory agencies, have made progress in restoring the quality of water in the Watershed. Challenges still remain.
182
Regulatory Framework Drinking Water Regulations The California Safe Drinking Water Act (Health and Safety Code, Section 116270 et seq.) directs the California Department of Public Health (CDPH) Division of Drinking Water and Environmental Management to set standards for drinking water quality. Drinking water regulations are addressed in Title 17 and Title 22 of the California Code of Regulations. These include establishing the Maximum Contaminant Limits (MCLs) and treatment requirements for potable water and recycled water.
Water Quality Control Plan, Santa Ana River Basin The State Water Resources Control Board (SWRCB) and the Santa Ana Regional Water Quality Control Board (Regional Board) are responsible for implementing California’s Porter‐Cologne Water Quality Control Act and the Federal Clean Water Act. These State and Federal laws, and associated regulations and policies, provide the overall framework for managing water quality. Extensive voluntary efforts of stakeholders play an important role in protecting and improving water quality in the Watershed.
The Water Quality Control Plan, Santa Ana River Basin (Basin Plan) guides the Regional Board’s water quality control programs, water quality management decisions, and enforcement efforts. The Basin Plan establishes water quality standards, which include beneficial uses, water quality objectives (WQOs), and implementation plans to achieve the standards.
Beneficial uses include human uses, such as municipal water supply and agricultural supply, as well as environmental uses such as wildlife habitat. WQOs are set to establish reasonable protection of the beneficial uses. WQOs and beneficial uses are specified according to water body type: ocean waters, enclosed bays and estuaries, inland surface waters, and groundwater.
Since its last major revision in 1995, the Basin Plan has been amended eleven times. Amendments added Total Maximum Daily Loads (TMDLs) in 1998, 1999, 2003, 2004, 2005 and 2006; made provisions for and included time schedules in waste discharge requirements (2000); revised bacterial objectives in ocean waters (1997); and incorporated a revised Nitrogen/Total Dissolved Solids (N/TDS) management plan (2004). To implement the N/TDS plan, stakeholders and the Regional Board formed the Basin Monitoring Task Force. The Task Force is developing and implementing a monitoring program for nitrate and TDS in both groundwater and surface water in the Watershed.
Basin Plan amendments are adopted through a public basin planning process. The process requires approval by the Regional Board, SWRCB, California Office of Administrative Law, and United States Environmental Protection Agency (U.S. EPA). The Regional Board establishes priorities for Basin Plan revisions approximately every three years; the latest of these triennial reviews was conducted in 2006.
183

The primary methods of enforcing water quality regulations are through the issuance of the (Federal) National Pollutant Discharge Elimination System (NPDES) Permits and State Waste Discharge Requirements (WDRs). In California, both permit programs are administered by the SWRCB and the Regional Boards. These permits regulate discharges to surface water bodies of both wastewater and urban runoff from municipal and industrial systems and stormwater runoff from municipal separate storm sewer systems, industrial sources, and construction sites. Permit requirements are based on technology‐based limits for wastewater and maximum extent practicable (MEP) standard for stormwater intended to meet water quality standards.
Total Maximum Daily Loads The Federal Clean Water Act Section 303(d) requires states to identify as impaired those waters that do not or are not expected to meet water quality standards. Impaired water bodies are placed on the Clean Water Act Section 303(d) List of Water Quality Limited Segments which initiates a process to develop TMDLs. A TMDL is considered to be adopted when approved by the Regional Board, the SWRCB, the California Office of Administrative Law, and the U.S. EPA.
A TMDL defines how much of a pollutant a water body can tolerate and still meet water quality standards. Each TMDL must account for all sources of the pollutant, including: discharges from wastewater treatment facilities; non‐point source pollutants in runoff from residential areas, forested lands, agriculture, streets or highways, etc.; soils/sediments polluted with legacy contaminants such as DDT and PCBs; on‐site disposal systems (septic systems); and deposits from the air. Projected growth that could increase pollutant levels may be considered. TMDLs allocate allowable pollutant loads for each source and identify management measures that, when implemented, will assure that water quality standards are attained.
California Toxics Rule The California Toxic Rule was promulgated by the U.S. EPA to set numeric water quality criteria for priority toxic pollutants and other provisions for water quality standards to be applied to California waters. The criteria apply to all inland surface waters and enclosed bays and estuaries regulated by the Clean Water Act.
California Ocean Plan The California Ocean Plan (Ocean Plan) is the state water quality control plan for ocean waters prepared by the SWRCB as required by the Clean Water Act. The plan is implemented by SWRCB and the coastal Regional Boards. It lists beneficial uses for marine waters including protection of Areas of Special Biological Significance (ASBS), rare and endangered species, marine habitat, fish migration, recreation, fishing, aesthetic enjoyment, and others. Narrative and numerical WQOs are set to protect designated beneficial uses. The objectives are implemented through a program that sets waste discharge limitations, monitoring, and enforcement. Through a triennial review process, the plan sets priorities for actions over the next three‐year period.
184

Ocean Water-Contact Standards- AB 411 In 1996, AB 411 (Wayne) required the establishment of bacteriological ocean water quality standards to protect public health (CCR Sections 7956‐7962). Contaminated runoff and untreated sewage spills are two of the most common factors that negatively impact ocean water quality. The AB 411 standards require that waters adjacent to ocean and bay public beaches be monitored for total coliforms, fecal coliforms, and enterococci bacteria. When any waters adjacent to a public beach fail to meet any of the standards, warnings are issued to the public. In the event that sewage is known or suspected, access to the affected waters is restricted.
Constituents of Emerging Concern The potential impact of trace levels of constituents of emerging concern in water supplies is becoming an increasing concern for the water and wastewater agencies, regulators, and the public. These constituents, also referred to as ‘emerging constituents’, include a wide range of chemical constituents including pharmaceuticals, personal care products, pesticides, and other synthetic organic compounds. Potential constituents may include thousands of chemicals in consumer and health‐related products such as drugs, food supplements, fragrances, sun‐screen agents, deodorants, and insect repellants. Typically, these constituents of emerging concern are found at low concentrations (i.e., parts per trillion) in water bodies. Some of these chemicals enter surface water through the discharge of treated effluent when the public disposes of unused pharmaceuticals through the sewer system or the pharmaceuticals that are consumed are not entirely broken down in the human body.
Constituents of emerging concern currently are not regulated by federal or state agencies and very few have regulatory levels or California Notification Levels. In general, when detected, the chemicals occur at low concentrations in surface water. Although ecological impacts to fish and other wildlife have been shown for some of these trace contaminants in water bodies, much less is known about potential human health effects. However, some of these constituents are known or suspected to have endocrine disrupting effects if present at a sufficiently high concentration. In
Emerging Constituents Workgroup
As part of the issuance of a tentative Waste Discharge Requirement General Order in 2006, the Regional Board requested that a program be developed to study and evaluate the potential water quality impacts of emerging constituents in imported water. A study group was convened with recharging agencies that were party to the cooperative agreement for water recharge as well as wastewater treatment agencies in the Santa Ana Region. The group is charged with surveying current water quality monitoring programs, regulatory issues, stakeholder concerns, analytical methods and the state‐of‐the‐science with respect to potential public health and environmental impacts of emerging constituents. A written report of the workgroup’s preliminary findings will be provided to the Regional Board. Thereafter, the workgroup will develop an appropriate water quality characterization program designed to address the concerns raised by regulatory agencies and other stakeholders throughout the Watershed.
185

addition, concerns are being raised about the potential reproductive and developmental effects of these compounds. There is a significant amount of research being done in the area of ecological and human health effects and new information continues to be developed on the significance of this issue.
A major driver in characterizing these constituents in water supplies is the use of newly developed analytical methods. As laboratory methods improve, new tests can detect substances at lower and lower concentrations. As many of these methods are not standard, they are considered research methods with development still ongoing. As part of the methods development process, issues such as method detection limits and intra‐ and inter‐laboratory comparisons are being evaluated.
More research is needed on the public health significance of low level concentrations of these constituents. Knowledge of the potential human health effects at low concentrations is very limited and significant data gaps exist in trying to establish levels of human health risk or regulatory limits. However, public concern is a significant issue and will need to be addressed before complete scientific‐based health information is available.
Surface Water Surface water in this section includes rivers, streams, creeks, lakes, and bays and estuaries. These waters provide many benefits to the Watershed including water supply, habitat, and recreation.
No Drugs Down the Drain
To reduce disposal of pharmaceuticals through the sewer system, a group of agencies including the City of Riverside and the Orange County Sanitation District (OCSD) are sponsoring a ‘No Drugs Down the Drain’ program. This effort is working to educate the public regarding the disposal of pharmaceuticals and provide options to disposal through the sewer system. By reducing the disposal of unused pharmaceuticals through the sewer system, the concentrations of pharmaceuticals that enter surface water through treated effluent discharge can be reduced. Additional information is available at www.nodrugsdownthedrain.org.
186

Current Conditions Water in less developed and non‐agricultural areas of the Watershed is typically the highest quality water in the Watershed. Agricultural, industrial, commercial, and residential developments over the last approximately
150 years have degraded surface water quality. Pollutants include nutrients, sediment, pesticides and microbial contaminants such as bacteria. Concentrations of soluble mineral substances commonly referred to as ‘salinity’ or ‘TDS’, also impact surface water quality. In developed areas and agricultural areas, stormwater carries pollutants from roads, parking lots, and other sources, degrading the quality of water as it flows downstream. The following sections describe surface water conditions in each Reach of the Santa Ana River Watershed as defined by the Basin Plan and shown in Figure 5.21.
Water bodies that do not meet water quality standards are identified as impaired and are placed on the 303(d) List of Water Quality Limited Segments. A water body remains on the list until a TMDL is adopted and the water quality standards are attained or there are sufficient data to demonstrate that water quality standards have been met and delisting should take place.
Figure 5.22 shows the locations of impaired water bodies where the Regional Board has yet to begin the process of developing TMDLs. Surface water bodies where TMDL projects are in the process of development, as shown on the Regional Board’s TMDL project list, are shown in Figure 5.23.
Figure 5.21 Santa Ana River Watershed, Surface Waters
187

Figure 5.22 Santa Ana River Watershed, Impaired Water Bodies
Figure 5.23 Santa Ana River Watershed, TMDL Projects
188

Past and present land use practices have negatively impacted water quality in Big Bear Lake. Impairments and current TMDL projects are shown in Tables 5.11 and 5.22.
Source: California Regional Water Quality Board, Santa Ana Region
Source: California Regional Water Quality Board, Santa Ana Region Note: Other Action – A process other than a TMDL is being pursued or considered for the impaired water body/pollutant combination. ‘Other Action’ includes a pending 303(d) delisting, a recommended delisting, or implementation through permits or other regulatory actions.
Shay Creek, Shay Meadows, and Baldwin Lake are relatively undeveloped areas that contain natural resources highly valued by stakeholders. Shay Creek and Baldwin Lake have threatened and endangered plant species as well as the endangered, unarmored three‐spine stickleback fish and a unique wetlands system. The U.S. Fish and Wildlife Service, U.S. Forest Service, and the California Department of Fish and Game are interested in restoring the quality of these waters.
Water Body Pollutant/Stressor Potential Sources Proposed TMDL Completion
Big Bear Lake Copper, mercury Resource extraction 2007
PCBs Unknown 2019
Water Body Pollutant (s) TMDL Project Status
Big Bear Lake
Metals Metals TMDLs for the Big Bear Lake Watershed Other Action
Noxious aquatic plants Nutrients
Nutrient TMDL for Dry Hydrological Conditions for Big Bear Lake
Implementation Phase
Sedimentation/Siltation Sediment TMDLs for Big Bear Lake and Rathbone Creek
Other Action
Big Bear TMDL Task Force
In response to water quality problems in Big Bear Lake, local agencies created an informal workgroup in 2000 to implement projects to improve lake water quality including dredging, alum application and aquatic plant control, and to work cooperatively with the Regional Board on TMDLs as they were developed. Once TMDLs were formally enacted, the workgroup determined that a more formal task force was needed to implement TMDL requirements. In 2008, SAWPA was utilized to convene and administer a task force which developed a multi-agency task force agreement that allows all defined responsible agencies to combine resources to cost effectively conduct monitoring, studies, and Best Management Practices (BMPs) to address water quality challenges in the region.
Table 5.22 TMDL Projects – Big Bear Lake Watershed
Table 5.21 2006 CWA 303(d) List of Water Quality Limited Segments Requiring TMDLs – Big Bear Lake Watershed
189

Grout, Knickerbocker, Summit, and Rathbone (Rathbun) Creeks, tributaries to Big Bear Lake, are listed as impaired, as shown in Table 5.23.
Mountain Home Creek and mountain reaches of Mill Creek and Lytle Creek are impacted by high seasonal recreational use and/or flow through remote residential communities. Impairments are shown in Table 5.24
The water quality of Reach 6 (the SAR upstream of the Seven Oaks Dam) and Reach 5 (the Seven Oaks Dam to the San Jacinto Fault) and their tributaries is generally very good, with low to very low levels of TDS, indicator bacteria, or other pollutants. Impounding water behind the Seven Oaks Dam reduces water quality because of sediment entrapment and algae growth. This may render some of the impounded water unsuitable for use unless additional treatment is provided. The U.S. Army Corps of Engineers is studying this problem.
Impaired Water Body
Pollutant (s) TMDL Project Status
Grout Creek
Metals Metals TMDLs for the Big Bear Lake Watershed
Other Action
Nutrients Nutrient TMDLs for Big Bear Lake Tributaries
Under development
Knickerbocker Creek
Metals Metals TMDLs for the Big Bear Lake Watershed
Other Action
Pathogens Knickerbocker Creek Bacterial Indicators
Implementation Phase (compliance will be addressed through MS4 permit)
Rathbone Creek
Nutrients Nutrient TMDLs for Big Bear Lake Tributaries
Under development
Sedimentation/ siltation
Sediment TMDLs for Big Bear Lake and Rathbone Creek
Other Action
Summit Creek Nutrients Nutrient TMDLs for Big Bear Lake Tributaries
Under development
Water Body Pollutant/Stressor Potential Sources
Proposed TMDL Completion
Lytle Creek, Mountain Home Creek, Mountain Home Creek‐East Fork, Mill Creek‐ Reaches 1 & 2
Pathogens Unknown nonpoint source
2019
Table 5.23 TMDL Projects in the Big Bear Lake Watershed
Table 5.24 2006 CWA 303(d) List of Water Quality Limited Segments Requiring TMDLs
190

Many of the mountain reaches of these streams support self‐sustaining populations of trout and other indigenous aquatic species. Several rare, threatened, and endangered species inhabit these areas including the unarmored three spine stickleback, the San Bernardino kangaroo rat, the yellow‐legged mountain frog, the speckled dace, the Santa Ana woolly star, the least Bell’s vireo, and the Southwest Willow Flycatcher.
Reach 5 and its primary tributaries are believed to meet the Basin Plan’s water quality standards. However, this may be due to the lack of recent or rigorous water quality assessments rather than a true indication of water quality. Segments of many of these streams support or have the potential to support a wide range of beneficial uses.
Santa Ana River Reach 4 Reach 4 includes the river from the San Jacinto Fault down to Mission Boulevard Bridge in Riverside. In this reach, all the WQOs are being met except for fecal coliform. Table 5.25 summarizes the 303(d) listing for pathogens for Reach 4.
Santa Ana River Reach 3 and Chino Basin Surface Water Bodies Reach 3 includes the portion of the river from Mission Boulevard Bridge to Prado Dam. Rising waters feed small creeks tributary to Reach 3 that are important breeding and nursery areas for native fish. Excessive nutrient loading in Reach 3 was addressed by amendments to the Basin Plan as recommended by the N/TDS Task Force. Watershed partners are working closely with regulators to improve the quality of impaired water bodies and to develop TMDLs as shown in Tables 5.26 and 5.27.
Water Body Pollutant/Stressor Potential Sources Proposed TMDL Completion
Santa Ana‐Reach 4 Pathogens Nonpoint source 2019
Water Body Pollutant/ Stressor
Potential Sources
Proposed TMDL Completion
Chino Creek‐Reach 1 and Mill Creek (Prado Area)
Nutrients Agriculture, dairies 2019
Prado Park Lake Nutrients Nonpoint source 2019
Table 5.26 2006 CWA 303(d) List of Water Quality Limited Segments Requiring TMDLs – Santa Ana River, Reach 3
Table 5.25 2006 CWA 303(d) List of Water Quality Limited Segments Requiring TMDLs
191

Prado Wetlands The Orange County Water District (OCWD) operates the Prado Wetlands in Riverside County to remove nitrogen from SAR water. During non‐storm conditions, the river flow upstream of the Prado Wetlands consists predominately of tertiary‐treated effluent discharged from wastewater treatment plants. Before reaching the Prado Dam, river water is diverted through 465 acres of constructed wetlands with more than 50 engineered ponds. Following wetland treatment, the water is then discharged into Chino Creek, and then back to the SAR. The wetlands serve as a natural, cost‐effective treatment to reduce nitrate levels before the water flows to Orange County, where it is used for groundwater recharge. The Prado Basin is home to several rare and endangered bird and waterfowl species. More than 124 acres are set aside as protective habitat for the endangered least Bell's vireo and Southwestern Willow Flycatcher.
Temescal Creek Temescal Creek, also called Temescal Wash, stretches approximately 25 miles from Lake Elsinore to Prado Basin. However, water overflows from the lake to the creek only during very wet periods. For most of the year, portions of the creek are dry, and flow in Temescal Creek originates downstream of Lake Elsinore. Water quality in the creek is impacted by non‐point source pollution.
Impaired Water Body Pollutant(s) TMDL Project Status
Chino Creek‐Reach 1, Mill Creek (Prado Area); SAR‐Reach 3, Prado Park Lake
Pathogens Bacterial Indicator TMDLs for the Middle SAR Watershed Water Bodies
Implementation Phase Chino Creek‐Reach 2; Cucamonga Creek‐ Valley Reach
High coliform count
SAR – Reach 3 Nitrate SAR, Reach 3 Nitrate TMDL Implementation Phase
Table 5.27 TMDL Projects Santa Ana River Watershed, Reach 3
Middle Santa Ana River TMDL Task Force
In 2007, in support of local stakeholders, SAWPA formed a multi-agency task force to address the pathogen TMDLs in the Santa Ana River Reach 3 and its tributaries. This area was named the Middle SAR by the Regional Board. This task force includes county agencies, cities, dairies, and agricultural operators. Work to date has included source assessment monitoring, research on pathogen indicators, and pilot BMPs evaluations.
192

Recycled water produced at Eastern Municipal Water District’s (EMWD) Regional Water Reclamation Facilities, Elsinore Valley Municipal Water District’s Regional Water Reclamation Facility, City of Corona’s Wastewater Treatment Plant IB, and Lee Lake Water District’s Wastewater Treatment Plant is discharged to Temescal Creek.
San Jacinto Watershed The San Jacinto River (SJR) originates in the San Jacinto Mountains and flows through the San Jacinto Valley. The valley, although undergoing considerable development, still contains citrus orchards, dairy farms, and other agricultural operations.
The SJR passes through Railroad Canyon to Canyon Lake before draining into Lake Elsinore. Lake Elsinore is a natural endpoint for its tributaries, and has no natural outlet. Historically, the lake was known to dry completely; imported and recycled water are now used to maintain the water level. To provide a water outlet during heavy rains, Lake Elsinore was modified to allow overflow into Temescal Creek, which drains into the SAR.
Nutrients from sources such as septic systems, farming, and poor land use practices can cause significant algae growth in the lake, thereby impairing recreational use and degrading aesthetic values. Moreover, excessive algae growth in the lake depletes dissolved oxygen resulting in occasional fish kills.
Lake Elsinore & San Jacinto Watersheds Authority
In 2000, as a result of the passage of State Proposition 13 Water Bond, a new joint powers authority (JPA) called the Lake Elsinore & San Jacinto Watersheds Authority (LESJWA) was formed among local agencies to implement water quality improvements for Canyon Lake and Lake Elsinore. SAWPA serves as the administrator for the JPA and as a LESJWA Board member. Utilizing local and State Proposition 13 grants funds, from 2002–2008, lake improvements have been implemented including lake dredging, an aeration system, nutrient removal, pumping and pipeline conveyance facilities to convey recycled water, and groundwater for lake level stabilization. As a result, significant improvements in water quality have been observed in recent years. More improvements are planned by LESJWA to support efforts to meet TMDL standards at both lakes.
Lake Elsinore and Canyon Lake Nutrient TMDL Task Force
In 2006, LESJWA administered the formation of a multi-agency task force to address nutrient TMDLs for Lake Elsinore and Canyon Lake. Over 20 agencies joined the task force to work with the Regional Board to implement new surface water quality regulations. Both lakes now have extensive stormwater and lake monitoring systems. Additional accomplishments for Canyon Lake include a lake quality management plan, evaluation studies on aeration systems, and a voluntary monitoring program for pathogens. This task force established one of the first TMDL agreements signed by federal, state, and local parties. This cooperative effort to address nutrients and pathogens enabled local agencies to combine efforts, economically address water quality challenges, and pursue additional grant funding for this process.
193

Lake Elsinore is on the 303(d) list as impaired for PCBs and unknown toxicity. Nutrient TMDLs for Lake Elsinore and Canyon Lake have been developed as shown in Tables 5.28 and 5.29. A Nutrient Source Assessment, a Nutrient Management Plan, and a Bacteria Source Assessment have been completed on Canyon Lake. The bacterial indicator TMDL for Canyon Lake may be revised by the Regional Board if the Stormwater Quality Standards Task Force’s recommended change of the REC‐1 Pathogen Standards from fecal coliform to E. coli is adopted into the Basin Plan. Should this change occur, Canyon Lake would be in compliance with REC‐1 standards and taken off the 303(d) list.
Lake Perris Lake Perris, located in western Riverside County, is owned and operated by the California Department of Water Resources (DWR) and is the 2,000‐acre terminal reservoir of the East Branch of the California Aqueduct (State Water Project). The lake is a source of water for the Metropolitan Water District of Southern California (MWDSC). Water quality concerns, including pathogens, taste and odors, algal toxins, and anoxia within the lake’s bottom layer, have limited its use for water supplies.
Water Body Pollutant/Stressor Potential Sources Proposed TMDL Completion
Lake Fulmor Pathogens Unknown nonpoint source 2019
Lake Elsinore PCBs Source unknown 2019
Unknown toxicity Unknown nonpoint source 2007
Impaired Water Body Pollutant (s) TMDL Project Status
Canyon Lake (Railroad Canyon Reservoir)
Nutrients Nutrient TMDLs for Lake Elsinore and Canyon Lake
Implementation Phase
Pathogens Bacterial Indicator TMDLs for Canyon Lake
Other Action
Lake Elsinore
Nutrients Nutrient TMDLs for Lake Elsinore and Canyon Lake
Implementation Phase Organic Enrichment/ Low Dissolved Oxygen
Table 5.28 2006 CWA 303(d) List of Water Quality Limited Segments Requiring TMDLs – San Jacinto Watershed
Table 5.29 TMDL Projects – San Jacinto Watershed
194

Recreational activities at the lake include body‐contact recreation such as swimming and water skiing and non‐body contact activities such as boating, fishing, camping, and hiking. Over a million people visit each year, with an estimated 50 percent of the peak season visitors involved in body‐contact recreation. Beach closures occur in spite of implementation of several BMPs aimed at reducing coliform levels.
The SWRCB provided funding to MWDSC to study microbial contamination at the lake. The studies concluded that body‐contact recreation was a key source of fecal contamination and recommended voluntary alternatives to swimming in the lake, such as swim lagoons, water play areas and other water features. Modeling and risk analysis suggest that such alternatives would reduce the consumer health risk by one‐half (to approximately a 5 percent probability of exceeding the U.S. EPA maximum risk level). A CALFED Science Panel in March 2005 concurred with the main findings of the report.
Santa Ana River Reaches 2 and 1 and Santiago Creek Watershed Reach 2 extends from Prado Dam to 17th Street in the City of Santa Ana. In this reach, the OCWD recharges as much of the river water as possible into the Orange County groundwater basin. Reach 1 extends from 17th Street in the City of Santa Ana to the ocean. In Reach 1, the Talbert and Huntington Beach Channels drain urban and stormwater runoff from the western side of the Watershed carrying flow to the Talbert Marsh along the coast. The Greenville‐Banning Channel drains the southeast side of the Watershed and carries flows to the SAR. This area also includes Huntington Beach State Park.
Although neither reach of the SAR is listed for any impairment, the river’s main tributary in Orange County, Santiago Creek, has several impairments as does its tributary, Silverado Creek. Water quality impairments in this area are shown in Table 5.210.
Water Body Pollutant/Stressor Potential Sources Proposed TMDL Completion
Santiago Creek‐ Reach 4
Salinity, TDS, chlorides Source unknown 2019
Silverado Creek Pathogens, Salinity/TDS/ Chlorides
Unknown nonpoint source 2019
Huntington Beach State Park
Enterococcus indicator bacteria, PCBs
Source unknown 2019
Table 5.210 2006 CWA 303(d) List of Water Quality Limited Segments Requiring TMDLs – Santa Ana River Watershed, Reaches 1 and 2
195

West Orange County and Coastal Watersheds This section discusses the water quality challenges facing coastal bays and harbors and coastal area tributary streams, as shown in Figure 5.24.
San Gabriel River Watershed Coyote Creek The San Gabriel River Hydrologic Unit lies within Los Angeles and Orange Counties. Approximately 86 square miles are within Orange County. The area is drained by a number of tributaries to the San Gabriel River, including Coyote Creek and Carbon Creek that originate in the foothills of northern Orange County. This area is highly urbanized and dry weather urban runoff and wet weather stormwater runoff discharge pollutants into the river. Seal Beach is located just south of the mouth of the San Gabriel River and is impacted by local drainage as well as the water quality of the river. TMDLs for Coyote Creek are listed in Table 5.211.
Figure 5.24 Coastal Watersheds
Figure 5.24 Coastal Area
196

Anaheim Bay Huntington Harbour Watershed The Anaheim Bay‐Huntington Harbor Watershed covers approximately 80 square miles in northwestern Orange County. One of its three tributaries, the Los Alamitos Channel, drains into the San Gabriel River. The Bolsa Chica Channel empties into the Anaheim Bay‐Huntington Harbor complex. The East Garden Grove‐Wintersburg Channel drains through Bolsa Bay into Huntington Harbor.
The Anaheim Bay‐Huntington Harbor complex is located at the northwestern edge of Orange County. Cattle ranching, agriculture, and commercial port facilities preceded rapid urbanization in the 1940s. Discharges containing metals and pesticides from a variety of sources including boating‐related activities; stormwater, urban, and agriculture runoff; and past historical inputs have negatively impacted water quality. Impairments in Anaheim Bay and Huntington Harbor are shown in Table 5.212.
Water Body Pollutant/Stressor Potential sources Proposed TMDL Completion
Coyote Creek
Metals Source unknown; nonpoint source
LARWQCB approved July 2006
Toxicity Point source 2008
Coliform bacteria, diazinon, pH Point, nonpoint source 2019
Seal Beach Enterococcus, PCBs Source unknown 2019
Name Pollutant/Stressor Potential Sources Proposed TMDL Completion
Anaheim Bay Dieldrin (tissue), nickel, PCBs, sediment toxicity
Source unknown 2019
Huntington Harbor
Chlordane, copper, lead, nickel, PCBs, sediment toxicity
Source unknown 2019
Pathogens Urban runoff, storm sewers 2019
Bolsa Chica State Beach
Copper, nickel Source unknown 2019
Table 5.212 2006 CWA 303(d) List of Water Quality Limited Segments Requiring TMDLs – Anaheim BayHuntington Harbor Watershed
Table 5.211 2006 CWA 303(d) List of Water Quality Limited Segments Requiring TMDLs – San Gabriel Watershed
197
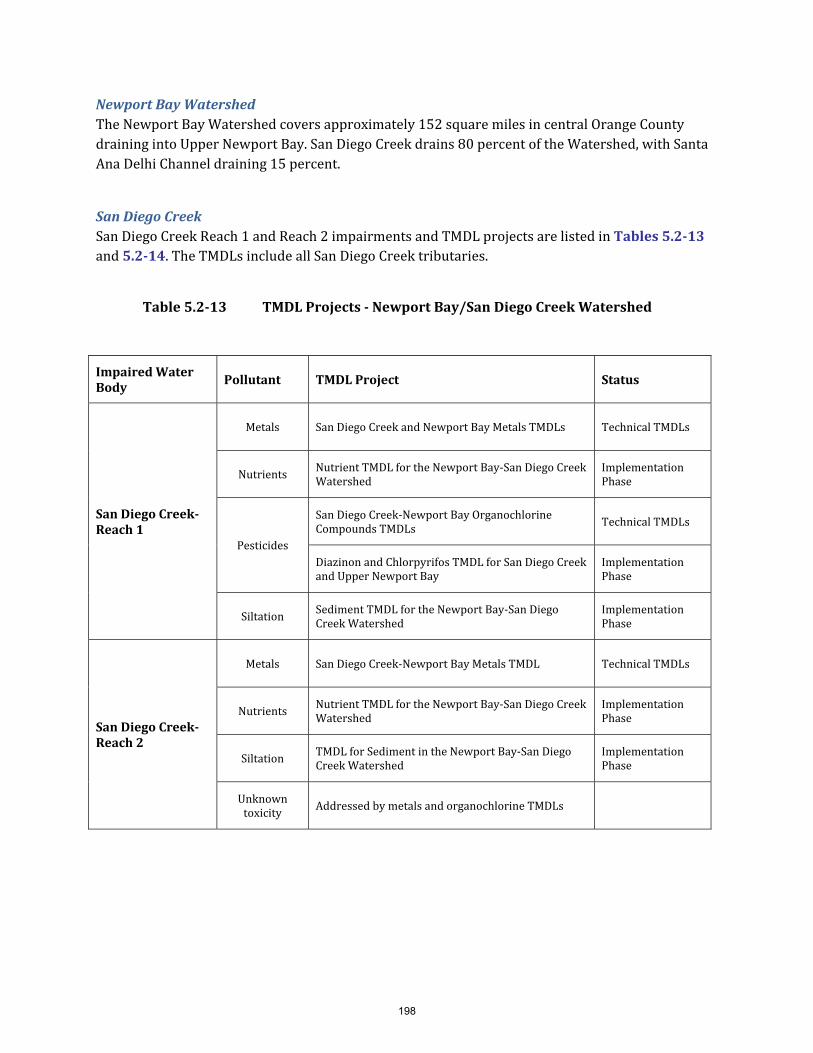
Newport Bay Watershed The Newport Bay Watershed covers approximately 152 square miles in central Orange County draining into Upper Newport Bay. San Diego Creek drains 80 percent of the Watershed, with Santa Ana Delhi Channel draining 15 percent.
San Diego Creek San Diego Creek Reach 1 and Reach 2 impairments and TMDL projects are listed in Tables 5.213 and 5.214. The TMDLs include all San Diego Creek tributaries.
Impaired Water Body Pollutant TMDL Project Status
San Diego CreekReach 1
Metals San Diego Creek and Newport Bay Metals TMDLs Technical TMDLs
Nutrients Nutrient TMDL for the Newport Bay‐San Diego Creek Watershed
Implementation Phase
Pesticides
San Diego Creek‐Newport Bay Organochlorine Compounds TMDLs
Technical TMDLs
Diazinon and Chlorpyrifos TMDL for San Diego Creek and Upper Newport Bay
Implementation Phase
Siltation Sediment TMDL for the Newport Bay‐San Diego Creek Watershed
Implementation Phase
San Diego CreekReach 2
Metals San Diego Creek‐Newport Bay Metals TMDL Technical TMDLs
Nutrients Nutrient TMDL for the Newport Bay‐San Diego Creek Watershed
Implementation Phase
Siltation TMDL for Sediment in the Newport Bay‐San Diego Creek Watershed
Implementation Phase
Unknown toxicity
Addressed by metals and organochlorine TMDLs
Table 5.213 TMDL Projects Newport Bay/San Diego Creek Watershed
198

Newport Bay San Diego Creek flows into Upper Newport Bay. The bay is a unique area containing a fragile coastal ecosystem that is designated as a State Ecological Reserve. Newport Bay is divided into two distinct areas. The 750-acre Upper Bay begins at the Pacific Coast Highway Bridge and extends five miles inland. The Lower Bay encompasses the area below the bridge and includes the Rhine Channel; it is separated from the ocean by Balboa Peninsula.
Upper Newport Bay (CCA No. 69) Upper Newport Bay, a Critical Coastal Area (CCA) with a significant ecosystem, is the receiving waters for impaired flows emanating from the San Diego Creek Watershed. It supports seven diverse estuarine habitats with several hundred species of marine and terrestrial flora and fauna including six federal and state listed, threatened, and endangered species (five bird species, one plant species). The Bay’s fish diversity is rated as the highest of the seven major coastal embayments between San Diego and Point Conception; it provides critical habitat for commercially and ecologically important species, such as California halibut, sand bass, gobies, topsmelt, and anchovy. Impairments and TMDL projects for Upper Newport Bay are listed in Tables 5.215 & 5.216.
Name Pollutant/Stressor Potential Sources Proposed TMDL Completion
San Diego Creek Reach 1
Selenium Source unknown 2007
Fecal coliform Urban runoff, storm sewers, other urban runoff
2019
Toxaphene Source unknown 2019
San Diego Creek Reach 2
Metals Urban runoff/storm sewers 2007
Peters Canyon Channel
DDT, Toxaphene Source unknown 2019
Table 5.214 2006 CWA 303(d) List of Water Quality Limited Segments Requiring TMDLs – Newport Bay/San Diego Creek Watershed
199
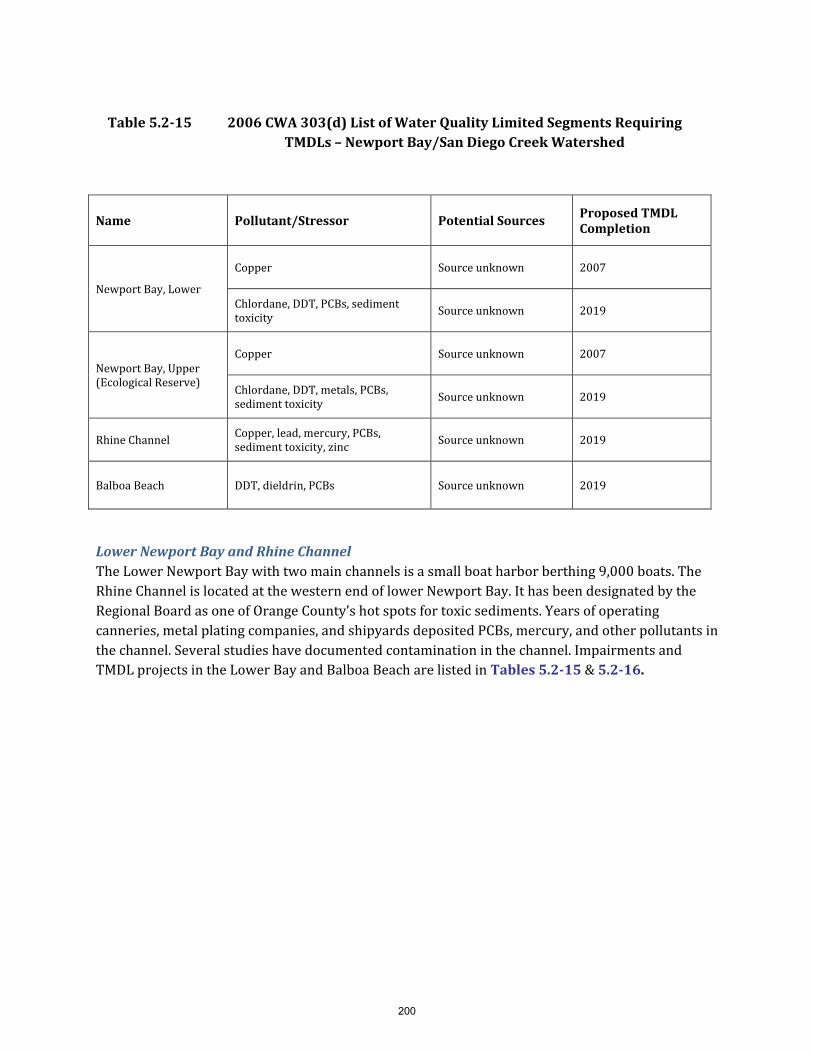
Lower Newport Bay and Rhine Channel The Lower Newport Bay with two main channels is a small boat harbor berthing 9,000 boats. The Rhine Channel is located at the western end of lower Newport Bay. It has been designated by the Regional Board as one of Orange County’s hot spots for toxic sediments. Years of operating canneries, metal plating companies, and shipyards deposited PCBs, mercury, and other pollutants in the channel. Several studies have documented contamination in the channel. Impairments and TMDL projects in the Lower Bay and Balboa Beach are listed in Tables 5.215 & 5.216.
Name Pollutant/Stressor Potential Sources Proposed TMDL Completion
Newport Bay, Lower
Copper Source unknown 2007
Chlordane, DDT, PCBs, sediment toxicity
Source unknown 2019
Newport Bay, Upper (Ecological Reserve)
Copper Source unknown 2007
Chlordane, DDT, metals, PCBs, sediment toxicity
Source unknown 2019
Rhine Channel Copper, lead, mercury, PCBs, sediment toxicity, zinc
Source unknown 2019
Balboa Beach DDT, dieldrin, PCBs Source unknown 2019
Table 5.215 2006 CWA 303(d) List of Water Quality Limited Segments Requiring TMDLs – Newport Bay/San Diego Creek Watershed
200

Newport Bay Watershed Toxics TMDLs In addition to SWRCB TMDLs, the U.S. EPA has also promulgated Toxics TMDLs in the Newport Bay Watershed. U.S. EPA established technical TMDLs (without implementation plans) for toxic pollutants in San Diego Creek and Newport Bay on June 14, 2002. Regional Board staff is developing the State required Basin Plan amendments, including implementation plans. These TMDLs are listed in Table 5.217.
Name Pollutant/ Stressor Potential Sources Status
Newport Bay, Lower
Metals
Organochlorine Compounds and Metals TMDL, Lower Newport Bay: Rhine Channel
Technical TMDLs
San Diego Creek and Newport Bay Metals TMDLs
Newport Bay-an Diego Creek Selenium TMDLs
Nutrients Nutrient TMDL for the Newport Bay‐San Diego Creek Watershed
Implementation Phase
Pathogens TMDL for Fecal Coliform Bacteria in Newport Bay Implementation Phase
Pesticides/Priority Organics
San Diego Creek‐Newport Bay Organochlorine Compounds TMDLs Technical
TMDLs Organochlorine Compounds and Metals TMDL, Lower Newport Bay: Rhine Channel
Siltation TMDL for Sediment in the Newport Bay‐San Diego Creek Watershed
Implementation Phase
Newport Bay, Upper (Ecological Reserve)
Metals
San Diego Creek and Newport Bay Metals TMDLs Technical TMDLs
Newport Bay‐San Diego Creek Selenium TMDL
Nutrients Nutrient TMDL for the Newport Bay/San Diego Creek Watershed
Implementation Phase
Pathogens TMDL for Fecal Coliform Bacteria in Newport Bay Implementation Phase
Pesticides
Diazinon and Chlorpyrifos TMDL for San Diego Creek and Upper Newport Bay
Implementation Phase
San Diego Creek‐Newport Bay Organochlorine Compounds TMDLs
Technical TMDLs
Siltation TMDL for Sediment in the Newport Bay‐San Diego Creek Watershed
Implementation Phase
Table 5.216 TMDL Projects Newport Bay Watershed
201

Newport Coastal Streams Watershed
The Newport Coastal Streams Watershed encompasses approximately eight square miles south of the Newport Bay Watershed. Several coastal canyons drain this area directly into the ocean, into two ASBS. Both Buck Gully and Los Trancos Creeks are listed as impaired for fecal coliform and total coliform, as shown in Table 5.2-18. The City of Newport Beach conducted a study of the water quality of eight coastal canyon creeks (Newport Coast Flow and Water Quality Assessment Final Report, January 2007) to determine if conditions protect beneficial uses and to investigate sources of water quality impairments
Water Body Element/Metal Organic Compound
San Diego Creek Cd, Cu, Pb, Se, Zn Chlorpyrifos, Diazinon, Chlordane, Dieldrin, DDT, PCBs, Toxaphene
Upper Newport Bay Cd, Cu, Pb, Se, Zn Chlorpyrifos, Chlordane, DDT, PCBs
Lower Newport Bay Cu, Pb, Se, Zn Chlordane, Dieldrin, DDT, PCBs
Rhine Channel Cu, Pb, Se, Zn, Cr, Hg Chlordane, Dieldrin, DDT, PCBs
Name Pollutant/Stressor Potential Sources
Proposed TMDL Completion
Buck Gully Creek and Los Trancos (Crystal Cove Creek)
Fecal coliform, total coliform (downstream of Pacific Coast Highway)
Source unknown
2019
Table 5.217 Newport Bay Watershed Toxics TMDLs
Table 5.218 2006 CWA 303(d) List of Water Quality Limited Segments Requiring TMDLs
202

Current Management Strategies for Surface Water
As described in the previous sections, regulatory efforts aimed at maintaining and improving surface water quality and cleaning up poor quality water are based on implementing the Basin Plan. Non-regulatory approaches are also being implemented to protect and improve water quality.
Attaining water quality standards is a framework identified in the federal Clean Water Act and its associated regulations, and includes four components:
Protecting beneficial uses. Attaining water quality objectives to protect beneficial uses. Implementing the State and Federal anti‐degradation policies. Executing the Implementation Plan.
The approaches available to manage surface water quality include managing urban runoff through municipal NPDES permits, developing Drainage Area Management Plans (DAMP) and water quality management plans for new development and redevelopment, and encouraging low impact development. Protection of surface waters also can be achieved through construction of wetlands, implementing BMPs, using brine lines, and building and operating appropriate wastewater treatment facilities. These tactics are listed in Table 5.219.
Nitrogen and Selenium Management Plan
Nitrogen is an essential nutrient that causes algal blooms when present in excessive quantities. Selenium is a naturally occurring substance that is found in ancient marine sediments in the foothills of Newport Bay Watershed. When selenium is released to surface water bodies, such as by groundwater discharge, it accumulates in the food chain to levels that can be harmful to fish and birds.
In renewing the region‐wide permit for discharges that pose an insignificant (de minimus) threat in 2003, the Regional Board issued a separate de minimus permit for the Newport Bay Watershed for short term groundwater‐related discharges. The concern was that high levels of nitrogen and selenium in groundwater discharges would violate established TMDLs. The Regional Board recognized that numerical effluent limits for selenium would be difficult if not impossible to meet as there is no technically feasible treatment technology available for short term groundwater discharges. Instead, the Regional Board established a working group to develop a comprehensive understanding of and a management plan for controlling levels of selenium and nitrogen in groundwater discharges. The participating Watershed stakeholders agreed to fund and implement the Nitrogen and Selenium Management Plan which is scheduled to be completed in 2009.
203

Goal Strategies Tactics
Water Quality Standards attained (includes California Toxics Rule)
Protect good surface water quality
Clean up poor quality surface water
Re‐evaluate water quality standards where appropriate
Monitoring water quality Protecting source water Wastewater treatment by publicly owned
treatment works (POTWs): source control, tertiary treatment, and nutrient removal
Urban runoff management NPDES permits for other dischargers such as
dewatering operations TMDLs Brine lines BMPs that include constructed wetlands Research Public outreach
Table 5.219 Surface Water Quality Goals, Strategies, and Tactics
Stormwater Quality Standards Task Force
As a follow up to the 2002 triennial review of the Basin Plan, the Stormwater Quality Standards Task Force was convened with representatives from major water, wastewater, and stormwater management agencies, environmental groups, the Regional Board and U.S. EPA. Funding for the effort was provided by the stormwater programs of Orange, Riverside, and San Bernardino Counties; SAWPA; and the OCSD.
The Task Force has met regularly since 2003 to evaluate key issues related to beneficial use designations and water quality objectives for water contact recreation. These issues include: 1) the definitions of body contact recreation (e.g., swimming) and non‐contact recreation (e.g., beachcombing) beneficial uses; 2) the factors that should be considered in setting WQOs for body contact and non‐body contact recreation beneficial uses; and 3) Surveying water bodies in the Watershed with body contact beneficial use designation to assess the level of use.
The Task Force implemented a program to monitor the frequency and nature of activity associated with specific water bodies. Digital cameras were installed to record images of the water bodies at 15‐minute intervals. These records, totaling over 100,000 images, provided an unprecedented record of the incidence of water contact recreation in a number of water bodies. Some sites with limited access and highly engineered concrete‐lined channels had essentially no body contact recreation, while other sites with better access and more attractive conditions had documented evidence of recreational use.
One of the guiding principles of the Task Force is that efforts to protect and improve water quality should be targeted to achieve the greatest public health benefit, especially in areas where people come in contact with the water. The recommendations of the Task Force currently are being reviewed with the Regional Board.
204

Future Water Quality Issues In addition to addressing present water quality problems in the Santa Ana River Watershed, regulators and stakeholders will likely face new challenges including:
Establishing new pathogen indicators. Reevaluating water quality standards to assure that limited resources are allocated
appropriately. Amending the Basin Plan including additions to the 303(d) list. Setting new residual chlorine objectives. Establishing nutrient objectives. Setting new statewide sediment toxicity standards. Addressing constituents of emerging concern. Managing sediment loading. Encouraging appropriate low‐impact development. Evaluating the effects of water use efficiency on wastewater treatment plants and recycled
water. Remediating pollution from septic systems.
Existing Management Plans A variety of water quality management plans have been prepared within the Watershed. This section discusses existing plans.
Santa Ana Integrated Watershed Plan, 2005 update SAWPA’s Santa Ana Integrated Watershed Plan discusses the resources of the Santa Ana River Watershed including hydrogeology, land use, biological resources, water supply, water quality, flood control, and demographics. This Plan presents integrated regional watershed management strategies including water storage, water quality improvements, water recycling, flood protection, wetlands, environment and habitat, as well as recreation and conservation. A recommended regional implementation plan also is presented and includes regional priorities, impacts and benefits, institutional structure, schedule, and monitoring performance. The plan was prepared by SAWPA and funded by SAWPA member agencies.
Upper Santa Ana River Watershed IRWMP (November 2007) The Upper Santa Ana Water Resources Association members, lead by the San Bernardino Valley Municipal Water District (Valley District), prepared the Upper Santa Ana River Watershed IRWMP to address water management issues in the Upper Santa Ana River Watershed. This plan aims to evaluate water management opportunities, improve water supply reliability, reduce dependence on and optimize the use of imported water, and assist local agencies to optimize management and protection of water resources in the region. This plan’s objectives include improving surface and groundwater management, water supply reliability, the quality of surface water and groundwater
205

resources, and ecosystem and environmental restoration. This plan was funded in part by the State of California Proposition 50 IRWMP Planning Grant and by local funding sources.
Western Municipal Water District, IRWMP (October 2006) Western Municipal Water District prepared their IRWMP to evaluate water management alternatives, address long range water supply planning to meet future demands, and increase system reliability as the amount of available supply of imported water becomes less certain. This plan was funded in part by the State of California Proposition 50 IRWMP Planning Grant and by local funding sources.
This IRWMP identifies and evaluates management strategies that aim to increase local water supplies and to address local and regional water quality concerns. The report focuses predominately on projects that result in an increase in available local water supplies. Projects were ranked with an emphasis on those with regional benefits and based on total percent of demand met. A plan for water conservation also was included.
San Jacinto River IRWMP (December 2007) Water resources in the SJR Watershed are particularly important due to high demand from urban, agricultural, and recreational users. The nutrient TMDL for Canyon Lake and Lake Elsinore, as well as NPDES stormwater permits are regulatory drivers for improved management of water resources. The IRWMP area consists of the SJR Hydrologic Unit. Most of the Watershed falls within Riverside County; with only a small portion extending into Orange County. The SJR, Salt Creek, Perris Valley Storm Drain, Mystic Lake, Perris Reservoir, Canyon Lake, and Lake Elsinore are the dominant hydrologic features in the Watershed. Through a collaborative process, the SJR IRWMP was developed and led by the San Jacinto River Watershed Council (SJRWC) with financial assistance from the State of California Proposition 50 Grant and in‐kind support and input from a number of member and partnering agencies.
Chino Creek Integrated Plan (2006) The Chino Creek Integrated Plan was prepared by a broad stakeholder group and administered by the Inland Empire Utilities Agency (IEUA). This plan focuses attention on the lower Chino Creek area as a step in the process of preserving and restoring the Prado Basin. IEUA, with a grant from SWRCB, technical support from OCWD, and funding from the City of Chino, worked with stakeholders over the course of four years to prepare the plan.
Integrated Plan goals were identified as implementable, multi‐barrier strategies aimed at reducing pollutants and providing multi‐purpose opportunities such as constructing treatment wetlands and natural flood control technologies. Recommended projects identified in the Integrated Plan aim to create recreational linkages, provide public education, develop sustainable development projects for the built environment, preserve habitat, and environmental restoration.
206

North Orange County Watershed Management Area IRWMP With a wide range of stakeholders, the County of Orange is preparing the North Orange County Watershed Management Area (WMA) IRWMP. This IRWMP will be used to guide watershed management programs and support the region in pursuing funding opportunities. The plan’s objectives will include:
Protecting and enhancing water quality in the region, including current and planned TMDLs. Enhancing local water supplies. Promoting flood management. Enhancing wetlands. Addressing runoff and its related impacts from existing and future and uses. Enhancing public education programs. Reducing invasive species and enhance habitat. Promoting environmental justice.
Coyote Creek Watershed Management Plan (January 2007) The Coyote Creek Watershed Management Plan provides a blueprint for improving the health of the Watershed through multi‐objective projects, policies, and site design guidelines. Rather than focusing on the ecological problems that have resulted from piecemeal management of land and water resources, it serves as a user guide on how to improve the management of the Watershed for maximum social, economic, and environmental benefit.
Central Orange County Integrated Regional Water Management Plan (COC IRWMP) The County of Orange led the first Integrated Regional Water Management effort for the Central Orange County Watershed Management Area (WMA) which culminated in the production of the Phase I Central Orange County IRWM Plan (IRWMP). The Phase I IRWMP was undertaken to provide a bridge between existing and developing watershed planning efforts, allowing for more effective collaboration and greater opportunity to leverage agency resources across jurisdictions. It had a strong emphasis on the sensitive coastal resources, Areas of Special Biological Significance and Critical Coastal Areas (CCAs) that are located within the Central Orange County WMA. The Phase I IRWMP was also developed to meet Proposition 50 priorities. The Phase I IRWMP was integral to subsequent watershed planning efforts led by the City of Newport Beach.
In January 2006, the City of Newport Beach was awarded a planning grant by the State Water Board through Proposition 40 for preparation of an Integrated Coastal Watershed Management Plan (ICWMP) to address ASBS and CCA issues along Newport Coast. Much of the material in the ICWMP was used during the preparation of the Phase I Central Orange County IRWMP. In May 2006, the City of Newport Beach was awarded a second planning grant by the California Department of Water Resources through Proposition 50 for the preparation of an IRWMP for the Newport Bay Watershed including data collection, analysis, and formulation of policy and guidelines. Though building on some new elements, this Phase II effort incorporated the Phase I Central Orange County IRWMP.
207
The County of Orange is currently leading an effort to complete Phase III of the Central Orange County IRWMP. Phase III will be a compilation and revision of the first two IRWMPs; the information contained in the Phase I and Phase II plans will form the basis of the Phase III plan. The purpose of the Central Orange County IRWM Plan is to provide a local plan that bridges the gap between existing and developing watershed planning efforts, allowing for more effective collaboration and greater opportunity to leverage agency resources across jurisdictions. Extensive water resource program development and implementation has occurred in this region over the past three decades, with agency partnerships, agreements, and the formation of a formal stakeholder involvement structure. The water quality issues are daunting; within this region there are eight waterbody segments listed on the State Water Resources Control Board 2006 Section 303(d) list and there are five Total Maximum Daily Loads (TMDLs) for nutrients, fecal coliform, sediment, toxics, and organophosphate pesticides, with more TMDLs pending. Water quality has been the overarching issue that has brought the water resource and land use agencies, environmental groups, and other stakeholders within the region together in the spirit of collaboration. Public agencies and private interests have entered into numerous cooperative agreements to leverage financial resources for the development of programs that implement studies, best management practices (BMPs), and other control measures consistent with regulatory requirements and regional goals for watershed conditions. These water quality‐related projects and programs have not been undertaken with a narrow focus or single purpose; the stakeholders within this region, both public and private, understand the nexus between growth, land use decisions, water resource management, and watershed impacts. This region has experienced significant population growth over the past 20 years, with development of former agricultural lands and increased numbers of people in the established urban areas. In addition to addressing water quality issues, the water and wastewater agencies have established partnerships to develop local resources, including groundwater and recycled water, to ensure a reliable source of water supply and to minimize the need for imported water. Public agencies and private entities have implemented a broad range of multi‐purpose projects and programs to protect and enhance watershed conditions. The IRWM Plan builds on this history of successful collaboration and furthers the interests of the stakeholders through this integrated planning approach.
Groundwater Groundwater is a major source of water supply in the Watershed. Protection of this source is critical to maintain the viability of local water supplies. The Basin Plan identifies 39 groundwater management zones in the Santa Ana River Watershed as shown in Figure 5.25.
Basin Plan amendments that were approved by the Regional Board in 2004 provide a comprehensive, watershed approach to controlling nitrogen and TDS in the Watershed, while also encouraging water recycling and reuse.
This section describes the TDS and nitrate‐nitrogen WQOs and current ambient water quality. Ambient water quality, as defined here, is based on the twenty year period ending in 2006. Where the ambient water quality is better than the WQO, this increment is referred to as the assimilative capacity.
208

All but five groundwater management zones in the Watershed have TDS and nitrate WQOs identified in the Basin Plan. In this discussion, the groundwater management zones are grouped as follows:
Upper Santa Ana River Basin
Chino Basin
Middle Santa Ana River Basin
San Jacinto River Basin
Lower Santa Ana River Basin
The Basin Plan requires that concentrations of TDS and nitrate in each groundwater management zone be estimated every three years. These ambient conditions are compared to the WQOs to determine the amount of assimilative capacity in each zone. In areas where there is no assimilative capacity, the Regional Board will not permit waste discharges that degrade water quality. Figure 5.26 shows the ambient WQOs for TDS and nitrates in groundwater management zones. Ambient water quality for the years 1987‐2006 for nitrates is shown in Figure 5.27 and for TDS in Figure 5.28.
Figure 5.25 Santa Ana River Watershed: Groundwater Management Zones
209

Current Conditions High salt and nitrate concentrations are two long‐standing groundwater quality issues in the SAR Watershed. Sources of elevated levels include mineral content in the sediments, recharge and drainage patterns, source water quality, irrigation, wastewater discharges, and historic land use. Managing levels of TDS in groundwater basins is a significant challenge as the recycling of waste water increases in the Watershed. Each cycle of residential water use typically adds approximately 200 mg/L of salt to the water. Industrial and commercial operations may contribute higher levels. Construction and use of salinity management facilities, such as brine lines and desalters, are being used to prevent salt‐build up and to remediate high TDS groundwater basins.
Figure 5.26 Ambient Water Quality Objectives
210

Figure 5.27 Ambient Water Quality Objectives 19872006 – Nitrates
Figure 5.28 Ambient Water Quality Objectives 19872006 – TDS
211

Elevated levels of nitrates in groundwater originate primarily from use of fertilizers, confined animal feedlots, and waste water treatment facilities. Areas with elevated nitrates (nitrate‐nitrogen greater than the MCL of 10 mg/L, using the ambient water quality statistics) in groundwater are shown in Figure 5.29.
Approximately 25 years ago, volatile organic compounds (VOCs) were discovered in groundwater in some areas. More recently, contamination due to perchlorate has become a major concern in some portions of the Watershed. Areas with groundwater contamination above the primary MCLs for VOCs and perchlorate are shown in Figure 5.210.
Figure 5.29 Groundwater with Elevated Nitrate Levels
212
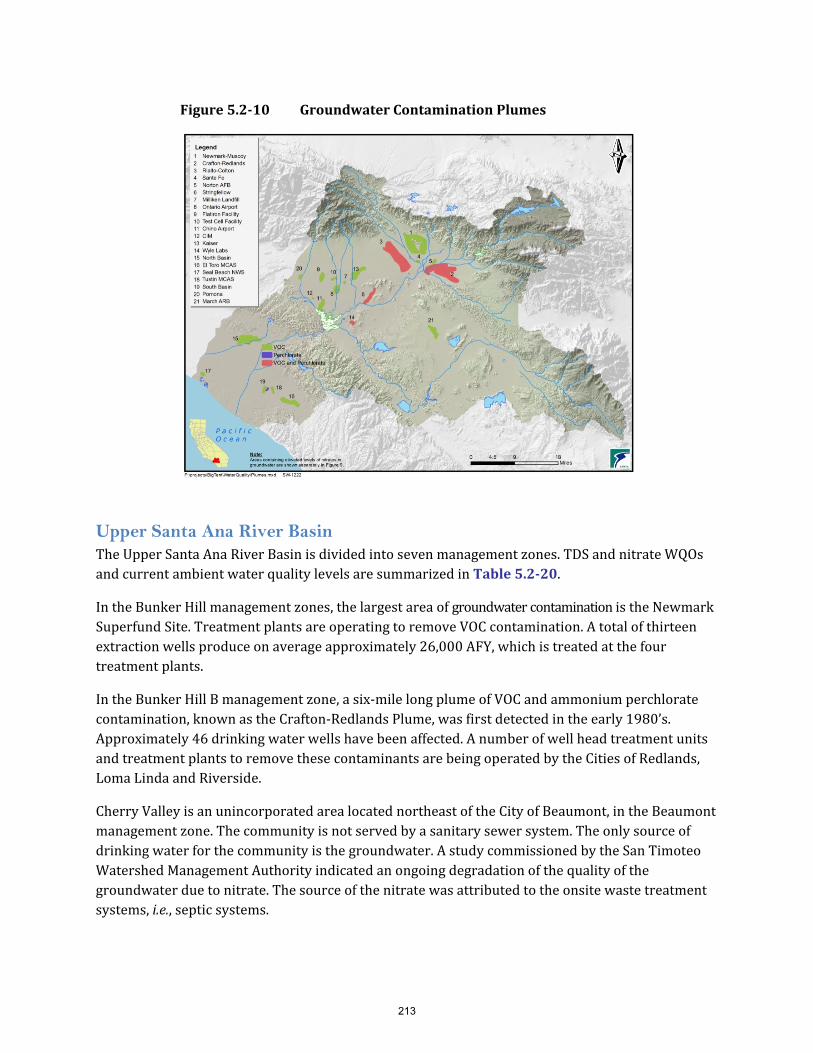
Upper Santa Ana River Basin The Upper Santa Ana River Basin is divided into seven management zones. TDS and nitrate WQOs and current ambient water quality levels are summarized in Table 5.220.
In the Bunker Hill management zones, the largest area of groundwater contamination is the Newmark Superfund Site. Treatment plants are operating to remove VOC contamination. A total of thirteen extraction wells produce on average approximately 26,000 AFY, which is treated at the four treatment plants.
In the Bunker Hill B management zone, a six‐mile long plume of VOC and ammonium perchlorate contamination, known as the Crafton‐Redlands Plume, was first detected in the early 1980’s. Approximately 46 drinking water wells have been affected. A number of well head treatment units and treatment plants to remove these contaminants are being operated by the Cities of Redlands, Loma Linda and Riverside.
Cherry Valley is an unincorporated area located northeast of the City of Beaumont, in the Beaumont management zone. The community is not served by a sanitary sewer system. The only source of drinking water for the community is the groundwater. A study commissioned by the San Timoteo Watershed Management Authority indicated an ongoing degradation of the quality of the groundwater due to nitrate. The source of the nitrate was attributed to the onsite waste treatment systems, i.e., septic systems.
Figure 5.210 Groundwater Contamination Plumes
213

The County of Riverside has adopted three ordinances to ban new septic systems unless the systems are designed to remove 50 percent of the nitrogen in the discharged wastewater. Beaumont Cherry Valley Water District is in the process of providing sewer service to a major portion of the area and has applied for State Revolving Fund loans for the project.
Chino Basin, Cucamonga, and Rialto Management Zones The Chino Basin is divided into three management zones. This section covers these three zones, and the adjacent Cucamonga, Colton, and Rialto management zones. The Basin Plan established “maximum benefit” and “anti‐degradation” TDS and TIN water quality for the Chino and Cucamonga management zones as summarized in Table 5.221.
The Chino Basin is experiencing rapid commercial and residential development. The groundwater quality in the basin is generally good, with better groundwater quality found in the northern portion where recharge occurs. Salinity (TDS) and nitrate concentrations increase in the southern portion of
Management Zone
TDS Nitrate-nitrogen
Water Quality Objective
(mg/L)
Ambient Quality (mg/L)
Water Quality Objective
(mg/L)
Ambient Quality (mg/L)
Big Bear Valley 300 NA 5.0 NA
Beaumont 330 260 5.0 1.6
Bunker Hill A 310 330 2.7 4.0
Bunker Hill B 330 280 7.3 5.4
Lytle 260 230 1.5 2.7
San Timoteo 400 NA 5.0 NA
Yucaipa 370 310 5.0 5.3
Source: Wildermuth Environmental (2008)
Management Zone
TDS Nitrate-nitrogen
Water Quality Objective
(mg/L)
Ambient Quality (mg/L)
Water Quality Objective
(mg/L)
Ambient Quality (mg/L)
Chino North 420 340 5.0 9.7
Chino East 730 650 10.0 12.7
Chino South 680 940 4.2 25.7
Colton 410 450 2.7 2.9
Cucamonga 380 250 5.0 4.0
Rialto 230 230 2.0 2.6
Source: Wildermuth Environmental (2008)
Table 5.221 Water Quality Objectives for Chino Basin and Rialto
Table 5.220 Water Quality Objectives for Upper Santa Ana River Basins
214

the Basinnitrate coare conceto impact
Groundwinclude thfor the cit
In 1980tetrachlin the nled the UdetermiWorld Wmile Mu
ContamiIn additcontamLinda, F
The Santhirteenresult, 1continu
Pictured
n. Between 20oncentrations erns for the ot groundwate
water in severhe Stringfellotrus industry
0, the Californloroethyleneorthern San U.S. EPA to pined to contaWar II Army uscoy plume.
ination impaction, 75 perceination plumFontana, and
n Bernardinon extraction w12 of the 20 cue.
d below is a f
001 and 200greater thanoverall grouner quality inc
ral areas is imow Acid Pits y.
Newmark
nia Departmee (PCE) and tBernardino/place the areaain two plumsite: an appr.
cted 25 perceent of the wame were threaRialto.
o Municipal Wwells to contcontaminate
façade house
6, about 80 pn the MCL. Pondwater qualclude VOCs, a
mpacted by eand Chilean
Cleanup Re
ent of Healthrichloroethy/Muscoy rega on the Natimes originatinroximately ei
ent of the muater suppliesatened as we
Water Departtain the plumd wells were
e built aroun
EPA Well
percent of thollution fromlity in Chino arsenic, and
elevated levenitrate fertil
estores Grou
h Services disylene (TCE) inion. Investigonal Prioriting from the sight‐mile New
unicipal wates for the City ere water sup
tment, in coome and treat te brought bac
d one of the
111 with façade h
he private wem point sourcBasin. Constperchlorate.
els of perchlolizer that wa
undwater Su
scovered then several muations into thes List in 198same source wmark plum
er supplies foof Riverside pplies for the
operation witthe contaminck into opera
extraction w
house.
ells south of Hes and emergtituents that
orate. Sources imported in
upplies
e chlorinated unicipal watehe extent of c89. This Supenear the site
me and an app
or the City ofdowngradiee Cities of Co
th the U.S. EPnated groundation; clean u
wells.
Highway 60 hging contamhave the pot
es of perchlorn the early 1
solvents er supply welcontaminatioerfund site we of a closed proximately
f San Bernardent of the olton, Loma
PA, constructdwater. As a up operation
had inants tential
rate 900s
lls on was
six‐
dino.
ted
s
215

In the Rialto management zone, at least 20 wells providing 40,135 gallons per minute (gpm) of domestic water supply capacity to the Cities of Rialto and Colton, West Valley Water District and Fontana Water Company have been contaminated by perchlorate. Well head treatment is operating on 11 of these wells.
Arsenic at levels above the MCL appears to be limited to the deeper aquifer zone near the City of Chino Hills. Total chromium and hexavalent chromium, while currently not a groundwater issue for Chino Basin, may become so, depending on the promulgation of future standards.
Middle Santa Ana River Basin The management zones for the Middle Santa Ana River Basin are listed in Tables 5.222 and 5.223. Agriculture and dairy activities are suspected to be partially responsible for elevated salt and nitrate concentrations in the groundwater. As the population within the Riverside Basins continues to grow, homes, commercial centers, new industry, and warehouses are replacing agriculture and open space.
Several active sites in the City of Riverside’s groundwater production system have increased monitoring schedules due to the presence of contaminants including: nitrate, PCE, dibromochloropropane (DBCP), and perchlorate. As a result, the City of Riverside has implemented blending plans, increased monitoring schedules, and installed well‐head treatment to address these elevated levels. Blending plans also are being used to reduce nitrate levels in wells exceeding allowable limits.
Maximum Benefit Demonstrations in Santa Ana River Watershed
A successful template for groundwater quality management is the maximum benefit demonstration utilized in the Chino Basin and the Beaumont/Yucaipa basins. Stakeholders collaborated with the Regional Board to demonstrate that groundwater quality can be protected not solely based on historical quality (the “antidegradation” objectives). Instead, the Regional Board agreed to “maximum benefit” objectives to protect groundwater quality for the “maximum benefit to the people of the State”.
In the Chino, Beaumont and Yucaipa basins, local stakeholders proposed programs to implement local cooperative projects such as groundwater desalination plants and expanded stormwater capture and recharge basins in order to protect groundwater basin quality and meet existing and downstream beneficial uses. Through an aggressive series of monitoring requirements, the State will be able to assure that water quality is protected. The antidegradation objectives are defined as the default condition if the commitments made to protect water quality are not attained. The success of this multi‐agency approach to maximize the use of water resources while protecting water quality as defined by the SWRCB serves as a progressive water management and water quality protection example for other regions in the state, according to the SWRCB.
216

San Jacinto River Basin Agricultural activities in the San Jacinto River Basin are suspected to be partially responsible for elevated salt and nitrate concentrations in the groundwater. Septic tank discharges are creating significant water quality problems that have triggered local agency and the Regional Board’s regulatory response in the unincorporated areas of Quail Valley (north of Canyon Lake) and Enchanted Heights (west Perris). The basin is dotted with several other areas believed to be at risk of water quality degradation from septic systems. A septic system management plan has been developed by Riverside County Flood Control.
A Groundwater Salinity Management Program, developed by EMWD, addresses several water quality issues in this area. The Perris South Sub‐basin contains a surplus of marginal to unusable quality groundwater that flows into the adjacent high quality Lakeview Sub‐basin, rendering several wells unusable and threatening the remaining production of the basin. Due to the unavailability of imported water, blending to improve water quality is not an option. Therefore, three desalination facilities, two constructed and one being designed, will recover high TDS water in the Menifee and Perris South Groundwater Management Zones for potable use. In addition to
Management Zone
TDS Nitrate-nitrogen
Water Quality Objective
(mg/L)
Ambient Quality (mg/L)
Water Quality Objective
(mg/L)
Ambient Quality (mg/L)
Riverside-A 560 440 6.2 4.9
Riverside-B 290 340 7.6 8.3
Riverside-C 680 740 8.3 15.3
Riverside-D 810 NA 10.0 NA
Riverside-E 720 710 10.0 15.3
Riverside-F 660 570 9.5 10.3
Source: Wildermuth Environmental (2008)
Management Zone
TDS Nitrate-nitrogen
Water Quality Objective
(mg/L)
Ambient Quality (mg/L)
Water Quality Objective
(mg/L)
Ambient Quality (mg/L)
Arlington 980 960 10 20.4
Bedford NA NA NA NA
Coldwater 380 420 1.5 2.6
Elsinore 480 470 1.0 2.4
Lee Lake NA NA NA NA
Temescal 770 780 10.0 12.6
Source: Wildermuth Environmental (2008)
Table 5.222 Water Quality Objectives for Riverside Area Management Zones
Table 5.223 Water Quality Objectives for Arlington, Elsinore, Corona Area
217
providing clean drinking water, the desalters will play a role in reducing the migration of brackish groundwater into areas of good quality groundwater.
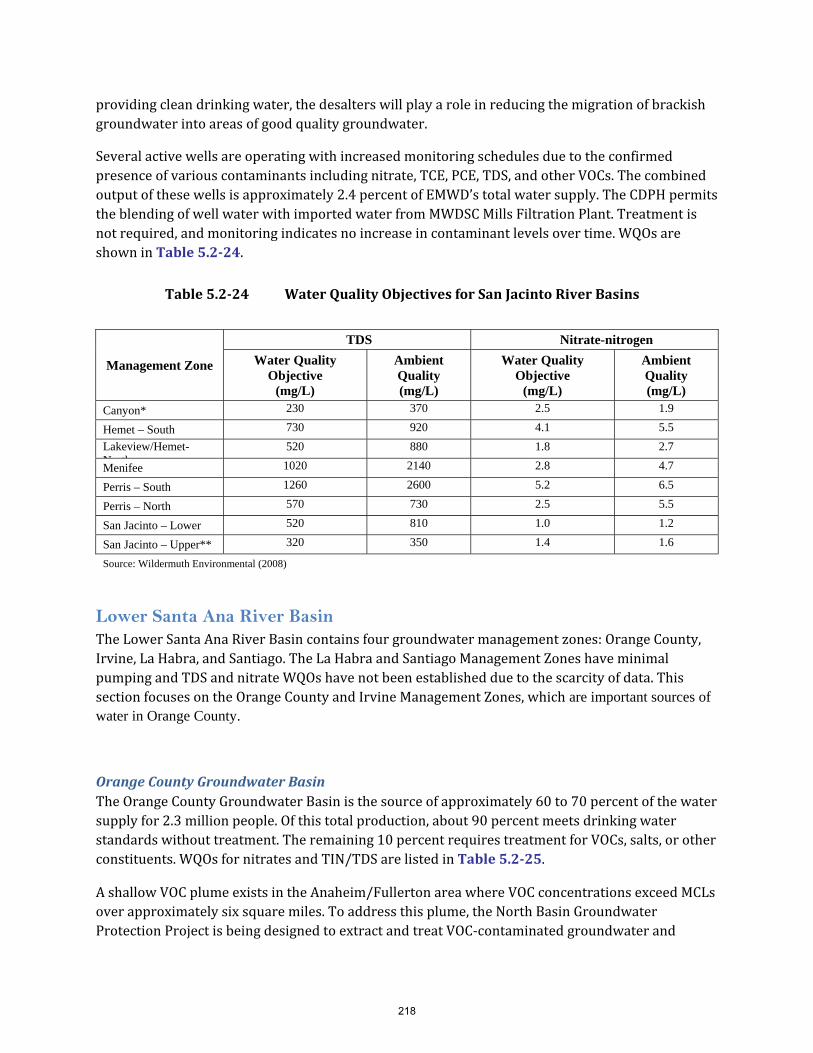
Several active wells are operating with increased monitoring schedules due to the confirmed presence of various contaminants including nitrate, TCE, PCE, TDS, and other VOCs. The combined output of these wells is approximately 2.4 percent of EMWD’s total water supply. The CDPH permits the blending of well water with imported water from MWDSC Mills Filtration Plant. Treatment is not required, and monitoring indicates no increase in contaminant levels over time. WQOs are shown in Table 5.224.
Lower Santa Ana River Basin The Lower Santa Ana River Basin contains four groundwater management zones: Orange County, Irvine, La Habra, and Santiago. The La Habra and Santiago Management Zones have minimal pumping and TDS and nitrate WQOs have not been established due to the scarcity of data. This section focuses on the Orange County and Irvine Management Zones, which are important sources of water in Orange County.
Orange County Groundwater Basin The Orange County Groundwater Basin is the source of approximately 60 to 70 percent of the water supply for 2.3 million people. Of this total production, about 90 percent meets drinking water standards without treatment. The remaining 10 percent requires treatment for VOCs, salts, or other constituents. WQOs for nitrates and TIN/TDS are listed in Table 5.225.
A shallow VOC plume exists in the Anaheim/Fullerton area where VOC concentrations exceed MCLs over approximately six square miles. To address this plume, the North Basin Groundwater Protection Project is being designed to extract and treat VOC‐contaminated groundwater and
Management Zone
TDS Nitrate-nitrogen
Water Quality Objective
(mg/L)
Ambient Quality (mg/L)
Water Quality Objective
(mg/L)
Ambient Quality (mg/L)
Canyon* 230 370 2.5 1.9
Hemet – South 730 920 4.1 5.5
Lakeview/Hemet- N th
520 880 1.8 2.7
Menifee 1020 2140 2.8 4.7
Perris – South 1260 2600 5.2 6.5
Perris – North 570 730 2.5 5.5
San Jacinto – Lower 520 810 1.0 1.2
San Jacinto – Upper** 320 350 1.4 1.6
Source: Wildermuth Environmental (2008)
Table 5.224 Water Quality Objectives for San Jacinto River Basins
218

recharge treated water back into the groundwater basin. Other VOC plumes exist in Orange, Santa Ana, the Seal Beach Naval Weapons Station, and the now closed Tustin Marine Corps Air Station. Various other sites have generally shallow VOC contamination or other contaminants. The Tustin desalters, using reverse osmosis and ion exchange, treat high TDS, nitrate, and perchlorate levels in a section of Tustin. Areas in Garden Grove have groundwater with high nitrate concentrations that are likely the result of historic agricultural practices.
Irvine Management Zone The Irvine Management Zone is a sub‐basin of the Orange County Groundwater Basin. Water naturally flows between the boundaries but the operation of the Irvine Desalter limits movement of water between the two management zones.
Groundwater contaminated with VOCs exceeding MCLs from the now closed El Toro Marine Corps Air Station also contains high TDS and nitrate concentrations. The Irvine Desalter, using reverse osmosis, air stripping, and carbon absorption, was built to treat the contaminated water. Water treated for VOC contamination is distributed after treatment through the Irvine Ranch Water District non‐portable system (irrigation and other non‐potable uses); water treated for high TDS and nitrate is distributed through the potable system.
Current Management Strategies for Groundwater Three goals are defined for groundwater quality. These goals are:
Attaining water quality standards.
Meeting drinking water standards.
Achieving salt and nutrient balances.
Management Zone
TDS Nitrate-nitrogen
Water Quality Objective
(mg/L)
Ambient Quality (mg/L)
Water Quality Objective
(mg/L)
Ambient Quality (mg/L)
Orange County 580 590 3.4 3.0
Irvine 910 920 5.9 6.5
La Habra NA NA NA NA
Santiago NA NA NA NA
Source: Wildermuth Environmental (2008)
Table 5.225 Water Quality Objectives for Lower Santa Ana River Basin Management
219

Attaining water standards is a framework identified in the federal Clean Water Act and its associated regulations, and includes four components:
Protecting beneficial uses.
Attaining water quality objectives to protect beneficial uses.
Implementing the State and Federal anti‐degradation policies.
Executing the Implementation Plan.
Meeting drinking water standards will require the attainment of both maximum contaminant levels for primary drinking water contaminants and secondary drinking water standards. Goals for improving groundwater quality and protecting groundwater supplies also include achieving a salt and nutrient balance. Strategies and tactics to achieve these goals are listed in Table 5.226.
Existing Groundwater Management Plans 2005 Regional Groundwater Management Plan A Regional Groundwater Management Plan was prepared by SAWPA in 2005. SAWPA is not directly responsible for managing groundwater basins in the Watershed. However, the agency coordinates numerous groundwater management planning efforts within the Watershed. This plan describes the water and groundwater management plans in the Santa Ana River Watershed.
Upper Santa Ana Basin Plans In 2005, the Upper Santa Ana Water Resources Association developed an Integrated Regional Groundwater Management Plan (IRGM Plan) to address major water management issues for the communities of the Upper Santa Ana River Watershed. Valley District led the planning effort. The plan developed a process for managing the San Bernardino Basin Area and identified proposed regional projects. The two management objectives were to improve water reliability during drought periods and reduce liquefaction, and to protect water quality and maximize conjunctive use opportunities. Computer models were used to evaluate the various water management strategies.
Goals Strategies Tactics Water Quality Standards
attained
Drinking water standards (DWS) met
Salt and nutrient balance achieved
Protect good quality groundwater
Clean up poor quality groundwater
Re-evaluate water quality standards where appropriate
Monitoring, assessment & reporting
Source water protection programs
Pollutant source identification & control
Groundwater treatment Pump and treat for local plumes Wellhead treatment (e.g., for arsenic) Desalters
Brine lines
Recharge of recycled, stormwater & imported water
Research
Public outreach
Table 5.226 Groundwater Quality Goals, Strategies, and Tactics
220

San Jacinto Basin Plans The West San Jacinto Groundwater Basin Management Plan was adopted in 1995. Annual reports on the status of groundwater and water resources efforts in the area have been published since 1996. The 2007 Annual Report compiled, reviewed, evaluated, and analyzed 2007 groundwater quality and water level monitoring program data; summarized groundwater‐related changes; and reported results of an extraction monitoring program and on the status of previous recommendations.
To the east, the Hemet/San Jacinto Water Management Plan was completed in November 2007 by EMWD, Lake Hemet Municipal Water District, and the Cities of Hemet and San Jacinto to guide and support responsible water management. The plan’s objectives include reducing the historical impact of overdraft caused by past groundwater production, increasing recharge of the groundwater basin, providing for the water rights of the Soboba Tribe, ensuring water supply reliability, providing for planned urban growth, and protecting and enhancing water quality. Options to increase water supply and reliability include developing underutilized sources particularly recycled water and imported water. To accomplish the plan’s objectives, the Hemet/San Jacinto Integrated Recharge and Recovery Program is being implemented. This program includes the construction of numerous water supply and conjunctive use projects such as direct and in‐lieu recharge, increased use of recycled water, increased conservation, and improved monitoring.
Chino Basin Watermaster, Optimum Basin Management Plan, State of the Basin Report 2006 (June 2007) The Chino Basin Watermaster (CBWM) is the manager of Chino groundwater basin. CBWM prepared the Optimum Basin Management Plan which describes the state of the basin in terms of historical groundwater levels, storage, production, water quality, and safe yield. Current and projected water demands and water supply plans are described. The goal of the plan is to develop a groundwater management program that enhances the safe yield and the water quality of the basin, enabling all groundwater users to produce water from the basin in a cost‐effective manner. The plan includes a monitoring program for groundwater levels, as well as programs for monitoring well construction, abandonment, and destruction.
City of Corona, Department of Water and Power, Groundwater Management Plan (June 2008) The City of Corona prepared a Groundwater Management Plan for the Temescal, Bedford, and Coldwater sub‐basins. The conditions of each groundwater basin were described including groundwater levels, production, and quality. Current and projected water demands and supplies were evaluated. Basin management objectives were determined and management strategies were set. Objectives include to:
Manage the groundwater basin in a sustainable manner.
Prevent substantial water level declines in the Channel Aquifer.
Protect groundwater quality in the unconfined aquifer.
Maintain required outflow at Prado Dam.
Monitor groundwater levels, quality, and storage.
221

OCWD Groundwater Management Plan (2009 Update) The OCWD prepared the Groundwater Management Plan 2009 Update for the Orange County Groundwater Basin to identify key issues related to groundwater management. The three major objectives are to protect and enhance groundwater quality, to protect and increase the Basin’s sustainable yield, and to increase the efficiency of operations. Recommendations in the report to proactively manage the Basin include:
Monitoring water quality and groundwater levels.
Managing groundwater recharge.
Managing groundwater quality by controlling seawater intrusion, evaluating emerging constituents, and preventing future contamination.
Implementing projects to clean up existing contamination problems.
Preparing an integrated demand and supply program.
Imported Water Quality Water agencies in the Santa Ana River Watershed receive imported water from the CRA and the SWP. The majority of this imported supply used by local agencies is received from the MWDSC. The Valley District and the San Gorgonio Pass Water Agency also provide imported water from the SWP to local agencies within their service areas. The quality of imported water that is used for recharging groundwater directly affects groundwater quality. Because imported water is a significant source of potable water in the region, it affects the quality of discharges from wastewater treatment plants for certain constituents, such as salinity.
CRA and SWP source water is of high quality. This section provides a summary of key water quality constituents within the imported water systems. Source water protection activities aimed at maintaining a safe and reliable imported water supply are described.
Colorado River This section describes water quality in the CRA system.
Salinity Colorado River salinity fluctuates from year to year but on average remains relatively stable. TDS at the intake to the CRA peaked at 720 mg/L in 1994, gradually came down to 539 mg/L in 2000, and has recently trended upward as a result of drought conditions within the Colorado River. Figure 5.2.11 shows TDS levels at Lake Mathews, a terminal reservoir on the CRA system.
Salinity in the basin is due to both natural sources and anthropogenic activities. MWDSC’s goal is to achieve a salinity concentration of 500 mg/L for treated waters in order to reduce financial impacts to water consumers, impediments to recycling projects, and salt buildup in groundwater basins. This goal has been met primarily by blending Colorado River water with SWP supplies. It is anticipated that there may be periods when this goal cannot be achieved.
222

Nutrients Phosphorus is the limiting nutrient for algal growth in the CRA system. Currently there is no regulatory limit for total phosphorous in drinking water. Despite relatively low concentrations (near 0.010 mg/L), any increase can cause algal growth; excessive growth causes unpleasant taste and odor, filter clogging, organic carbon, and toxins.
Increasing wastewater discharges from the Las Vegas area to Lake Mead may increase nutrient loads in the lower Colorado River system. MWDSC and other stakeholders are working closely with Las Vegas area wastewater agencies to implement measures to protect downstream uses.
A large number of septic systems are located near Lake Havasu, the intake for the CRA. Even though there is no direct evidence that these septic systems are increasing nitrate levels in the lower Colorado River, many communities are converting to centralized wastewater treatment systems. Nitrate levels in recent years at the intake of the CRA have averaged approximately 1 mg/L, well below the nitrate MCL of 45 mg/L measured as nitrate.
Perchlorate Perchlorate has been detected at low levels in MWDSC’s CRA water supply. In 1997, perchlorate contamination in the Colorado River was traced to Las Vegas Wash with the likely sources being two chemical manufacturing sites in Henderson, Nevada. In 2002, MWDSC adopted a Perchlorate Action Plan that established a comprehensive program to address perchlorate levels. Since 2006, monitoring has indicated non‐detectable levels (less than 2 µg/L) entering MWDSC’s conveyance system.
Salinity in CRA and SWP Source Water Reservoirs, 1980-2008
0
100
200
300
400
500
600
700
800
Jan-
80
Jan-
82
Jan-
84
Jan-
86
Jan-
88
Jan-
90
Jan-
92
Jan-
94
Jan-
96
Jan-
98
Jan-
00
Jan-
02
Jan-
04
Jan-
06
Jan-
08
Tot
al D
isso
lve
d S
olid
s (m
g/L
)
Silverwood Lake (SWP) Lake Mathews (CRA)
Figure 5.211 Imported Water TDS Levels
223

Uranium Uranium is a naturally occurring radioactive element found at low levels in rock, soil, and water. A 12 million‐ton pile of uranium tailings from a former uranium mill site near Moab, Utah lies approximately 750 feet from the Colorado River, approximately 650 miles upstream of the CRA intake at Lake Havasu. Although uranium levels at the intake are much lower than the MCL, rainwater has been seeping through the tailings pile, contaminating the local groundwater, and flowing into the river. The United States Department of Energy (DOE) is responsible for disposing the tailings offsite, which will require continued Congressional support over the next several years.
Chromium VI There is a contaminated groundwater plume located adjacent to the Colorado River near Needles, California. This plume contains hexavalent chromium (chromium VI), a form of chromium used as an anti‐corrosive agent. The chromium VI groundwater plume exists from past waste disposal practices at the Topock Pacific Gas and Electric gas‐compressor station adjacent to the Colorado River near Needles, California. The California Department of Toxic Substances Control is the lead regulatory agency responsible for the investigation and cleanup activities for the site. Chromium VI levels in the river downstream of the site have been mostly non‐detect (<0.03 µg/L) with an occasional low background level (0.03‐0.04 µg/L).
State Water Project This section describes water quality in the SWP system.
Organic Carbon and Bromide Organic carbon and bromide in SWP water react with disinfectants during the water treatment process. Some disinfection byproducts are considered carcinogenic and may cause adverse reproductive or developmental effects in animals at very high doses. Along the East Branch of the California Aqueduct, total organic carbon levels have ranged between 2.3 and 6 mg/L, with bromide levels ranging from 0.05 to 0.35 mg/L. Ozone treatment has been added to two of MWDSC’s water treatment plants to reduce the formation of chlorine disinfection byproducts. Three other plants are expected to be online in 2009.
Salinity Salt in the Sacramento and San Joaquin Rivers originates from natural sources, agricultural discharges, urban runoff and seawater intrusion. Although TDS concentrations in the East Branch of the California Aqueduct averages 250 mg/L, concentrations can vary significantly in response to hydrologic conditions in the Delta watersheds. SWP supplies, significantly lower in TDS concentrations than the Colorado River, are blended with CRA water to reduce the salinity of delivered water. TDS at Silverwood Lake, a reservoir along the East Branch of the SWP system, is shown in Figure 5.211 (previous page).
224
Nutrients Wastewater discharges and agricultural drainage in the Delta are two primary sources of nutrient loading to the SWP. Between 1998 and 2005, nitrate levels at the intake to the California Aqueduct ranged from 0.4 to 8.0 mg/L. Although these levels are well below the nitrate MCL of 45 mg/L, they are higher than those found in the Colorado River.
Arsenic Arsenic is a naturally occurring element found in rocks, soil, water, and air, and is used in certain agricultural applications, wood preservatives, paints, dyes, and soaps. Of all the regulated inorganic chemicals, arsenic is the most problematic in SWP supplies. Groundwater in the Central Valley which can contain substantial concentrations enters the CRA through water exchange and banking programs. These programs are managed to protect downstream water quality while also meeting supply targets. Routine monitoring between 2001 and 2005 at key SWP locations recorded maximum concentrations of 4 μg/L. Although levels are still below the MCL of 10 μg/L, increasing coagulant dosages during drinking water treatment may be needed to maintain safe levels for delivered water.
Salinity and Nutrient Management As stated earlier in this report, two of the most serious water quality problems in the Santa Ana River Watershed are the buildup of TDS in surface and groundwater and nitrogen levels. This section discusses on‐going efforts aimed at achieving and maintaining a salt balance in the Watershed, and efforts to manage nitrogen.
Cooperative Agreement to Protect Water Quality and Conjunctive Uses of Imported Water in the Santa Ana River Basin
On April 19, 2006, the Regional Board released a tentative Waste Discharge Requirement General Order to regulate imported SWP, Colorado River Water and imported well water that is used to recharge groundwater management zones in the Santa Ana Region. In response, SAWPA, its member districts, and other water management agencies proposed an alternative approach to assure that nitrogen and TDS levels of imported water would not degrade groundwater basins in the region.
With the support of the Regional Board, a workgroup of interested agencies developed and signed a cooperative agreement. The agreement directs the nine importing water agencies to prepare a summary of the amount and quality of imported water recharged, a 20‐year projection of the ambient water quality (Nitrogen and TDS) for each groundwater management zone at six year intervals, and a comparison of current ambient water quality to prior six year ambient water quality.
225
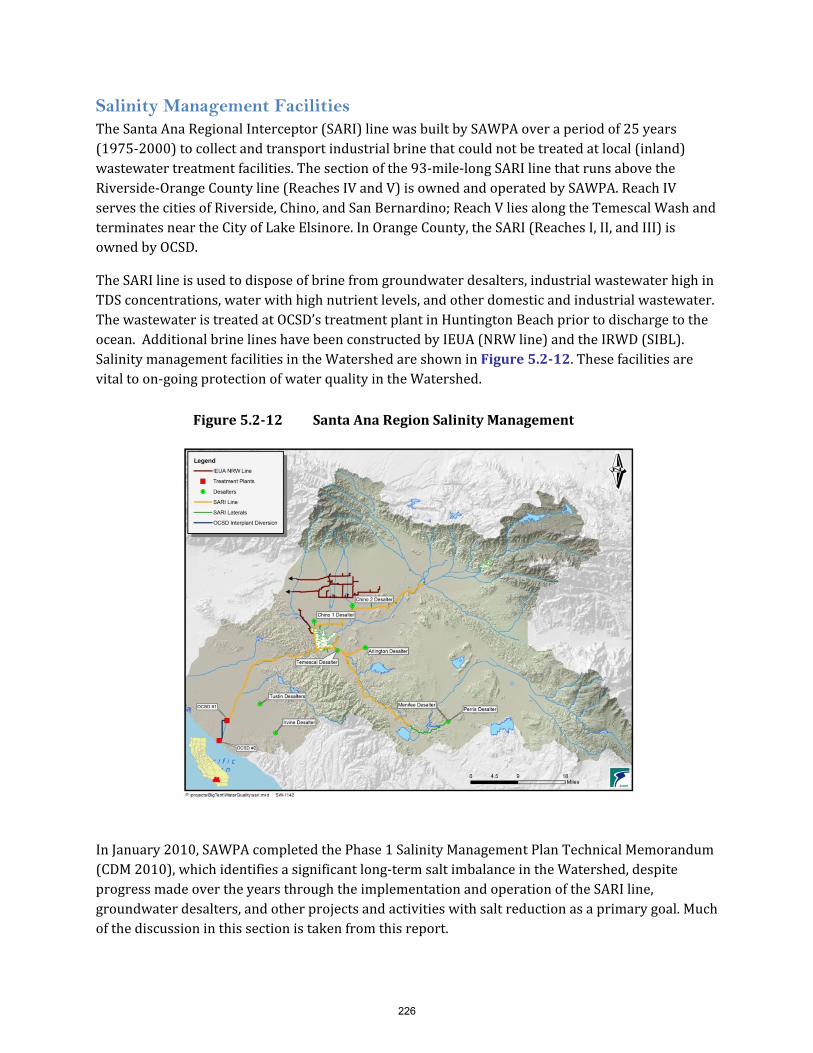
Salinity Management Facilities The Santa Ana Regional Interceptor (SARI) line was built by SAWPA over a period of 25 years (1975‐2000) to collect and transport industrial brine that could not be treated at local (inland) wastewater treatment facilities. The section of the 93‐mile‐long SARI line that runs above the Riverside‐Orange County line (Reaches IV and V) is owned and operated by SAWPA. Reach IV serves the cities of Riverside, Chino, and San Bernardino; Reach V lies along the Temescal Wash and terminates near the City of Lake Elsinore. In Orange County, the SARI (Reaches I, II, and III) is owned by OCSD.
The SARI line is used to dispose of brine from groundwater desalters, industrial wastewater high in TDS concentrations, water with high nutrient levels, and other domestic and industrial wastewater. The wastewater is treated at OCSD’s treatment plant in Huntington Beach prior to discharge to the ocean. Additional brine lines have been constructed by IEUA (NRW line) and the IRWD (SIBL). Salinity management facilities in the Watershed are shown in Figure 5.212. These facilities are vital to on‐going protection of water quality in the Watershed.
In January 2010, SAWPA completed the Phase 1 Salinity Management Plan Technical Memorandum (CDM 2010), which identifies a significant long‐term salt imbalance in the Watershed, despite progress made over the years through the implementation and operation of the SARI line, groundwater desalters, and other projects and activities with salt reduction as a primary goal. Much of the discussion in this section is taken from this report.
Figure 5.212 Santa Ana Region Salinity Management
226
Salinity problems are anticipated to exacerbate if no action is taken, as the import of surface water continues, particularly from the Colorado River Aqueduct which has a TDS concentration of 650 mg/L; water reuse increases, effectively increasing the salinity of the recycled water supply if demineralization is not provided; and as industrial and commercial growth continues.
In fact, the Salinity Management Plan projects that the seven groundwater management zones in the Watershed modeled will exceed Basin Plan TDS standards in the future, as groundwater extraction and saltier water import continues. Five of the seven management zones have some assimilative capacity that will allow them to meet TDS standards for some years (Beaumont, Bunker Hill‐B, Chino‐North, Elsinore, and Yucaipa); while the remaining two already are in excess of TDS standards and thus have no assimilative capacity available (Bunker Hill‐A and Temescal).
Future salt removal needs in the Watershed will be driven by 4 main regulatory limits:
TDS objectives in the Basin Plan.
EPA secondary MCL for TDS in the potable water supply.
TDS discharge limits in the NPDES permits of POTWs.
TDS concentrations in recycled water that exceed the Basin Plan water quality objectives, thus preventing its use for irrigation or recharge in zones with no assimilative capacity.
TDS Objectives in Basin Plan: As previously mentioned, two of seven management zones in the Watershed have no assimilative capacity, and are already in excess of Basin Plan TDS criteria. For the remaining five, it is anticipated that desalination or other mitigation will be required if and when TDS concentration is within 10 mg/L of the standard. It is anticipated that this condition would occur by 2028 for Beaumont, 2016 for Yucaipa, and 2023 for Chino‐North.
EPA Secondary MCL: The 500 mg/L secondary MCL may be exceeded in the future if mitigation measures are not taken. Potential measures include desalting, blending, importing lower‐salinity water, and capturing and recharging more stormwater upstream of supply wells. According to the Salinity Management Plan, at least eight of 59 management zones in the Watershed will exceed potable water TDS standards and will require action.
TDS Discharge from POTWs: Similar to potable water, the Salinity Management Plan estimates likely exceedances of TDS effluent discharge limits by wastewater treatment plants in the Watershed. Plants exceeding NPDES limits, with TDS effluent concentrations in the 490 to 700 mg/L range, will require actions such as desalinating all or a portion of the effluent. According to these estimates, eight out of 12, POTWs in the region will require action at some point over the next 30 years.
TDS concentrations in recycled water: TDS concentration in recycled water is a function of the salinity in the original potable water supply (i.e., imported water and/or groundwater), which drives the salinity of effluent and in any salt reduction actions being taken. As described above, salinity issues are anticipated for groundwater basins, potable water supplies, and eventually wastewater effluent. Desalination of all or a portion of effluent may be required in the future in some areas to allow water recycling.
227
The Salinity Management Plan describes a number of projects planned or ongoing in the Watershed that will address salinity issues. These projects include:
Yucaipa Valley Water District wastewater desalting and reuse.
City of Riverside water supply and wastewater desalination projects.
Western Municipal Water District and City of Corona water supply projects.
Eastern Municipal Water District groundwater desalter expansion and wastewater desalting and reuse.
Even with the implementation of these projects, a gap for salt removal remains. The Salinity Management Plan identifies potential long‐term options to address the need for additional salt removal, including:
Best Management Practices (BMPs).
Desalters for water supply.
Desalters for wastewater.
Zero liquid discharge/evaporative ponds.
LACSD Non‐reclaimable wastewater system.
Best management practices: BMP’s include source control measures aimed at reducing salt mass balances that would otherwise be discharged to ground or surface waters, or introduced into the wastewater stream. Examples of BMPs include: eliminating salt‐based domestic water softening devices, promoting the use of low‐salt detergents, addressing salt runoff, and implementing pre‐treatment programs.
Desalters for water supply: As previously mentioned, there are some agencies whose blended water supply could slightly exceed the 500 mg/L secondary MCL. Agencies potentially could add additional source water desalination because it is cost effective or because there are limited alternative supplies.
Desalters for wastewater: Similar to potable water, some agencies potentially will exceed TDS effluent discharge limits. Agencies could reduce TDS in their effluent by implementing additional source control programs; reducing TDS of source water, as mentioned above; or adding desalination to all or a portion of their effluent stream. Providing advanced treatment to secondary effluent would also increase the possibility of reusing the effluent, including indirect potable water reuse via groundwater recharge or surface storage augmentation.
Zero liquid discharge: Some agencies in the Watershed are exploring brine concentration projects to reduce the quantity of flows to the SARI line, while exporting the same amount of salt but at a higher concentration.
LACSD nonreclaimable wastewater system: IEUA owns 60 miles of pipelines used to convey high TDS water to an interceptor owned by LACSD for treatment at Carson Treatment Plant and ocean discharge. Capacity is available (approximately six MGD) for additional brine disposal through this system.
228

The Salinity Management Plan projects a need for future brine exports in the amount of 35.5 MGD, which is approximately 23% greater than the nominal capacity of the SARI. This is equivalent to nearly 271,000 tons of salt per year. This amount does not include 2.27 MGD of domestic wastewater discharges that could potentially be eliminated from the SARI.
The Phase 2 SARI Planning Technical Memorandum (CDM, May 10, 2010), complements the Salinity Management Plan as well as identified strategies and their associated cost to address the anticipated deficit in the capacity of the SARI. Six potential reconfigurations of the SARI system were considered:
1. Baseline: Continue use of current configuration in which SARI flows to OCSD POTWs prior to ocean discharge.
2a. Centralized inline brine minimization: All water flows are diverted from the SARI to a centralized facility with biological treatment and desalination. Concentrate will flow back to SARI, and in turn to OCSD and the ocean.
2b. Decentralized brine minimization: Groundwater desalters implement further concentrate management via secondary RO process, thus reducing flows to the SARI.
3a. Direct ocean discharge with brine minimization: Groundwater desalters implement further concentrate management via secondary RO process, and discharge directly to a new parallel pipeline to the ocean. Pretreatment will be required for some discharges to keep BOD concentrations below 30 mg/L.
3b. Direct ocean discharge without brine minimization: Groundwater desalters discharge brine without further concentration directly to a new parallel pipeline to the ocean. Pretreatment will be required for some discharges to keep BOD concentrations below 30 mg/L.
Project Salt load (tons/yr)
Brine flow
(mgd)
Current/ near term
Future Total Current/ near term
2010-2015 increase
2015-2025 increase
Beyond 2025
increase
Total
Water supply desalting
131,392 38,144 169,536 10.08 0.32 5.00 -- 15.40
Wastewater & recycled water desalting
8,760 69,170 77,930 1.20 0.80 11.55 0.00 13.55
Unspecified desalting (1)
-- 24,006 24,006 -- -- -- 3.74 3.74
Other
Domestic wastewater
-- Remove 0 2.27 0.00 Remove (-2.27)
0.00 0.00
Direct industrial connection & waste haulers
-- -- 0 0.69 0.50 1.00 0.60 2.79
Total 140,152 131,320 271,472 14.24 1.62 15.28 4.34 35.48
229

4. Salton Sea discharge: A new 125 pipeline from south of Prado Dam to the Salton Sea is built to transport all SARI flows, with no treatment at OCSD.
SAWPA prepared the SARI Market Analysis (EEC August, 2009) to gain an understanding of how the use of the SARI by industry and other brine dischargers could be increased to increase revenue and reduce cost to all users. Several factors impacting the use of the SARI were identified, along with potential solutions. SAWPA believes that a stronger marketing effort is needed to convey to potential users the value they will receive from discharging brine to the SARI when compared to other alternatives, SAWPA estimates that waste disposal to the SARI costs approximately $0.05 per gallon, compared to a cost of $0.20 per gallon of discharging to other alternatives in the Los Angeles basin.
Colorado River Basin Salinity Control Forum The Colorado River Basin Salinity Control Forum, established by the Colorado River Basin states in 1973, has developed projects to meet agreed‐upon numeric criteria along the Lower Colorado River. The Salinity Control Program projects include improving agricultural irrigation practices in the Upper Colorado River Basin and reducing salinity from natural sources. The federal government and Colorado River Basin states contribute approximately $50 million annually for this effort.
Southern California Salinity Coalition The Southern California Salinity Coalition (SCSC; www.socalsalinity.org) was formed in 2002 to address the critical need to control salinity in water supplies and to protect the water resources in California from increasing salinity. SCSC’s purpose is to coordinate salinity management strategies and programs, including research projects, with water and wastewater agencies throughout southern California. Members of the coalition include major water and sewer districts in San Bernardino, Riverside, Orange, Los Angeles, and San Diego Counties; the National Water Research Institute; and SAWPA. SCSC's objectives are to:
Basin Monitoring Program Task Force
On January 22, 2004, the Regional Board approved the Basin Plan Amendment for Nitrogen and TDS. Approximately 20 specific agencies throughout the Watershed were charged with the responsibility to conduct several monitoring and analyses programs for nitrogen and TDS. These requirements included the preparation of an annual water quality report for the SAR and a triennial report to determine the ambient water quality (Nitrogen and TDS) in each groundwater management zone. To cost‐effectively prepare these reports, a task force which included the Regional Board, was convened in 2004 with SAWPA as the administrator to conduct the data gathering, consultant support and river analyses programs.
230

Establish proactive programs to address the critical need to remove salts from water supplies.
Preserve, sustain, and enhance the quality of source water supplies.
Support economic development.
Help drought‐proof the community.
Reach out to the general public on salinity problems.
Future Issues Due to increased water usage, irrigation and agricultural use, and other activities, the control of salinity will continue to be a challenge for the region. Inland desalination studies of brackish water must be funded as well as construction of facilities for concentrate disposal and management to help address salinity issues. The use of high quality imported water and region‐wide planning to promote BMPs for reducing runoff impacts will continue to be essential. Managing salinity inputs to wastewater collections from water softeners also is an important factor in protecting water quality and maintaining the ability to use recycled water.
Control of salinity will continue to be a challenge. Desalinization studies must be funded and additional facilities for brine disposal are needed. From a salinity standpoint, it is preferable for the Watershed to use SWP supplies compared to CRA supplies. Shortages of SWP supplies due to regulatory issues in the Sacramento‐San Joaquin Delta or other factors can significantly impact the TDS concentrations in surface water and groundwater in the Watershed. When SWP supplies are decreased, the percentage of the imported supply that comes from the CRA is increased, resulting in increased salinity in the imported supply. As water is used, discharged, and used again downstream, this increase in salinity affects downstream users in addition to the area that first used the water.
Nutrient Management Elevated nitrogen and phosphorus concentrations come from municipal and industrial wastewater, septic tanks, animal wastes, and agricultural and lawn fertilizers. Nitrogen‐containing and phosphorus‐containing compounds act as nutrients in streams and rivers. Nitrate in freshwater can cause oxygen depletion. Desalination facilities or desalters, in operation in Chino, San Jacinto, and Orange County basins reduce nutrient concentrations in groundwater. Brine lines also are being used to export high nutrient water to the OCSD for treatment and disposal to the ocean.
231

Ocean Water This section focuses on issues related to ocean water quality. The primary emphasis with ocean water is maintaining water quality in order to protect marine resources and public health. Furthermore, the quality of ocean water may become a concern for drinking water if seawater desalination facilities are built to create new water supplies.
Current Condition Ocean water quality is evaluated using a number of different parameters and constituents related to beneficial uses. In the Basin Plan, one of the key beneficial uses is full body contact recreation, known as REC‐1.
The California Health and Safety Code requires ocean waters adjacent to public beaches be tested for indicator bacteria to ensure public safety. This program, created by AB 411, establishes uniform and consistent water quality monitoring, response, and public notification requirements for the entire California coastline. The water quality standards established by AB 411 have been incorporated into the State Water Board’s California Ocean Plan and by reference into the Basin Plan. In addition to recreation, the ocean waters also support important habitat areas, including two ASBS and their related onshore Critical Coastal Areas (CCAs).
TDS and Nitrate Management in the Chino Basin
For many years, the Chino Basin was home to one of the highest concentrations of dairies in the world. Waste discharges from years of dairy operations, as well as discharges from other commercial operations, left the southern portion of Chino Basin with a serious salt‐imbalance. While the water quality in the northern portion of the basin remained high, increasing TDS and nitrate levels degraded groundwater in the south, threatening the quality of Chino Basin’s groundwater supplies and SAR water that was flowing into Orange County’s groundwater recharge basins.
The Regional Board addressed the impacts of salt loads from dairy operations by adopting waste discharges requirements, which included the requirements for dairies to adopt engineered waste management programs and manure control programs. The Chino Basin Desalter Authority, composed of IEUA and other local agencies, operates two desalters to pump out and remove contaminants in the groundwater. OCWD operates wetlands in the Prado Basin to naturally filter out nitrates. In addition, economic changes have led to a decline in number of dairies located in the Chino Basin.
These efforts have begun to reduce levels of TDS and nitrate in the basin. Plans are underway by IEUA and the CBWM as part of their maximum benefit agreement with the Regional Board for construction of an additional desalter and to expand other programs to improve groundwater quality in this area.
232

Compliance with California Health and Safety Code Standards The County of Orange Health Care Agency implements AB 411 for Orange County’s beaches, harbors, and bays shown in Figure 5.24.
Regulatory compliance is determined from the percentage the time standards were met. Beach Mile Days (BMDs) are calculated from the number of days and the linear area of ocean or bay front that is in violation of the AB 411 standards. BMD represents the loss of beneficial use of ocean recreational waters. Table 5.227 lists total number of BMDs posted for beaches due to violation of AB411 standards.
Orange County beaches on the CWA 303 (d) list are shown in Table 5.228.
Seal/Surfside/Sunset Bolsa Chica Huntington City Huntington State Newport Beach Crystal Cove
2000 3.7 5.4 10.1 67.6 2.2 1.3
2001 0.4 0.1 1.4 14.8 0.7 0.3
2002 1.2 0.9 1.2 23.8 1.2 0.1
2003 0.3 0.8 0.8 41.9 1.4 0.2
2004 2.4 0.1 0.5 10.6 1.2 0.1
2005 0.1 0.4 0.4 12.1 6.0 0.0
2006 0.6 0.7 0.9 21.9 1.9 0.4
2007 0.5 0.6 1.4 61.0 0.6 0.1
2008 1.3 0.2 0.7 26.2 0.6 0.4
2009 0.5 0.1 0.5 11.0 0.6 0.0
Name Pollutant/Stressor Potential Sources
Proposed TMDL Completion
Balboa Beach DDT, Dieldrin, PCBs Source unknown 2019
Bolsa Chica State Beach
Copper, nickel Source unknown 2019
Huntington Beach State Park
Enterococcus, PCBs, Indicator Bacteria
Source unknown 2019
Seal Beach Enterococcus, PCBs Source unknown 2019
Table 5.227 Total Number of Beach Mile Days Posted for Open Coastal Ocean Water Areas
Table 5.228 2006 CWA 303(d) List of Water Quality Limited Segments Requiring TMDLs
233
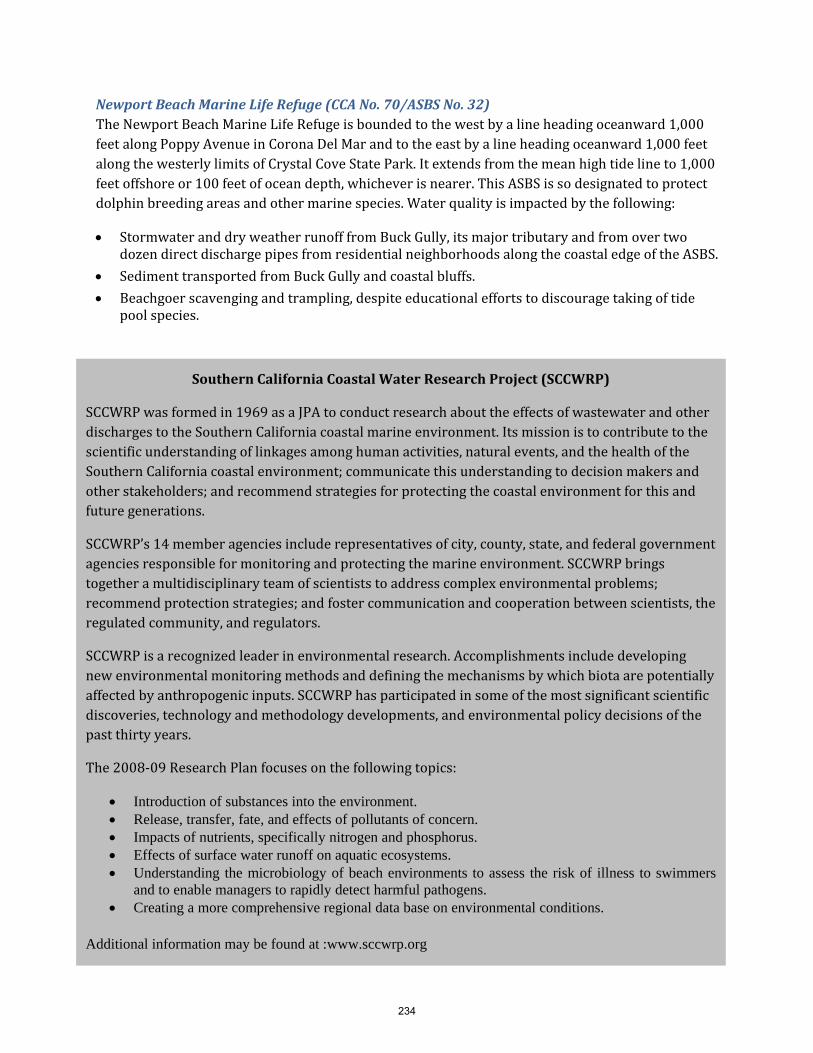
Newport Beach Marine Life Refuge (CCA No. 70/ASBS No. 32) The Newport Beach Marine Life Refuge is bounded to the west by a line heading oceanward 1,000 feet along Poppy Avenue in Corona Del Mar and to the east by a line heading oceanward 1,000 feet along the westerly limits of Crystal Cove State Park. It extends from the mean high tide line to 1,000 feet offshore or 100 feet of ocean depth, whichever is nearer. This ASBS is so designated to protect dolphin breeding areas and other marine species. Water quality is impacted by the following:
Stormwater and dry weather runoff from Buck Gully, its major tributary and from over two dozen direct discharge pipes from residential neighborhoods along the coastal edge of the ASBS.
Sediment transported from Buck Gully and coastal bluffs.
Beachgoer scavenging and trampling, despite educational efforts to discourage taking of tide pool species.
Southern California Coastal Water Research Project (SCCWRP)
SCCWRP was formed in 1969 as a JPA to conduct research about the effects of wastewater and other discharges to the Southern California coastal marine environment. Its mission is to contribute to the scientific understanding of linkages among human activities, natural events, and the health of the Southern California coastal environment; communicate this understanding to decision makers and other stakeholders; and recommend strategies for protecting the coastal environment for this and future generations.
SCCWRP’s 14 member agencies include representatives of city, county, state, and federal government agencies responsible for monitoring and protecting the marine environment. SCCWRP brings together a multidisciplinary team of scientists to address complex environmental problems; recommend protection strategies; and foster communication and cooperation between scientists, the regulated community, and regulators.
SCCWRP is a recognized leader in environmental research. Accomplishments include developing new environmental monitoring methods and defining the mechanisms by which biota are potentially affected by anthropogenic inputs. SCCWRP has participated in some of the most significant scientific discoveries, technology and methodology developments, and environmental policy decisions of the past thirty years.
The 2008‐09 Research Plan focuses on the following topics:
Introduction of substances into the environment. Release, transfer, fate, and effects of pollutants of concern. Impacts of nutrients, specifically nitrogen and phosphorus. Effects of surface water runoff on aquatic ecosystems. Understanding the microbiology of beach environments to assess the risk of illness to swimmers
and to enable managers to rapidly detect harmful pathogens. Creating a more comprehensive regional data base on environmental conditions.
Additional information may be found at :www.sccwrp.org
234

Irvine Coast Marine Life Refuge (CCA No. 71/ASBS No. 33) The Irvine Coast Marine Life Refuge is bounded by the Newport Beach Marine Life Refuge to the west and to the east by a line heading oceanward 1,000 feet along the Irvine Cove cliffs at the edge of Laguna Beach. It extends from the mean high tide line to 1,000 feet offshore or 100 feet of ocean depth, whichever is nearer. Like its immediate neighbor, this ASBS is designated to protect dolphin breeding areas and other waterborne species. It is impacted by the following:
Stormwater and dry weather runoff from the Pelican Hill/Point area and from Los Trancos Canyon and Muddy Creek.
Stormwater and dry weather runoff from direct discharge facilities draining through Crystal Cove State Park, Pacific Coast Highway, and Pelican Point.
Beachgoer scavenging despite educational efforts to discourage taking of tide pool species.
Sediment transported from Los Trancos Canyon, Muddy Creek, and coastal bluffs.
Pollutants from upcoast and downcoast discharges.
Algae water quality issues Algae are found universally in all aquatic environments. Under certain conditions, harmful algae blooms can occur. Some species of algae are capable of producing potent biotoxins. The California Health and Safety Code prohibits the consumption of sport‐harvested sea mussels every year from May 1 to October 31 because of risk of Paralytic Shellfish Poisoning (PSP). PSP toxins concentrate in the tissue of filter feeders like mussels. The toxin is harmless to the shellfish but extremely toxic to people and animals when consumed.
In early April 2007, a large harmful algae bloom (HAB) of Pseudo‐nitzschia occurred in coastal waters from Santa Barbara County to Orange County. This was one of the largest outbreaks in recent history resulting in the deaths of many sea birds and marine mammals and an early quarantine on mussel consumption.
The cause of these blooms is not clearly understood. Oceanographic currents, wind, nutrient levels, sunlight, temperature and global sea temperature oscillations like El Nino are thought to be factors.
Recently the association between bloom initiation and nutrient associated rainfall runoff and anthropogenic sources has been raised. Research is ongoing into this complex issue.
Current Management Strategies for Ocean Water The major goal for ocean water quality improvement is to achieve water quality standards, which includes meeting beneficial uses and WQOs, preventing anti‐degradation and meeting California’s Ocean Plan and AB 411 standards. Goals, management strategies, and tactics are summarized in Table 5.229.
235

The Newport Coast Watershed Management Program works on water quality issues from Buck Gully in Corona del Mar to Morro Canyon. These concerns include canyon stability, impacts to sensitive marine life areas, water quality impacts due to dry‐weather nuisance flows, and invasive plants. This watershed program, organized by the City of Newport Beach, coordinates efforts between City staff, community members, property owners, jurisdictional agencies, and other interested parties.
CHALLENGE: Identification and Solutions Table 6.230 identifies current challenges for water quality management. The challenges were identified by members of the Water Quality Improvement Pillar. Because of the broad scope of issues, the diversity of challenges is significant. A range of potential solutions for each challenge are identified and categorized by the type of water body affected and the nature of the challenge (institutional/political, financial, regulatory, or insufficient data). Each item listed in the table is discussed in more detail below.
Goals Strategies Tactics
Water Quality Standards attained (includes Ocean Plan and AB 411 standards)
Protect good quality ocean water
Clean up poor quality ocean water
Monitoring
Source water protection
POTWs implement source control & treatment
Urban runoff managed through NPDES/DAMP
NPDES permits for other dischargers
Implement State Non‐Point Source (NPS) Plan
TMDLs
Constructed wetlands
Localized urban runoff treatment systems
Surface water diversions to POTWs or other treatment systems
Research
Public outreach
Orange County Coastkeeper
The Orange County Coastkeeper, founded in 1999, is a non‐profit organization dedicated to the protection and preservation of the marine habitats and watersheds of Orange County through programs of education, restoration, enforcement and advocacy. Members work with businesses, developers, cities, elected officials and regulatory agencies to develop solutions to the problems of polluted urban runoff. The long‐term goal is to protect and preserve all of Orange County's water bodies and restore them to healthy, fully functioning systems that will protect recreational uses and aquatic life.
Table 5.229 Ocean Water Quality (including Bays, Estuaries, and Tidal Prisms) Goals, Strategies, and Tactics
236

Challenge 1 Insufficient Resources for Basin Planning The Regional Board’s resources are marginally sufficient to conduct the evaluations identified in the triennial review of the Basin Plan. The year 2006 triennial review list identifies 36 issues. These include a range of issues, such as considering changes to beneficial use designations and associated WQOs and reviews of adopted TMDLs. Due to insufficient resources, the Regional Board is not able to address all the issues identified in the triennial review.
Challenge
Water Body Constraint
Gro
undw
ater
Sur
face
Wat
er
Oce
an W
ater
Inst
itutio
nal\
Pol
itic
alF
inan
cial
Reg
ulat
ory
Insu
ffic
ient
Dat
a
1 Additional resources are needed to conduct needed Basin Planning X X X X X X X
2 Setting priorities for water quality improvement X X X X X X
3 Barriers to regional stormwater BMPs X X X X X X
4 Agencies prefer local solutions and projects over regional solutions X X X X X
5 Barriers to infiltration BMPs X X X
6 Indications of fecal contamination in stormwater X X X X X X
7 Floatable debris is a challenge to control X X X X X
8 Standard lab methods are not available for many contaminants of emerging concern X X X X
9 Improperly located and maintained septic systems are a threat to water quality X X X X X X
10 Water conservation increases concentrations of some pollutants entering treatment plants
X X X X
11 Managing TDS and nutrient levels in surface and groundwater is difficult and expensive
X X X X X X
12 Funding for necessary projects is insufficient X X X X X X
13 Impacts from contaminants of emerging concern are not well known X X X X
14 Acquiring land in urban areas to build new facilities is challenging and costly X X X X X
15 Some parties responsible for groundwater contamination cannot be located X X X
16 The ability to assess fines for violations of water quality regulations or permits is limited at the local level
X X X X X
17 Some contaminated wells are not always well managed X X X
18 Solving one water quality problem may create a new problem or constraint X X X X X X
19 Water quality problems caused by public behavior are difficult to overcome X X X X
20 Development may outpace understanding of water quality impacts X X X X X X
21 Urbanization and flood control projects impact water quality X X X X X X
Table 5.230 Water Management Challenges
237

Potential Solution:
Secure additional resources to conduct the work identified in the Regional Board’s triennial review of the Basin Plan.
Challenge 2 Setting of Priorities for Water Quality Improvement Water quality problems that pose the greatest risk to human health and the environment should receive the highest priority for funding, public agency staff resources, and other resources. The current fiscal limitations of the federal, state, and local governments are such that sufficient resources are unavailable to simultaneously solve all the water quality issues in the Watershed. Each of the three focus areas: ocean water, surface water, and groundwater have a range of water quality issues that need to be addressed.
Potential Solutions:
Create a process to determine the water quality problems that present the greatest human health and environmental risk.
Allocate funding, public agency staff resources, and other resources to priority projects.
Challenge 3 Barriers to Regional Stormwater BMPs Building regional treatment systems for stormwater would enable treatment of pollutants carried by stormwater over significant areas to a single, large‐scale treatment site. Regional treatment would have operational and cost efficiencies due to economy of scale. The prohibition on discharge of stormwater where pollutants exceed the MEP standard creates a barrier to this approach.
Potential Solutions:
Clarify the definition of MEP for stormwater that will receive subsequent treatment in a regional BMP.
Modify beneficial use designations in channels used to transport stormwater to regional systems.
Continue to require source control and treatment control BMPs at individual project sites.
Identify alternative permitting approaches.
Challenge 4: Local vs. Regional Solutions The advantages of multi‐agency, regional solutions for water issues are becoming more evident and pressures to implement regional solutions are increasing. Historically, the water and wastewater industries operate locally with agency‐owned facilities. This results in redundant, patchwork solutions to regional problems.
Potential Solutions:
Develop approaches to increase regional dialogue.
Develop strategies to foster greater pooling of resources and cost sharing.
Identify areas where regional efforts would have the greatest impact and likelihood of success and target those areas for implementation of regional projects.
238
Challenge 5: Barriers to Infiltration BMPs Although they have been found to be effective for typical storms and cost‐effective on a parcel‐level, municipalities are reluctant to approve infiltration BMPs, such as infiltration wells in the unsaturated zone, because no single agency can approve their design or application. Regulatory requirements for infiltration BMPs are unclear.
Potential Solutions:
Develop a regional groundwater quality task force that could establish specifications and guidelines for municipalities so innovative systems could be approved.
Work with local universities to study treatment systems appropriate for the local climate and land use patterns.
Challenge 6: Indications of Fecal Contamination in Stormwater Many BMPs have been implemented, yet rivers, beaches, harbors, and bays in the Watershed are affected by stormwater that contains microbial indicators of fecal contamination. Capturing and containing stormwater for later treatment would require vast areas of land and large facilities, which would be used sporadically due to the infrequent nature of storms in the Watershed.
Potential Solutions:
Research innovative approaches to reducing the fecal contamination load entering surface water bodies.
Assess health impacts from human versus nonhuman sources of fecal contaminations.
Assess the relationship between fecal indicators and health risks.
Develop quantitative sanitary survey criteria to assess watersheds in urban and non‐urban environments.
Challenge 7: Floatable Debris Poorly Controlled Floatable debris encompasses a wide range of material from sub‐millimeter particles to beverage and food containers, from “nurdle” feed stock pellets to toys and recreational equipment. Floatable debris impacts beneficial uses, particularly following periods of stormwater runoff or high tides.
Potential Solutions:
Provide financial incentives to local governments and non‐governmental organizations to develop programs addressing floatable debris, including outreach and source controls programs.
Develop updated trash and litter control ordinances for adoption by municipalities.
Coordinate with the State Board’s Marine Debris Steering Committee.
239

Challenge 8: Standard Lab Methods Not Available for Emerging Constituents When potential new chemical and microbial contaminants are identified as a concern for water quality there is often no standard analytical method available to test these constituents. In some cases, monitoring for these new emerging contaminants may be required before standard methods are available.
Potential Solutions:
Collaborative efforts among water, wastewater, and regulatory agencies should be created to prioritize the development of new analytical methods.
Regulatory authorities and dischargers should coordinate with the CDPH prior to issuing new permits to ensure the requested analytical methods have been developed and approved.
Challenge 9: Septic Systems Onsite wastewater treatment or septic systems often are neither designed nor maintained properly and cause negative impacts to groundwater quality. Water quality impacts are particularly an issue in areas with a high density of onsite wastewater treatment systems. The rehabilitation of existing onsite wastewater treatment systems is expensive.
Potential Solutions:
Identify an agency to take the lead in working for expansion of sewer service to areas outside local sewering agency jurisdictions.
Extend the sewer collection system to areas where onsite wastewater systems are used.
Amend laws to simplify annexations of areas without local or regional sewer providers to agencies that can provide those services.
Provide source protection to reduce concentrations of emerging contaminants.
Increase minimum lot size allowed for use of septic systems.
Challenge 10: Water Conservation and Pollutant Concentrations Water use efficiency and conservation practices can increase the concentration of some pollutants entering treatment plants and may cause compliance challenges, such as with TDS limits.
Potential Solutions:
Support the elimination of domestic water softening devices that discharge into the sewer system.
Promote the use of solid waste containers for disposal of food waste, pharmaceuticals, and household chemicals.
Develop and implement outreach programs to identify and promote the use of detergents and household products with low salt levels.
Address the long‐term need for increased brine disposal capacity.
240

Include higher loading levels in new treatment plant design criteria and during the CEQA and permit processes for new reclamation projects.
Promote the use of collection facilities and programs to take back unused pharmaceuticals and distribute smaller amounts to patients where possible.
Challenge 11: Salt Management Increased concentrations of TDS or salinity in our water supplies are problematic in the Watershed. In many streams and basins, there is a lack of assimilative capacity for TDS or the current ambient TDS concentration exceeds the WQOs. Nutrients are also increasing in groundwater basins.
Potential Solutions:
Promote regional efforts to establish BMPs for reducing impacts from salt in runoff.
Promote the establishment of mitigation plans for recycled water reuse projects.
Ensure the long‐term viability of existing brine lines.
Expand the existing brine lines to areas that need them.
Evaluate and recommend financial incentives for desalination studies and facilities.
Cooperate with MWD to create incentives for use of best quality imported water sources.
Encourage regulatory agencies to recognize exporting certain brines and constituents as regulatory relief/offsets for wastewater permitting requirements.
Develop new and effective concentrate management options
Challenge 12: Funding Inadequate New regulations, new technology, and emerging environmental concerns increase cost pressures on public agencies that manage water. Water quality improvement funds are hard to obtain. For example, funding from the State Revolving Fund is inadequate and Proposition 218 imposes limits on new funding. Public officials may be reluctant to increase water rates due to concerns about public opposition and the potential precedent that would be set if a public vote fails.
Potential Solutions:
Provide federal and state funds for water and wastewater infrastructure banks.
Consider a ballot measure to amend Proposition 218.
Prepare strategies to address legal decisions that are adverse to public agencies setting or increasing fees to fund water improvements.
Encourage regulating agencies to clearly identify goals of new regulations and to plan implementation to ensure that the new regulations will be effective.
Develop approaches to effectively communicate to the public the need for new investment to address our challenging water supply needs.
241
Challenge 13: Constituents of Emerging Concern Poorly Understood New analytical methods for constituents of emerging concern make it possible to detect chemical constituents at very low concentrations. More information is needed to determine the potential human toxicological or environmental risk from these emerging contaminants.
Potential Solutions:
Outreach to affected agencies and the Regional Board on current state of studies and research.
Evaluate joint opportunities to conduct studies.
Encourage the development of human health and ecological risk levels for specific compounds.
Develop a list of appropriate surrogates and indicators of water quality for monitoring these constituents.
Develop a monitoring plan for specific water bodies and facilities.
Test water bodies and facilities for the appropriate set of constituents.
Support the creation of a Blue Ribbon Commission by SWRCB and CDPH to make recommendations for monitoring of contaminants of emerging concern in recycled water.
Collaborate on public information outreach.
Challenge 14: Land Acquisition for Projects In urban areas, it is difficult and costly to gain access to land to construct new water quality improvement facilities. In the case of groundwater cleanup facilities, the land needed for extraction wells and treatment facilities may not be located where the contamination originated.
Potential Solutions:
Develop financial incentives for property owners to make their land available for cleanup facilities. In the case of groundwater contamination, limit those incentives to the property owners who are not responsible for the contamination.
Challenge 15: Responsible Parties Cannot Be Located In some areas, the party responsible for groundwater contamination is unknown, insolvent, or defunct.
Potential Solutions:
Work with State and Federal agencies to obtain grants, including the U.S. Dept of Agriculture for perchlorate cleanup.
Set up an orphan share fund.
242

Challenge 16: Ability of Local Government to Assess Fines is Limited Local agencies are increasingly required by the Regional Board and other state agencies to enforce a variety of water quality and other regulations. The Government Code limits the amount of some fines and penalties local agencies can assess. Local enforcement authority has limited regulatory jurisdiction over some agencies such as school districts.
Potential Solutions:
Consider consolidating enforcement authority to the regulating agency.
Expand local agencies’ enforcement authority.
Develop a panel to discuss the current regulatory environment, interagency impacts, and impacts to business and residents such as groundwater discharge permitting requirements.
Challenge 17: Some Production Wells in areas of Groundwater Contamination are not Managed Properly When an existing well becomes contaminated, groundwater producers sometimes react by shutting down the well and either locating a new well or expanding production from existing wells in uncontaminated areas. These actions frequently lengthen the time required to cleanup groundwater contamination. Contamination would, in general, be cleaned up more quickly if the affected wells continue to be pumped and treatment provided. In addition, some local rules and regulations preclude contamination cleanup.
Potential Solutions:
Develop incentives for groundwater producers to provide treatment for wells producing contaminated water.
Change existing local rules and regulations that act as barriers to cleaning up water contamination.
Challenge 18: Unintended Consequences In seeking to solve one water quality problem, a proposed project may cause a new problem. For example, an agency protects surface water quality through infiltration of urban runoff that could negatively impact groundwater quality.
Potential Solutions:
Develop strategies to increase communication, planning and cooperation among all stakeholders.
Monitor programs for infiltration BMPs at selected sites in the Watershed to collect data regarding potential impacts to groundwater quality.
243
Challenge 19: Public Behavior Difficult to Change The behavior of individuals and businesses directly impacts water quality. Most initiatives aimed at fostering sustainable behavior rely upon large‐scale information campaigns and utilizing education and/or advertising to encourage behavior change. Studies show that behavior change rarely occurs as a result of simply providing information. Initiatives delivered at the community level focusing on removing barriers to an activity while simultaneously enhancing the activities are more effective.
Potential Solutions:
Develop, pilot, and evaluate the effectiveness of strategies to change public behavior.
Foster sustainability in the Watershed by effectively encouraging individuals and businesses to adopt behaviors that are aimed at reducing water runoff and preventing pollution.
Support efforts to increase the public perception of the value of water.
Challenge 20: Development May Outpace Understanding of Water Quality Impacts Areas with rapid growth, such as Riverside and San Bernardino Counties, are experiencing large scale alteration of land use patterns. Local governments have difficulty planning for the impacts of growth on complex water quality issues such as flood management, sediment transport, nutrient loading, and habitat alteration. New water quality problems are not identified due to lack of information, scientific studies, and funds.
Potential Solutions:
Educate local officials so water quality concerns become core issues.
Conduct studies to identify water quality challenges in rapidly developing areas.
Challenge 21: Urban Runoff Causes Water Quality Degradation Many portions of the Watershed (e.g., Chino Basin and San Jacinto Basin) are rapidly changing from open space and agricultural to urban land use. In large areas of the Watershed, urbanization and flood control projects have virtually eliminated the groundwater recharge that formerly took place in natural stream channels and flood plains. This has caused significant changes in runoff quantities and in the types and amounts of pollutants carried into surface water bodies, causing a number of water quality problems. The increases in runoff are due directly to the increase in impervious surfaces. Typical urban runoff pollutants include pet waste, turf fertilizers, pesticides, air pollutant deposits, and various synthetic chemicals. In addition, the reduced recharge of the local groundwater basin lowers ambient groundwater quality, reduces assimilative capacity, and decreases the amount of groundwater that can be pumped sustainably from the groundwater basin.
244

Potential Solutions:
Promote Low Impact Development principles by designing features into the infrastructure, landscape, and buildings/housing projects that will minimize runoff and cause infiltration of runoff into the ground, such as pervious pavement and vegetated buffer strips.
Recognize in regulatory and funding frameworks that using design and retrofit technology options to minimize runoff and increase infiltration in urban areas is beneficial to meeting water quality and TMDL goals.
Description of Data Collection Process Greg Woodside, OCWD, chaired the Water Quality Pillar Committee and coordinated the preparation of this report. Committee members, listed below, provided direction and assisted in collecting the information contained in this report and reviewed and commented on draft versions. The committee met in person and also held conference calls on a number of occasions. Peter Vitt at SAWPA provided invaluable assistance preparing the GIS maps. Gerry Thibeault of the Regional Board also reviewed and commented on a draft version of the report.
245

References California Environmental Protection Agency, State Water Resources Control Board, Division of Water Quality, Oceans Standards Unit, California Ocean Plan, Triennial Review and Workplan, 2005‐2008, November 16, 2005
California Regional Water Quality Control Board, Santa Ana Region. Water Quality Control Plan for Santa Ana River Basin. 1995 (as amended).
CH2M Hill. 2006. Chino Creek Integrated Plan. Prepared for the Inland Empire Utility Agency/Orange County Water District. September 2006.
Chino Basin Watermaster. Chino Basin Optimum Basin Management Program, State of the Basin Report 2006, July 2007. (Downloaded from www.cbwm.org)
County of Orange. Central Orange County Integrated Regional and Coastal Watershed Management Plan. August 2007.
‐‐‐‐‐ North Orange County Watershed Management Area Integrated Regional Water Management Plan (IRWMP). Draft Report 2008.
‐‐‐‐‐ Coyote Creek Watershed Management Plan. 2007
County of Orange Health Care Agency‐Environmental Health. Annual Ocean and Bay Water Quality Report. 2006
Eastern Municipal Water District. West San Jacinto Groundwater Management Plan. 1995.
‐‐‐‐‐ West San Jacinto Groundwater Basin Management Plan. 2006 Annual Report.
Newport Coast Flow and Water Quality Assessment, Final Report. City of Newport Beach. January 2007.
Orange County Coastkeeper. www.coastkeeper.org
Orange County Water District. Groundwater Management Plan. March 2004.
‐‐‐‐‐ Unpublished data, 2007.
San Timoteo Watershed Management Authority. 2005. Integrated Regional Watershed Management Plan for the San Timoteo Watershed, Final Draft Report. June 2005.
Santa Ana Regional Water Quality Control Board (8). Watershed Management Initiative Chapter. Revised November 2004
‐‐‐‐‐ Total Maximum Daily Load (TMDL) Program. www.waterboards.ca.gov/santaana/html/tmdls.html.
Santa Ana Watershed Project Authority. 2005 Regional Groundwater Management Plan. May 2005.
246
‐‐‐‐‐ Santa Ana Integrated Watershed Plan 2005 Update: An Integrated Regional Water Management Plan. June 2005.
San Bernardino Valley Municipal Water District. 2005. Integrated Regional Groundwater Management Plan.
‐‐‐‐‐ 2007. Upper Santa Ana River Watershed Regional Water Management Plan. November 2007.
San Jacinto River Watershed Council. Integrated Regional Watershed Management Plan for the San Jacinto Watershed. December 31, 2007.
Todd Engineers. 2008. AB 3030, Groundwater Management Plan. Prepared for the City of Corona Department of Water and Power. June 2008.
U.S. Environmental Protection Agency, Region 9. Total Maximum Daily Loads for Toxic Pollutants, San Diego Creek and Newport Bay, California. June 2002.
Western Municipal Water District, Integrated Regional Water Management Plan Report, October 2006.
Wildermuth Environmental, Inc. 2000.TIN/TDS Phase 2A: Tasks 1 through 5. TIN/TDS Study of the Santa Ana Watershed. Technical Memorandum. July 2000.
‐‐‐‐‐ 2008. Recomputation of Ambient Water Quality in the Santa Ana Watershed for the Period 1987 to 2006, Final Technical Memorandum. Prepared for the Basin Monitoring Task Force. August 2008.
247

List of Contributors
The following is a list of the members of the Water Quality Pillar.
Mark Adelson Santa Ana Regional Water Quality Control BoardStacey Aldstadt City of San Bernardino Municipal Water Dept.Daniel Apt RBF ConsultingPat Boldt San Jacinto River Watershed CouncilJim Burror Orange County Sanitation DistrictMickey Chaudhuri Metropolitan Water District of Southern California Jessica Chin City of Riverside, Public Works DepartmentMichele Colbert City of Corona Public Works DepartmentRod Cruze City of RiversideEd Demesa U.S. Army Corps of Engineers Los Angeles District Bill Flores HDR EngineersCynthia Gabaldon URS CorporationLeAnne Hamilton Inland Empire Utilities AgencyJon Harrison Environmental Systems Research Institute Inc.Ray Hiemstra Orange County CoastkeeperBoyd Hill McCormick, Kidman & Behrens, LLPLarry Honeybourne County of Orange, Health Care AgencyChandra Johannesson City of RiversideJane Joy Eastern Municipal Water District Kennedy Kennedy CommunicationsJerry King Latham and WatkinsGregory Krzys US Bureau of ReclamationAnthony LA City of Upland, Public Works DepartmentJoseph LeClaire Wildermuth Environmental Inc.David Lee YSI EnvironmentalMark Matsumoto University of California, RiversideAutumn Miller-DeWoody Inland Empire WaterkeeperCyndi Moore E.S. Babcock & Sons, Inc.Richard Morales Aramark Inc.Jeffrey Mosher National Water Research InstituteJack Nelson Yucaipa Valley Water DistrictCindy Norried City of RiversideJoe Purohit Sparkers Inc.Max Rasouli City of RiversideLee Reader Inland Empire WaterkeeperJeff Salter YSI EnvironmentalJan Scherfig University of California, IrvineMary Anne Skorpanich County of OrangeSarina Sriboonlue Malcolm Pirnie, Inc.Jonathan Trapesonian Orange County Water DistrictRoger Turner Roger Turner & AssociatesJason Uhley Riverside County Flood Control DistrictPaul Van Dyke Assemblywoman Nell SotoRocky Welborn Inland Empire Utilities AgencyMarsha Westropp Orange County Water DistrictRichard Wilson City of Anaheim, Public Utilities DepartmentDave Woelfel Santa Ana Regional Water Quality Control Board Greg Woodside Orange County Water DistrictMatt Yeager San Bernardino County Flood Control District
248