chapter 6 – vegetated water quality swale · 6.3.6 shear stress in addition to considering the...
TRANSCRIPT

VDOT BMP Design Manual of Practice
i
Chapter 6 – Vegetated Water Quality Swale
Chapter 6 – Vegetated Water Quality Swale TABLE OF CONTENTS
6.1 Overview of Practice ........................................................................................................... 1
6.2 Site Constraints and Siting of the Facility ........................................................................ 2
6.2.1 Minimum Drainage Area .............................................................................................. 2
6.2.2 Maximum Drainage Area ............................................................................................. 2
6.2.3 Site Slopes ................................................................................................................... 2
6.2.4 Site Soils ...................................................................................................................... 2
6.2.5 Depth to Water Table ................................................................................................... 2
6.2.6 Existing Utilities ............................................................................................................ 3
6.2.7 Wetlands ...................................................................................................................... 3
6.3 General Design Guidelines ................................................................................................. 4
6.3.1 Swale Geometry ........................................................................................................... 4
6.3.2 Bottom Width ................................................................................................................ 4
6.3.3 Channel Depth ............................................................................................................. 4
6.3.4 Longitudinal Slope........................................................................................................ 4
6.3.5 Flow Velocity ................................................................................................................ 4
6.3.6 Shear Stress ................................................................................................................ 5
6.3.7 Swale Length ............................................................................................................... 5
6.3.8 Discharge Flows: .......................................................................................................... 5
6.4 Design Process .................................................................................................................... 6
Step 1. Compute the Required Water Quality Volume ............................................................. 7
Step 2. Determine the Cross-Sectional Dimensions of the Channel........................................ 7
Step 3. Determine the Depth of the Channel ........................................................................... 8
Step 3A. Channel Depth – Method 1 .......................................................................................... 9
Step 3B. Channel Depth – Method 2 ........................................................................................ 12
Step 3C. Channel Depth – Method 3 ........................................................................................ 18
Step 4. Ensure Allowable Levels of Shear Stress .................................................................. 18
Step 5. Investigation of Alternative Swale Designs ................................................................ 19
Step 6. Check Dam Design .................................................................................................... 20
Step 7. Selection of Vegetation .............................................................................................. 21

Table of Contents
VDOT BMP Design Manual of Practice
ii
Chapter 6 – Vegetated Water Quality Swale
LIST OF TABLES
Table 6.1. Permissible Flow Velocities ........................................................................................... 4Table 6.2. Permissible Shear Stresses .......................................................................................... 5Table 6.3. Hydrologic Characteristics of Example Project Site ...................................................... 6Table 6.4. Peak Roadway Runoff ................................................................................................... 6Table 6.5. Swale Stage – Storage Relationship ........................................................................... 10Table 6.6. Swale Stage – Discharge Relationship ....................................................................... 11Table 6.7. Classes of Retardance by Vegetation Type and Height ............................................. 14Table 6.8. Summary of Computed Channel Depth ...................................................................... 18
LIST OF FIGURES
Figure 6.1. 10-Year Post-Development Flow Entering Swale ...................................................... 11Figure 6.2. Routing of 10-Year Flow Through Swale ................................................................... 12Figure 6.3. Relationship of Manning’s n to VRh ............................................................................ 13Figure 6.4. Results of Initial Manning’s Roughness of 0.10 ......................................................... 15Figure 6.5. Results of Second Manning’s Roughness of 0.12 (Q10) ............................................ 16Figure 6.6. Results of Normal Depth Calculation (Q10) ................................................................ 16Figure 6.7. Flow Parameters (Q2) ................................................................................................. 17Figure 6.8. Profile of Example Swale ........................................................................................... 22Figure 6.9. Cross-Sectional View of Example Swale ................................................................... 22
6.1 - Overview of Practice
VDOT BMP Design Manual of Practice 1 of 22
Chapter 6 – Vegetated Water Quality Swale
6.1 Overview of Practice
Vegetated swales are broadly described as surface depressions which collect and convey stormwater runoff from roadways, driveways, rooftops, and other impervious surfaces. However, when applied as a Best Management Practice, an engineered grassed swale functions beyond simple collection and conveyance, seeking to also improve the quality of stormwater runoff through sedimentation and filtration. The inherent linear orientation of a vegetated swale makes it an attractive option for treatment and conveyance of highway runoff. Vegetated swales function by minimizing flow velocity and inducing ponding behind strategically placed check dams. While infiltration of some runoff associated with ponding can attenuate peak runoff rates, this attenuation can be considered minimal at best. Vegetated swales are water quality improvement practices, and cannot be considered effective flood control strategies. The Virginia Stormwater Management Handbook, (DCR, 1999) identifies two categories of vegetated conveyance BMPs – “Grassed Swales” and “Water Quality Swales” (Minimum Standard 3.13). Grassed swales, also termed “dry swales,” function by slowing the velocity of runoff and inducing ponding behind strategically placed check dams. The swale’s controlled velocity permits filtration of runoff pollutants by the dense vegetation lining the channel. Ponding increases the hydraulic residence time within the swale, thus providing an increased opportunity for the gravitational settling of pollutants. Water quality swales, or wet swales, can be conceptualized as a linear wetland. Their underlying soils, in contrast to dry swales, are comprised of a very specific mixture in order to permit controlled infiltration as well as the growth of wetland vegetation. The rigid underlying soil characteristics of a wet swale will typically require native site soils to either be amended or excavated completely and replaced with imported material. While wet water quality swales are considered capable of achieving phosphorus removal beyond that of dry swales, they are best suited for contributing drainage areas whose impervious cover ranges from 16 – 37%. When a project site’s impervious cover enters that range, there will be a need for flood control in the form of mitigation of post-developed runoff rates to those of pre-developed levels. The inability of a wet water quality swale to also provide peak attenuation will generally render it cost prohibitive, with BMPs capable of providing both water quality improvement and peak mitigation preferred. Therefore, as evidenced in Table 1.1, the VDOT BMP selection table only considers the grassed, or dry, variation of a water quality swale.
6.2 - Site Constraints and Siting of the Facility
VDOT BMP Design Manual of Practice 2 of 22
Chapter 6 – Vegetated Water Quality Swale
6.2 Site Constraints and Siting of the Facility
In addition to the contributing drainage area’s impervious cover, a number of site constraints must be considered when the implementation of a grassed swale is proposed. These constraints are discussed as follows. 6.2.1 Minimum Drainage Area
The minimum drainage area contributing to a vegetated swale is not restricted. Vegetated swales are particularly well suited to small drainage areas. 6.2.2 Maximum Drainage Area
The water quality improvement function of a vegetated swale is predicated on its ability to maintain minimal flow velocities within the channel. Therefore, within the confines of feasible cross-sectional areas, such channels cannot simultaneously be designed to convey large flow rates and/or volumes. The channel cross-section geometry, roughness, longitudinal slope, and design discharge will ultimately dictate flow velocity within the channel. The design discharge is a function of the contributing drainage area, and therefore the area must be limited such that desired velocities are maintained. In addition to meeting velocity restrictions (discussed later), the swale must be designed to convey the 10-year flow with a minimum of six inches of freeboard. 6.2.3 Site Slopes
Sites on which a vegetated swale is proposed should exhibit relatively flat topography. The maximum permissible slope of a grassed swale is six percent. Alternative BMPs should be considered when site topography is such that this maximum slope is exceeded. Grassed swales function best when their slope is a flat as practically possible. 6.2.4 Site Soils
The implementation of a grassed swale can be successfully accomplished in the presence of a variety of soil types exhibiting at least moderate permeability. However, when such a practice is proposed, a permeability test is strongly recommended. This data should be provided to the Materials Division early in the project planning stages to determine if a grassed swale is feasible on native site soils. Because ponding is induced within the swale, site soils should permit the emptying of the swale through infiltration. The inability of native site soils to completely drain a swale within a period of less than 72 hours can introduce undesirable marshy conditions and mosquito habitat. The minimum soil infiltration rate considered for construction of a grassed swale is 0.27 inches per hour. Soils underlying a vegetated grass should be USDA ML, SM, or SC. Sites exhibiting sandy soils should conform to ASTM C-33, VDOT fine aggregate grading A or B, or as otherwise approved by the Materials Division. 6.2.5 Depth to Water Table
Grassed swales inevitably infiltrate detained runoff into the subsurface. The infiltrated runoff may potentially carry a significant pollutant load. Therefore, grassed swales should not be used on sites exhibiting a seasonally-high water table of less than two feet below the proposed swale bottom.

6.2 - Site Constraints and Siting of the Facility
VDOT BMP Design Manual of Practice
3 of 22
Chapter 6 – Vegetated Water Quality Swale
6.2.6 Existing Utilities When possible, swales should not cross existing utility rights-of-way or easements. When this situation is unavoidable, permission to construct the swale over these easements must be obtained from the utility owner prior to design of the swale. When it is proposed to relocate existing utility lines, the costs associated with their relocation should be included in the overall project construction cost. 6.2.7 Wetlands When the construction of a grassed swale is planned in the vicinity of known wetlands, the designer must coordinate with the appropriate local, state, and federal agencies to identify the wetland boundaries, their protected status, and the feasibility of BMP implementation in their vicinity. The presence of existing wetlands may reveal native soils capable of accommodating a wet water quality swale at the site.

6.3 - General Design Guidelines
VDOT BMP Design Manual of Practice
4 of 22
Chapter 6 – Vegetated Water Quality Swale
6.3 General Design Guidelines The following presents a collection of design issues to be considered when designing a vegetated swale for improvement of water quality. 6.3.1 Swale Geometry Because the fundamental goal of a grassed swale is to improve the quality of runoff, it is essential to avoid any concentration of the flow within the channel. In addition to presenting problems of constructability, parabolic and triangular channels will concentrate low flows, and thus are undesirable. Similarly, rectangular channels should be avoided because of the inherent instability of their side slopes. Therefore, to satisfy both the issues of constructability and that of desired flow regime, only trapezoidal cross section channels are considered. Channel side slopes should be no steeper than 3H:1V. 6.3.2 Bottom Width Channel bottom widths of less than two feet are essentially non-constructible, and should not be considered. Conversely, bottom widths greater than six feet will tend to concentrate small flow events thereby reducing the pollutant removal ability of the swale. With a range of two to six feet established as acceptable, the precise channel bottom width becomes largely a function desired flow depth. This topic is discussed later in this section in the context of an example swale design. 6.3.3 Channel Depth The swale should be designed such that the water quality volume flows at a depth approximately equal to the grass height. For most applications this will be four inches. The overall depth should permit conveyance of the 10-year runoff event while providing a minimum of six inches of freeboard. Additionally, channel depth should be such that the check dam height does not exceed one half of the total channel depth. 6.3.4 Longitudinal Slope The generally accepted minimum constructible slope is 0.75%. The slope of a grassed swale should be as flat as practically possible for the given site topography. The site-specific allowable longitudinal slope will ultimately be governed by the desired flow depth and velocity. In general, however, this maximum slope should not exceed six percent. 6.3.5 Flow Velocity The flow velocity should be as low as practically possible in order to achieve maximum pollutant removal. Additionally, the swale must be designed such that larger runoff events do not result in re-suspension of previously deposited sediments. The following design velocities should be met:
Design Flow Permissible Velocity (fps) 2-year 4 10-year 7
Table 6.1. Permissible Flow Velocities Source: Virginia Stormwater Management Handbook, (DCR, 1999)

6.3 - General Design Guidelines
VDOT BMP Design Manual of Practice
5 of 22
Chapter 6 – Vegetated Water Quality Swale
6.3.6 Shear Stress In addition to considering the velocity in the channel, the shear stress exhibited by the flow must also be examined. Table 5.2 presents permissible shear stresses for five different classes of vegetative linings. These classes are further described later in the context of a design example.
Permissible Shear Stress, τp
Lining Category
Lining Type lb/ft2 kg/m2
Vegetative Class A 3.70 18.06 Class B 2.10 10.25 Class C 1.00 4.88 Class D 0.60 2.93 Class E 0.35 1.71
Table 6.2. Permissible Shear Stresses
Source: FHWA/Chen and Cotton (1988) 6.3.7 Swale Length The length of a grassed swale is not restricted, but rather must be sized together with the channel cross-sectional area and check dam height to provide the desired water quality storage volume. 6.3.8 Discharge Flows: When a grassed swale empties into an existing swale or other surface conveyance system, the receiving channel must be evaluated for adequacy as defined by Regulation MS-19 in the Virginia Erosion and Sediment Control Handbook, (DCR, 1992). Existing natural channels conveying pre-development flows may be considered receiving channels if they satisfactorily meet the standards outlined in the VESCH MS-19. Unless unique site conditions mandate otherwise, receiving channels should be analyzed for overtopping during conveyance of the 10-year runoff producing event and for erosive potential under the 2-year event.

6.4 - Design Process
VDOT BMP Design Manual of Practice 6 of 22
Chapter 6 – Vegetated Water Quality Swale
6.4 Design Process
This section presents the design process applicable to grassed swales serving as water quality BMPs. The pre and post-development runoff characteristics are intended to replicate stormwater management needs routinely encountered during linear development projects. The hydrologic calculations and assumptions presented in this section serve only as input data for the detailed BMP design steps. Full hydrologic discussion is beyond the scope of this report, and the user is referred to Chapter 4 of the Virginia Stormwater Management Handbook (DCR, 1999) for expanded hydrologic methodology. The following swale design will provide the technology-based water quality requirements arising from the construction of approximately 1,800 linear feet of secondary subdivision roadway in the City of Hampton. Topography is such that runoff from the road is collected in VDOT CG-6 curb and gutter and conveyed to curb inlets in a sump near the mid station of the road. The runoff is then discharged into the proposed swale. The total project site, including right-of-way and all permanent easements, consists of 5.27 acres. Pre and post-development hydrologic characteristics are summarized below in Tables 5.3 and 5.4. The project site exhibits topography typical of the coastal region of Virginia, with slopes less than two percent. Site constraints limit the swale length to 275 feet. Pre-Development Post-Development Project Area (acres) 5.27 5.27 Land Cover Unimproved Grass Cover 1.03 acres impervious cover Impervious Percentage 0 19.5
Table 6.3. Hydrologic Characteristics of Example Project Site
York County - 10
Year
Acreage Rational
C A
Constant B
Constant tc
(min) i10
(iph) Q10
(cfs) 1.03 0.9 186.78 21.22 8 6.39 5.9
York County - 2 Year
A Constant B Constant tc (min) i2 (iph) Q2 (cfs) 122.93 16.72 8 4.97 4.6
Table 6.4. Peak Roadway Runoff

6.4 - Design Process
VDOT BMP Design Manual of Practice 7 of 22
Chapter 6 – Vegetated Water Quality Swale
Step 1. Compute the Required Water Quality Volume The project site’s water quality volume is a function of the developed impervious area. This basic water quality volume is computed as follows:
ft
in
inIAWQV
12
21
IA= Impervious Area (ft2) The project site in this example is comprised of a total drainage area of 5.27 acres. The total impervious area within the site is 1.03 acres (19.5 percent of the total site area). Therefore, the water quality volume for this site is computed as follows:
3
3
870,112
560,432103.1
ft
ft
inac
ftinac
WQV
A vegetated swale must be sized to provide ponding for the computed water quality volume. This ponding occurs behind check dams (height and longitudinal spacing discussed later). Step 2. Determine the Cross-Sectional Dimensions of the Channel Ponding in the swale will occur behind check dams 18” in height. Because the cross-sectional size and configuration of the channel remain constant throughout its length, the total volume of water detained throughout the swale can be estimated by the average end area method. This volume calculation simply averages the wet cross-sectional area at the upstream and downstream ends of the channel and computes the stored volume as the product of this average area and the channel length. This approach assumes that the available ponding depth at the downstream end of the channel is equal in depth to the check dam height. The depth of water at the most remote upstream point in the channel is assumed to be zero. For a trapezoidal channel with 3:1 side slopes and 18” (1.5’) check dams, the downstream wet cross-sectional area is computed as:
5.135.12125.1
bwA
With: wb= channel base width (ft) Because the ponded upstream depth is zero, the effective cross sectional area of the swale is one half this value, expressed as:

6.4 - Design Process
VDOT BMP Design Manual of Practice
8 of 22
Chapter 6 – Vegetated Water Quality Swale
( )( ) ( ) ( )( )( )
2
5.135.12125.1
+
=b
avg
wA
The design is continued for a total channel length of 275 ft, longitudinal slope of 2%, and side slopes of 3:1. The required average cross-sectional area of the channel is computed by dividing the required water quality volume by the channel length.
23
80.6275870,1 ft
ftftAavg ==
Rearranging the earlier channel cross-sectional area expression in terms of base width, wb:
( )( )( )5.1
5.135.12 −= avg
b
Aw
The required channel base width is then computed as:
( )( ) ( )( )( ) ftwb 56.45.1
5.135.180.62=
−=
To address any underestimation in storage volume arising from the average end computation, the base width of the channel is increased to five feet. Step 3. Determine the Depth of the Channel The ten-year flood peak, Q10, is selected as the design discharge for establishing the conveyance properties of the channel, while providing a minimum six inches of freeboard. The presence of check dams in the swale introduces difficulty in modeling flow through the channel. Two approaches are presented in this example for determining the required channel depth. The first approach conceptualizes the swale as linear detention facility, with storage-indication routing employed to establish the maximum water surface elevation under 10-year runoff producing conditions. This approach yields accurate results, yet is computationally intensive. The second approach simply ignores the presence of check dams and computes the normal depth in the channel under 10-year flow conditions. This computed normal depth is added to the check dam height and the required six inch freeboard. While computationally simpler, the second approach tends to oversize the channel because it does not consider that a significant portion of the 10-year runoff volume is detained behind the check dams and, thus not contributing to computed flow depth.

6.4 - Design Process
VDOT BMP Design Manual of Practice
9 of 22
Chapter 6 – Vegetated Water Quality Swale
Step 3A. Channel Depth – Method 1 Because water is ponded in the swale behind 18” check dams, the swale behaves much like a detention facility, with flow through the swale occurring as weir flow over the check dams. Thus a reasonable approach to determining the required swale depth is to perform storage indication routing. This approach yields the maximum water surface elevation under 10-year inflow conditions. Adding 6” of freeboard to this depth provides the minimum swale depth. The first step is to establish a stage – storage relationship for the swale. Storage volumes are computed based on channel geometry, with all variables as defined:
( )( ) ( ) ( )( )( )L
dZddwV
b
×
+
=2
212
V = ponded volume (ft3) wb = channel base width (ft) d = ponded depth (ft) Z = channel side slope (ZH:1V) L = channel length (ft)
Employing the previously established channel parameters, the ponded volume can be computed solely as a function of ponded depth:
( )( ) ( ) ( )( )( )275
2
32125
×
+
=ddd
V
This calculation is employed for various incremental depths. The results are shown in Table 5.5 below, assuming a downstream bottom channel elevation of 300 ft mean sea level (MSL). Note that the approximate water quality volume is provided at a depth of 1.5 feet, equaling the check dam height.

6.4 - Design Process
VDOT BMP Design Manual of Practice
10 of 22
Chapter 6 – Vegetated Water Quality Swale
Elevation Volume
(ft3) 300 0
300.5 447 301 1,100
301.5 1,959 302 3,025
302.5 4,297 303 5,775
303.5 7,459 304 9,350
304.5 11,447 305 13,750
305.5 16,259 306 18,975
Table 6.5. Swale Stage – Storage Relationship
Next, the stage – discharge relationship is constructed. The channel check dams function as broad-crested weirs. At a depth of 18”, the weir length is calculated as follows, with parameters as previously defined:
ftftftzdwL b
14)3)(5.1)(2(5))()(2(
=+=+=
Discharge over a broad-crested weird is a function of the head acting on the weir crest. The weir equation is as follows, and used to establish the stage – discharge relationship shown in Table 5.6. Note there is no flow occurring below the check dam crest elevation.
5.1LhCQ W=
Q = Weir discharge (cfs) CW = Weir coefficient (3.0) L = Weir length (14 ft) h = hydraulic head acting on weir crest (ft)

6.4 - Design Process
VDOT BMP Design Manual of Practice
11 of 22
Chapter 6 – Vegetated Water Quality Swale
Elevation Discharge
(cfs) 301.5 0 302 15
302.5 42 303 77
303.5 119 304 166
304.5 218 305 275
305.5 336 306 401
Table 6.6. Swale Stage – Discharge Relationship
Next, using the stage – storage data, stage – discharge data, and the 10-year return frequency post-development runoff hydrograph, storage-indication routing is performed to determine the actual water surface elevation observed in the swale during this event. Figure 5.1, below, illustrates the 10-year post-development runoff hydrograph developed using the NOAA NW-14 regional rainfall I-D-F parameters recommended in the VDOT Drainage Manual.
Figure 6.1. 10-Year Post-Development Flow Entering Swale
Figure 5.2 on the following page illustrates the results of the storage-indication routing operation.

6.4 - Design Process
VDOT BMP Design Manual of Practice
12 of 22
Chapter 6 – Vegetated Water Quality Swale
Figure 6.2. Routing of 10-Year Flow Through Swale The routing reveals a maximum flow depth of 1.76 feet, equal to 0.26 feet (3.12 inches) over the check dams. Therefore, the minimum swale depth is computed as the sum of the computed water depth and the required freeboard:
inftftft 12.2726.25.076.1 ==+
Step 3B. Channel Depth – Method 2 An alternative approach for determining the necessary swale depth is to compute the normal flow depth observed during the 10-year runoff producing event, under the assumption that there is water stored behind each check dam at the onset of the 10-year runoff event. This depth is then added to the check dam height and the required freeboard depth to determine the minimum swale depth. This is a conservative approach, as it does not consider that a significant portion of the 10-year runoff volume is detained behind the check dams and, thus not contributing to computed flow depth. The computed 10-year post-development runoff exhibits a peak discharge of 5.9 cfs. The first step is to compute the flow depth (normal depth) of the 5.9 cfs discharge in the proposed channel. This task is accomplished by employing both the continuity and Manning’s equations. In order to apply Manning’s Equation, the roughness coefficient of the channel must first be established. This coefficient can be estimated initially and then adjusted as needed to satisfy flow velocity and hydraulic radius requirements. It is an iterative process since these hydraulic parameters depend, in turn, on the Manning’s n value.

6.4 - Design Process
VDOT BMP Design Manual of Practice
13 of 22
Chapter 6 – Vegetated Water Quality Swale
The first step in computing the Manning roughness coefficient is to estimate the retardance class of the vegetation lining the channel. The channel retardance factor is based on the type of vegetative lining, and can be found in Table 5.7. For this example, the proposed swale will be seeded with Kentucky bluegrass and maintained at a height of approximately six inches. This vegetative cover falls in retardance class C. The next step is to select an initial value of Manning’s n and then estimate the product of the flow velocity and hydraulic radius (VRh) in the channel, using the following SCS graph.
Figure 6.3. Relationship of Manning’s n to VRh Sources: U.S. Department of Transportation. Federal Highway Administration.
Evaluation and Management of Highway Runoff Water Quality
. Washington, D.C., 1996. Presents part of SCS Tech. Paper 61, 1954.
USDA, Soil Conservation Service, Technical Paper 61, Handbook of Channel Design for Soil and Water Conservation, 1954.
Product of Flow Velocity, V, and Hydraulic Radius, Rh

6.4 - Design Process
VDOT BMP Design Manual of Practice
14 of 22
Chapter 6 – Vegetated Water Quality Swale
Retardance
Class Cover Condition
A Weeping Lovegrass Excellent stand, tall (average 30in [76cm]) Yellow bluestem Ischaemum Excellent stand, tall (average 36in [91cm])
B Kudzu Very dense growth, uncut Bermuda grass Good stand, tall (average 12in [30cm]) Native grass mixture Good stand, unmowed
(little bluestem, bluestem, blue gamma,
and other long and short midwest grasses)
Weeping Lovegrass Good stand, (average 24in [61cm])
Lespedeza sericea Good stand, not woody, tall (average 19in [48cm])
Alfalfa Good stand, uncut (average 11in [28cm])
Weeping Lovegrass Good stand, unmowed (average 13in [28cm])
Kudzu Dense growth, uncut Blue gamma Good stand, uncut (average 11in [28cm])
C Crabgrass Fair stand, uncut (10-48in [25-120cm]) Bermuda grass Good stand, mowed (average 6in [15cm]) Common lespedeza Good stand, uncut (average 11in [28cm]) Grass-legume mixture -- summer Good stand, uncut (6-8in [15-20cm])
(orchard grass, redtop, Italian ryegrass,
and common lespedeza) Centipedegrass Very dense cover (average 6in [15cm]) Kentucky bluegrass Good stand, headed (6-12in [15-30cm])
D Bermuda grass Good stand, cut 2.5in height (6cm)
Common lespedeza Excellent stand, uncut (average 4.5in [11cm])
Buffalo grass Good stand, uncut (3-6in [8-15cm]) Grass-legume mixture -- fall Good stand, uncut (4-5in [10-13cm])
(orchard grass, redtop, Italian ryegrass,
and common lespedeza) Lespedeza sericea After cutting to 2in in height (5cm) Very good stand before cutting
E Bermuda grass Good stand, cut to 1.5in in height (4cm) Bermuda grass Burned stubble
Table 6.7. Classes of Retardance by Vegetation Type and Height
Source: Adapted from Mays (2005), and FHWA (1996).

6.4 - Design Process
VDOT BMP Design Manual of Practice
15 of 22
Chapter 6 – Vegetated Water Quality Swale
Employing an initial trial Manning’s roughness coefficient of 0.10, Figure 5.3 yields an estimated value of VRh as 0.73 ft2/s. Next, the actual value of VRh corresponding to a roughness coefficient of 0.10 is computed. The actual VRh value is determined using the Manning’s equation as follows:
5.067.149.1 SRn
VR hh =
The following flow parameters are considered for this example: Channel base width 5ft Channel side slopes 3H:1V Channel longitudinal slope 2.00% Manning’s Roughness Coefficient 0.10 Design Discharge 5.9 cfs Employing VTPSUHM to solve the Manning’s equation for these parameters yields the following results:
Figure 6.4. Results of Initial Manning’s Roughness of 0.10
The product of the flow velocity and hydraulic radius is found to be 0.65 ft2/s. This value is now used to determine a new Manning’s roughness value from Figure 5.3. Entering Figure 5.3 with a VRh value of 0.65 ft2/s and a vegetative retardance class of C yields a roughness coefficient of 0.12. Employing the new roughness coefficient with all previously defined flow and channel size parameters yields the following results:

6.4 - Design Process
VDOT BMP Design Manual of Practice
16 of 22
Chapter 6 – Vegetated Water Quality Swale
Figure 6.5. Results of Second Manning’s Roughness of 0.12 (Q10) The new product of the flow velocity and hydraulic radius is found to be 0.62 ft2/s. This value is less than five percent different than the estimated value of 0.65 ft2/s, and thus is acceptable. Had the results yielded a discrepancy of greater than five percent, subsequent iterations would have been carried out until convergence was observed. With an acceptable Manning’s roughness coefficient established, the next step is to compute the required channel depth. Employing the aforementioned flow parameters, we now compute the 10-year flow depth (normal depth) in the channel by Manning’s equation. The VTPSUHM results of this calculation are shown as follows.
Figure 6.6. Results of Normal Depth Calculation (Q10)
0.713
6.4 - Design Process
VDOT BMP Design Manual of Practice
17 of 22
Chapter 6 – Vegetated Water Quality Swale
The output exhibits a 0.713 ft flow depth (normal depth) for the 10-year return frequency discharge. Examining the VTPSUHM output (Figure 5.5) on the previous page reveals that the flow velocity of 1.16 fps is less than the maximum allowable velocity of 7 fps for the 10-year return frequency flow. The minimum depth of the channel can now be computed by summing the segmental depths, based on the conservative assumption that there is an 18-inch ponded depth in the swale prior to the arrival of the 10-year storm hydrograph. The Q10 normal depth will then be added to the ponded depth under this assumption.
dmin = dPonded + d10 yr. storm + dFreeboard
dmin = 1.5ft + 0.71ft + 0.5ft = 2.71ft = 32.5in
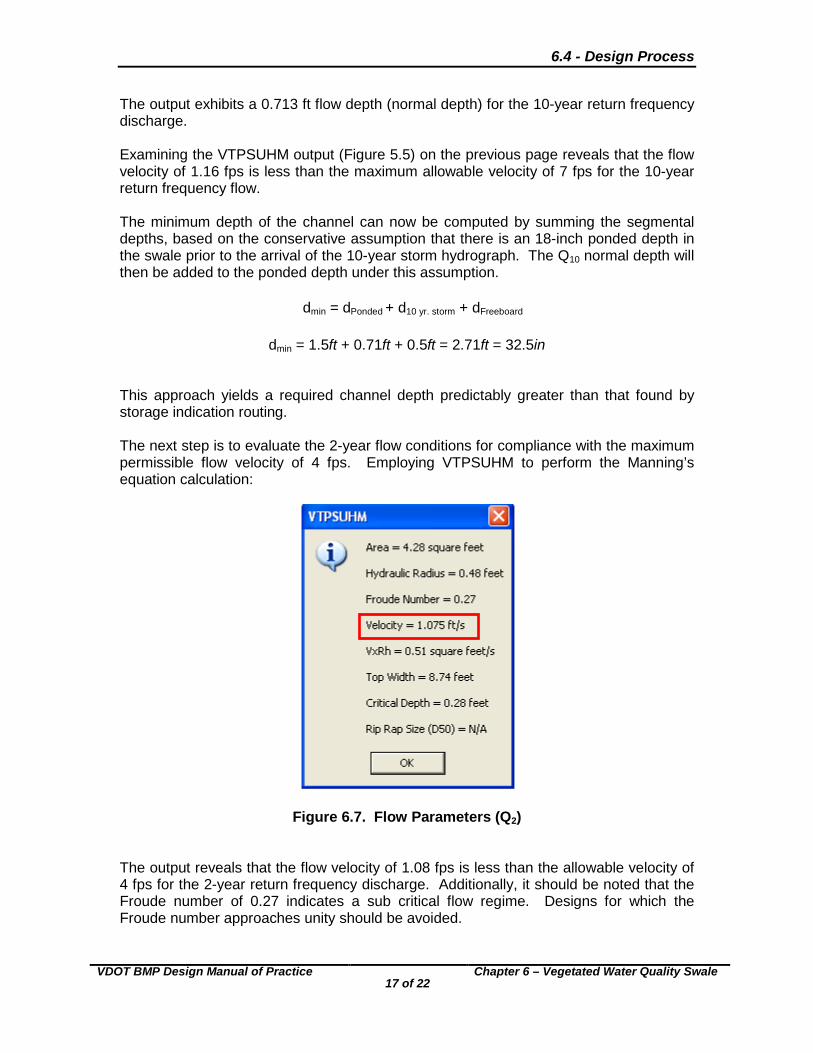
This approach yields a required channel depth predictably greater than that found by storage indication routing. The next step is to evaluate the 2-year flow conditions for compliance with the maximum permissible flow velocity of 4 fps. Employing VTPSUHM to perform the Manning’s equation calculation:
Figure 6.7. Flow Parameters (Q2) The output reveals that the flow velocity of 1.08 fps is less than the allowable velocity of 4 fps for the 2-year return frequency discharge. Additionally, it should be noted that the Froude number of 0.27 indicates a sub critical flow regime. Designs for which the Froude number approaches unity should be avoided.

6.4 - Design Process
VDOT BMP Design Manual of Practice
18 of 22
Chapter 6 – Vegetated Water Quality Swale
Step 3C. Channel Depth – Method 3 A third alternative for computing the required channel depth was developed by Dr. Osman Akan, Associate Dean of Engineering and Professor of Civil Engineering at Old Dominion University. First reported in 2001 by Akan and Hager in the ASCE Journal of Hydraulic Engineering, this method employs charts developed from a dimensionless form of the Manning equation. Application of these charts permits a direct solution of channel depth and width. The results obtained by this method are, generally, comparable to the previously described Method 2 normal depth calculation. However, for side slopes milder than 2:1, the Akan direct solution approach may overdesign the swale size by approximately 5%. Readers interested in applying the Akan direct solution method are referred to: Akan, A. O. (2006). Open Channel Hydraulics. Elsevier/Butterworth-Heinemann, Burlington, MA, ISBN-13:978-0-7506-6857-6 and ISBN-10: 0-7506-6857-1 Table 5.8 summarizes the computed channel depth for the three design approaches.
Design Method Computed Swale Depth (ft) 1 - Hydrograph Routing 2.26 2 - Normal Depth Calculation 2.71 3 - Akan-Hager Direct Solution Method 2.72*
Table 6.8. Summary of Computed Channel Depth
*Computed value provided by Akan (personal communication). It should be noted at this point that, (adhering to previously established design guidelines) the channel check dam height should not exceed one half of the total channel depth. The check dams employed in this design were assumed to be 18 inches in height. Therefore, the minimum channel depth that should be considered is three feet. Per the calculations presented in Step 3, a channel depth of three feet yields a conservative design which provides more than the minimum six inches of a freeboard under 10-year inflow conditions. The check dam height could be reduced, but doing so would necessarily require an increased channel cross-sectional area to provide storage for the computed water quality volume. Increased channel area results in a need for greater right-of-way acquisition, and this is generally undesirable. A channel depth of three feet is therefore adopted. Step 4. Ensure Allowable Levels of Shear Stress The final step in verifying the adequacy of the proposed design is a check to ensure that the shear stress exhibited by the flow does not exceed the allowable values previously presented (Table 5.2). The average shear stress associated with the flow is given by the following equation:

6.4 - Design Process
VDOT BMP Design Manual of Practice
19 of 22
Chapter 6 – Vegetated Water Quality Swale
0RSDesign γτ =
γ = specific weight of water (62.4lb/cf) R = design hydraulic radius for the 10-year event (ft) S0 = channel longitudinal slope (ft/ft)
We note parenthetically that due to non-unifrom velocity distribution in the cross section, the maximum shear stress developed on the bed and sides of most trapezoidal channels of practical interest will be approximately 1.0 and 0.75 times the average shear, respectively. (Chow,1959). The output from the 10-year flow reveals a hydraulic radius of 0.54 ft. Employing the previously presented equation, shear stress on the channel is found as follows:
23 67.0)020)(.54.0)(4.62(ftlb
ftftft
ftlb
Design ==τ
For a vegetative lining with a Class C retardance factor, the permissible shear stress is 1 lb/sf. Thus, the proposed design is acceptable. Step 5. Investigation of Alternative Swale Designs Best Hydraulic Section In the design of non-erodible stormwater conveyance channels, the concept of the best hydraulic section is often employed. The best hydraulic section is the channel configuration for which wetted perimeter is minimized for a fixed cross-sectional area and desired discharge. In other words, the hydraulic radius is maximized. The best hydraulic section exhibits side slopes of 0.58:1. These excessively steep side slopes lend themselves well to concrete or other manmade systems, but are usually impractical for vegetated swales. For the swale of interest in this design (base width of 5 ft and side slopes of 3:1), computing the swale depth by the best hydraulic section methodology yields a value of 15.4 feet. While potentially useful as a starting design point, best hydraulic section methodology will usually require significant modification to section properties to accommodate local site conditions. Design of an erodible channel, such as the vegetated water quality swale, should be carried out according to allowable shear stress principles, as shown in the above example. Vegetated Swale Without Check Dams Another design possibility is to construct the swale with no check dams. The primary purpose of the check dams is to level the grade, decrease erosion, and increase the contact time for the flow as it passes through the vegetative cover. Without check dams the length of equivalent swale must increase. For many sites, this alternative will not be feasible because of the excessive length required to achieve an acceptable hydraulic residence time for the flow entering the channel. This length calculation is shown as follows:

6.4 - Design Process
VDOT BMP Design Manual of Practice
20 of 22
Chapter 6 – Vegetated Water Quality Swale
L = V Tr (60s/min)
L = Required swale length (ft) V = Flow velocity for the 10-year return event (ft/s) Tr = Hydraulic residence time in minutes (9minutes minimum, FHWA, 1996)
Previous calculations show a flow velocity of 1.2 ft/s for the 10-year return event. For the example presented here, the required swale length is calculated as:
L = (1.2 ft/s)(9min)(60 s/min) = 648 ft
When vegetated swales employ check dams, ponding results in easy attainment of the 9 minute hydraulic residence time. Consequently, swale length can be reduced greatly, as illustrated in the initial design where the length was 275 feet. BMP swales without check dams are intended to serve only as a single treatment step in a series of multiple BMPs. In the absence of check dams, infiltration of runoff in the swale is negligible. Step 6. Check Dam Design Check dam materials and construction techniques shall conform to those described in Minimum Standard 3.13 of the Virginia Stormwater Management Manual (DCR, 1999). All check dams shall be equipped with toe protection as described in Minimum Standard 3.13. When the check dam material is riprap or gabion baskets, the check dams shall be underlain by a filter fabric approved by the Materials Division. Check dams shall be placed longitudinally in the channel such that the dam height and the channel slope combine to provide the desired water quality volume. After establishing the swale dimensions as previously outlined, the total number of check dams required is computed as follows:
SHLd =
Ld = longitudinal distance behind each check dam (ft) H = depth of ponding behind check dam (ft) S = channel longitudinal slope (ft/ft)
ft
ft
Ld 7502.0
)"12
1)("18(==
The total number of check dams is then computed by dividing the overall
swale length by Ld:
67.375275# ==
ftftDams Use four check dams
In addition to providing a minimum of six inches of freeboard during 10-year flow conditions, the check dams should be equipped with a notch to ensure that the 2-year
6.4 - Design Process
VDOT BMP Design Manual of Practice
21 of 22
Chapter 6 – Vegetated Water Quality Swale
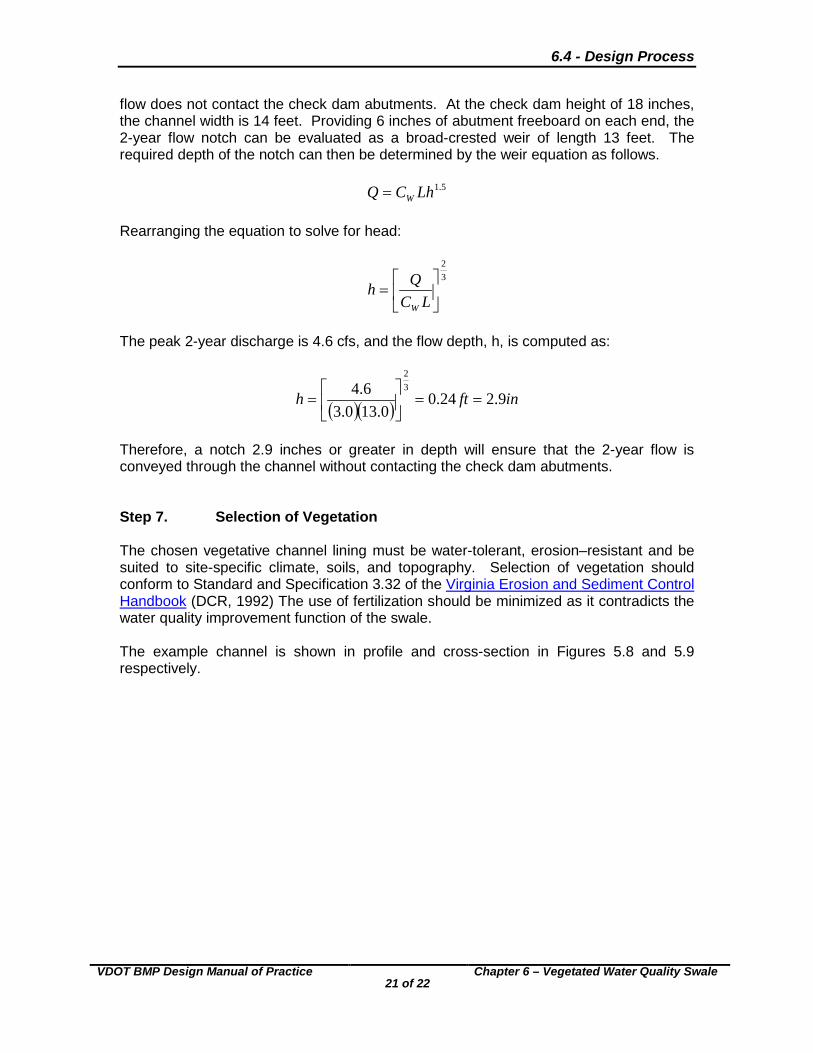
flow does not contact the check dam abutments. At the check dam height of 18 inches, the channel width is 14 feet. Providing 6 inches of abutment freeboard on each end, the 2-year flow notch can be evaluated as a broad-crested weir of length 13 feet. The required depth of the notch can then be determined by the weir equation as follows.
5.1LhCQ W=
Rearranging the equation to solve for head:
32
=
LCQhW
The peak 2-year discharge is 4.6 cfs, and the flow depth, h, is computed as:
( )( ) infth 9.224.00.130.3
6.4 32
==
=
Therefore, a notch 2.9 inches or greater in depth will ensure that the 2-year flow is conveyed through the channel without contacting the check dam abutments. Step 7. Selection of Vegetation The chosen vegetative channel lining must be water-tolerant, erosion–resistant and be suited to site-specific climate, soils, and topography. Selection of vegetation should conform to Standard and Specification 3.32 of the Virginia Erosion and Sediment Control Handbook (DCR, 1992) The use of fertilization should be minimized as it contradicts the water quality improvement function of the swale. The example channel is shown in profile and cross-section in Figures 5.8 and 5.9 respectively.

6.4 - Design Process
VDOT BMP Design Manual of Practice
22 of 22
Chapter 6 – Vegetated Water Quality Swale
Figure 6.8. Profile of Example Swale Not to Scale
Figure 6.9. Cross-Sectional View of Example Swale Not to Scale