chapter 6 advanced t4c routines july2010 6... · 6 advanced t4c routines 6.1 enter groups &...
TRANSCRIPT

Advanced T4C Routines Page 1 of 43
CHAPTER 6 Advanced T4C routines This chapter describes a number of advanced T4C routines, like how to create graphs / reports and how to enter events such as milk separation and treatment plans, settings for cell count (MQC-C) or routing of cows.

Advanced T4C Routines Page 2 of 43
CONTENTS 6 Advanced T4C Routines
6.1 Enter Groups & Priorities .......................... ..........................................................3
6.2 Priority feeding ................................... ..................................................................5
6.3 Milk separation .................................... .................................................................6
6.4 Cell count with MQC-C.............................. ...........................................................7
6.5 Fat & Protein Indication ���� MQC-2 ......................................................................9 6.5.1 Calculation method .................................................................................................... 9 6.5.2 KPI’s .......................................................................................................................... 9 6.5.3 Reports...................................................................................................................... 9 6.5.4 Cow Card................................................................................................................. 11 6.5.5 Graphs..................................................................................................................... 12 6.5.6 Calibration and re-calibration ................................................................................... 13 6.5.7 Specific remarks in regard to calibration .................................................................. 13 6.5.8 Re-calibration .......................................................................................................... 14 6.5.9 Sensor replacement................................................................................................. 14
6.6 Animal routing (separation of cows) ................ ................................................15 6.6.1 Individual manual separation (e.g. treatment or insemination) ................................. 15 6.6.2 Group separation (e.g. high need animals) .............................................................. 16 6.6.3 Automatic separation (e.g. failed milkings or cow in heat)........................................ 17
6.7 Medicine list...................................... ..................................................................18
6.8 Breeding Sires ..................................... ...............................................................19
6.9 Disease list....................................... ...................................................................20
6.10 Define Treatment plans............................. .........................................................21
6.11 Assign a Treatment plan............................ ........................................................23
6.12 Overview of treatments............................. .........................................................25
6.13 Create or adjust Reports & Graphs.................. .................................................26 6.13.1 Adjusting a T4C report ............................................................................................. 26 6.13.2 To create a graph .................................................................................................... 30
6.14 Batch entry Basic .................................. .............................................................39
6.15 Batch entry Condition .............................. ..........................................................40
6.16 Batch entry Sampling............................... ..........................................................41
6.17 Create a Data Back-up .............................. .........................................................42

Advanced T4C Routines Page 3 of 43
6.1 Enter Groups & Priorities Groups Cows can be assigned to a Group manually or automatically. In case of automatic grouping criteria like lactation number, reproduction status, or age determine the group allocation.
1. Navigation: Data Entry 2. Menu: Groups 3. Submenu: Groups 4. Groups can be edited (1) removed (2) or details can be checked (3) 5. A new group can be added by clicking on the ‘Add’ button
Figure 1 Entry of Groups
Use the ‘Group status’ Automatic to assign cows automatically to a group based on the selected criteria. The criteria are shown on the right hand side if the group status is set to "Automatic"
Figure 2 Automatic group selection based on the criteria Use ‘Group Status’ Manual to manually assign cows to a group. In that case the group number can be set on the individual Cow Card. Group status ‘Default’ is only used for cows which do not fit in any other group
Tip : If the search field is not visible, click on the icon. Search fields will be shown

Advanced T4C Routines Page 4 of 43
Priorities Group priorities are used to determine which group is preferred if an animal fulfils the criteria of more than one automatic group. T4C checks the priority setting from top to bottom. This means T4C checks if a cow fits in the first group. If yes, then the cow will be allocated to that group. If no, then T4C checks if the cow fits to the next group and so on…. This view shows the priority of all automatic groups. The priority of a group can be changed:
1. Navigation: Data Entry 2. Menu: Groups 3. Submenu: Priorities 4. With the Up and Down button the Group priority can be set to a higher or lower level
Figure 3 Set group priorities

Advanced T4C Routines Page 5 of 43
6.2 Priority feeding Priority feeding can be used if an exceptional cow can not finish the allowed concentrates in the time she is milked in the robot. Example: • Cow can get 3000 g (6.6 lb) per visit • Box time is 7 min • Feed speed is 350 g/min (12.3 ounce/min) This means she can eat 2450 gr of concentrates in the 7 min visit to the robot. If Priority feeding is set to ‘Yes’ the cow will stay in the robot until the 3000 g is fed. In this case the cow gets another 550 g and will stay in the robot for another one and a half minute. Important : Priority feeding has a negative effect on the robot capacity and should only be used by exception. To set Priority feeding:
1. Navigation: Data Entry 2. Menu: Daily entry 3. Action : Milk settings 4. Select (or add) the animal by entering the number in the entry field
Figure 4 Set Priority feeding A new window opens
1. Select for priority feeding: Yes 2. Save settings
Figure 5 Entry screen to activate priority feeding

Advanced T4C Routines Page 6 of 43
6.3 Milk separation To enter a milk separation:
1. Navigator: Data Entry 2. Menu: Daily Entry 3. Select: Milk Separation 4. Enter the animal number and click ‘Select’
Figure 6 Overview active milk separations A new window opens when selecting a cow
1. Enter end date milk separation period 2. Select the Separation Milk Tank
destination 3. Click ‘Save’
Figure 7 Activate a new milk separation Figure 8 Confirmation screen milk separation
• After saving data the confirmation screen appears (fig. 8) • All 3 actions must be confirmed with a [ ] sign (Created, Send and Confirm ) • If this is not the case the milk separation is not complete. Contact your Lely Centre
Tip: Active milk separations can be viewed/checked: Data Entry – Daily Entry – Action: Milk Separations’. An overview of all cows on Milk separations are shown including the treatment end date. If a cow has 2 milk separations e.g. 1 for colostrum and 1 for a treatment, both milk separations are shown with the end date, for good monitoring of milk separations.
Important! Always enter a milk separation in T4C before treating a cow! To prevent wrong milk in the tank because the cow appears in the robot before the treatment is entered in T4C.

Advanced T4C Routines Page 7 of 43
6.4 Cell count with MQC-C If a MQC-C is available on the robot, the cell count can be measured on an individual bases. SCC (Somatic Cell Count) values are divided into 5 categories; Class Cell count value from…till I 0 - 200.000 II 200.001 - 400.000 III 400.001 - 800.000 IV 800.001 - 2.000.000 V 2.000.001 - > Figure 9 Categories cell count values Activating SCC:
1. Navigation: Data Entry 2. Menu: Settings 3. Submenu: Milking 4. Tab: During Milking
SCC sampling can be set on herd, group or individual level using the ‘SCC sampling column‘ (1).
Figure 10 Setting for SCC Sampling A new window is opened by clicking on the SCC Sampling column (for an individual animal, group or herd)
1. Select ‘Herd’ 2. Select for SCC Sampling: e.g.
Once a day (Drop down box with choices)
3. Click ‘Save’
Figure 11 Activating SCC Sampling

Advanced T4C Routines Page 8 of 43
To de-active SCC Sampling select: “No sampling’’ The SCC Sampling can be set in three ways
1. All milkings (SCC measured every milking) 2. Once a day (SCC measured the first milking of each day) 3. Task (SCC measured depending on the settings in the other columns of the page)
Figure 12 Setting possibilities for SCC Sampling Addition Task If a SCC sample needs to be taken automatically based on an attention ‘Udder Health’ or ‘Milk production’ than the columns (2) and/or (3) need to be set to ‘Yes’. For both options: the first milking after the milking with the attention is sampled (because an attention is generated at the end of a milking and a sample is taken during the milking). Automatic samples can also be taken every so many weeks on a regular basis. Based on the ‘No. of weeks between the 3 SCC samples’ (4) and the chosen day (5), three SCC samples can be taken automatically (e.g. you can set that every 3 weeks, starting on a Tuesday, 3 SCC samples will be taken). If such a task is set, the SCC samples will be taken until a cow has 3 measurements. This means for a cow that is being milked 3 times per day, she will only be sampled 1 day and for a cow that is only being milked once a day she will be sampled for three days. It is possible to select more starting days.
Advanced T4C Routines Page 9 of 43
6.5 Fat & Protein Indication ���� MQC-2
The term “indication” is used because the MQC-2 does not measure the actual fat and protein % in the milk, but provides an indication of these levels. All cows have their own genetically determined range of smaller or larger fat globules. The light used in the MQC to calculate fat and protein indications corresponds to a certain fat globule size. It might be that the MQC systematically differs from the analysis of the laboratory, however, still the real trend in fat changes during lactation is perfectly shown by the MQC. Fat and protein indications are available in T4C versions 3.1.0.28 and higher. On the robot, the MQC software should be version 1.20 SR3.
6.5.1 Calculation method • Individual fat and protein indications are available as an average of the last 5 milkings. • Herd averages are calculated from the individual cow data of the last milking
6.5.2 KPI’s
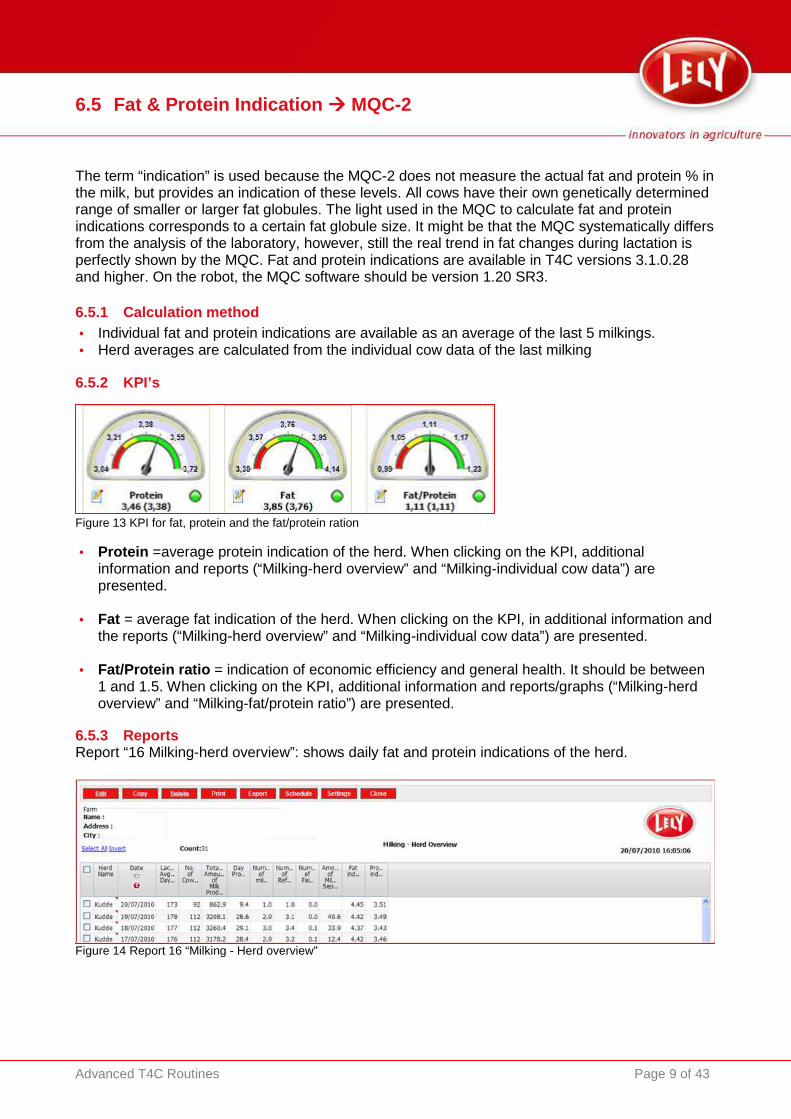
Figure 13 KPI for fat, protein and the fat/protein ration • Protein =average protein indication of the herd. When clicking on the KPI, additional
information and reports (“Milking-herd overview” and “Milking-individual cow data”) are presented.
• Fat = average fat indication of the herd. When clicking on the KPI, in additional information and
the reports (“Milking-herd overview” and “Milking-individual cow data”) are presented. • Fat/Protein ratio = indication of economic efficiency and general health. It should be between
1 and 1.5. When clicking on the KPI, additional information and reports/graphs (“Milking-herd overview” and “Milking-fat/protein ratio”) are presented.
6.5.3 Reports Report “16 Milking-herd overview”: shows daily fat and protein indications of the herd.
Figure 14 Report 16 “Milking - Herd overview”

Advanced T4C Routines Page 10 of 43
Report “42 Milking- Cow daily production”: shows per cow the fat and protein indications as well as the fat/protein ratio. At cow level this ratio give information on rumen health and energy balance in early lactation.
Figure 15 Report “Milking- Daily production”
• When the fat/protein ratio is > 1.5, the box is marked red, and the column “remark” shows
“ketosis” indicating a high chance of a ketosis for this cow. • When the fat/protein ratio is < 1, the box is marked red, and the column “remark” shows
“inversion” indicating a high chance of acidosis for this cow. Both remarks are limited to cows <150 days in lactation to avoid too many false positives. The number of cows with remarks may differ from the regular milk testing because different parameters are used. For example in the Netherlands, ketosis is defined by the NRS (milk testing) as a cow with a difference between fat and protein % of at least 1,5 and protein % being lower than 3,25.

Advanced T4C Routines Page 11 of 43
6.5.4 Cow Card
The tab ‘Daily Overview’ shows the individual daily fat and protein indications
Figure 16 Cow Card tab “Daily Overview” The tab ‘Lactation overview’ shows the average fat and protein indications, as well as absolute quantities of solids produced over the lactations .
Figure 17 Cow Card: tab "Lactation overview” The tab ‘Daily graph’ displays the fat and protein indication (fat = purple line, protein = green line)
Figure 18 Cow Card: tab “Daily Graph”

Advanced T4C Routines Page 12 of 43
6.5.5 Graphs The graph 'Milking- fat/protein ratio' is a scatter plot in which the lower and upper boundaries of 1 (inversion boundary) and 1.5 (ketosis boundary) are indicated by a solid line. This gives the farmer a quick overview of which cows are outside the boundaries and how the herd is currently performing at different stages of lactation.
Figure 19 Analysis/Reports: Graph ‘Milking - Fat Protein Ration’ In the graph “Analyze – Cow lactations” the fat and protein indications throughout lactation are shown. This allows the farmer to evaluate herd performance at different stages of lactation, in relation to milk yield, weight, robot visit behaviour and feed.
Figure 20 Analysis/Reports: Graph ‘Analyse Cow Lactations’

Advanced T4C Routines Page 13 of 43
6.5.6 Calibration and re-calibration
Before fat and protein indication can be used, calibration has to be performed. This is done by using the result of regular milk testing in a laboratory. Initial calibration has to be performed as follows: 1. The robotic milking system with the MQC-2 (standard on the Lely Astronaut A3 Next) should be
running for at least 5 days 2. For a reliable calibration, a minimum number of 90 samples per robot should be taken. Below
60 successful samples per robot, calibration cannot be performed and no fat and protein indications will be shown in T4C.
3. The milk lab testing returns the fat and protein results per cow. So from cows that were sampled twice, one average result is shown on the milk testing list. (If the sample results are supplied with a value per sample, then the average value per cow has to be calculated manually and entered in T4C)
4. Automatically read in the milk testing results or enter the fat and protein data manually for each cow in the menu “Data entry/daily entry/batch sampling”. When entering data in “Batch sampling” set the date field to the date of milk testing (See also chapter 6.16: Batch Sampling).
Figure 21 Entry screen Fat and Protein values Note : make sure the date is set to the date of the milk s ampling (not the date of entry) • When saving the data, T4C automatically matches the MQC-data of the milkings that were
sampled to the corresponding milk testing-results. Together with the MQC-data of the 5 milkings prior to the sampled milkings, this data is then used for calibration.
• Only when all previous steps are completed, fat and protein indications are displayed in T4C.
6.5.7 Specific remarks in regard to calibration • Below 60 samples, the system cannot perform the calibration and fat and protein indications
will not be shown. • It is not possible to use the data of two consecutive normal milk sampling routines to obtain
sufficient “samples”. • A cow that was not sampled at the time of calibration does not have to be sampled individually
to have reliable fat and protein indications when she is being milked.

Advanced T4C Routines Page 14 of 43
6.5.8 Re-calibration • Re-calibration has to be performed every 6 months to keep accurate fat and protein indications. • The protocol for re-calibration is identical to the initial calibration protocol.
6.5.9 Sensor replacement • When one or two sensors of the MQC needs to be replaced, the system will use the three or
two remaining sensors to calibrate the new quarter sensors automatically. This will require 500 milkings, during those 500 milkings the fat and protein results are calculated by the sensors that were kept in place. After these 500 milkings the new sensors are calibrated and the fat and protein indications are shown at cow level again.
• When more than three sensors or a complete MQC are/is replaced, a new calibration is
required.
Note: Avoid changing MQC-2 sensors during a milk sampling for calibration.
• If a sensor change is necessary make sure this is done 5 days prior to the sampling. • If a sensor is changed during sampling for calibration, the calibration cannot be performed and
a new sampling and calibration is necessary.

Advanced T4C Routines Page 15 of 43
6.6 Animal routing (separation of cows) Cows can be routed (separated) by a selection gate behind the robot or by a Grazeway routing box in three different ways, which are explained in the following three chapters
1. Individual manual separation (e.g. treatment or insemination) 2. Group separation (e.g. high need animals) 3. Automatic separation (e.g. failed milkings or cow in heat)
6.6.1 Individual manual separation (e.g. treatment or insemination)
1. Navigation: Data Entry 2. Menu: Daily Entry 3. Select in the Action field: ‘Routing’ 4. Select the animal by entering the number and click ‘Select’:
Figure 21 Selection screen routing A new window opens with the routing events of the selected cow
1. The destination can be selected
using ‘Routing Area’ 2. All day routing or if you uncheck
the box, a time frame can be selected (from.. till…)
3. Click ‘Save’ Figure 22 Entry screen individual routing
Tip : This overview screen can be used to check which cows are currently separated.
Tip: Other ways to enter separation events and other individual cow information: - Enter the cow number at the bottom of the main menu in the search box and click ‘Search’ - In the top of the cow card an event can be selected from the pick list followed by clicking ‘Execute’ - The same event list is also available in the top of all reports, to enter events directly in the report.
Advanced T4C Routines Page 16 of 43
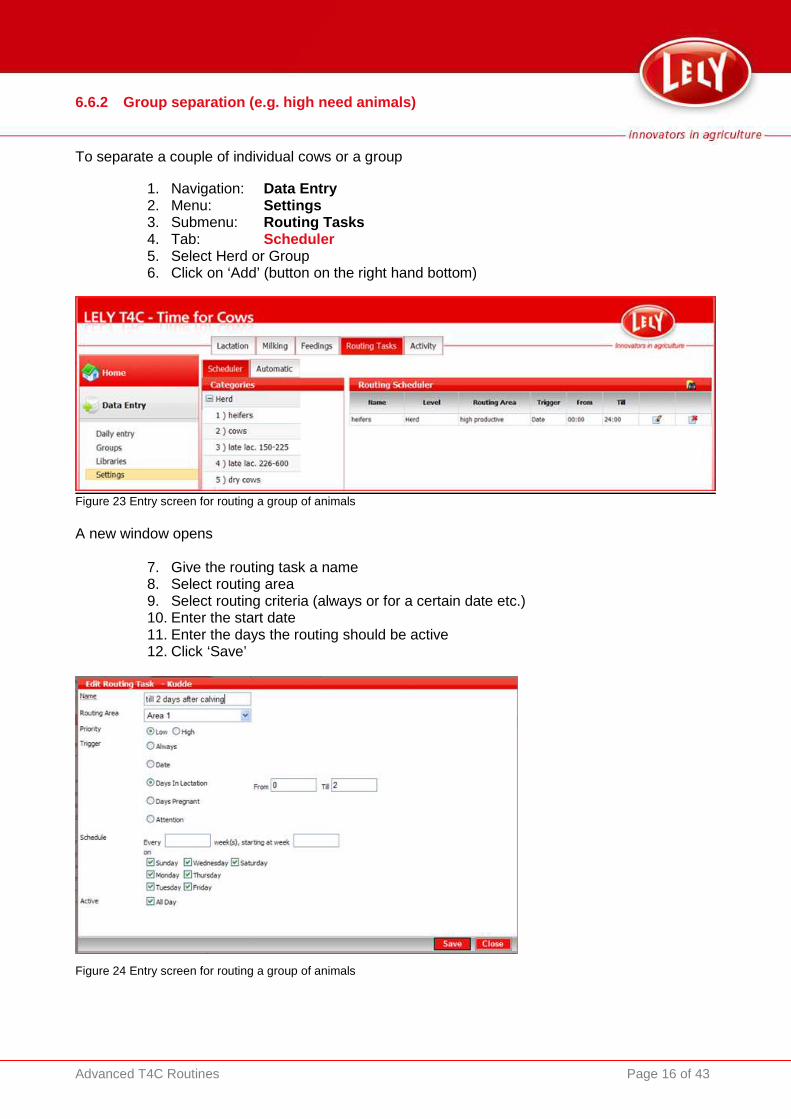
6.6.2 Group separation (e.g. high need animals) To separate a couple of individual cows or a group
1. Navigation: Data Entry 2. Menu: Settings 3. Submenu: Routing Tasks 4. Tab: Scheduler 5. Select Herd or Group 6. Click on ‘Add’ (button on the right hand bottom)
Figure 23 Entry screen for routing a group of animals A new window opens
7. Give the routing task a name 8. Select routing area 9. Select routing criteria (always or for a certain date etc.) 10. Enter the start date 11. Enter the days the routing should be active 12. Click ‘Save’
Figure 24 Entry screen for routing a group of animals

Advanced T4C Routines Page 17 of 43
6.6.3 Automatic separation (e.g. failed milkings or cow in heat)
1. Navigation: Data Entry 2. Menu: Settings 3. Submenu: Routing Tasks 4. Tab: ‘Automatic’ 5. Select Herd or Group 6. Set the routing criteria 7. Check the boxes of the criteria which should be used. 8. To activate a criteria for only a part of the day, uncheck the box ‘All day’ , to get access to
additional settings to enter a ‘from .till…’ time 9. Click ‘Save’
Figure 25 Entry screen automatic routing

Advanced T4C Routines Page 18 of 43
6.7 Medicine list Medicines can be entered in the T4C Library. To maintain the medicine list:
1. Navigation: Data Entry 2. Menu: Libraries 3. Submenu: Medicine 4. Click on ‘Add’ (button on the right hand bottom)
Figure 26 Overview screen medicines A new window opens
Figure 27 Entry screen medicines
5. Add medicine information (waiting period, dose etc.) 6. Click ‘Save’
Note : Make sure that all information from the label of the medicine is entered; including quantities, number of treatments per day, length of treatment in days and the period milk should be separated.

Advanced T4C Routines Page 19 of 43
6.8 Breeding Sires Artificial insemination (AI) sires can be entered in the T4C Library. On farm bulls (e.g. for heifers) must be entered as a real animal in the database and in the Cow Card the setting ‘Gender’ must be set to ‘Male’ and ‘Use as a Sire’ must be set to ‘Yes’. To maintain the AI sire list:
1. Navigation: Data Entry 2. Menu: Libraries 3. Submenu: Sires 4. Click ‘Add’ (button on the right hand bottom) to add a Sire 5. Use the Edit icon to edit sire information
Figure 28 Overview screen AI sires A new window opens
Figure 29 Entry screen new sires
6. Add sire information (name, number and code) Active Yes means ‘currently in use’ 7. Click ‘Save’

Advanced T4C Routines Page 20 of 43
6.9 Disease list To enter a disease:
1. Navigation: Data Entry 2. Menu: Libraries 3. Submenu: Diseases 4. Click on ‘Add’ (button in the right hand bottom) to add a disease 5. Use the Edit icon to edit disease information
Figure 30 Overview screen Diseases A new window opens
Figure 31 Entry screen diseases
6. Add disease information (name, category etc.) 7. Click ‘Save’

Advanced T4C Routines Page 21 of 43
6.10 Define Treatment plans T4C keeps track of all health and medicine records. To limit the time involved in entering all the information, so called Treatment Plans can be defined. Each plan contains a combination of diagnoses, curative health events, used medication, milk separation events etc. and can be selected when a certain disease is entered for a cow. Before entering a treatment protocol, take care that the Diseases and Medicine libraries are filled in completely according to the previous chapters. To add or maintain the Treatment Plans library:
1. Navigation: Data Entry 2. Menu: Libraries 3. Submenu: Treatment plans 4. Click on ‘Add’ (button on the right hand bottom) to add a Treatment plan 5. Use the Edit icon to edit a treatment plan
Figure 32 Entry screen treatment plan for e.g. clinical mastitis A new window opens
Figure 33 Overview screen treatment plans

Advanced T4C Routines Page 22 of 43
6. Select disease category 7. Select disease 8. Add medicine by clicking on ‘Add medicine’
A new window opens
Figure 34 Entry screen for medicines
9. Select medicine category 10. Select a medicine (or click ‘Add medicine’ to add a new medicine to the library) 11. Click ‘Save’
Figure 35 Entry screen treatment plan for e.g. clinical mastitis
12. Medicine is added to the plan 13. Click ‘Add Medicine’ again in case a second medication is required. 14. Click ‘Save’

Advanced T4C Routines Page 23 of 43
6.11 Assign a Treatment plan To assign a treatment plan to a cow:
1. Navigation: Data Entry 2. Menu: Daily Entry 3. Select in the Action field: ‘Health Treatment’ 4. Select the animal by entering the number and click ‘Select’
Figure 36 Enter a Health treatment A new window opens with the treatment history of the selected cow To activate a treatment plan (e.g. for Clinical mastitis):
1. Select category: Mastitis (cl.) 2. Select disease: Mastitis (cl.) unknown 3. The treatment plan is automatically added (including waiting periods etc.), but can be
adjusted by selecting ‘Fill in Yourself’ or ‘No Treatment’ 4. Do not forget to mark the ‘Location’ of the treatment
Tip: Other ways to enter separation events and other individual cow information: - Enter the cow number at the bottom of the main menu in the search box and click ‘Search’ - In the top of the cow card an event can be selected from the pick list followed by clicking ‘Execute’ - The same event list is also available in the top of all reports, to enter events directly in the report.

Advanced T4C Routines Page 24 of 43
Figure 37 Entry screen Health Treatment
The field 'Calculation' shows the treatment end date, the medicine, advice waiting period and separation end date. If a medicine has a waiting period, after saving the treatment data, the confirmation screen appears
• All 3 actions must be confirmed with a [ ] sign (Created, Send and Confirm)
• When this is not the case the milk separation went wrong, contact your Lely Centre.
• Check confirmation in the Milk separation overview[Data Entry-Daily Entry-Milk separations]
Figure 38 Confirmation screen milk separation

Advanced T4C Routines Page 25 of 43
6.12 Overview of treatments Health treatments can be viewed on the Cow Card or in a report. On the Cow Card the tab ‘Health Events’ show an overview of treatments including details.
1. Navigation: Data Entry 2. Menu: Daily Entry 3. Open the Cow Card for a specific cow 4. Open the tab ‘Health Events’
Figure 39 Individual overview Health Events in the Cow Card A list of current treatments are shown in the report ‘Health Overview- Medicine usage’ (fig. 39a)
Figure 39 a. Report Health overview – Medicine usage

Advanced T4C Routines Page 26 of 43
6.13 Create or adjust Reports & Graphs T4C has a large set of Lely default reports and graphs which can be adjusted by making a copy of the report and edit it’s settings This chapter explains how to adjust a report or make a graph:
6.13.1 Adjusting a T4C report In the menu Analysis/Reports the submenu ‘Reports’ displays all available reports and graphs in three columns:
1. Favorite Reports: list of the most used reports and graphs 2. Lely Default Reports: Reports and graphs that are part of the T4C installation. The reports
and graphs can be edited (first make a copy) or added to the list of ‘Favorite Reports’. 3. All Reports : Reports and graphs that have been adjusted or imported.
Explanation icons: [ ] = Graph [ ] = Report
[ ] = To delete a report
Figure 40 Report and Graphs in T4C

Advanced T4C Routines Page 27 of 43
A. To adjust a Lely Default report or graph:
1. Open a report (e.g. Expected Calving) 2. Click ‘Copy’
Figure 41 Copy a Lely Default report Lely default reports cannot be edited or deleted (button is grey). It can only be edited after it is copied. A new window opens
3. Enter a new name and save the report (in this case Adjusted version- Expected Calving)
Figure 42 Rename a copied report
After the report is saved click ‘Edit’.
Figure 43 Report is ready to be edited A new window opens: Edit Report

Advanced T4C Routines Page 28 of 43
Figure 44 Report generator The top bar allows to select/adjust: 1. Report name 2. Template (report criteria e.g cow, robot, actual, day or history information) 3. Top Print Record: number of records on one sheet (general left blank) 4. Report Style: (landscape or portrait)
The two ‘Tabs’: Fields and Filters are used to select the data elements or report criteria: 5. Fields: each Template has a standard set of ‘Fields’: Fields contain data columns that can be
selected on the report. 6. Filter: used to add specific filters/criteria to select a certain set of cows on the report, e.g. only
cows during the first 60 days in lactation or only heifers etcetera)

Advanced T4C Routines Page 29 of 43
Fields: Drag and drop the required columns from the ‘All Fields’ column to ‘Selected fields’. By clicking on the icon all fields of a module are shown (see fig 45) Functionality of Drag & Drop:
1. Click and hold the right hand mouse button on the preferred data element 2. Drag it to the Selected Fields column 3. Drop it by releasing the right mouse button
To remove a column from the Selected Fields: drag and drop it back to the Fields Column.
Figure 45 Fields: Selecting preferred data Filters: Criteria can be chosen by clicking on the ‘Select Property’ pick list. Several criteria can be added and defined. A criteria can be used more than once for refinement of the reports.
Figure 46 Filters: Selecting report criteria

Advanced T4C Routines Page 30 of 43
Definition:
•••• Hard criteria : the report must meet these criteria. If more than one criteria is used and ‘Hard’ is not marked the report generator will show animals that meet one of the criteria (or/or). If ‘Hard’ is marked, it will only show animals that meet that criteria (it is an ‘and’ not an ‘or/or’)
•••• Ask : displays a popup box when opening a report to set the details of the criteria. (e.g. for how many days of data the report should show)
Save the report adjustments by clicking ‘Apply’ and ‘Close’.
6.13.2 To create a graph The ‘Cow Lactation’ graph is used here as an example how to make a new graph. By using this example all aspects of the Graph Generator will be discussed.
1. Navigation: Analysis/Reports 2. Menu: Reports 3. Click ‘Add Graph’
Figure 47 Graph: add a new graph A new window opens

Advanced T4C Routines Page 31 of 43
Step 1: Add a name to the graph & Select the preferred Te mplate (top bar)
Figure 48 Lay out of the Graph Generator
a. Add a name: e.g. Cow Lactation b. Select the template: Daily Production History
Step 2: Add series for Daily Production
Figure 49 Graph Generator: Adding series for Daily Production In the column ‘Series Detail’ the details of the graph must be selected or chosen:
a. Rename Series: Daily pro b. Select Graph Type: Line c. Select value of the data: Average d. Drag and drop the data field from ‘All fields’:
a. y-axis: Day Production b. x-axis: Lac. Days
e. Select line colour: Red f. Remove mark: for ‘Show value labels’ g. Save data h. Add a new serie

Advanced T4C Routines Page 32 of 43
Step 3: Repeat step 2 to add Refusals + add specific Fie ld settings
Figure 50 Graph Generator: Adding series for Refusals Only specific field settings have to be set:
a. Change graph Type: Bar b. Add a new scale: 0-10 (for refusals) c. Create a second y-axis for this new scale: mark ‘Create Separate Y-Axis’ (this means a 2nd
y-axis next to each other) d. Add a value for the ‘Relative Position’: 50 (see figure 60) e. Save data f. Add a new series
Figure 60 Relative Position: to set distance between two Y-Axis

Advanced T4C Routines Page 33 of 43
Figure 61 Explanation on Positions of the Y-Axis: Start and End point of data value Step 4 Repeat step 3 to add Milkings + add specific Field settings
Figure 62 Graph Generator: Add serie Milkings Step 5 Repeat step 2 for Rest feed
Figure 63 Graph Generator: Adding series for Rest feed
The vertical start point for the y - axis value
Advanced T4C Routines Page 34 of 43
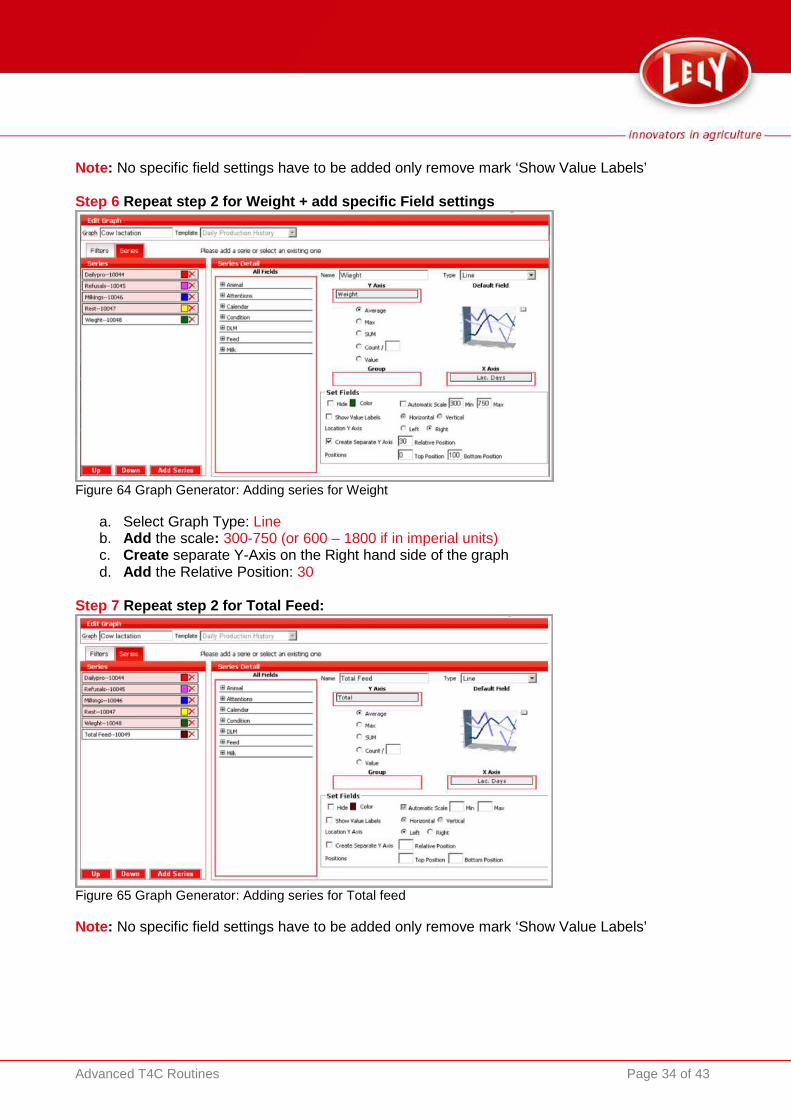
Note: No specific field settings have to be added only remove mark ‘Show Value Labels’ Step 6 Repeat step 2 for Weight + add specific Field sett ings
Figure 64 Graph Generator: Adding series for Weight
a. Select Graph Type: Line b. Add the scale: 300-750 (or 600 – 1800 if in imperial units) c. Create separate Y-Axis on the Right hand side of the graph d. Add the Relative Position: 30
Step 7 Repeat step 2 for Total Feed:
Figure 65 Graph Generator: Adding series for Total feed Note: No specific field settings have to be added only remove mark ‘Show Value Labels’

Advanced T4C Routines Page 35 of 43
Step 8 Repeat step 3 for Failures + add specific Field se ttings:
Figure 66 Graph Generator: Adding series for Failures Save the data after all ‘Series’ are added, by clicking ‘Save’ and ‘Close’ . The sorting order in which the series are shown is important for the graph (with ‘Up’ and ‘Down’ Series can be moved). The graph now shows all the available data: for all animals, all groups, independent on production status etc.
Figure 67 Cow lactation graph without ‘Filters’ To create a specific graph for cows in lactation, during 365 days of lactation, for the previous lactation and for the different animal groups, filters can be added.
Advanced T4C Routines Page 36 of 43
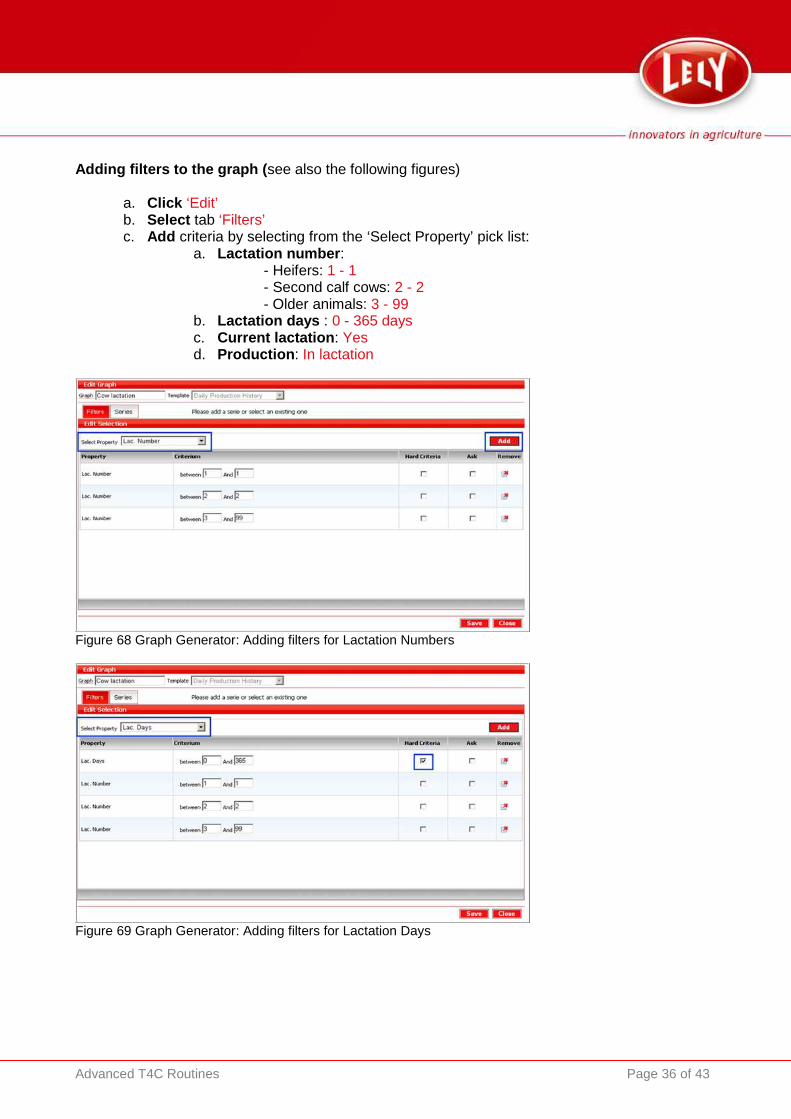
Adding filters to the graph ( see also the following figures)
a. Click ‘Edit’ b. Select tab ‘Filters’ c. Add criteria by selecting from the ‘Select Property’ pick list:
a. Lactation number : - Heifers: 1 - 1 - Second calf cows: 2 - 2 - Older animals: 3 - 99
b. Lactation days : 0 - 365 days c. Current lactation : Yes d. Production : In lactation
Figure 68 Graph Generator: Adding filters for Lactation Numbers
Figure 69 Graph Generator: Adding filters for Lactation Days

Advanced T4C Routines Page 37 of 43
Figure 70 Graph Generator: Adding filters for Current Lactation
Figure 71 Graph Generator: Adding filters for Production Definition :
•••• Hard criteria : the graph must meet these criteria. If more than one criteria is used and ‘Hard’ is not set the graph will show animals that meet one of the criteria (or/or). If ‘Hard’ is marked, it will show only animals that meet that criteria (it is an ‘and’ not an ‘or/or’)
•••• Ask : displays a popup box when opening a graph (e.g. for how many days the graphs should show the information)
Save the graph after adding the four graph criteria by clicking ‘Save’ and ‘Close’. The Graph Generator will return to the Edit version of the graph which is shown in fig. 72

Advanced T4C Routines Page 38 of 43
Figure 72 The final Cow Lactation graph

Advanced T4C Routines Page 39 of 43
6.14 Batch entry Basic Fast entry or change of responder numbers can be done with the Batch Entry function. Note : To enter responder numbers: only enter the large printed number of the tag, so without prefix characters and zeros (e.g. ‘FJ012345’ is entered as ‘12345’).
1. Navigator: Data Entry 2. Menu: Daily Entry 3. Select: Batch Basic 4. Select all animals at once (1) 5. Enter responder number 6. Save settings (2)
Figure 75 Quick entry responder numbers
Tip : Place a √ in the check box to save the data for all the animals at once (1)
Advanced T4C Routines Page 40 of 43
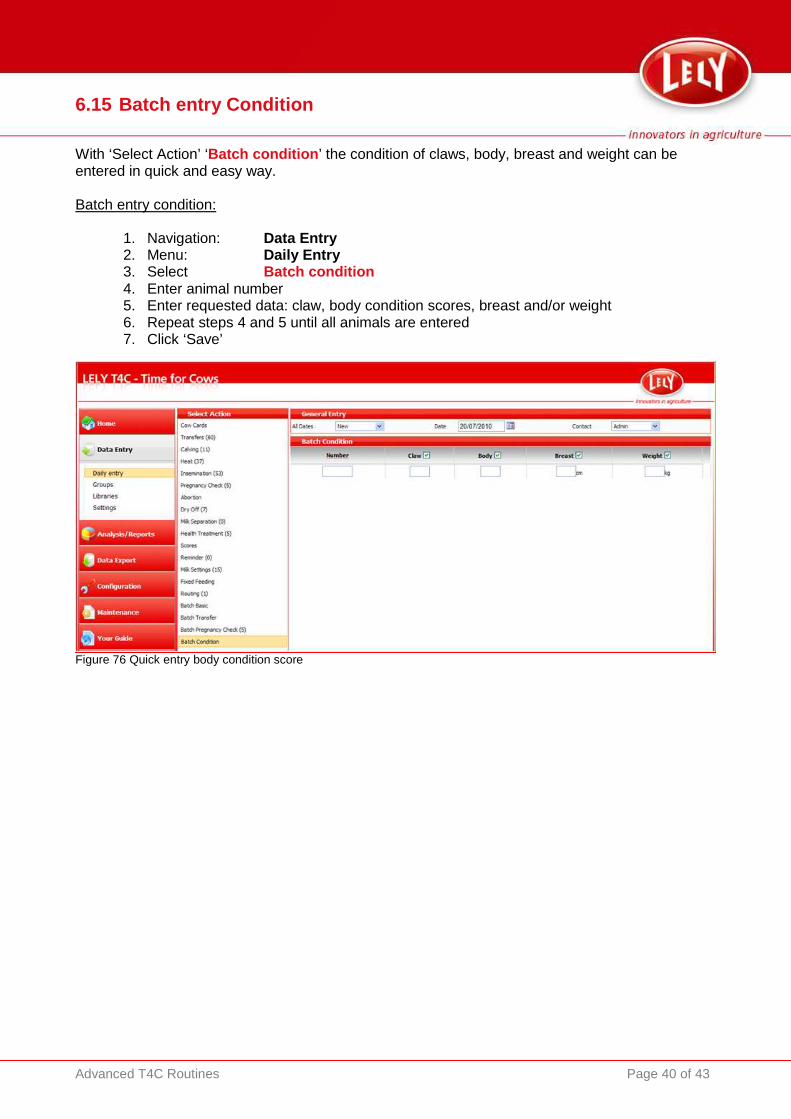
6.15 Batch entry Condition With ‘Select Action’ ‘Batch condition ’ the condition of claws, body, breast and weight can be entered in quick and easy way. Batch entry condition:
1. Navigation: Data Entry 2. Menu: Daily Entry 3. Select Batch condition 4. Enter animal number 5. Enter requested data: claw, body condition scores, breast and/or weight 6. Repeat steps 4 and 5 until all animals are entered 7. Click ‘Save’
Figure 76 Quick entry body condition score

Advanced T4C Routines Page 41 of 43
6.16 Batch entry Sampling With Select Action ‘Batch Sampling' the sample results milk yield, % fat, % protein, standard peak production and somatic cell count can be entered in a quick and easy way Batch entry sampling:
1. Navigation: Data Entry 2. Menu: Daily Entry 3. Select Batch Sampling 4. Enter requested data: milk yield, %fat, % protein, standard peak production and/or cell
count 5. Click ‘Save’
Figure 77 Quick entry sampling data

Advanced T4C Routines Page 42 of 43
6.17 Create a Data Back-up It is important to save a T4C backup on an external media like a USB stick on a regular base (at least once a week) If the PC crashes (e.g. by lightning), then a reasonably recent backup is available to get up and running again. Use two different sticks and always store one of them on a safe place in a different building! Create a manual backup:
1. Navigation: Maintenance 2. Menu: Backup/Restore
Figure 78 Create a Back-up
3. Select 'Create Back-up' (1) 4. Select ‘Submit’ (2) 5. The back-up process starts
Figure 79 Back-up is being processed A new window opens:

Advanced T4C Routines Page 43 of 43
Figure 80 Download Back-up
6. Click ‘Download’
Figure 81 Save Back-up
7. Click ‘Save’ 8. Select the location where the backup must be stored (external drive or USB)
Select ‘My computer’ Open USB location
Rename the backup
Click ‘Save’
Figure 82 Select ‘Location’ for back-up