chapter 6 analysis and discussion 6.1 current...
TRANSCRIPT

101
Chapter 6
Analysis and Discussion
6.1 Current Ratio
Current Ratio is a general and quick measure of liquidity of a firm. It represents the
margin of safety or cushion available to the creditors. It is an index of the firm’s financial
stability. It is also an index of technical solvency and an index of the strength of working
capital. A ratio equal to or near 2: 1 is considered as a standard or normal or satisfactory.
The idea of having doubled the current assets as compared to current liabilities is to
provide for the delays and losses in the realization of current assets.
Current Ratio = Current Assets / Current Liabilities
6.1.1 Current ratio of individual companies
(Rs in crores)
Table 1: Current Ratio of ITC
Year Current Assets Current Liabilities Ratio
2011-12 14444 9102 1.59
2010-11 13046 8477 1.54
2009-10 12497 8048 1.55
2008-09 10105 4704 2.15
2007-08 9108 4432 2.06
2006-07 8522 3858 2.21
2005-06 7894 3578 2.21
2004-05 6628 3034 2.18
2003-04 5382 3533 1.52
2002-03 4162 2720 1.53
Grand Average 1.85

102
As the table value of various years’ of ITC shows that the Current Ratio of almost all the
years is by and large near to the standard or the ideal value i.e. 2:1. The Current Ratio of
ITC in the first two years from 2002-2003 to 2003-2004 is below standard but still it is
quite comfortable as it is close to generally accepted norm of 1.33:1 so we can say that
ITC is performing well by maintaining proper current assets to meet its current liabilities.
As we move ahead, from 2004-2005 till 2008-2009, ITC sees an increase in current ratio
which is more than the ideal value of 2:1. It shows that the company was keeping a
conservative policy of working capital by keeping excess of current assets than the
required norms. In the later years, the company tried to maintain an ideal current ratio.

103
(Rs in crores)
Table 2: Current Ratio of HUL
Year Current Assets Current Liabilities Ratio
2011-12 7799 6449 1.21
2010-11 6074 6620 0.92
2009-10 5368 6733 0.80
2008-09 5601 5784 0.97
2007-08 3277 5111 0.64
2006-07 3170 4523 0.70
2005-06 2763 4118 0.67
2004-05 3305 3714 0.89
2003-04 3502 3871 0.90
2002-03 3431 3671 0.93
Grand Average 0.86
Table 2 shows value of current assets of various years’ of HUL. Current Ratio of almost
all the years is by and large lower than the standard or the ideal value i.e. 2:1. The
Current Ratio of HUL in the first three years from 2002-2003 to 2004-2005 is near to half
of the standard value 2:1 so we can say that HUL is keeping a very restrictive policy in

104
maintaining its current assets. As we move ahead, from 2005-2006 till 2007-2008, HUL
sees a further decline in current ratio which can be more harmful for the company if it
faces sudden payment of current liabilities or faces fall in sales. In the later years, the
company tried to increase its current ratio but still remain aggressive in maintaining low
current assets.
(Rs in crores)
Table 3: Current Ratio of Nestle
Year Current Assets Current Liabilities Ratio
2011-12 1407 2134 0.66
2010-11 1197 1670 0.72
2009-10 1060 1422 0.75
2008-09 833 1185 0.7
2007-08 732 958 0.76
2006-07 613 769 0.8
2005-06 567 685 0.83
2004-05 513 618 0.83
2003-04 438 492 0.89
2002-03 400 429 0.93
Grand Average 0.79
105
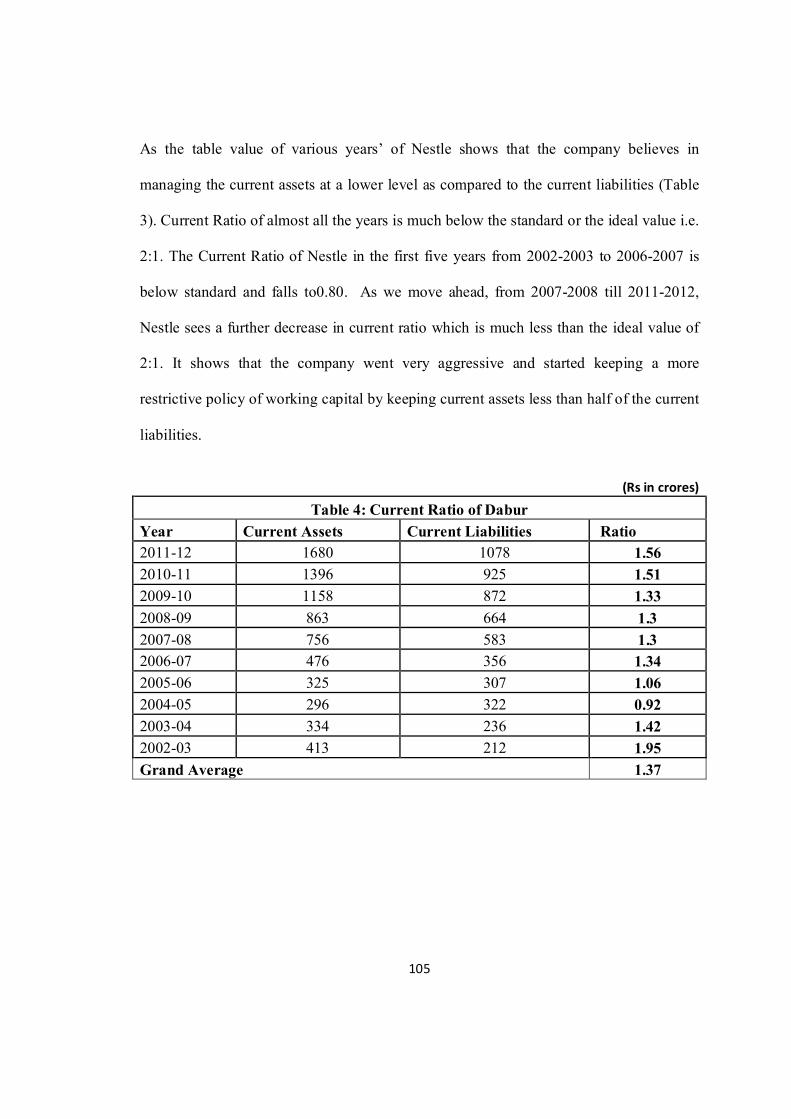
As the table value of various years’ of Nestle shows that the company believes in
managing the current assets at a lower level as compared to the current liabilities (Table
3). Current Ratio of almost all the years is much below the standard or the ideal value i.e.
2:1. The Current Ratio of Nestle in the first five years from 2002-2003 to 2006-2007 is
below standard and falls to0.80. As we move ahead, from 2007-2008 till 2011-2012,
Nestle sees a further decrease in current ratio which is much less than the ideal value of
2:1. It shows that the company went very aggressive and started keeping a more
restrictive policy of working capital by keeping current assets less than half of the current
liabilities.
(Rs in crores)
Table 4: Current Ratio of Dabur
Year Current Assets Current Liabilities Ratio
2011-12 1680 1078 1.56
2010-11 1396 925 1.51
2009-10 1158 872 1.33
2008-09 863 664 1.3
2007-08 756 583 1.3
2006-07 476 356 1.34
2005-06 325 307 1.06
2004-05 296 322 0.92
2003-04 334 236 1.42
2002-03 413 212 1.95
Grand Average 1.37

106
As the table value of various years’ of Dabur shows that the Current Ratio of almost all
the years is by and large more than 1 but not near to the standard value i.e. 2:1. The
Current Ratio of ITC in the first year 2002-2003 is touching the standard value but as we
move ahead in the later years, it starts falling till year 2005-2006 where it is the lowest of
all 10 years considered for analysis. From year 2006-2007, it remained almost stable at
around 1.3 till year 2009-2010. At 1.3 level of current ratio we can say that Dabur is
performing well by maintaining proper current assets to meet its current liabilities. In the
recent two years, Dabur sees an increase in current ratio which is more than the previous
year’s ratios but not touching the ideal value of 2:1. It can be interpret that Dabur has not
been very liberal or very strict in maintaining their current assets and in turn their current
ratio.

107
(Rs in crores)
Table 5: Current Ratio of Britannia
Year Current Assets Current Liabilities Ratio
2011-12 858 979 0.88
2010-11 704 456 1.54
2009-10 801 486 1.65
2008-09 836 413 2.02
2007-08 733 348 2.11
2006-07 571 323 1.77
2005-06 442 303 1.46
2004-05 392 303 1.29
2003-04 285 215 1.33
2002-03 276 191 1.45
Grand Average 1.55
In Table 5, it can be seen that the values of current ratio of Britannia do not follow any
consistent ratio and is changing every year from 2002-03 to 2011-12. It can also be seen
that out of 10 years of the period taken, Britannia has followed the standard value of 2:1

108
in only two years i.e. 2008-09 and 2007-08. And after that in the recent years, the current
ratio started falling from 1.65 in 2009-10 to 1.54 in 2010-11 and further fell to .88 in
2011-12. The Current Ratio of ITC in the most of the years is more than 1 which is again
not an ideal situation but still but it seems to be a comfortable one as all the current assets
are covering the current liabilities. The firm has neither followed a liberal working
management policy not a strict policy.
6.1.2 Comparison of Current Ratio among the Companies and with the Industry’s
Average
Table 6: Current Ratio of 5 companies and the industry Average
Year ITC HUL Nestle Dabur Britannia Industry
Average 2011-12 1.59 1.21 0.66 1.56 0.88 1.18
2010-11 1.54 0.92 0.72 1.51 1.54 1.25
2009-10 1.55 0.80 0.75 1.33 1.65 1.22
2008-09 2.15 0.97 0.70 1.30 2.02 1.43
2007-08 2.06 0.64 0.76 1.30 2.11 1.37
2006-07 2.21 0.70 0.80 1.34 1.77 1.36
2005-06 2.21 0.67 0.83 1.06 1.46 1.25
2004-05 2.18 0.89 0.83 0.92 1.29 1.22
2003-04 1.52 0.90 0.89 1.42 1.33 1.21
2002-03 1.53 0.93 0.93 1.95 1.45 1.36
Grand
Average 1.85 0.86 0.79 1.37 1.55 1.29

109
Year 2011-12
In year 2011-12, the average current ratio in the FMCG sectors comes out to be 1.18
which in itself is less than the ideal current ratio considered for manufacturing
companies. In the same year, the company having the least current ratio is Nestle with the
value of 0.66 which is less than half of the average ratio of the industry in that year. The
company with second lowest current ratio is Britannia with the value of .88 which is
again approximately half of the industry’s average. The company whose ratio is near and
above to the industry’s average are ITC with the value of 1.59, HUL with the value of
1.21 and Dabur with the value of 1.56. Refer Table 6.

110
2010-11
In year 2010-11, the average current ratio in the FMCG sectors comes out to be 1.25
which is slightly above the industry’s average in the previous year but it is again in itself
less than the ideal current ratio considered for manufacturing companies i.e.2:1. In this
year also, the company having the least current ratio is Nestle with the value of .72 which
is more than half of the average ratio of the industry in that year followed by HUL with
the value of .92. Rest of the three companies have a value of 1.5 and are above to the
industry’s average in this year. Refer Table 6.
2009-10
In year 2009-10, the average current ratio in the FMCG sectors comes out to be 1.22. In
the same year, the company which is following the trend of keeping the lowest current
ratio is Nestle with the value of .75 which is more than half of the average ratio of the
industry in that year. The company with second lowest current ratio is HUL with the
value of .80 which is again more than half of the industry’s average. The companies
whose ratio is above to the industry’s average are ITC with the value of 1.55, Britannia
with the value of 1.65 and Dabur with the value of 1.33. Refer Table 6.
2002-03 to 2008-09
In the past years from 2002-03 to 2008-09, the industry’s average has initially decreased
since 2002-03 from 1.36 till 2004-05 to 1.22 but then gradually started increasing till year
2008-09 with the value of 1.43. in all these 6 years , Nestle has maintained itself to be a
company with the most aggressive working capital policy with the minimum value of
current assets among all companies except for the period of 2005 to 2008 where HUL
111
took its place and kept the minimum current ratio. Moreover, the company that
maintained a reasonably higher and the best current ratio among all the companies is ITC.
Throughout the 10 years of time period, ITC always has a current ratio which is more
than the industry’s average current ratio. So, it can be said that among all the FMCG
companies, ITC has the most liberal working capital policy. Dabur and Britannia have
also maintained a ratio near or above to the industry’s average. HUL kept the second
lowest value of current ratio among all the companies after Nestle. Refer Table 6.
112
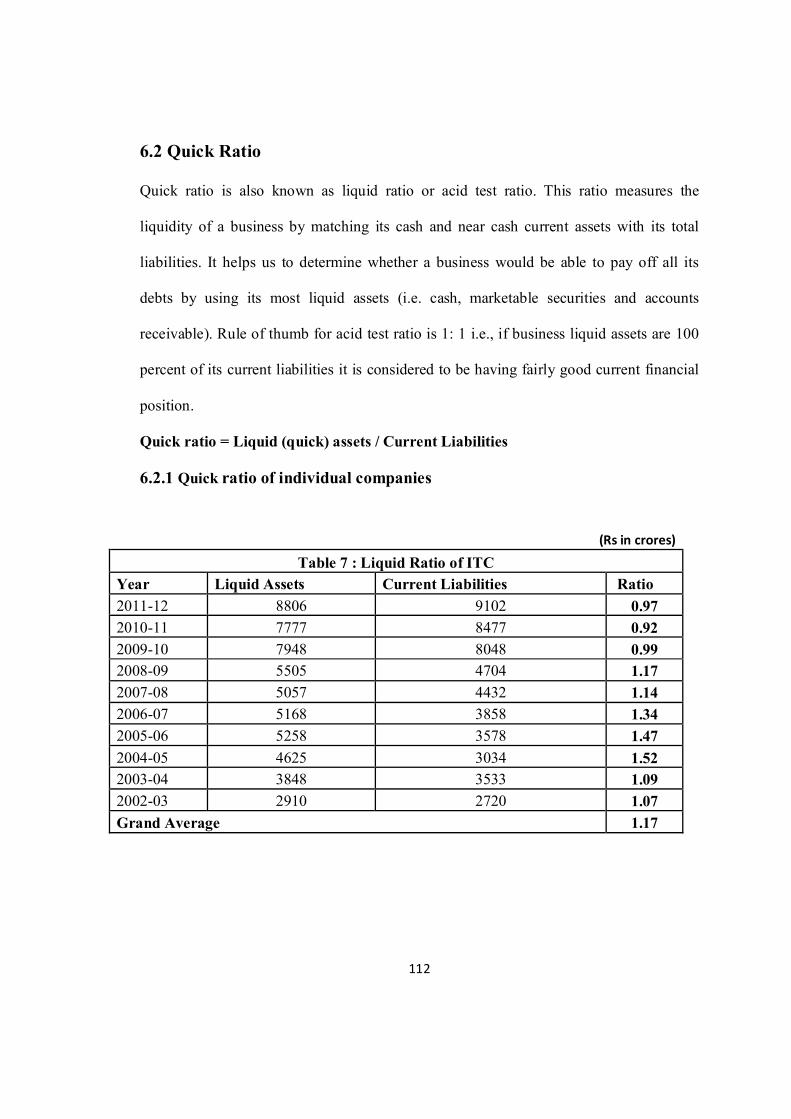
6.2 Quick Ratio
Quick ratio is also known as liquid ratio or acid test ratio. This ratio measures the
liquidity of a business by matching its cash and near cash current assets with its total
liabilities. It helps us to determine whether a business would be able to pay off all its
debts by using its most liquid assets (i.e. cash, marketable securities and accounts
receivable). Rule of thumb for acid test ratio is 1: 1 i.e., if business liquid assets are 100
percent of its current liabilities it is considered to be having fairly good current financial
position.
Quick ratio = Liquid (quick) assets / Current Liabilities
6.2.1 Quick ratio of individual companies
(Rs in crores)
Table 7 : Liquid Ratio of ITC
Year Liquid Assets Current Liabilities Ratio
2011-12 8806 9102 0.97
2010-11 7777 8477 0.92
2009-10 7948 8048 0.99
2008-09 5505 4704 1.17
2007-08 5057 4432 1.14
2006-07 5168 3858 1.34
2005-06 5258 3578 1.47
2004-05 4625 3034 1.52
2003-04 3848 3533 1.09
2002-03 2910 2720 1.07
Grand Average 1.17
113
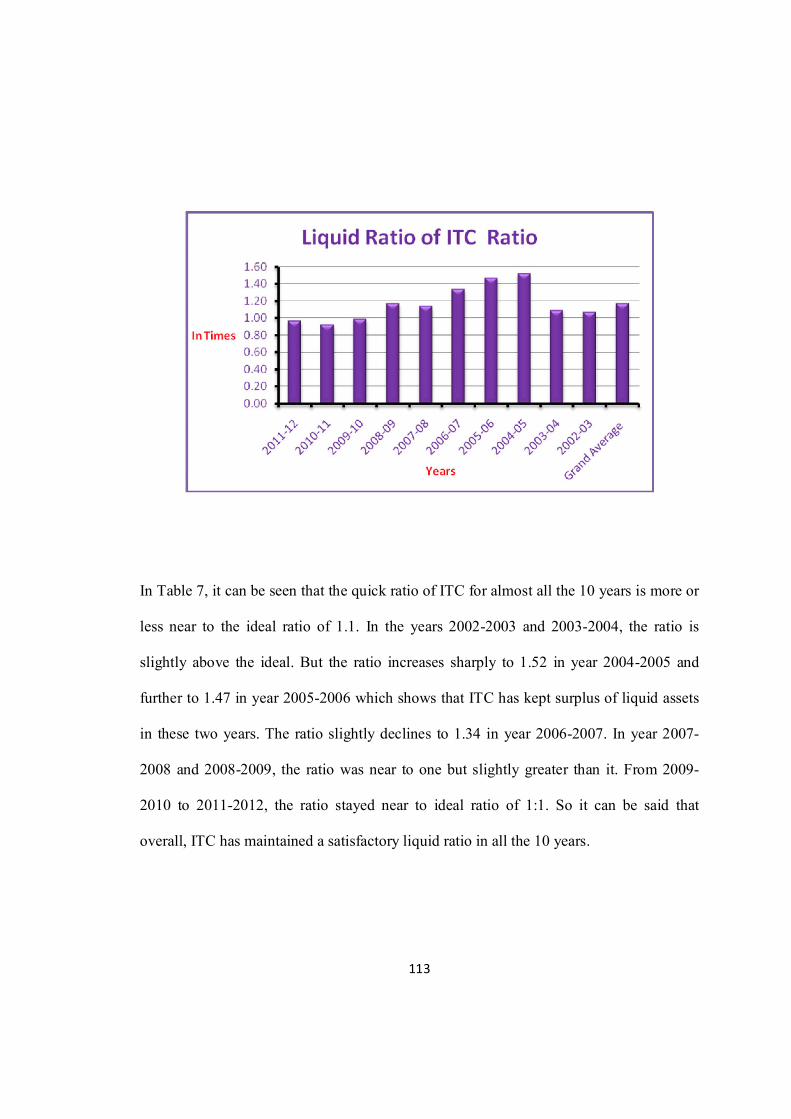
In Table 7, it can be seen that the quick ratio of ITC for almost all the 10 years is more or
less near to the ideal ratio of 1.1. In the years 2002-2003 and 2003-2004, the ratio is
slightly above the ideal. But the ratio increases sharply to 1.52 in year 2004-2005 and
further to 1.47 in year 2005-2006 which shows that ITC has kept surplus of liquid assets
in these two years. The ratio slightly declines to 1.34 in year 2006-2007. In year 2007-
2008 and 2008-2009, the ratio was near to one but slightly greater than it. From 2009-
2010 to 2011-2012, the ratio stayed near to ideal ratio of 1:1. So it can be said that
overall, ITC has maintained a satisfactory liquid ratio in all the 10 years.

114
(Rs in crores)
Table 8 :Liquid Ratio of HUL
Year Liquid Assets Current Liabilities Ratio
2011-12 5282 6449 0.82
2010-11 3263 6620 0.49
2009-10 3188 6733 0.47
2008-09 3072 5784 0.53
2007-08 1323 5111 0.26
2006-07 1622 4523 0.36
2005-06 1441 4118 0.35
2004-05 1835 3714 0.49
2003-04 2109 3871 0.54
2002-03 2152 3671 0.59
Grand Average 0.49
As was seen in the current ratio, the same trend is followed in the liquid ratio too by
HUL. The company has been very aggressive in maintaining liquid assets too. Table 8,
shows the position of HUL in case of liquid ratio. It can be seen that the quick ratio of

115
ITC for almost all the 10 years is much less than the standard value of 1:1. In the years
2002-2003, 2003-2004 and 2004-2005, the ratio is approximately half of the ideal ratio.
In the later years, 2005-2006 to 2007-2008, the ratio fell down and touched a low of .26.
At this time period, the company was very tight with its working capital policy. But the
ratio increased to .53 in year 2008-2009 and than declined to .47 and .49 in the next two
financial years. In the recent year 2001-2012, the company saw a drastic change in the
liquid ratio. It sharply increased the ratio to .82 which is near to the standard ratio. So it
can be said that overall, HUL has maintained an aggressive working capital by keeping
liquid assets at its low in all the 10 years.
(Rs in crores)
Table 9: Liquid Ratio of Nestle
Year Liquid Assets Current Liabilities Ratio
2011-12 673 2134 0.32
2010-11 621 1670 0.37
2009-10 561 1422 0.39
2008-09 398 1185 0.34
2007-08 331 958 0.35
2006-07 337 769 0.44
2005-06 314 685 0.46
2004-05 296 618 0.48
2003-04 219 492 0.45
2002-03 181 429 0.42
Grand Average 0.40

116
Table 9 shows that the liquid ratio maintained by Nestle is less than half of the ideal
value of 1:1. It significantly throws light on the strict working capital policy of the
company in which the company believes in maintain low level of liquid assets other than
inventory. The same trend was seen in the current ratio. The company has been very
aggressive in maintaining liquid assets too. It can be seen that the quick ratio of Nestle
for almost all the 10 years is much less than the standard value of 1:1. From 2002-2003 to
2006-2007, the ratio varies between .42 and .48 and is approximately half of the ideal
ratio. In the later years, 2007-2008 to 2011-2012, the ratio fell down further and ranged
between .32 and .39. At all these 10 years, the company was very tight with its working
capital policy. Less of all liquid assets have been maintained by Nestle. So it can be said
that overall, Nestle has maintained an aggressive working capital and has focused on Just
in time management.

117
(Rs in crores)
Table 10: Liquid Ratio of Dabur
Year Liquid Assets Current Liabilities Ratio
2011-12 1151 1078 1.07
2010-11 935 925 1.01
2009-10 860 872 0.99
2008-09 601 664 0.91
2007-08 555 583 0.95
2006-07 319 356 0.90
2005-06 209 307 0.68
2004-05 168 322 0.52
2003-04 223 236 0.94
2002-03 234 212 1.10
Grand Average 0.91
In Table 10, it can be seen that the quick ratio of Dabur for almost all the years is more or
less near to the ideal ratio of 1.1 except for year 2004-2005 in which the ratio fell to half
of the standard value 1:1. In the year 2002-2003, the ratio is slightly above the ideal. But
the ratio decreases to .94 in year 2003-2004 and further to .52 in year 2004-2005 which

118
shows that Dabur has been tight in keeping its liquid assets in this year. The ratio slightly
increased to .68 in year 2005-2006. From year 2006-2007 to 2009-2010, the ratio varied
between .91 and .99. In years 2010-2011 and 2011-2012, the ratio was near to one but
slightly greater than it. In these two years, the ratio stayed near to ideal ratio of 1:1. So it
can be said that overall, Dabur has maintained a acceptable liquid ratio in all the 10 years.
(Rs in crores)
Table 11:Liquid Ratio of Britannia
Year Liquid Assets Current Liabilities Ratio
2011-12 476 979 0.49
2010-11 393 456 0.86
2009-10 533 486 1.10
2008-09 582 413 1.41
2007-08 431 348 1.24
2006-07 356 323 1.10
2005-06 257 303 0.85
2004-05 258 303 0.85
2003-04 163 215 0.76
2002-03 194 191 1.02
Grand Average 0.97
119
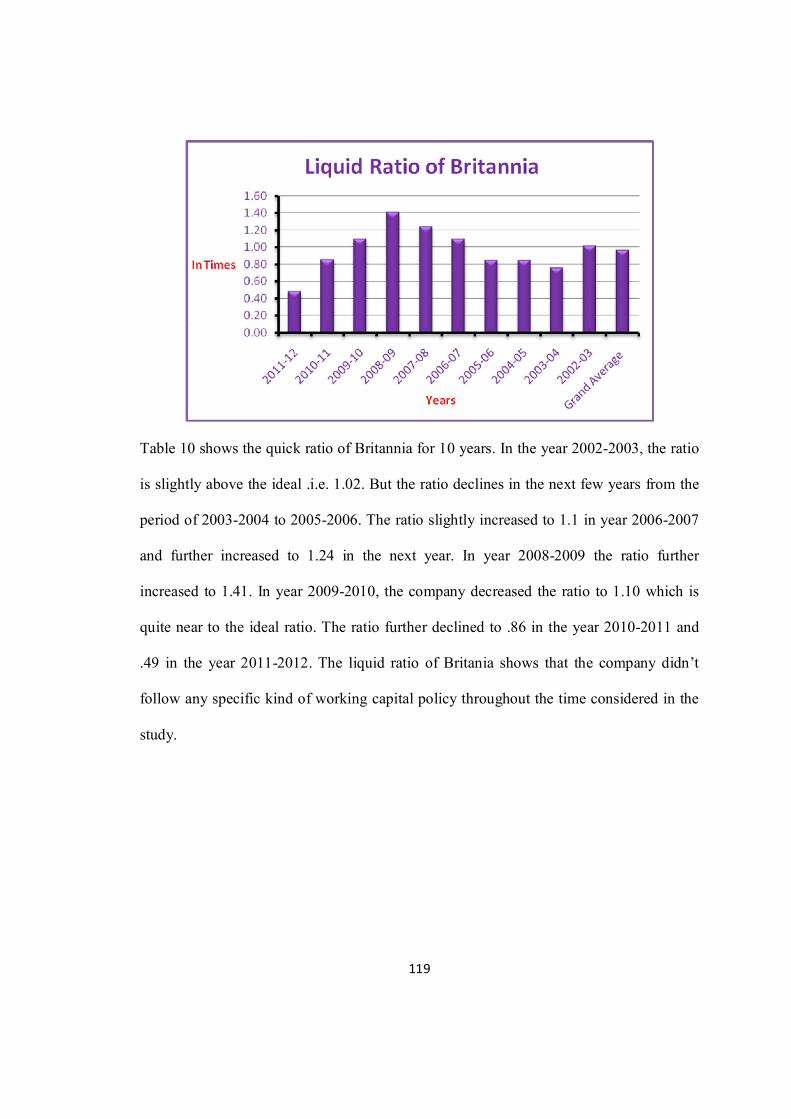
Table 10 shows the quick ratio of Britannia for 10 years. In the year 2002-2003, the ratio
is slightly above the ideal .i.e. 1.02. But the ratio declines in the next few years from the
period of 2003-2004 to 2005-2006. The ratio slightly increased to 1.1 in year 2006-2007
and further increased to 1.24 in the next year. In year 2008-2009 the ratio further
increased to 1.41. In year 2009-2010, the company decreased the ratio to 1.10 which is
quite near to the ideal ratio. The ratio further declined to .86 in the year 2010-2011 and
.49 in the year 2011-2012. The liquid ratio of Britania shows that the company didn’t
follow any specific kind of working capital policy throughout the time considered in the
study.

120
6.2.2 Comparison of Liquid Ratio among the Companies and with the Industry’s
Average
Table 12: Liquid Ratio of 5 companies and the industry Average
Year ITC HUL Nestle Dabur Britannia Industry
Average
2011-12 0.97 0.82 0.32 1.07 0.49 0.73
2010-11 0.92 0.49 0.37 1.01 0.86 0.73
2009-10 0.99 0.47 0.39 0.99 1.10 0.79
2008-09 1.17 0.53 0.34 0.91 1.41 0.87
2007-08 1.14 0.26 0.35 0.95 1.24 0.79
2006-07 1.34 0.36 0.44 0.90 1.10 0.83
2005-06 1.47 0.35 0.46 0.68 0.85 0.76
2004-05 1.52 0.49 0.48 0.52 0.85 0.77
2003-04 1.09 0.54 0.45 0.94 0.76 0.76
2002-03 1.07 0.59 0.42 1.10 1.02 0.84
Grand
Average 1.17 0.49 0.40 0.91 0.97 0.79

121
Year 2011-12
In year 2011-12, the average quick ratio in the FMCG sectors comes out to be .734 which
is again less than the ideal quick ratio considered for manufacturing companies. In the
same year, the company having the least quick ratio is Nestle with the value of .32 which
is less than half of the average ratio of the industry in that year. The company with
second lowest quick ratio is Britannia with the value of .49 which is again approximately
half of the industry’s average. The company whose ratio is near and above to the
industry’s average are ITC with the value of .97 which is exactly the perfect quick ratio
showing neither excess nor deficit of liquid assets, HUL with the value of .82 and Dabur
with the value of 1.07 which is slightly more than the ideal value. Refer Table 12.
2010-11
In year 2010-11, the average quick ratio in the FMCG sectors comes out to be .730 which
is almost same with the industry’s average in the previous year but it is again in itself less
than the ideal quick ratio considered for manufacturing companies i.e.1:1. In this year
also, the company having the least quick ratio is Nestle with the value of .37 which is
almost equal to half of the average ratio of the industry in that year followed by HUL
with the value of .49. Rest of the three companies i.e. ITC, Dabur and Britannia have
values of .92, 1.01 and .86 respectively. Refer Table 12.
2009-10
In year 2009-10, the average quick ratio in the FMCG sectors comes out to be .788. In the
same year, the company which is following the trend of keeping the lowest quick ratio is

122
Nestle with the value of .39 which is equal to half of the average ratio of the industry in
that year. The company with second lowest quick ratio is again HUL with the value of
.47 which is more than half of the industry’s average. The companies whose ratio is
equivalent to the ideal ratio are ITC and Dabur with the same value of .99 which is near
to the ideal and Britannia with the value of 1.3023. Refer Table 12.
2002-03 to 2008-09
In the past years from 2002-03 to 2008-09, the industry’s average has initially decreased
since 2002-03 from .840 till 2005-06 to .762 but then gradually started increasing till year
2008-09 with the value of .872. In all these 6 years, Nestle has maintained itself to be a
company with the most aggressive working capital policy with the minimum value of
quick assets among all companies except for the period of 2005 to 2008 where HUL took
its place and kept the minimum quick ratio. The company that maintained ratio higher
than the ideal ratio in many years and the best quick ratio among all the companies is
ITC. Throughout the 10 years of time period, ITC always has a quick ratio which is more
than the industry’s average quick ratio. So, it can be said that among all the FMCG
companies, ITC has the most liberal working capital policy. Dabur and Britannia have
also maintained a ratio near or above to the industry’s average. HUL also followed an
aggressive working capital policy after Nestle and kept the second lowest value of quick
ratio. Refer Table 12.

123
6.3 Cash Ratio
Cash ratio is the ratio of cash and cash equivalents of a company to its current liabilities.
It is an extreme liquidity ratio since only cash and cash equivalents are compared with the
current liabilities. It measures the ability of a business to repay its current liabilities by
only using its cash and cash equivalents and nothing else. Since cashity ratio lays down
very strict and exacting standard of liquidity, therefore, acceptable norm of this ratio is 50
percent. It means cash assets worth one half of the value of current liabilities are
sufficient for satisfactory liquid position of a business.
Cash ratio = Absolute liquid assets / Current liabilities
6.3.1 Cash Ratio of Individual Companies
(Rs in crores)
Table 13:Cash Ratio of ITC
Year Absolute liquid assets Current Liabilities Ratio
2011-12 7182 9102 0.79
2010-11 6234 8477 0.74
2009-10 5496 8048 0.68
2008-09 2976 4704 0.63
2007-08 2659 4432 0.60
2006-07 3132 3858 0.81
2005-06 3588 3578 1.00
2004-05 3145 3034 1.04
2003-04 1931 3533 0.55
2002-03 1052 2720 0.39
Grand Average 0.72
124
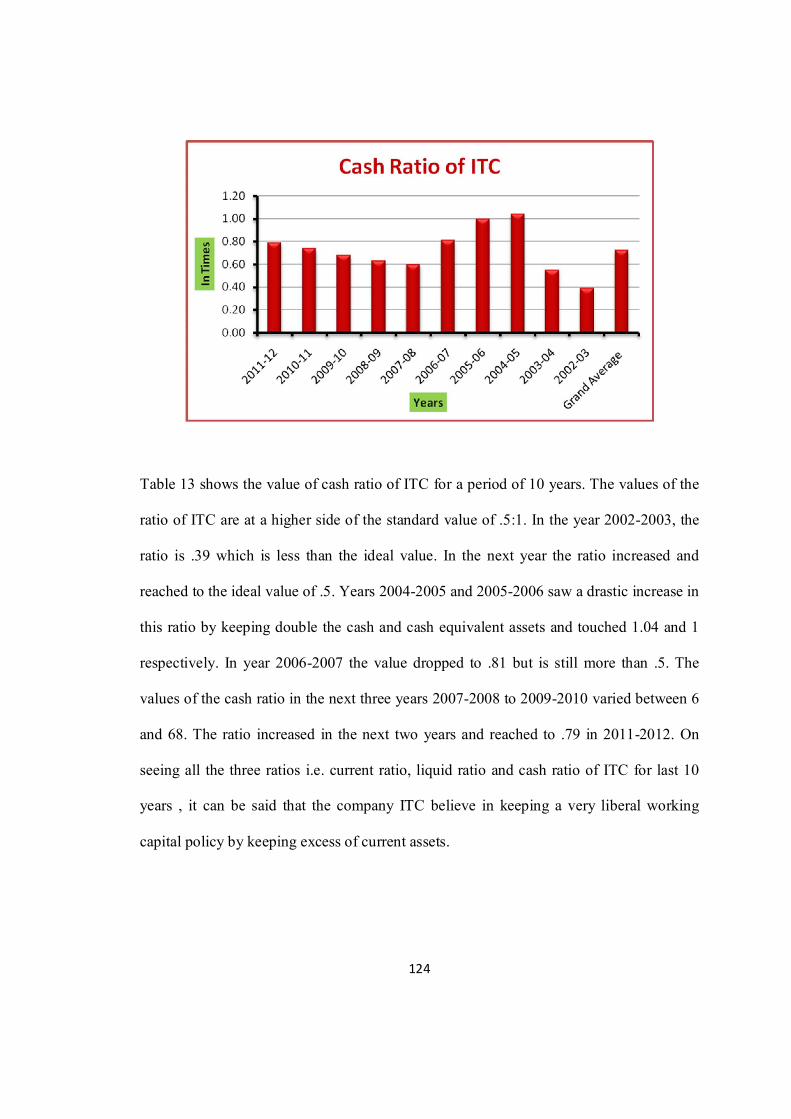
Table 13 shows the value of cash ratio of ITC for a period of 10 years. The values of the
ratio of ITC are at a higher side of the standard value of .5:1. In the year 2002-2003, the
ratio is .39 which is less than the ideal value. In the next year the ratio increased and
reached to the ideal value of .5. Years 2004-2005 and 2005-2006 saw a drastic increase in
this ratio by keeping double the cash and cash equivalent assets and touched 1.04 and 1
respectively. In year 2006-2007 the value dropped to .81 but is still more than .5. The
values of the cash ratio in the next three years 2007-2008 to 2009-2010 varied between 6
and 68. The ratio increased in the next two years and reached to .79 in 2011-2012. On
seeing all the three ratios i.e. current ratio, liquid ratio and cash ratio of ITC for last 10
years , it can be said that the company ITC believe in keeping a very liberal working
capital policy by keeping excess of current assets.

125
(Rs in crores)
Table 14:Cash Ratio of HUL
Year Absolute liquid assets Current Liabilities Ratio
2011-12 4082 6449 0.63
2010-11 2768 6620 0.42
2009-10 1892 6733 0.28
2008-09 1777 5784 0.31
2007-08 201 5111 0.04
2006-07 417 4523 0.09
2005-06 355 4118 0.09
2004-05 698 3714 0.19
2003-04 806 3871 0.21
2002-03 943 3671 0.26
Grand Average 0.25
The values of cash ratio of HUL for last 10 years are very low than the standard value of
.5. Table 14 shows that in years 2002-2003 and 2003-2004 the ratio ranged in .2s which
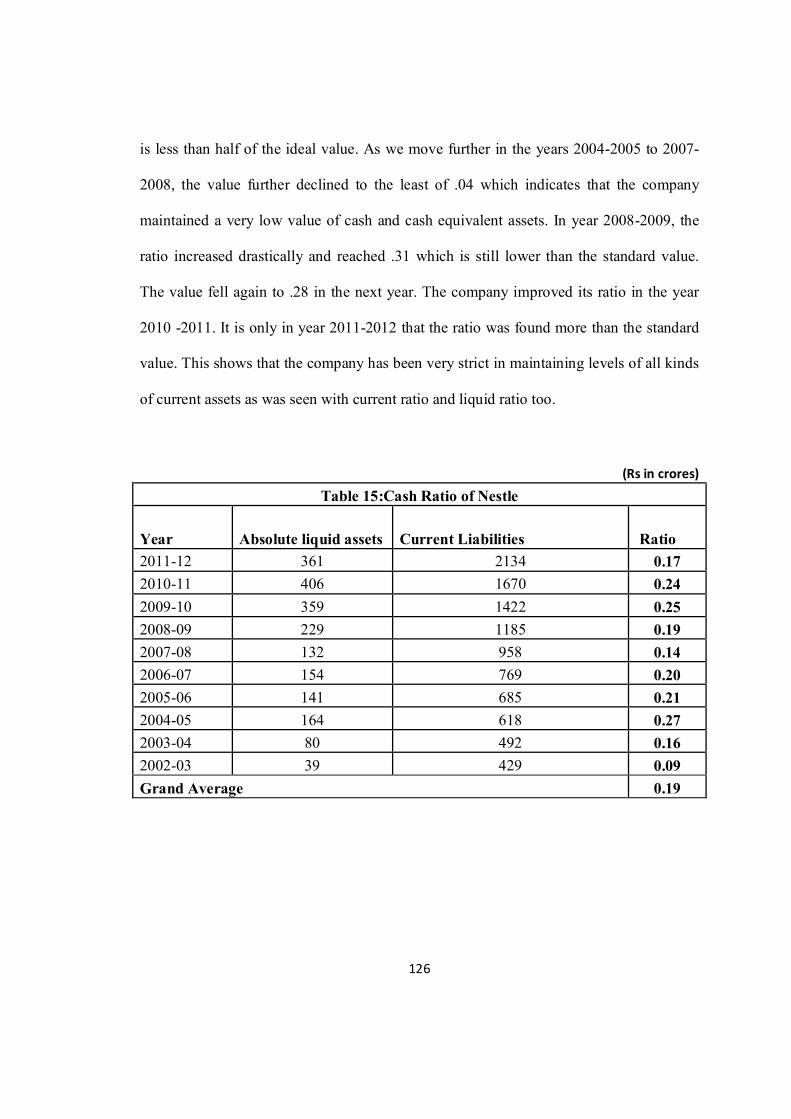
126
is less than half of the ideal value. As we move further in the years 2004-2005 to 2007-
2008, the value further declined to the least of .04 which indicates that the company
maintained a very low value of cash and cash equivalent assets. In year 2008-2009, the
ratio increased drastically and reached .31 which is still lower than the standard value.
The value fell again to .28 in the next year. The company improved its ratio in the year
2010 -2011. It is only in year 2011-2012 that the ratio was found more than the standard
value. This shows that the company has been very strict in maintaining levels of all kinds
of current assets as was seen with current ratio and liquid ratio too.
(Rs in crores)
Table 15:Cash Ratio of Nestle
Year Absolute liquid assets Current Liabilities Ratio
2011-12 361 2134 0.17
2010-11 406 1670 0.24
2009-10 359 1422 0.25
2008-09 229 1185 0.19
2007-08 132 958 0.14
2006-07 154 769 0.20
2005-06 141 685 0.21
2004-05 164 618 0.27
2003-04 80 492 0.16
2002-03 39 429 0.09
Grand Average 0.19

127
The values of cash ratio in the above table show that Nestle has maintained very less cash
and cash equivalent assets in all last 10 years. The year 2002-2003 shows the lowest
value of this ratio at .09. In year 2003-2004 the ratio increased to .16 which further
increased to .27 in the next year. In years 2005-2006 and 2006-2007 the values were
almost the same at .20 which again is less than the ideal ratio. In 2007-2008, the ratio
further fell to .14. In the next years, the ratio rose slowly from .19 in 2008-2009 to .25 in
2009-2010 and further declined by .01 and reached .24 in year 2010-2011. The ratio fell
again in the last year to .17. Nestle also maintained a very tight working capital policy.
128
(Rs in crores)
Table 16: Cash Ratio of Dabur
Year Absolute liquid assets Current Liabilities Ratio
2011-12 684 1078 0.63
2010-11 610 925 0.66
2009-10 404 872 0.46
2008-09 262 664 0.39
2007-08 271 583 0.46
2006-07 130 356 0.37
2005-06 79 307 0.26
2004-05 55 322 0.17
2003-04 127 236 0.54
2002-03 45 212 0.21
Grand Average 0.42

129
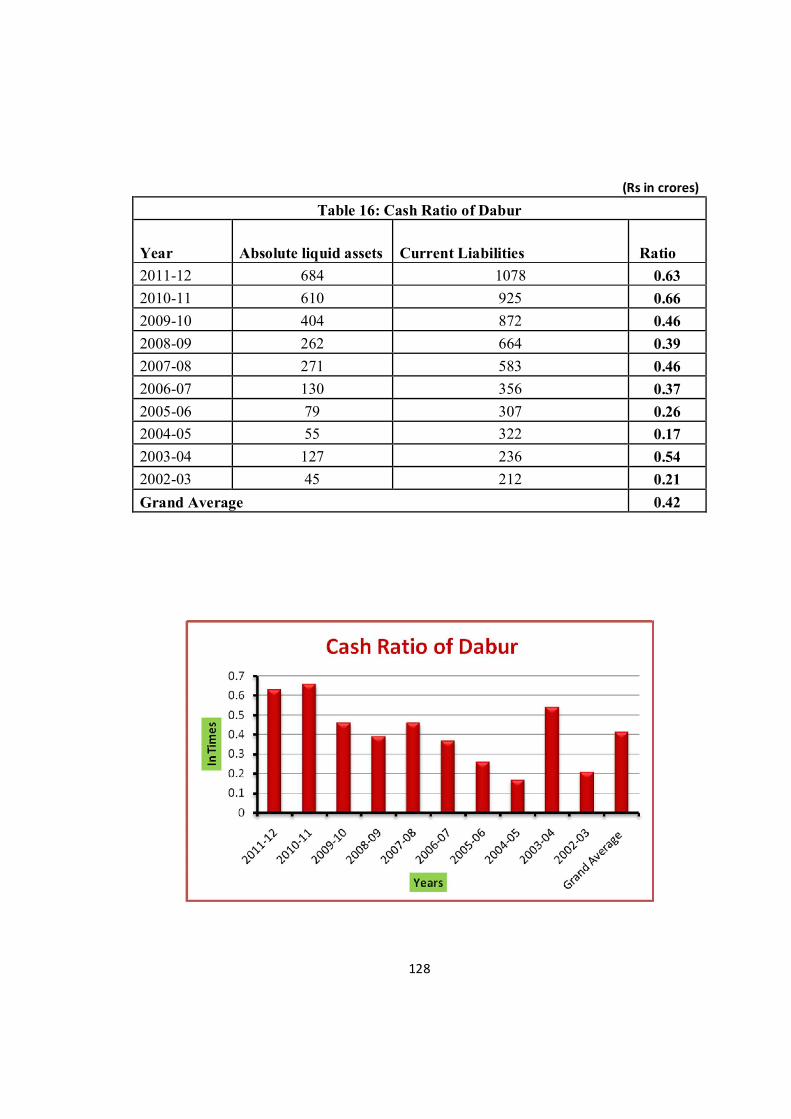
Table 16 shows the values of cash ratio of Dabur. In 2002-2003 the value of this ratio
was less than half of the standard value of .5. But in 2003-2004 the company followed the
ideal value. In the next year the ratio again fell to .17. The value of the ratio increased to
.26 in 2005-2006 and further increased to .37 in year 2006-2007 which is still lower than
the ideal ratio of .5. In year 2007-2008, the value increased further to .46 which is
approximately near to the ideal. The value further decreased and then increased in the
next two years. It is years 2010-2011 and 2011-2012 that Dabur changed its strict
working capital policy to a liberal one by keeping more of cash and cash equivalent
assets as the ratio values are .66 and .63 respectively.
(Rs in crores)
Table 17: Cash Ratio of Britannia
Year Absolute liquid assets Current Liabilities Ratio
2011-12 242 979 0.25
2010-11 265 456 0.58
2009-10 303 486 0.62
2008-09 338 413 0.82
2007-08 225 348 0.65
2006-07 239 323 0.74
2005-06 141 303 0.47
2004-05 150 303 0.5
2003-04 66 215 0.31
2002-03 71 191 0.37
Grand Average 0.53

130
Table 17 shows the values of cash ratio of Britannia for 10 years period starting from
year 2002-2003 to 2011-2012. The ratio value was more than the ideal value of .5 for
most of the years except for .37, .31 and .25 in 2002-2003, 2003-2004 and 2011-2012
respectively. Britannia had the perfect value of the ratio in 2004-2005. It dropped slightly
to .47 in the next year. Although the ratio was at a higher side from 2006-2007 to 2010-
2011 with the highest value at .82 in the year 2008-2009. It can be said that the company
has been quite liberal in keeping cash and cash equivalent assets.
131
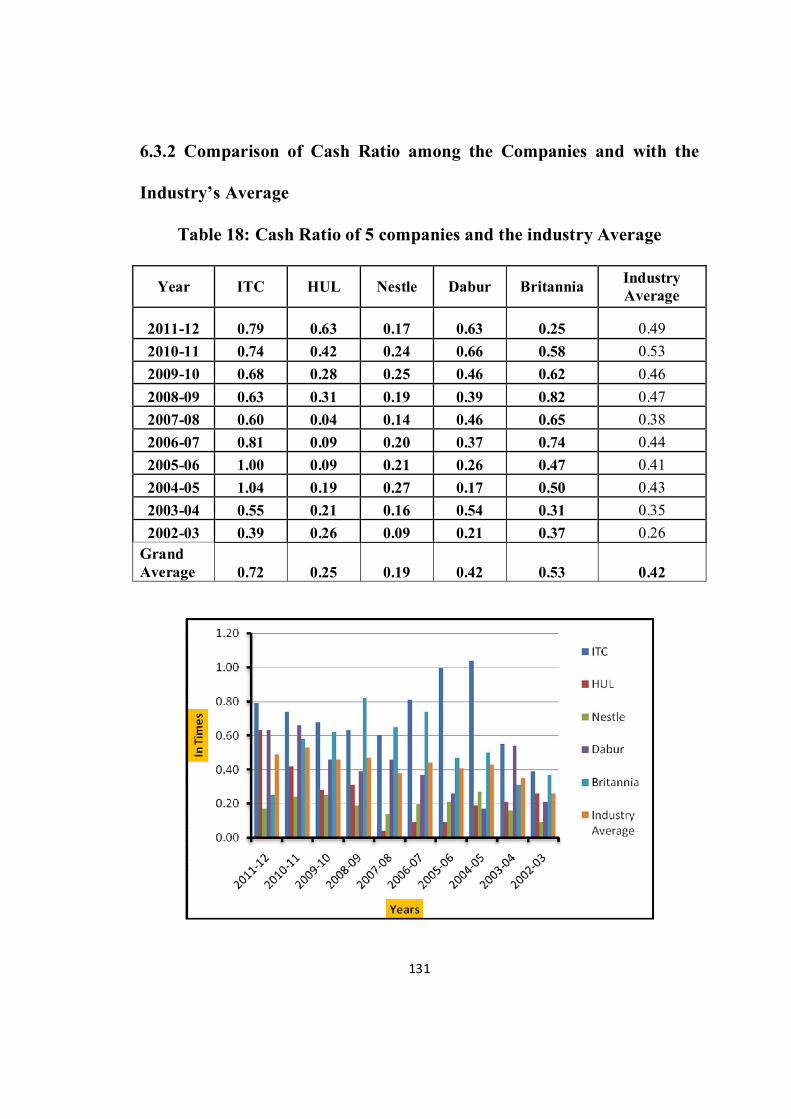
6.3.2 Comparison of Cash Ratio among the Companies and with the
Industry’s Average
Table 18: Cash Ratio of 5 companies and the industry Average
Year ITC HUL Nestle Dabur Britannia Industry
Average
2011-12 0.79 0.63 0.17 0.63 0.25 0.49
2010-11 0.74 0.42 0.24 0.66 0.58 0.53
2009-10 0.68 0.28 0.25 0.46 0.62 0.46
2008-09 0.63 0.31 0.19 0.39 0.82 0.47
2007-08 0.60 0.04 0.14 0.46 0.65 0.38
2006-07 0.81 0.09 0.20 0.37 0.74 0.44
2005-06 1.00 0.09 0.21 0.26 0.47 0.41
2004-05 1.04 0.19 0.27 0.17 0.50 0.43
2003-04 0.55 0.21 0.16 0.54 0.31 0.35
2002-03 0.39 0.26 0.09 0.21 0.37 0.26
Grand
Average 0.72 0.25 0.19 0.42 0.53 0.42

132
Year 2011-12
In year 2011-12, the average cash ratio in the FMCG sectors comes out to be .49 which is
almost equal to the ideal cash ratio considered for manufacturing companies. As was seen
with other two ratios , the company having the least cash ratio is again Nestle with the
value of .17 which is less than half of the average ratio of the industry in that year. The
company with second lowest cash ratio is Britannia with the value of .25 which is again
approximately half of the industry’s average. The company whose ratio is near and above
to the industry’s average are ITC with the value of .79, HUL and Dabur with the same
value of .63. Refer Table 18.
2010-11
In year 2010-11, the average cash ratio in the FMCG sectors comes out to be .53 which is
almost equal to ideal cash ratio considered for manufacturing companies i.e..5:1. In this
year also, the company having the least cash ratio is Nestle with the value of .24 which is
more than half of the average ratio of the industry in that year followed by HUL with the
value of .42 which is again not very bad. Rest of the three companies ITC, Dabur and
Britannia have values which are more than the ideal and are also above to the industry’s
average in this year which indicates that the company are keeping surplus of cash in hand
to meet the day to day requirement and smooth functioning of work. Refer Table 18
2009-10
In year 2009-10, the average cash ratio in the FMCG sectors comes out to be .47. In the
same year, the company which is following the trend of keeping the lowest cash ratio is

133
Nestle with the value of .24 followed by HUL with a value of .28. the third position in
keeping the lower value of cash ratio is Dabur although the value .46 is much near to the
ideal ratio. The companies whose ratio is not only above to the industry’s average but are
also above the ideal ratio of manufacturing FMCG sector are ITC with the value of .68
and Britannia with the value of .62. Refer Table 18.
2002-03 to 2008-09
If we analyse these seven years, we see that the value of industry average of cash ratio
has shown an increasing trend since 2002-03 to 2008-09, except an exception in year
2007-2008. In all these seven years , HUL has maintained itself to be a company with the
most aggressive working capital policy with the minimum value of cash among all
companies. Nestle took the second place in keeping the minimum cash ratio. Moreover,
the companies that have maintained a reasonably higher and the best cash ratio among all
the companies are ITC and Britannia. Throughout the 10 years of time period, ITC
always has a cash ratio which is more than the industry’s average cash ratio. So, it can be
said that among all the FMCG companies, ITC has the most liberal working capital
policy. Britannia has also maintained a ratio near or above to the industry’s average.
Refer Table 18.

134
6.4 Inventory Turnover Ratio
Inventory turnover ratio or Stock turnover ratio indicates the velocity with which stock of
finished goods is sold i.e. replaced. Generally it is expressed as number of times the
average stocks has been “turned over” or rotate of during the year .High turnover
suggests efficient inventory control, sound sales policies, trading in quality goods,
reputation in the market, better competitive capacity and so on. Low turnover suggests
the possibility of stock comprising of obsolete items, slow moving products, poor selling
policy, over investment in stock etc.
Inventory Turnover Ratio=Cost of goods sold / Average inventory at cost
6.4.1 Inventory turnover ratio of individual companies
(Rs in crores)
Table 19: Inventory Turnover Ratio of ITC
Year Cost Of Goods Sold Inventory Ratio
2011-12 15060.00 5638.00 2.67
2010-11 12906.00 5269.00 2.45
2009-10 12133.00 4549.00 2.67
2008-09 10772.00 4600.00 2.34
2007-08 9548.00 4051.00 2.36
2006-07 8211.00 3354.00 2.45
2005-06 6475.00 2636.00 2.46
2004-05 4889.00 2003.00 2.44
2003-04 4135.00 1534.00 2.70
2002-03 3742.00 1252.00 2.99
Grand Average 2.55

135
Table 19 shows the value of inventory turnover ratio. On seeing the values of the 10
years, it can be said that the company has been very consistent in keeping the level of the
ratio. The value varies between 2.36 and 2.99. It also indicates that the company is
efficiently converting its inventory into sales and doesn’t believe in huge over stocking.
(Rs in crores)
Table 20: Inventory Turnover Ratio of HUL
Year Cost Of Goods Sold Inventory Ratio
2011-12 17718.00 2517.00 7.04
2010-11 16096.00 2811.00 5.73
2009-10 14975.00 2180.00 6.87
2008-09 17583.00 2529.00 6.95
2007-08 11832.00 1954.00 6.06
2006-07 10455.00 1548.00 6.75
2005-06 9617.00 1322.00 7.27
2004-05 8490.00 1470.00 5.78
2003-04 8162.00 1393.00 5.86
2002-03 7999.00 1279.00 6.25
Grand Average 6.46

136
Inventory turnover ratio of HUL has higher values than that of ITC. In Table 20, the
value of this ratio starts from 6.25 in the year 2002-2003 and then decreases in the next
two years. In year 2005-2006, the ratio again shows an increase to 7.27. In the next four
years, the ratio was more or less the same and then it declines in year 2010-2011. In the
year 2011-2012, the ratio again increased to 7.04.
(Rs in crores)
Table 21: Inventory Turnover Ratio of Nestle
Year Cost Of Goods Sold Inventory Ratio
2011-12 5939.00 734.00 8.09
2010-11 5006.00 576.00 8.69
2009-10 4095.00 499.00 8.21
2008-09 3460.00 435.00 7.95
2007-08 2808.00 401.00 7.00
2006-07 2274.00 276.00 8.24
2005-06 1955.00 253.00 7.73
2004-05 1777.00 217.00 8.19
2003-04 1710.00 219.00 7.81
2002-03 1538.00 219.00 7.02
Grand Average 7.89

137
Table 21 throws light on the inventory turnover ratio of Nestle. It can be seen that the
ratio is quite high as compared to the ratio of other companies taken in the study. It starts
with the value of 7.02 in the year 2002-2003 and then keeps on increasing in the next two
years till 2004-2005. In declines in the year 2005-2006 and then kept on increasing and
then decreasing in the next three years. In years 2010-2011 and 2011-2012, the ratio
increased to 8.69 and 8.09 respectively. The higher values of inventory turnover ratio
indicate that the company is having efficient inventory control and better competitive
capacity.

138
(Rs in crores)
Table 22: Inventory Turnover Ratio of Dabur
Year Cost Of Goods Sold Inventory Ratio
2011-12 2857.00 529.00 5.40
2010-11 2413.00 461.00 5.23
2009-10 1450.00 298.00 4.87
2008-09 1293.00 262.00 4.94
2007-08 1084.00 201.00 5.39
2006-07 822.00 157.00 5.24
2005-06 639.00 116.00 5.51
2004-05 616.00 128.00 4.81
2003-04 593.00 111.00 5.34
2002-03 624.00 179.00 3.49
Grand Average 5.02
Inventory turnover ratio of Dabur for 10 years has been more or less consistent except for
the year 2002-2003 in which the value is the least at 3.49. Table 22 shows that the value

139
of the ratio lays between 4.81 and 5.51. The value of the ratio indicates that the company
is not piling up too much stock in hand and also has a good selling policy.
(Rs in crores)
Table 23: Inventory Turnover Ratio of Britannia
Year Cost Of Goods Sold Inventory Ratio
2011-12 4548.00 382.00 11.91
2010-11 3872.00 311.00 12.45
2009-10 3239.00 268.00 12.09
2008-09 2849.00 254.00 11.22
2007-08 2353.00 302.00 7.79
2006-07 2070.00 215.00 9.63
2005-06 1512.00 185.00 8.17
2004-05 1323.00 134.00 9.87
2003-04 1276.00 122.00 10.46
2002-03 1159.00 82.00 14.13
Grand Average 10.77

140
Britannia shows the highest value of inventory turnover ratio among all the companies
taken in the study. Table 23 shows that the company has touched the highest value of
14.13 in the first year of 2002-2003 and the lowest value of 7.79 in the year 2007-2008.
But still the company has maintained very efficient values which show proficient
inventory control, sound sales policies, trading in quality goods, reputation in the market
and better competitive capacity.
6.4.2 Comparison of Inventory Turnover Ratio among the Companies
and with the Industry’s Average
Table 24: Inventory Turnover Ratio of 5 companies and the industry Average
Year ITC HUL Nestle Dabur Britannia Industry
Average
2011-12 2.67 7.04 8.09 5.40 11.91 7.02
2010-11 2.45 5.73 8.69 5.23 12.45 6.91
2009-10 2.67 6.87 8.21 4.87 12.09 6.94
2008-09 2.34 6.95 7.95 4.94 11.22 6.68
2007-08 2.36 6.06 7.00 5.39 7.79 5.72
2006-07 2.45 6.75 8.24 5.24 9.63 6.46
2005-06 2.46 7.27 7.73 5.51 8.17 6.23
2004-05 2.44 5.78 8.19 4.81 9.87 6.22
2003-04 2.70 5.86 7.81 5.34 10.46 6.43
2002-03 2.99 6.25 7.02 3.49 14.13 6.78
Grand
Average 2.55 6.46 7.89 5.02 10.77 6.54
141
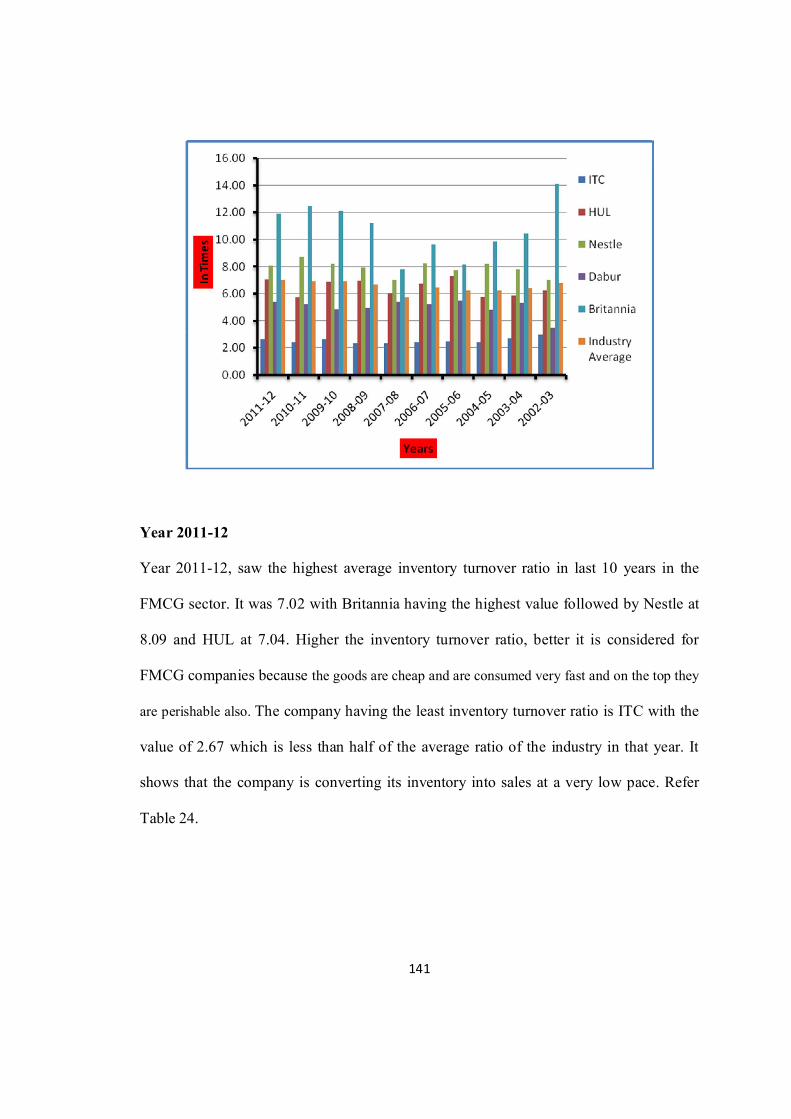
Year 2011-12
Year 2011-12, saw the highest average inventory turnover ratio in last 10 years in the
FMCG sector. It was 7.02 with Britannia having the highest value followed by Nestle at
8.09 and HUL at 7.04. Higher the inventory turnover ratio, better it is considered for
FMCG companies because the goods are cheap and are consumed very fast and on the top they
are perishable also. The company having the least inventory turnover ratio is ITC with the
value of 2.67 which is less than half of the average ratio of the industry in that year. It
shows that the company is converting its inventory into sales at a very low pace. Refer
Table 24.

142
2010-11
In year 2010-11, the average inventory turnover ratio in the FMCG sectors comes out to
be 6.91 which is lesser than the ratio in year 2011-2012. In this year also, the company
having the highest inventory turnover ratio is Britannia with the value of 12.45 which is
even more than the average ratio of the industry. It is followed by Nestle with the value
of 8.69 which is again not very bad. Rest of the three companies ITC, Dabur and HUL
have values which are less than the industry’s average in this year which indicates that
the company are keeping surplus of inventory turnover in hand to meet the day to day
requirement and smooth functioning of work. Refer Table 24.
2009-10
In year 2009-10, the average inventory turnover ratio in the FMCG sector comes out to
be 6.94 which is reasonably good for FMCG companies. In the same year, the company
having the highest inventory turnover ratio is Britannia. The ratio is 12. And that shows
that the company is converting its goods produced into sales many a times during one
year. Nestle is the company with the second highest ratio of 8.21, followed by HUL with
the value of the ratio as 6.87. Dabur was able to maintain the ratio at a value of 4.87 and
the company with a very low ratio in the year 2009-2010 is ITC. It can be said that ITC
was least effective and efficient in converting its inventory into sales. Refer Table 24.
2002-03 to 2008-09
If we analyse these seven years, we see that the value of industry average of inventory
turnover ratio has been revolving around 6 with the only exception in year 2007-2008

143
when the value dropped to 5.72. In all these seven years, Britannia has maintained itself
to be a company with the most effective and efficient ways of converting its inventory
into sales by maintain the highest average inventory turnover ratio among all the
companies. Nestle took the second place in keeping the maximum inventory turnover
ratio. The companies that have maintained reasonably low and below average inventory
turnover ratio are Dabur, HUL and ITC. Throughout the 10 years of time period, ITC
always has a inventory turnover ratio which is least compared to all the companies. So, it
can be said that among all the FMCG companies, ITC has the most poor inventory
turnover ratio. Refer Table 24.

144
6.5 Accounts Receivable Turnover Ratio
Accounts receivable turnover measures the efficiency of a business in collecting its credit
sales. It is an activity or efficiency ratio and it measures average number of times a
business collects its accounts receivables in a period usually a year .Generally a high
value of accounts receivable turnover is favorable and lower figure may indicate
inefficiency in collecting outstanding sales but a normal level of receivables turnover is
different for different industries. Increase in accounts receivable turnover overtime
indicates improvement in credit sales collection process.
Receivables turnover ratio = Annual net credit sales / Average accounts receivables
6.5.1 Accounts Receivable Turnover ratio of individual companies
(Rs in crores)
Table 25: Accounts Receivable Turnover Ratio of ITC
Year Net Sales Sundry Debtors Ratio
2011-12 25999.00 986.00 26.37
2010-11 22039.00 885.00 24.90
2009-10 18757.00 859.00 21.84
2008-09 16147.00 669.00 24.14
2007-08 14558.00 737.00 19.75
2006-07 12501.00 637.00 19.62
2005-06 10077.00 548.00 18.39
2004-05 7875.00 528.00 14.91
2003-04 6695.00 230.00 29.11
2002-03 6035.00 207.00 29.15
Grand Average 22.82
145
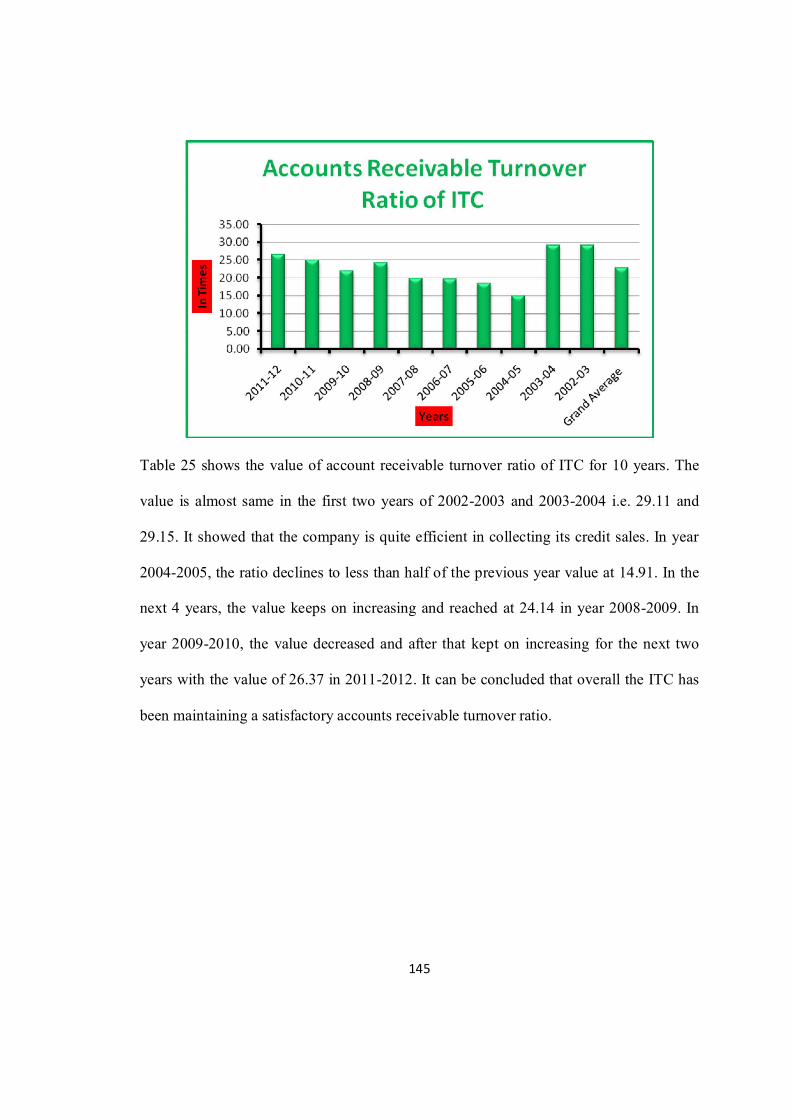
Table 25 shows the value of account receivable turnover ratio of ITC for 10 years. The
value is almost same in the first two years of 2002-2003 and 2003-2004 i.e. 29.11 and
29.15. It showed that the company is quite efficient in collecting its credit sales. In year
2004-2005, the ratio declines to less than half of the previous year value at 14.91. In the
next 4 years, the value keeps on increasing and reached at 24.14 in year 2008-2009. In
year 2009-2010, the value decreased and after that kept on increasing for the next two
years with the value of 26.37 in 2011-2012. It can be concluded that overall the ITC has
been maintaining a satisfactory accounts receivable turnover ratio.

146
(Rs in crores)
Table 26: Accounts Receivable Turnover Ratio of HUL
Year Net Sales Sundry Debtors Ratio
2011-12 22395.00 679.00 32.98
2010-11 20008.00 943.00 21.22
2009-10 17873.00 678.00 26.36
2008-09 20829.00 537.00 38.79
2007-08 14180.00 443.00 32.01
2006-07 12458.00 440.00 28.31
2005-06 11365.00 523.00 21.73
2004-05 10246.00 489.00 20.95
2003-04 10598.00 471.00 22.50
2002-03 10339.00 368.00 28.10
Grand Average 27.30
The values of Account receivable turnover ratio of HUL are given in table 26. It shows
that the company is quite efficient in converting its outstanding sales favorable. The
company has the highest turnover ratio in the year 2008-2009 with a value of 38.79 and

147
lowest turnover ratio in the year 2004-2005 with the value of 20.95. The company
doesn’t follow any particular trend but the ratio keeps on fluctuating every year.
(Rs in crores)
Table 27:Accounts Receivable Turnover Ratio of Nestle
Year Net Sales Sundry Debtors Ratio
2011-12 7542.00 115.00 65.58
2010-11 6297.00 63.00 99.95
2009-10 5167.00 64.00 80.73
2008-09 4358.00 46.00 94.74
2007-08 3530.00 53.00 66.60
2006-07 2837.00 56.00 50.66
2005-06 2501.00 31.00 80.68
2004-05 2242.00 26.00 86.23
2003-04 2308.00 32.00 72.13
2002-03 2076.00 23.00 90.26
Grand Average 78.76
Table 27 shows the value of account receivable turnover ratio of Nestle for last 10 years.
The values in the table indicates that the company has been extremely efficient in

148
maintain the ratio by converting credit sales favorable. In year 2002-2003, the value is
90.26 and decreased to 72.13 in the next year. It increased for the next 2 years. In 2006-
2007, the value declined and reached 50.66. it increased in the next two years. It
decreased to 80.73 in year 2009-2010 and then reached the highest value of 99.95 in year
2010-2011. The ratio then declined in the year 2011-2012.
(Rs in crores)
Table 28: Accounts Receivable Turnover Ratio of Dabur
Year Net Sales Sundry Debtors Ratio
2011-12 3813.00 224.00 17.02
2010-11 3307.00 202.00 16.37
2009-10 2890.00 130.00 22.23
2008-09 2439.00 112.00 21.78
2007-08 2111.00 100.00 21.11
2006-07 1617.00 61.00 26.51
2005-06 1375.00 27.00 50.93
2004-05 1280.00 49.00 26.12
2003-04 1160.00 43.00 26.98
2002-03 1241.00 117.00 10.61
Grand Average 23.97

149
The values of accounts receivable turnover ratio are indicated in table 28. The values
indicate that the company doesn’t follow any trend in the 10 years considered in this
study. The lowest value maintained by the company is 10.61 in the year 2002-2003 and
the highest value is 50.93 in the year 2005-2006. The values give a satisfactory image of
the company in converting its outstanding sales favourable.
(Rs in crores)
Table 29: Accounts Receivable Turnover Ratio of Britannia
Year Net Sales Sundry Debtors Ratio
2011-12 5033.00 52.00 96.79
2010-11 4272.00 57.00 74.95
2009-10 3458.00 39.00 88.67
2008-09 3152.00 50.00 63.04
2007-08 2635.00 46.00 57.28
2006-07 2231.00 29.00 76.93
2005-06 1735.00 21.00 82.62
2004-05 1589.00 44.00 36.11
2003-04 1494.00 19.00 78.63
2002-03 1329.00 29.00 45.83
Grand Average 70.09

150
Table 29 shows the values of accounts receivable turnover ratio of Britannia. The values
show that the company has been successful in maintaining and managing its accounts
receivable turnover ratio. It is efficiently turning its outstanding sales favorable. The
company has achieved the highest value of 96.79 in the year 2011-2012. It has 36.11 as
the lowest value in the year 2004-2005. The value of account receivable turnover is quite
high in most of the years.

151
6.5.2 Comparison of Accounts Receivable Turnover Ratio among the Companies
and with the Industry’s Average
Table 30: Accounts Receivable Turnover Ratio of 5 companies and the industry
Average
Year ITC HUL Nestle Dabur Britannia Industry
Average
2011-12 26.37 32.98 65.58 17.02 96.79 47.75
2010-11 24.90 21.22 99.95 16.37 74.95 47.48
2009-10 21.84 26.36 80.73 22.23 88.67 47.97
2008-09 24.14 38.79 94.74 21.78 63.04 48.50
2007-08 19.75 32.01 66.60 21.11 57.28 39.35
2006-07 19.62 28.31 50.66 26.51 76.93 40.41
2005-06 18.39 21.73 80.68 50.93 82.62 50.87
2004-05 14.91 20.95 86.23 26.12 36.11 36.86
2003-04 29.11 22.50 72.13 26.98 78.63 45.87
2002-03 29.15 28.10 90.26 10.61 45.83 40.79
Grand
Average 22.82 27.30 78.76 23.97 70.09 44.59

152
Year 2011-12
In year 2011-12, the average receivable turnover ratio in the FMCG sector is 47.75 which
is quite high with the major reason that customers don’t take long credits on Fast moving
consumer goods. It was 96.79 with Britannia having the highest value followed by Nestle
at 65.58 and HUL at 32.98. Higher the receivable turnover ratio, better it is considered
for FMCG companies because it generally indicates improvement in the process of cash
collection on credit sales. The company having the least receivable turnover ratio is
Dabur with the value of 17.02 which is less than half of the average ratio of the industry
in that year. It shows that the company is converting its receivable into sales at a very low
pace. Refer Table 30.
2010-11
In year 2010-11, the average receivable turnover ratio in the FMCG sector comes out to
be 47.48 which is slightly lesser than the ratio in year 2011-2012. In this year, the
company having the highest receivable turnover ratio is Nestle with the value of 99.95
which is double the average ratio of the industry. It is followed by Britannia with the
value of 74.95 which is again very high and more than the industry’s average. Rest of the
three companies ITC, Dabur and HUL have values which are much less than the
industry’s average in this year which indicates that the company are not keeping strict
credit terms since such policies may repel potential buyers.. Refer Table 30.
2009-10
In year 2009-10, the average receivable turnover ratio in the FMCG sector comes out to
be 47.97 which is reasonably good for FMCG companies. In the same year, the company

153
having the highest receivable turnover ratio is Britannia. The ratio is 88.67. And that
shows that the company is keeping an efficient credit policy and is converting its credit
into cash effectively during one year. Nestle is the company with the second highest ratio
of 80.73. All other three companies namely Dabur, ITC and HUL had their ratios around
20. It can be said that ITC was least effective and efficient in converting its receivable
into cash. Refer Table 30.
2002-03 to 2008-09
If we analyse these seven years, we see that the value of industry average of receivable
turnover ratio has been revolving around 40 with the only exception in year 2005-2006
when the value reached to 50.87. In all these seven years, Britannia and Nestle have
maintained itself to be the two companies with the most effective and efficient ways of
converting its receivable into cash by maintain the highest average receivable turnover
ratio among all the companies. The companies that have maintained reasonably low and
below average receivable turnover ratio are Dabur, HUL and ITC. Throughout the 10
years of time period, ITC always has a receivable turnover ratio which is least compared
to all the companies. So, it can be said that among all the FMCG companies, ITC has
maintained a very liberal credit policy to capture more and more of customers in the
FMCG market. Refer Table 30.

154
6.6 Accounts Payable Turnover Ratio
Accounts payable turnover is the ratio of net credit purchases of a business to its average
accounts payable during the period. It measures short term liquidity of business since it
shows how many times during a period, an amount equal to average accounts payable is
paid to suppliers by a business. Accounts payable turnover is a measure of short-term
liquidity. A higher value indicates that the business was able to repay its suppliers
quickly. Thus higher value of accounts payable turnover is favorable.
Payable turnover ratio = Annual net credit purchases / Average accounts payable
6.6.1 Accounts Payable Turnover Ratio of individual companies
(Rs in crores)
Table 31: Accounts Payable Turnover Ratio of ITC
Year Net Purchases Sundry Creditors Ratio
2011-12 9698 1425 6.81
2010-11 8431 1395 6.04
2009-10 7337 3444 2.13
2008-09 6092 2924 2.08
2007-08 6767 2740 2.47
2006-07 6032 2343 2.57
2005-06 4607 2148 2.14
2004-05 3236 1892 1.71
2003-04 2601 2804 0.93
2002-03 2331 2051 1.14
Grand Average 2.80

155
Table shows the value of account payable turnover ratio of ITC. The values started with
1.14 in the year 2002-2003. It decreased in the next year. In year 2004-2005, it increased
to 1.71. From year 2005-2006 to 2009-2010, the value stayed in twos. Then the value
increased sharply and touched 6.04 in year 2010-2011 and further increased to 6.81 in
year 2011-2012. The values shows `that the company is comfortable in paying to its
suppliers and managing the creditors properly.

156
(Rs in crores)
Table 32: Accounts Payable Turnover Ratio of HUL
Year Net Purchases Sundry Creditors Ratio
2011-12 11609 4623 2.51
2010-11 10369 5009 2.07
2009-10 8901 4374 2.03
2008-09 11232 3305 3.40
2007-08 7455 2878 2.59
2006-07 6619 2464 2.69
2005-06 6114 2345 2.61
2004-05 5357 2029 2.64
2003-04 5389 1841 2.93
2002-03 5199 2072 2.51
Grand Average 2.60
Values of accounts payable turnover ratio are shown in table. The values of almost all the
years except for year 2008-2009 are ranging between 2.03 to 2.69. The year 2008-2009
has the increased value of 3.40. This shows that the company is satisfying its creditors by

157
making payments to them on time. The company has managed to keep short term
liquidity.
(Rs in crores)
Table 33: Accounts Payable Turnover Ratio of Nestle
Year Net Purchases Sundry Creditors Ratio
2011-12 3638 997 3.65
2010-11 3139 745 4.21
2009-10 2457 582 4.22
2008-09 2139 502 4.26
2007-08 1752 456 3.84
2006-07 1337 366 3.65
2005-06 1128 317 3.56
2004-05 1041 266 3.91
2003-04 950 236 4.03
2002-03 851 212 4.01
Grand Average 3.93
Table shows the values of account payable turnover ratio of nestle. Year 2002-2003 has
4.01 as the ratio which got increased to 4.03 in the next year. Year 2004-2005 sees a
slight decline in the ratio value to 3.91 which further declined to 3.56 in the next year.

158
The ratio is 3.65 in the year 2006-2007 which got increased to 3.84 in the next year. The
value stayed more or less near four in the next three years and then it declined to 3.65 in
year 2011-2012. The value of account payable ratio indicates that the company is
maintaining its trade creditors.
(Rs in crores)
Table 34: Accounts Payable Turnover Ratio of Dabur
Year Net Purchases Sundry Creditors Ratio
2011-12 2080 585 3.56
2010-11 1729 495 3.49
2009-10 1400 349 4.01
2008-09 1283 282 4.55
2007-08 1029 250 4.12
2006-07 796 190 4.19
2005-06 564 132 4.27
2004-05 560 133 4.21
2003-04 483 115 4.20
2002-03 540 81 6.67
Grand Average 4.33

159
Table shows that Dabur has maintained quite a comfortable account payable turnover
ratio by paying the suppliers on time and satisfying them. Year 2002-2003 has a value of
6.67 which is quite high. Then the ratio kept on declining and reached 4.12 in year 2007-
2008. It increased to 4.55 in year 2008-2009 and then again kept on declining and
reached 3.56 in the year 2011-2012.
(Rs in crores)
Table 35: Accounts Payable Turnover Ratio of Britannia
Year Net Purchases Sundry Creditors Ratio
2011-12 3184 336 9.48
2010-11 2782 240 11.59
2009-10 2183 133 16.41
2008-09 1862 88 21.16
2007-08 1643 94 17.48
2006-07 1428 86 16.60
2005-06 1054 86 12.26
2004-05 869 74 11.74
2003-04 642 155 4.14
2002-03 560 157 3.57
Grand Average 12.44

160
The values of Account payable turnover ratio of Britannia are very high and are highest
among all the companies taken in the study. The year 2002-2003 has the lowest value of
3.57 among all 10 years. The value started increasing and reached 21.16 in the year 2008-
2009 which shows a very efficient turnover ratio and indicate that the company is paying
to the creditors very fast. The ratio value started declining after that year and reached
9.48 in the year 2011-2012. Still the value of account payable turnover ratio is
comparatively very high.
161
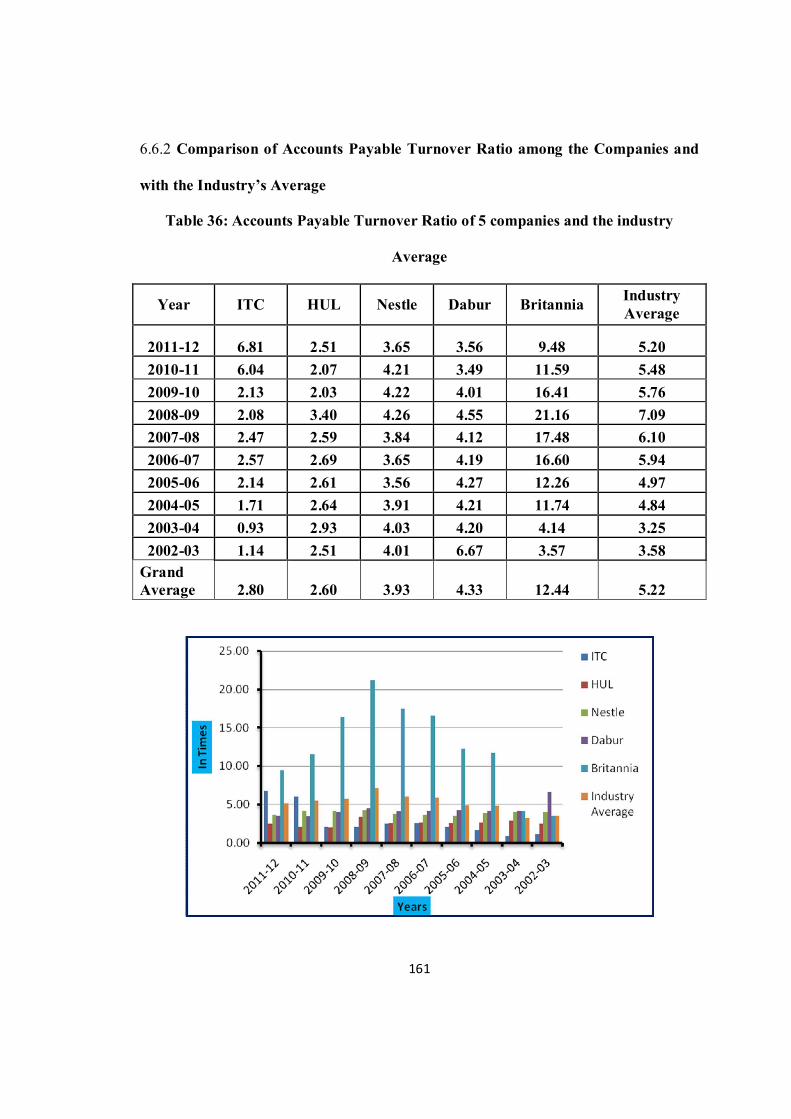
6.6.2 Comparison of Accounts Payable Turnover Ratio among the Companies and
with the Industry’s Average
Table 36: Accounts Payable Turnover Ratio of 5 companies and the industry
Average
Year ITC HUL Nestle Dabur Britannia Industry
Average
2011-12 6.81 2.51 3.65 3.56 9.48 5.20
2010-11 6.04 2.07 4.21 3.49 11.59 5.48
2009-10 2.13 2.03 4.22 4.01 16.41 5.76
2008-09 2.08 3.40 4.26 4.55 21.16 7.09
2007-08 2.47 2.59 3.84 4.12 17.48 6.10
2006-07 2.57 2.69 3.65 4.19 16.60 5.94
2005-06 2.14 2.61 3.56 4.27 12.26 4.97
2004-05 1.71 2.64 3.91 4.21 11.74 4.84
2003-04 0.93 2.93 4.03 4.20 4.14 3.25
2002-03 1.14 2.51 4.01 6.67 3.57 3.58
Grand
Average 2.80 2.60 3.93 4.33 12.44 5.22

162
Year 2011-12
In year 2011-12, the average payable turnover ratio in the FMCG sector is 5.20 which is
not very high. It was 9.48 with Britannia having the highest value followed by ITC at
6.81 and Nestle at 3.65. Higher the payable turnover ratio, better it is considered for
FMCG companies because it generally indicates that the business was able to repay its
suppliers quickly. Thus higher value of accounts payable turnover is favorable. The
company having the least payable turnover ratio is HUL with the value of 2.51 which is
less than the average ratio of the industry in that year. It shows that the company is
converting its payable into sales at a very low pace because of the short term liquidity
problem. Refer Table 36.
2010-11
In year 2010-11, the average payable turnover ratio in the FMCG sector comes out to be
5.48 which is slightly more than the ratio in year 2011-2012. In this year, the company
having the highest payable turnover ratio is Britannia with the value of 11.59 which is
double the average ratio of the industry. It is followed by ITC with the value of
6.04which is again high and more than the industry’s average. Rest of the three
companies Nestle, Dabur and HUL have values which are much less than the industry’s
average in this year which indicates that the companies are not having short term liquidity
to pay regularly to their suppliers. Refer Table 36.
163
2009-10
In year 2009-10, the average payable turnover ratio in the FMCG sector comes out to be
5.76 which is reasonably good for FMCG companies. In the same year, the company
having the highest payable turnover ratio is Britannia. The ratio is 16.41. And that shows
that the company is keeping an efficient payment system by paying its creditors on time
and maintaining its short term liquidity effectively during one year. Nestle and Dabur are
the companies with the second and third highest ratio of 4.22 and 4.02 respectively. Other
two companies namely ITC and HUL had their ratios around 2. Refer Table 36.
2002-03 to 2008-09
If we analyse these seven years, we see that the value of industry average of payable
turnover ratio has been moving in the northward direction from the value of 3.58 in 2002-
2003 to 7.09 in 2008-2009. In all these seven years, Britannia is the only company that
have maintained itself to be the most effective and efficient in converting its account
payables into cash on time followed by Dabur. All other companies have maintained
reasonably low and below average payable turnover ratio. Throughout the 10 years of
time period, ITC always has a payable turnover ratio which is least compared to all the
companies. So, it can be said that among all the FMCG companies, ITC has maintained a
very poor picture in the eyes of the suppliers. Refer Table 36.

164
6.7 Working Capital Turnover Ratio:
This ratio represents the number of times the working capital is turned over in the course
of year. The working capital turnover ratio measures the efficiency with which the
working capital is being used by a firm. A high ratio indicates efficient utilization of
working capital and a low ratio indicates otherwise. But a very high working capital
turnover ratio may also mean lack of sufficient working capital which is not a good
situation.
Working Capital Turnover Ratio = Net Sales / Net Working Capital
6.7.1 Working Capital Turnover Ratio of individual companies
(Rs in crores)
Table 37 :Working Capital Turnover Ratio of ITC
Year Net Sales Net Working Capital Ratio
2011-12 25999 5342 4.87
2010-11 22039 4569 4.82
2009-10 18757 4449 4.22
2008-09 16147 5401 2.99
2007-08 14558 4676 3.11
2006-07 12501 4664 2.68
2005-06 10077 4316 2.33
2004-05 7875 3594 2.19
2003-04 6695 1849 3.62
2002-03 6035 1442 4.19
Grand Average 3.50

165
Table 37 indicates that the working capital turnover ratio of ITC is satisfactory. It
indicates that the company is quite efficient in turning the working capital into sales. It
can be seen that ITC started with a working capital turnover ratio of 4.19 in the 2002-
2003 that indicated that the company is operationally very efficient in maintain its current
assets and current liabilities. As it moved ahead in year 2003-2004 and further to 2005-
2006, the ratio started decreasing but still had a reasonably high value throughout these
years. The ratio gradually started increasing and reached a high of 4.87 in year 2011-
2012. Throughout these 10 years, the company has maintained a good working capital
turnover ratio which indicates that the company has been efficient operationally.

166
(Rs in crores)
Table 38: Working Capital Turnover Ratio of HUL
Year Net Sales Net Working Capital Ratio
2011-12 22395 1350 16.59
2010-11 20008 -546 -36.64
2009-10 17873 -1365 -13.09
2008-09 20829 -183 -113.82
2007-08 14180 -1834 -7.73
2006-07 12458 -1353 -9.21
2005-06 11365 -1355 -8.39
2004-05 10246 -409 -25.05
2003-04 10598 -369 -28.72
2002-03 10339 -240 -43.08
Grand Average -26.91
Working capital turnover ratio of HUL shows negative values from year 2002-2003. The
ratio cannot be analysed alone but values of inventory and account receivables are also

167
considered. A negative working capital in the denominator is not bad all the times. It
shows that HUL can generate cash so quickly they actually have a negative working
capital. This happens because customers pay upfront and so rapidly, the business has no
problems raising cash. In HUL, products are delivered and sold to the customer before
the company ever pays for them. Moreover if the inventory and account receivables are
seen for all these years, the value of both the current assets are very low that shows that
the HUL is capable of maintaining low inventory and receivables as the company is
capable of doing business on cash basis. In such a scenario, the negative values of
working capital turnover ratio of all the years from 2002-2011 is a good thing for HUL.
(Rs in crores)
Table 39: Working Capital Turnover Ratio of Nestle
Year Net Sales Net Working Capital Ratio
2011-12 7542 -727 -10.37
2010-11 6297 -473 -13.31
2009-10 5167 -362 -14.27
2008-09 4358 -352 -12.38
2007-08 3530 -226 -15.62
2006-07 2837 -156 -18.19
2005-06 2501 -118 -21.19
2004-05 2242 -105 -21.35
2003-04 2308 -54 -42.74
2002-03 2076 -29 -71.59
Grand Average -24.10

168
As it can be seen in Table 39 that the working capital turnover ratio of Nestle is negative
for all the ten years considered for the study, the reason is similar to that of HUL
discussed in the previous paragraph. It can be seen that the negative value of the ratio is
because of the negative working capital in all these years. The company has also
maintained low inventories and account receivables throughout these years. It can be
analysed that Nestle works on cash basis and believes that as long as the transactions are
timed right, they can pay each bill as it comes due, maximizing their efficiency.

169
(Rs in crores)
Table 40: Working Capital Turnover Ratio of Dabur
Year Net Sales Net Working Capital Ratio
2011-12 3813 602 6.33
2010-11 3307 471 7.02
2009-10 2890 286 10.1
2008-09 2439 199 12.26
2007-08 2111 173 12.2
2006-07 1617 120 13.48
2005-06 1375 18 76.39
2004-05 1280 -26 -49.23
2003-04 1160 98 11.84
2002-03 1241 201 6.17
Grand Average 10.66
Dabur has very mixed values of the ratio. It reflects a poor working capital policy framed
by the company. The ratio started with 6.17 in the year 2002-2003 and increased during
the next year too. In year 2004-2005, it went negative and touched -49.23. In the next

170
year again it turned positive and reached a high of 76.39. A very high ratio of 76.39
indicates that the denominator i.e. working capital is very low that shows that the
company has very few current assets in this year. In the next few years, it went on falling
and reached a low of 6.33 in the year 2011-2012. The reason behind it was the increasing
working capital year after year.
(Rs in crores)
Table 41: Working Capital Turnover Ratio of Britannia
Year Net Sales Net Working Capital Ratio
2011-12 5033 -121 -41.6
2010-11 4272 248 17.23
2009-10 3458 315 10.98
2008-09 3152 423 7.45
2007-08 2635 385 6.84
2006-07 2231 248 9
2005-06 1735 139 12.48
2004-05 1589 89 17.85
2003-04 1494 70 21.34
2002-03 1329 85 15.64
Grand Average 7.72

171
Table 41 shows the working capital turnover ratio of Britannia. The value in almost all
the years is good indicating efficient operations by the company. In year 2002-2003, the
ratio was at 15.64 and than increased in the next year. In year 2004-2005, it dropped to
17.85 which further kept on declining and reached to 6.84 in the year 2007-2008. From
this year, the ratio kept on increasing and reached 17.23 in the year 2010-2011. It was
year 2011-2012, when the situation changed all together and the company reached a
negative ratio due the falling working capital.

172
6.7.2 Comparison of Working Capital Turnover Ratio among the Companies and
with the Industry’s Average
Table 42: Working Capital Turnover Ratio of 5 companies and the industry
Average
Year ITC HUL Nestle Dabur Britannia
Industry
Average
2011-12 4.87 16.59 -10.37 6.33 -41.60 -7.18
2010-11 4.82 36.64 -13.31 7.02 17.23 4.12
2009-10 4.22 13.09 -14.27 10.10 10.98 3.05
2008-09 2.99 113.82 -12.38 12.26 7.45 2.66
2007-08 3.11 7.73 -15.62 12.20 6.84 1.93
2006-07 2.68 9.21 -18.19 13.48 9.00 1.93
2005-06 2.33 8.39 -21.19 76.39 12.48 14.47
2004-05 2.19 25.05 -21.35 -49.23 17.85 -9.67
2003-04 3.62 28.72 -42.74 11.84 21.34 -0.46
2002-03 4.19 43.08 -71.59 6.17 15.64 -8.28
Grand
Average 3.50 30.23 -24.10 10.66 7.72 0.26
173
Year 2011-12
Year 2011-12, the average working capital turnover ratios in the FMCG sector is -7.18.
The reason for a negative ratio is because of the dominant effect of Nestle and Britannia
as both were having a high negative working capital ratio. It was -41.60 with Britannia
having the highest negative value followed by Nestle at -10.37. Higher the working
capital turnover ratio, better it is considered for FMCG companies because it shows that
how efficiently the company is able to convert its working capital into sales. Although a
negative value of this ratio is confusing because it can be good or bad depending on the
cash policy and other current assets maintained by the company. Negativity in the ratio
shows that their current liabilities or payables are higher than current assets or
receivables. This essentially means the companies do not have to deploy their own capital
or borrow from banks to carry out their routine business activities. It is actually very good
to have negative working capital because this entitles companies to earn relatively better
returns on capital and equity. This also shows the operational efficiency of a company.
The value is negative in these two companies because being the FMCG companies, they
work on cash basis and moreover both the companies are maintaining a very low
inventory and account receivables. The company having positive working capital
turnover ratios are Dabur, ITC and HUL which again reflect the efficacy of the
operations of these companies. Refer Table 42.
2010-11
In year 2010-11, the average working capital turnover ratio in the FMCG sectors comes
out to be 4.12 which is higher than the ratio in year 2011-2012. In this year also, the

174
company having the highest working capital turnover ratio is Britannia with the value of
17.23 which is even more than the average ratio of the industry. It also reflects that this
company is not having any defined working capital policy. It is followed by Dabur with
the value of 7.02 which is again very high. ITC has value which is slightly less than the
industry’s average in this year. Nestle is still maintaining a negative value of this ratio
indicating a cash basis policy used by them. HUL has a negative working capital ratio of
36.64. Refer Table 42.
2009-10
In year 2009-10, the average working capital turnover ratio in the FMCG sector comes
out to be 6.94 which is reasonably good for FMCG companies. In the same year, the
company having the highest working capital turnover ratio is Britannia. The ratio is
10.98. And that shows that the company is converting its goods produced into sales
many a times during one year. Dabur is the company with the second highest ratio of
10.10, followed by ITC with the value of the ratio as 4.22. Nestle maintained a negative
ratio at a value of -14.27. negative ratio maintained by Nestle in all the years shows that
Nestle collects its money from customers in just four days (average collection period),
whereas it pays in 52 days to its raw material suppliers. It shows the strength of this
company in efficiently maintaining its current assets less than the current liabilities. Hul
also maintained the same policy that of Nestle with a negative working capital ratio of
13.09. Refer Table 42.

175
2002-03 to 2008-09
If we analyse these seven years, we see that the value of industry average of working
capital turnover ratio is not following any trend. In all these seven years, Nestle has
maintained itself to be a company with the most effective and efficient ways of
converting its working capital into sales by maintaining a negative working capital
working capital turnover ratio among all the companies followed by HUL. It shows that
Nestle and HUL being the fastest growing FMCG companies works on cash basis.
Britannia is the company with the highest positive working capital in almost all the years
except for the year 2004-2005. Dabur has maintained the ratio lower than that of
Britannia but still quite high. The company that has maintained reasonably low and below
average working capital turnover ratio is ITC. Throughout the 10 years of time period,
ITC always has a working capital turnover ratio which is least compared to all the
companies. So, it can be said that among all the FMCG companies, ITC has the most
poor working capital turnover ratio. Refer Table 42.

176
6.8 Current Assets Turnover Ratio
Current assets turnover is an efficiency measurement accountants apply to a company’s
financial statements. The result from this formula is a metric that indicates how well a
company generates sales revenue from the current assets it owns. A higher number is
generally preferable as the company uses its assets in the most efficient manner possible.
Current assets turnover = Net sales / current assets
6.8.1 Current Assets Turnover Ratio of individual companies
(Rs in crores)
Table 43: Current Assets Turnover Ratio of ITC
Year Net Sales Current Assets Ratio
2011-12 25999 14444 1.8
2010-11 22039 13046 1.69
2009-10 18757 12497 1.5
2008-09 16147 10105 1.6
2007-08 14558 9108 1.6
2006-07 12501 8522 1.47
2005-06 10077 7894 1.28
2004-05 7875 6628 1.19
2003-04 6695 5382 1.24
2002-03 6035 4162 1.45
Grand Average 1.48

177
Table above shows the current asset turnover ratio of ITC. If we look at all the years, the
ratio varied from 1.19 to 1.80 and it has also shown an increasing trend in the recent
years. It started with 1.45 in the year 2002-2003 and then fell in the next year to 1.24 and
then further fell to 1.119 in the year 2004-2005. After that , the ratio kept on increasing
till 2011-2012. Higher the ratio, better is for the company as it shows how many times the
current assets are converting into sales. ITC has the lowest ratio among all the other
companies taken in the study.

178
(Rs in crores)
Table 44: Current Assets Turnover Ratio of HUL
Year Net Sales Current Assets Ratio
2011-12 22395 7799 2.87
2010-11 20008 6074 3.29
2009-10 17873 5368 3.33
2008-09 20829 5601 3.72
2007-08 14180 3277 4.33
2006-07 12458 3170 3.93
2005-06 11365 2763 4.11
2004-05 10246 3305 3.1
2003-04 10598 3502 3.03
2002-03 10339 3431 3.01
Grand Average 3.47
Table 44 shows the current assets turnover ratio of HUL for last 10 years. The ratio
seems to be high and ranges between 2.87 and 4.33. it indicates that the current assets of
HUL are efficient in maintain the current assets in such a way that lesser current assets

179
are resulting in higher sales of the company specially as compared to ITC. Moreover we
have also seen that HUL has maintained a low level of current assets in all the other
ratios like inventory turnover ratio, account receivable ratio and working capital turnover
ratio. This shows the efficacy of HUL in maintain its working capital.
(Rs in crores)
Table 45: Current Assets Turnover Ratio of Nestle
Year Net Sales Current Assets Ratio
2011-12 7542 1407 5.36
2010-11 6297 1197 5.26
2009-10 5167 1060 4.87
2008-09 4358 833 5.23
2007-08 3530 732 4.82
2006-07 2837 613 4.63
2005-06 2501 567 4.41
2004-05 2242 513 4.37
2003-04 2308 438 5.27
2002-03 2076 400 5.19
Grand Average 4.94

180
Current assets turnover ratios of Nestle for last 10 years are indicated in the above table.
The table shows that the ratios maintained by Nestle are quite high which indicate that
Nestle has been maintaining a low level of current assets and with this level, it is
resulting in high sales. This kind of situation is very beneficial for the company as it
results in increasing return on total capital and equity. This reflects a light on the stringent
working capital policy followed by Nestle in all the years as the value of current assets
turnover ratio revolves around 5 in all the 10 years considered for the study.
(Rs in crores)
Table 46: Current Assets Turnover Ratio of Dabur
Year Net Sales Current Assets Ratio
2011-12 3813 1680 2.27
2010-11 3307 1396 2.37
2009-10 2890 1158 2.50
2008-09 2439 863 2.83
2007-08 2111 756 2.79
2006-07 1617 476 3.40
2005-06 1375 325 4.23
2004-05 1280 296 4.32
2003-04 1160 334 3.47
2002-03 1241 413 3.00
Grand Average 3.12

181
Table 46 shows the current assets turnover ratio of Dabur. The values indicate that Dabur
is able to cover its sales almost three times of its current assets. This reflects the efficacy
of the company in maintaining its current assets. The ratio was 3 in year 2002-2—3 and
kept on increasing till year 2004-2005 when it reached 4.32. From this year, the value of
the ratio kept on decreasing year after year till 2011-2012 when it touched a low of 2.27.
this indicates that although the company has increased sales every year but in order to
maintain these sales figure the company kept on increasing the current assets.

182
(Rs in crores)
Table 47: Current Assets Turnover Ratio of Britannia
Year Net Sales Current Assets Ratio
2011-12 5033 858 5.87
2010-11 4272 704 6.07
2009-10 3458 801 4.32
2008-09 3152 836 3.77
2007-08 2635 733 3.59
2006-07 2231 571 3.91
2005-06 1735 442 3.93
2004-05 1589 392 4.05
2003-04 1494 285 5.24
2002-03 1329 276 4.82
Grand Average 4.56
Current assets turnover ratios of Britannia are shown in the above table. The value
indicates that the company has been very efficient in converting its current assets into
sales as much as possible. The ratio started with a high of 4.82 in the year 2002-2003 and

183
increased in the next year too showing that the company is capable of keeping low levels
of current assets in spite of increasing sales figures. From 2004-2005, the ratio started
falling as the proportional change in current assets was more than the proportional change
in sales figures. The ratio went on decreasing and touched a low of 3.77 in the 2008-2009
after that the ratio showed an increasing trend. The ratio was 5.87 in 2011-2012.
6.8.2 Current Assets Turnover Ratio of 5 companies and the industry
average
Table 48: Current Assets Turnover Ratio of 5 companies and the industry Average
Year ITC HUL Nestle Dabur Britannia
Industry
Average
2011-12 1.80 2.87 5.36 2.27 5.87 3.63
2010-11 1.69 3.29 5.26 2.37 6.07 3.74
2009-10 1.50 3.33 4.87 2.50 4.32 3.30
2008-09 1.60 3.72 5.23 2.83 3.77 3.43
2007-08 1.60 4.33 4.82 2.79 3.59 3.43
2006-07 1.47 3.93 4.63 3.40 3.91 3.47
2005-06 1.28 4.11 4.41 4.23 3.93 3.59
2004-05 1.19 3.10 4.37 4.32 4.05 3.41
2003-04 1.24 3.03 5.27 3.47 5.24 3.65
2002-03 1.45 3.01 5.19 3.00 4.82 3.49
Grand
Average 1.48 3.47 4.94 3.12 4.56 3.51

184
2011-2012
Table 48 shows the current assets turnover ratio of all companies taken in the study along
with the industry average. Year 2011-2012 shows that the industry average is 3.63. The
company maintaining the highest current assets turnover ratio is Britannia followed by
Neslte. It shows that the companies are having higher sales volumes at a lower level of
gross working capital maintained by the companies. The third position is that of HUL
followed by Dabur and than ITC. As we know that higher the ratio, better is for the
company so if we analyse it for the FMCG sector, almost all the companies are
maintaining a desirable value of the ratio.
2010-2011
The industry’s current assets ratio of FMCG sector is 3.74 in year 2010-2011. The
company maintaining the highest ratio is again Britannia with the value of 6.07 followed
by Nestle with the value of 5.26. These two companies have maintained the best ratio in

185
almost all the years considered in the study. Again the company having the third position
is HUL with the value of 3.29. Dabur maintained the same position this year too with the
value of 2.37. The company having the least value of current assets turnover ratio is ITC
with the value of 1.69.
2009-2010
In year 2009-2010, almost all the companies have a ratio lower than that of 2010-2011
hence the industrial average is also down to. Inspite of the lower industry’s average,
Britannia and Nestle maintained a higher ratio with comparison to other companies but
the position of Britannia slipped down by one rank with the value of current assets
turnover ratio as 4.32 and the first position is taken over by Nestle with the value of the
ratio as 4.87. HUL still maintained the third position followed by Dabur and ITC.
2002-2003 to 2008-2009
Table 48 shows the industry’s average of current assets turnover ratio of FMCG
companies. The ratio for the years 2002-03 to 2008-09 ranges near 3.5 which is very
efficient figure for a proper management of working capital. It shows that the industry is
efficient enough to increase its sales year after year without increasing the proportion of
current assets. Nestle is the company that maintained the highest current assets turnover
ratio among all the other companies in these seven years. After Nestle, it is Britannia that
backed the second highest values of this ratio in these years. Dabur and HUL have shown
a changing trend every year with values of the ratio fluctuating each year. Sometimes
HUL takes a better position and sometimes Dabur. But ITC is the company which has

186
consistently kept the lowest value of current assets turnover ratio in all the years taken
into consideration. This shows that the companies sales are increasing but simultaneously
its current assets are also increasing being a FMCG company.