chapter 6 earthquake - wyoming office of homeland...
TRANSCRIPT

Wyoming Multi-Hazard Mitigation Plan 6.1 June 2011
CHAPTER 6
EARTHQUAKE An earthquake is generally defined as a sudden motion or trembling in the Earth caused by the abrupt release of slowly accumulated strain. The most common types of earthquakes are caused by movements along faults and by volcanic forces, although they can also result from explosions, cavern collapse, and other minor causes not related to slowly accumulated strains. Earthquakes are common in Wyoming and the probability is high they will continue to occur in Wyoming into the future. Historically, earthquakes have occurred in every county in Wyoming (Figure 6.1). However, most earthquakes in Wyoming occur in the western third of the state. The first reported earthquake occurred in Yellowstone National Park in 1871 and the most recent likely occurred in the park. Yellowstone National Park is one of the more seismically active areas in the U.S.
Figure 6.1—HistoricWyoming Earthquakes (Magnitude >= 2.5 or Intensity >= III) from 1871 to present Epicenters shown in red
http://www.wrds.uwyo.edu/wrds/wsgs/hazards/quakes/quake.html 12/15/2010

Wyoming Multi-Hazard Mitigation Plan 6.2 June 2011
Earthquake Sources Most Wyoming earthquakes outside of Yellowstone National Park occur as a result of movement on faults. If the fault has moved within the Quaternary Period, or last 1.6 million years, the fault is considered to have the greatest potential to be the source of future large earthquakes (Michael Machette, U.S. Geological Survey Fact Sheet 2004-3033). Quaternary faults that show movement over the past 10,000 years are considered to be “active.” Of the approximately 80 Quaternary faults in Wyoming (Figure 2), 26 are considered to be “active.” The most well known “active” fault in Wyoming is the Teton fault near Jackson. Active faults can be exposed at the surface (Figure 6.2) or deeply buried with no significant surface expression. Historically, no earthquakes have been associated with exposed active faults. The exposed active faults, however, have the potential to generate the largest earthquakes. As a result it is necessary to understand both exposed and buried active faults in order to generate a realistic seismological characterization of the state.
Figure 6.2—Exposed Known or Suspected Active Faults in Wyoming.

Wyoming Multi-Hazard Mitigation Plan 6.3 June 2011
Many of the exposed active faults, including the Teton fault, Star Valley fault, Greys River fault, Rock Creek fault, and the Bear River fault system in western Wyoming are capable of generating magnitude 7.0 to 7.5 earthquakes. All of those fault systems have been active in the last 10,000 years, and most are considered to be overdue for activation. In central Wyoming, the Stagner Creek fault system near Boysen Reservoir and the South Granite Mountain fault system near Jeffrey City, are both capable of generating magnitude 6.5 to 6.75 earthquakes. The Cedar Ridge-Dry Fork fault system near Lysite has limited evidence indicating it may be active, and may be capable of a magnitude 6.7 to 7.1 earthquake. The Chicken Springs fault system near Bairoil is capable of generating magnitude 6.5 to 6.7 earthquakes. Historically, no earthquakes have been directly associated with the exposed active faults. Instead, they are tied to faults that are buried. Buried faults that have never broken the surface, are generally considered to be capable of generating up to magnitude 6.5 earthquakes. Since the distribution of the buried faults is not well known, it is assumed that earthquakes up to magnitude 6.5 can occur anywhere in the state. The probability of such an earthquake is lowest in the southeast and northeast corners of the state, although a magnitude 6.2 to 6.6 earthquake did occur in 1882 between Laramie and Estes Park, Colorado. As mentioned above, earthquakes are common in Yellowstone National Park. A dynamic magma chamber beneath the park, combined with regional tectonic forces, results in significant seismic activity. Many of the earthquakes are associated with movement within or around the magma chamber. Some of the earthquakes are associated with active faults. Yellowstone is a super-volcano, and it has explosively erupted 0.64 million, 1.3 million, and 2.1 million years ago. The explosive eruptions led to the formation of giant calderas, the collapse of which led to the formation of many faults in the vicinity. In addition, after the major eruptions, resurgent domes formed within the calderas. The doming process led to the formation of other faults. As a result, many of the faults in Yellowstone are not considered major threats. There are other faults, however, that are easily capable of generating magnitude 6.5+ earthquakes. In 1959, a magnitude 7.5, intensity X earthquake occurred just west of Yellowstone National Park, near Hebgen Lake, Montana. That earthquake is a model for the types of earthquakes that can occur in western Wyoming. Even though Wyoming has not experienced a magnitude 7.5 earthquake within its borders in the last 130 years, the potential does exist. Attempts were made to access current earthquake data utilizing the US Geological Survey Web Site. The most recent Wyoming posting to their Historic United States Earthquakes page reflects a 2004 earthquake, magnitude 3.8. (http://earthquake.usgs.gov/earthquakes/states/historical_state.php) However, there have been two earthquake swarms in Yellowstone Park in recent years. The first occurred between December 2008 and January 2009. (http://volcanoes.usgs.gov/yvo/publications/2009/09swarm.php 12/15/2010) The second earthquake swarm began on January 15, 2010, diminished to near-background levels by the
Wyoming Multi-Hazard Mitigation Plan 6.4 June 2011
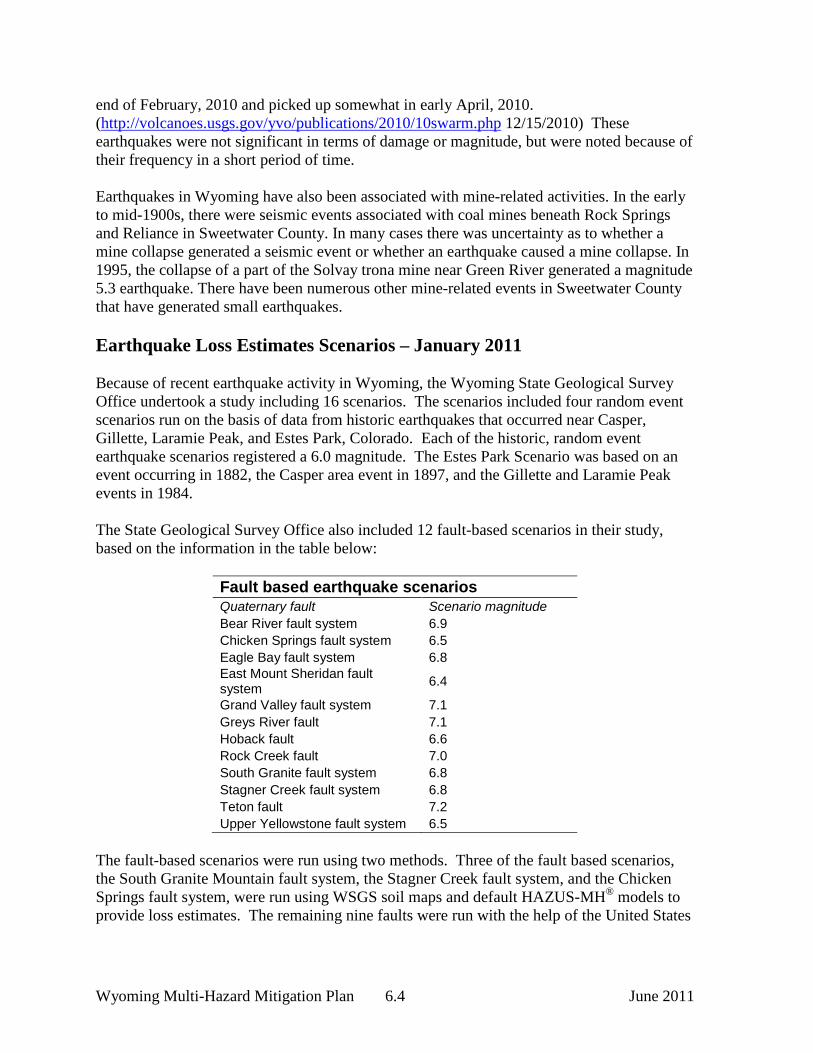
end of February, 2010 and picked up somewhat in early April, 2010. (http://volcanoes.usgs.gov/yvo/publications/2010/10swarm.php 12/15/2010) These earthquakes were not significant in terms of damage or magnitude, but were noted because of their frequency in a short period of time. Earthquakes in Wyoming have also been associated with mine-related activities. In the early to mid-1900s, there were seismic events associated with coal mines beneath Rock Springs and Reliance in Sweetwater County. In many cases there was uncertainty as to whether a mine collapse generated a seismic event or whether an earthquake caused a mine collapse. In 1995, the collapse of a part of the Solvay trona mine near Green River generated a magnitude 5.3 earthquake. There have been numerous other mine-related events in Sweetwater County that have generated small earthquakes. Earthquake Loss Estimates Scenarios – January 2011 Because of recent earthquake activity in Wyoming, the Wyoming State Geological Survey Office undertook a study including 16 scenarios. The scenarios included four random event scenarios run on the basis of data from historic earthquakes that occurred near Casper, Gillette, Laramie Peak, and Estes Park, Colorado. Each of the historic, random event earthquake scenarios registered a 6.0 magnitude. The Estes Park Scenario was based on an event occurring in 1882, the Casper area event in 1897, and the Gillette and Laramie Peak events in 1984. The State Geological Survey Office also included 12 fault-based scenarios in their study, based on the information in the table below:
Fault based earthquake scenarios Quaternary fault Scenario magnitude Bear River fault system 6.9 Chicken Springs fault system 6.5 Eagle Bay fault system 6.8 East Mount Sheridan fault system 6.4
Grand Valley fault system 7.1 Greys River fault 7.1 Hoback fault 6.6 Rock Creek fault 7.0 South Granite fault system 6.8 Stagner Creek fault system 6.8 Teton fault 7.2 Upper Yellowstone fault system 6.5
The fault-based scenarios were run using two methods. Three of the fault based scenarios, the South Granite Mountain fault system, the Stagner Creek fault system, and the Chicken Springs fault system, were run using WSGS soil maps and default HAZUS-MH® models to provide loss estimates. The remaining nine faults were run with the help of the United States

Wyoming Multi-Hazard Mitigation Plan 6.5 June 2011
Geological Survey (USGS): the USGS provided shakemaps, which model ground shaking parameters on the basis of complex attenuation functions.
The random event scenarios are based on historic events, and although the data
provided is beneficial, the odds of an earthquake happening in the exact location of each scenario are infinitesimal. On the other hand the fault based scenarios are based on faults that have been deemed potential sources of earthquakes. It is impossible to say when an earthquake can occur, but fault sources point to where large destructive earthquakes would happen. This study is not all-inclusive, but does provide valuable information for planning purposes. Scenario regions covered only those areas that would experience potentially damaging modeled ground motions (> 3.5%g). Areas outside the region boundaries would undoubtedly experience shaking from the earthquake; but structural damage would not be expected. The scenario-based study is nearly ready to publish at the time of this plan. The draft report has been provided to each requesting county at no cost to them. The report includes information regarding the likelihood of damage to local and regional infrastructure, including fire stations, police stations, sheriffs’ departments, schools, and hospitals. The scenarios reflect anticipated functionality of each infrastructure system immediately following the scenario earthquake, on day seven following the earthquake and one month after the earthquake. Additional information provided includes anticipated households displaced or seeking temporary shelter, electrical outages anticipated, number of households without potable water, debris generated by the scenario and economic losses resulting from three categories: buildings, transportation and utilities. (see Appendix ‘Earthquake Loss Estimate Scenarios’) The information provided in the report will allow for more intelligent exercising of responses and more complete, concrete information for proposed earthquake mitigation projects undertaken both locally and statewide. The scenario-based report with all scenarios described is attached as an appendix to this plan. The scenarios were developed utilizing the most current development information available at the time. 2010 Census data has since become available and will be utilized in future earthquake research. Following is one sample scenario developed by the Wyoming Geological Survey Office utilizing HAZUS-MH: Fault based scenario - Bear River fault system
The Bear River fault zone is located in Uinta County, Wyo. and Summit County,
Utah. The average strike is 349 degrees, the length is 35 km, and the dip is 45-80 degrees W (USGS, 2004). The fault slip-rate is between 1.0 and 5.0 mm/yr.
The USGS describes the geologic setting of the Bear River fault zone as a generally north-trending fault zone east of the Bear River drainage on the west flank of the Uinta Mountains. The fault lies between the leading edges of the Absaroka and Darby-Hogsback thrust faults. This newly activated fault zone is east of the Bear River and is expressed as short, generally right-stepping, north-trending scarps that abruptly change to east-northeast trend at the southern end. The associated west-dipping normal faults are inferred to merge

Wyoming Multi-Hazard Mitigation Plan 6.6 June 2011
into a ramp of the Laramide-age Darby-Hogsback thrust fault at a depth of about 5-7 km. Case (1997) gives a maximum credible earthquake of magnitude 7.5. The earthquake scenario for the Bear River fault system was modeled at magnitude 6.9. The earthquake would cause damage in Lincoln, Sweetwater, and Uinta counties. Scenario results show that very light damage would be expected as far as 55 miles from the epicenter, near Granger (Figure 3). Light damage would be expected within 40 miles, out to Ft. Bridger. Moderate to heavy damage is likely within 15 miles of the fault, which includes the city of Evanston where ground accelerations of 18-34% gravity (g) would be expected. Beartown and Hilliard would expect the highest amount of shaking, with ground acceleration modeled between 34 and 65%g (MMI VIII). These are also the places where damage would be expected to be the greatest. The total population in the scenario region is 19,814 according to the 2000 census. The scenario results estimate that of the 19,814 people, 116 households would be displaced, and 80 people would seek temporary shelter.
There are 9,180 buildings in the area, and the scenario shows that 1,147 of those would sustain at least moderate damage from the earthquake. The earthquake would generate 25,000 tons of debris.
Bear River fault system earthquake scenario quick reference page
Counties affected Uinta, Lincoln, Sweetwater
Scenario magnitude 6.9
Slip rate 1.0 - 5.0 mm/yr
Recurrence interval 1-100 ky
Region population 19,804 (2000 Census)
Region building count 9,173
Region building value 1.199 billion dollars
Buildings with at least moderate damage 1146
Hospitals functional @ Day 1 2 / 2
Schools functional @ Day 1 17 / 17
Police stations functional @ Day 1 5 / 5
Fire stations functional @ Day 1 6 / 7
Highway segments functional @ Day 1 63 / 63
Bridges functional @ Day 1 127 / 128
Households without potable water @ Day 1 4,243 / 6,847
Households without electricity @ Day 1 0 / 6847

Wyoming Multi-Hazard Mitigation Plan 6.7 June 2011
Debris generated 25,000 tons
Displaced households 116
People seeking temporary shelter 80
Direct economic loss 87.770 million dollars
Figure 3. Map showing ground acceleration based on a magnitude 6.9 earthquake from the Bear River Fault System Damage to essential facilities Essential facilities include fire stations, hospitals, police stations, and schools. There are 31 essential facilities that would experience damaging ground motions: 7 fire stations, 2 hospitals, 5 police stations, and 17 schools. For more detailed information about essential facilities see the Bear River folder listed in Appendix B. Fire stations
Table 2 shows that of the seven fire stations at risk of damage, the Hilliard fire station would have a greater than 50% risk of being at least slightly damage. The Hilliard fire station would be exposed to 54%g ground accelerations and would have a 94% chance of at least moderate damage and a 55% chance of extensive damage.

Wyoming Multi-Hazard Mitigation Plan 6.8 June 2011
Table 1. Bear River fault system fire station damage probability
Name City PGA (%g)
Damage Slight Moderate Extensive
Hilliard Evanston 54.32% 98.59% 93.48% 55.12% Uinta Co-Evanston-2 Evanston 19.48% 43.08% 22.90% 10.47% Evanston FD Evanston 19.28% 36.03% 13.95% 0.63% Almy Fire Hall Evanston 12.76% 11.43% 2.62% 0.04% Uinta Co Ft. Bridger Fort Bridger 9.60% 3.26% 0.49% 0.00% Uinta Co-Mountain View Mountain View 9.20% 3.03% 0.44% 0.00% Uinta Co-Lyman Lyman 8.36% 1.45% 0.17% 0.00%
Estimates of fire station functionality show that the Hilliard fire station would be only
1.4% functional on the day of the earthquake, while the Uinta County-Evanston fire station would be 56% functional (Table 3). The Evanston Fire Department would have 63% functionality. The other fire stations, Almy Fire Hall and fire stations in Ft. Bridger, Mountain View, and Lyman would be expected to be greater than 80% functional the day of the earthquake. By day 7 after the earthquake the Hilliard fire station would be 6.3% functional, while the remaining fire stations would all be greater than 75% functional. The scenario also shows that within one month of the earthquake the Hilliard fire station would be 44% functional, the Uinta County-Evanston fire station would be up to 89% functional, and the other fire stations should be fully functional.
Table 2. Bear River fault system fire station functionality
Name City Functionality
Day 1 Day 2 Day 3 Hilliard Evanston 1.4% 6.3% 44.8% Uinta Co-Evanston-2 Evanston 56.9% 76.6% 89.5% Evanston FD Evanston 63.9% 85.5% 99.3% Almy Fire Hall Evanston 88.5% 97.1% 99.9% Uinta Co Ft. Bridger Fort Bridger 96.7% 99.4% 99.9% Uinta Co-Mountain View Mountain View 96.9% 99.4% 99.9% Uinta Co-Lyman Lyman 98.5% 99.7% 99.9%
Hospitals Table 4 shows the two hospitals at risk of damage from an earthquake on the Bear River fault system. Both hospitals would experience up to 20%g ground accelerations and there is a 60% chance that both would be at least slightly damaged. Table 3. Bear River Fault Scenario Hospital Damage Probability
Name City PGA (%g)
Damage Slight Moderate Extensive
Wyoming State Hospital Evanston 20.56% 61.74% 36.27% 6.94% Evanston Regional Hospital
Evanston 20.28% 60.61% 34.30% 3.94%

Wyoming Multi-Hazard Mitigation Plan 6.9 June 2011
Each hospital would be approximately 40% functional the day of the earthquake (Table 5). A week after the earthquake the hospitals would be 63-65% functional and by 30 days after the earthquake both hospitals would be over 90% functional. Table 4. Bear River fault scenario hospital functionality
Name City Functionality Day 1 Day 7 Day 30
Wyoming State Hospital Evanston 38.2% 63.1% 93.0% Evanston Regional Hospital Evanston 39.3% 65.0% 96.0%
Police stations There are five police stations at risk for damage from an earthquake (Table 6). Of the five police stations only the two in Evanston, Uinta County Sheriff Headquarters and the Evanston Police Dept. Headquarters, would be at risk for very strong shaking. The Uinta County Sheriff Headquarters would have a probability of 41% to receive at least slight damage, while the Evanston PD HQ would have a 36% chance of sustaining at least slight damage. The three police stations in Mountain View and Lyman would experience moderate shaking, but would have a very low chance of sustaining any damage from the earthquake. Table 5. Bear River fault system police station damage probability
Name City PGA (%g)
Damage Slight Moderate Extensive
Uinta County Sheriff's HQ Evanston 20.76% 41.19% 17.21% 0.91% Evanston PD HQ Evanston 19.28% 36.03% 13.95% 0.63% Uinta County Sheriff-Mountain View Substation
Mountain View 9.28% 2.58% 0.36% 0.00%
Mountain View PD HQ Mountain View 9.20% 3.03% 0.44% 0.00% Lyman PD HQ Lyman 8.36% 1.45% 0.17% 0.00%
Table 7 shows that the three police stations outside Evanston would be more than
90% functional on the day of the earthquake and at 99% functionality within 7 days. The Uinta County Sheriff Headquarters would be only 59% functional at day 1, while the Evanston Police Department Headquarters would be 64% functional. By 30 days after the earthquake, both would be fully functional. Table 6. Bear River fault system police station functionality
Name City Functionality Day 1 Day 7 Day 30
Uinta County Sheriff HQ Evanston 58.8% 82.2% 99.0% Evanston PD HQ Evanston 63.9% 85.5% 99.3% Mountain View PD HQ Mountain
View 96.9% 99.4% 99.9%
Uinta County Sheriff-Mountain View Substation
Mountain View
97.4% 99.5% 99.9%
Lyman PD HQ Lyman 98.5% 99.7% 99.9%

Wyoming Multi-Hazard Mitigation Plan 6.10 June 2011
Schools
There are 17 school buildings vulnerable to damage from the earthquake (Table 8). As with other essential facilities, schools in the Evanston area would experience the most shaking and highest probability of damage, while schools in Mountain View and Lyman would have a small probability of damage. Of the Evanston schools, Aspen Elementary would experience the strongest shaking (22%g), while North Evanston Elementary would experience slightly weaker ground motion (19%g). School buildings in Evanston would have a 30-50% chance of at least slight damage and a 2-20% chance of at least moderate damage. All the schools in Evanston would experience very strong ground motions while those in Mountain View, Ft Bridger, and Lyman would experience moderate shaking. Table 7. Bear River fault system school building damage probability
Name City PGA (%g) Damage
Slight Moderate Extensive Aspen Elem. Evanston 21.60% 44.36% 19.38% 1.13% Wyoming State Hospital Evanston 21.44% 45.81% 21.94% 4.72% Uinta Meadows Elem. Evanston 20.64% 41.03% 17.10% 0.90% Evanston Middle School Evanston 20.24% 39.74% 16.27% 0.82% Evanston High School Evanston 20.16% 39.75% 16.27% 0.82% Davis Middle School Evanston 19.76% 38.30% 15.35% 0.74% Horizon Alt. School Evanston 19.48% 29.13% 1.92% 0.01% Clark Elementary Evanston 19.24% 36.20% 14.05% 0.63% North Evanston Elementary
Evanston 19.00% 41.06% 21.38% 9.76%
Mountain View High School
Mountain View
9.20% 3.03% 0.44% 0.00%
Mountain View Elementary Mountain View
9.20% 3.03% 0.44% 0.00%
Mountain View Middle School
Mountain View
9.20% 3.03% 0.44% 0.00%
Ft. Bridger Elementary Ft. Bridger 9.20% 3.03% 0.44% 0.00% Urie Elementary Lyman 8.88% 2.76% 0.39% 0.00% Lyman High School Lyman 8.44% 1.53% 0.18% 0.00% Lyman Middle School Lyman 8.32% 1.94% 0.25% 0.00% Lyman Elementary Lyman 8.32% 1.91% 0.24% 0.00%
Table 9 shows the functionality of the schools in Evanston the day of the earthquake to be between 54 and 71%. The functionality would increase to about 80% by day 7, and within a month the schools would be fully functional again. The schools outside Evanston show high functionality the day of the earthquake. Table 8. Bear River fault system school building functionality
Name City Functionality Day 1 Day 7 Day 30
Wyoming State Hospital Evanston 54.1% 77.5% 95.2% Aspen Elem. Evanston 55.6% 80.0% 98.8% Uinta Meadows Elem. Evanston 58.9% 82.3% 99.0% North Evanston Elementary Evanston 58.9% 78.1% 90.2% Evanston High School Evanston 60.2% 83.1% 99.1%

Wyoming Multi-Hazard Mitigation Plan 6.11 June 2011
Evanston Middle School Evanston 60.2% 83.1% 99.1% Davis Middle School Evanston 61.6% 84.1% 99.2% Clark Elementary Evanston 63.7% 85.4% 99.3% Horizon Alt. School Evanston 70.8% 97.4% 99.9% Mountain View High School Mountain
View 96.9% 99.4% 99.9%
Ft. Bridger Elementary Ft. Bridger 96.9% 99.4% 99.9% Mountain View Elementary Mountain
View 96.9% 99.4% 99.9%
Mountain View Middle School
Mountain View
96.9% 99.4% 99.9%
Urie Elementary Lyman 97.2% 99.5% 99.9% Lyman Middle School Lyman 98.0% 99.6% 99.9% Lyman Elementary Lyman 98.0% 99.7% 99.9% Lyman High School Lyman 98.4% 99.7% 99.9%
Economic loss
The modeled earthquake on the Bear River fault system would cause a total economic loss of 87 million dollars for the region. Direct economic losses are estimated in three categories: buildings, transportation, and utilities. Information about direct economic loss for each of the three categories can be found in the Bear Fiver Fault System folder located in Appendix B. Buildings
Direct economic losses for buildings, which include structural and content damage,
would total 64.448 million dollars for the region. Uinta County would experience the most damage at 64.447 million, while Sweetwater County would have about a thousand dollars in direct economic loss for buildings. Lincoln County would not be expected to suffer any direct economic loss from building damage. Transportation
Lincoln and Sweetwater Counties would not be expected to have any direct economic losses for transportation systems. Uinta County would experience a direct economic loss of 2.451 million dollars. The losses reflect damage to highways, bridges, and railways. Utilities The regional direct economic loss for utilities would be 20.872 million dollars. Lincoln County would account for 45 thousand dollars of damage to potable water, waste water, and natural gas pipelines. Sweetwater County would account for 44 thousand dollars in damage to the same infrastructure. As seen in the two previous categories, Uinta County would account for the greatest economic loss. The direct economic loss for utilities in Uinta County would be 20.782 million dollars. Potable water, waste water, and natural gas

Wyoming Multi-Hazard Mitigation Plan 6.12 June 2011
pipelines would suffer damage, waste water, natural gas, and communication facilities would also likely be damaged.
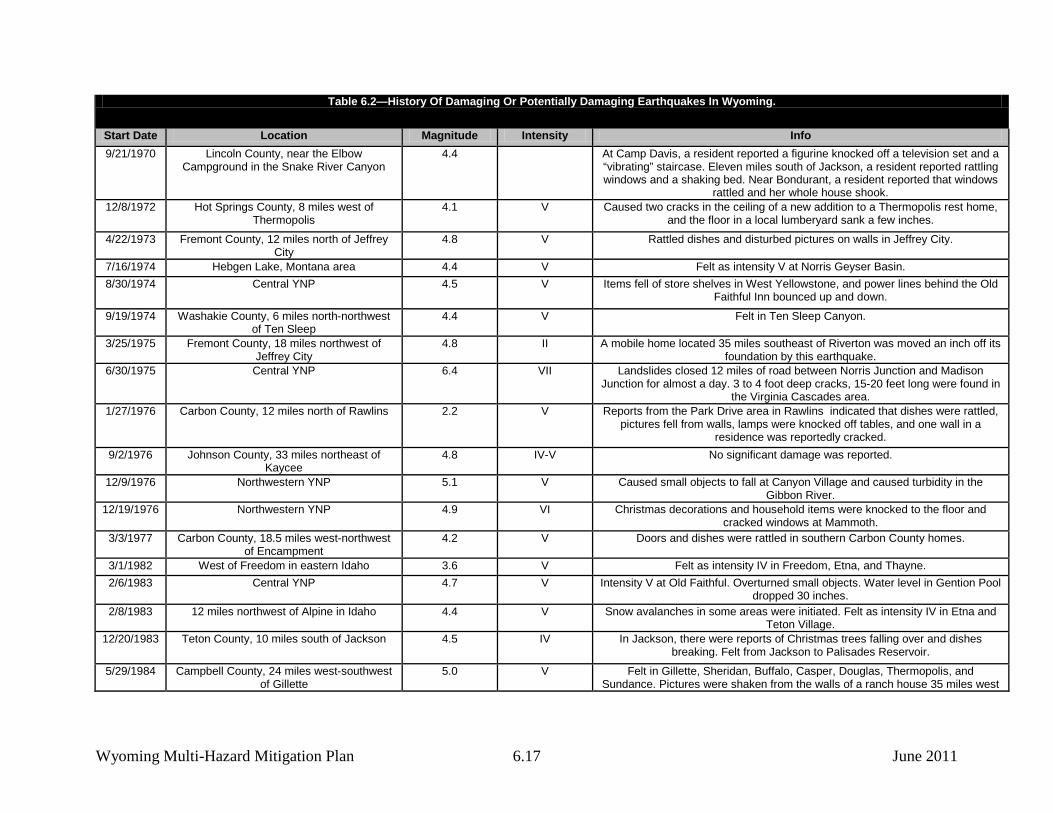
[*Wyoming Geological Survey Office – 2011] History A detailed description of all earthquakes in Wyoming can be found on a website at http://www.wrds.uwyo.edu/wrds/wsgs/hazards/quakes/seischar/seischar.html. The earthquake history of Wyoming is only 130 years, and there are gaps in the record for the late 19th Century and first half of the 20th Century. After the Hebgen Lake earthquake in 1959, however, monitoring in Wyoming started to improve. Prior to the 1950s, most earthquakes were detected and located by personal reports. After the 1950s, earthquakes were more commonly located by seismometers. Earthquakes have many measures, with magnitudes and intensities being the most common. Magnitudes are instrumentally determined measures of the amount of energy released during an earthquake. Each one step increase in magnitude is roughly equivalent to a release of 32 times more energy. Intensities are a subjective measure of how an earthquake was felt. As a result, an earthquake with a single magnitude can have much intensity associated with it, depending on the distance an observer is from the earthquake source and the response of surficial materials. An abbreviated intensity scale is presented in Table 6.1. Minor structural damage or damage to objects on walls or shelves does not occur until intensity V is reached. It is more difficult to determine at what magnitude damage may occur, as the orientation of a fault plane, the depth of the rupture on the fault, the bedrock, and surficial sediments all affect the transmission and attenuation of seismic waves. An attenuated seismic history of Wyoming, including earthquakes with intensities of V or greater, magnitudes of 5.0 or greater, or earthquakes with smaller assigned intensities or magnitudes that did cause some type of damage is presented in Table 6.2.

Wyoming Multi-Hazard Mitigation Plan 6.13 June 2011
Table 6.1—Abridged Modified Mercalli Intensity Scale.
Intensity Intensity description I Not felt except by a very few under especially favorable circumstances. II Felt only by a few persons at rest on upper floors of buildings. Delicately suspended objects may swing. III Felt noticeably indoors, especially on upper floors. Standing automobiles rock slightly. Vibration like passing truck.
IV During the day felt indoors by many, outdoors by few. Dishes, windows, doors disturbed; walls make creaking sound. Sensation like heavy truck striking building. Standing automobiles rocked noticeably.
V Felt by nearly everyone, many awakened. Some dishes and windows broken; cracked plaster in a few places; unstable objects overturned. Pendulum clocks may stop.
VI Felt by all, many frightened and run outdoors. Some heavy furniture moved; a few instances of fallen plaster and damaged chimneys. Damage slight.
VII Everybody runs outdoors. Damage minor in buildings of good design and construction; slight to moderate in well-built ordinary structures; considerable in poorly built structures; some chimneys broken. Noticed by persons driving cars.
VIII Damage slight in specially designed structures; considerable in ordinary buildings with partial collapse; great in poorly built structures. Chimneys and walls fall. Heavy furniture overturned. Well water changes. Persons driving cars disturbed.
IX Damage considerable in specially designed structures; frame structures thrown out of plumb; great in substantial buildings, with partial collapse. Buildings shifted off foundations. Ground cracked conspicuously. Underground pipes broken.
X Some well-built wooden structures destroyed; most masonry and frame structures destroyed; ground badly cracked. Rails bent. Landslides considerable from river banks and steep slopes. Shifted sand and mud.
XI Few (masonry) structures remain. Bridges destroyed. Broad fissures in ground. Underground pipelines completely out of service. Earth slumps and land slips in soft ground. Rails bent greatly.
XII Damage total. Waves seen on ground surface. Lines of sight and level distorted. Objects thrown into the air.

Wyoming Multi-Hazard Mitigation Plan 6.14 June 2011
Table 6.2—History Of Damaging Or Potentially Damaging Earthquakes In Wyoming.
Start Date Location Magnitude Intensity Info 11/7/1882 Laramie to Estes Park Area 6.2 – 6.6 VII Felt over most of Colorado, the southern half of Wyoming, and northeastern
Utah. In Laramie, clocks were stopped, plaster was cracked, and some glass in windows was broken.
2/20/1893 Yellowstone National Park (YNP) VIII-IX There had been a series of earthquakes in the Park for a few weeks previous to a February 23, 1893 report. The main road south of Norris Geyser basin caved
in for a long distance. In one area there was a gap 75 feet wide and several hundred feet in length. After the earthquakes, there was violent activity at the
Giant, Giantess, and Great Castle geysers. 6/25/1894 Natrona County, 3 miles southwest of
Evansville V Residents on Casper Mountain reported that dishes rattled to the floor and
people were thrown from their beds. Water in the Platte River changed from fairly clear to reddish, and became thick with mud due to the riverbanks
slumping into the river during the earthquake. 2/03/1897 Crook County, near Sundance IV-V Severely shook the Shober School on Little Houston Creek, southwest of
Sundance. 11/14/1897 Natrona County, 3 miles southwest of
Evansville VI-VII It caused considerable damage to a few buildings. As a result of the earthquake,
a portion of the Grand Central Hotel was cracked from the first to the third story. Some of the ceilings in the hotel were also severely cracked.
7/25/1910 Sweetwater County, Union Pacific No. 1 Mine, Rock Springs
V Partial mine collapse. Not known if mine collapse generated the earthquake or if an earthquake with a tectonic source caused the mine to collapse.
10/24/1922 Johnson County, 8 miles east of Sheridan V Houses were shaken and dishes were rattled near Sheridan. 10/25/1922 Natrona County, 6 miles north-northeast of
Barr Nunn V Dishes were rattled and hanging pictures were tilted near Salt Creek. Felt in
Casper, Salt Creek, and Bucknum.
3/24/1923 Teton County, 13 miles northeast of Jackson
V Several shocks were felt, with the largest rocking buildings all over the county. The paper reported that “Rocks weighing tons were shaken loose along the
Tetons and in the hills about Gros Vantre, and rolled into the valley.”
12/12/1923 Fremont County, 3 miles northwest of Atlantic City
V No significant damage was reported.
6/21/1925 Teton County, Jackson area Earthquakes may have contributed to the destabilization of the lower Gros Ventre landslide on June 23, 1925. River was dammed.
11/17/1925 Big Horn County, 12 miles north-northeast of Hyattville
V The tremors shook cabins, pictures, and furniture. A “distinct roar” at Dome Lake was attributed to a possible earthquake-induced landslide. Felt in
Sheridan, Fort McKenzie, and at Dome Lake Resort. 2/13/1928 Hot Springs County, 10 miles south of
Thermopolis IV Reports indicate that two men entered their mine near Bonneville when
aftershocks were occurring and found that many of the mine props were so loose that they could be moved by hand.
6/12/1930 Lincoln County, 9 miles southwest of Afton 5.8 VI Plaster walls, a brick building, and a swimming pool in the Grover area cracked. This event also stopped clocks on the west walls of buildings.

Wyoming Multi-Hazard Mitigation Plan 6.15 June 2011
Table 6.2—History Of Damaging Or Potentially Damaging Earthquakes In Wyoming.
Start Date Location Magnitude Intensity Info 7/28/1930 Sweetwater County, near Rock Springs IV The earthquake awakened many residents, and merchandise on store shelves
was disrupted. A portion of a coal mine near Reliance caved in during the disturbance. Whether the earthquake was due to the cave-in or to movement on
a fault is not known. 3/26/1932 Teton County, 4 miles northeast of Jackson VI The earthquake cracked plaster walls and foundations in several Jackson
homes and businesses. 8/25/1930 Central YNP V Threw dishes from shelves and obviously disturbed the water in Lewis Lake.
11/23/1934 Fremont County, 20 miles northwest of Lander
V In a 10-mile radius around Lander, there were reports that dishes were thrown from cupboards and pictures fell from walls. Buildings in two business blocks
were cracked. The brick chimney of the Fremont County Courthouse moved two inches away from the building.
1/14/1936 Teton County, 19 miles southwest of YNP south entrance
5.0 VI Cracked plaster and chimneys at the Lake Hotel and rocked beds at Moran. Not felt in Jackson.
2/25/1942 Goshen County, 3 miles north-northwest of Jay Em
V No significant damage was reported.
2/25/1942 Niobrara County, 18 miles south of Lusk V No significant damage was reported. 8/5/1942 YNP – West Thumb Area V Dishes and windows were rattled.
12/11/1942 Natrona County, 14 miles south of Midwest IV-V Felt in Casper, Salt Creek, and Glenrock. 10/11/1944 Hot Springs County, 3 miles south of
Thermopolis IV Rocks fell onto the highway in Wind River Canyon. At Hot Springs State Park,
the south rim of the largest hot spring partially caved.
4/21/1945 Yellowstone Lake Area V Shook bushes and trees and overturned vases and small objects. 2/26/1946 Hot Springs County, 3 miles south of
Thermopolis IV Rattled windows and dishes and clouded the water in Hot Springs State Park for
days. 4/14/1947 Converse County, LaPrelle Creek
southwest of Douglas V Felt near LaPrelle Creek. Windows were rattled, chairs were moved, and
buildings shook at a ranch. 2/23/1948 Teton County, 13 miles west of Jackson 5.0 VI Some residents in the area reported that their houses rocked and swayed in an
east-to-west direction. People also reported that dishes and windows rattled and pictures fell from walls. Some buildings in Jackson sustained cracked and
twisted logs. 1/23/1950 Hot Springs County, 22 miles northwest of
Thermopolis V Houses shook and dishes rattled in the Hamilton Dome area.
6/27/1950 North-central part of YNP VI Tourists ran from buildings, and knickknacks and groceries fell from shelves in West Yellowstone.
1/20/1954 Albany County, 12 miles north-northeast of Laramie
V Felt over 2000 square miles. In Laramie, a roaring noise was heard, and buildings shook and dishes fell from tables. At Fox Park doors and dishes were
rattled, and a post supporting the roof of one house was shifted.
1/31/1954 Hot Springs County, 3 miles south of V No significant damage was reported.

Wyoming Multi-Hazard Mitigation Plan 6.16 June 2011
Table 6.2—History Of Damaging Or Potentially Damaging Earthquakes In Wyoming.
Start Date Location Magnitude Intensity Info Thermopolis
7/4/1954 YNP - Mammoth Area V Windows, doors, and dishes rattled and small objects moved. 5/22/1955 Albany County, near Jelm and Woods
Landing V Dishes, windows, and cupboards were rattled in many cabins in the Woods
Landing area. 12/21/1956 YNP - near Lake Hotel V Small objects were shifted and tress and bushes were shaken. 1/5/1957 Converse, Esterbrook About 7 p.m. of the 5th a slight earth tremor was felt at Esterbrook and over an
area approximately 12 - 15 miles long by 3 miles wide. Rumbling was heard and light movement reported by more than a dozen people living in widely
separated sections of the area. Loud reports like thunder or roaring sounds were heard but no damage resulted.
4/28/1958 YNP - near Old Faithful V Windows, doors, and dishes rattled and small objects moved. 8/17/1959 Few miles northwest of West Yellowstone,
Montana 7.5 X Initiated a major landslide, which dammed the Madison River. The landslide
generated a great blast of air that blew people about like leaves. 28 people were killed by the event. New fault scarps were noted near Hebgen Lake and many
geysers were adversely affected. 12/25/1959 Albany County, near Fox Park and Jelm 4.3 V Felt in Fox Park, Jelm, and Laramie. In Fox Park, slight cracks formed in a
concrete block building under construction. 4/21/1960 Near Hebgen Lake, Montana V Caused dishes to fall at West Yellowstone, and water to slosh over the sides of
a fish bowl. 8/26/1962 North-central part of YNP V Stopped pendulum clocks at Canyon and frightened many people. 2/25/1963 Sublette County, 15 miles north-northeast of
Big Sandy 4.3 V Felt in Atlantic City, Lander, and Hudson. Windows, doors, and dishes were
rattled in Fort Washakie as a result of the earthquake.
3/8/1963 Northeastern YNP 3.8 VI Caused plaster to crack and fall at Canyon Village. Large cracks separated walls and ceilings in several houses.
12/17/1963 YNP - Mammoth V Pictures and mirrors shifted. 3/8/1963 Goshen County, 16 miles northeast of Jay
Em V No significant damage was reported.
3/28/1964 Niobrara County, 21 miles southeast of Lusk
V No significant damage was reported.
8/22/1964 Niobrara County, 17 miles northwest of Lusk
4.5 V Concert attendees thought a furnace had exploded.
9/10/1964 Sweetwater County, 30 miles west of Rawlins
4.1 One Rawlins resident reported that the earthquake caused a crack in the basement of his home in Happy Hollow.
10/21/1964 Hebgen Lake, Montana area 5.8 No significant damage was reported.
Wyoming Multi-Hazard Mitigation Plan 6.17 June 2011
Table 6.2—History Of Damaging Or Potentially Damaging Earthquakes In Wyoming.
Start Date Location Magnitude Intensity Info 9/21/1970 Lincoln County, near the Elbow
Campground in the Snake River Canyon 4.4 At Camp Davis, a resident reported a figurine knocked off a television set and a
“vibrating” staircase. Eleven miles south of Jackson, a resident reported rattling windows and a shaking bed. Near Bondurant, a resident reported that windows
rattled and her whole house shook. 12/8/1972 Hot Springs County, 8 miles west of
Thermopolis 4.1 V Caused two cracks in the ceiling of a new addition to a Thermopolis rest home,
and the floor in a local lumberyard sank a few inches.
4/22/1973 Fremont County, 12 miles north of Jeffrey City
4.8 V Rattled dishes and disturbed pictures on walls in Jeffrey City.
7/16/1974 Hebgen Lake, Montana area 4.4 V Felt as intensity V at Norris Geyser Basin. 8/30/1974 Central YNP 4.5 V Items fell of store shelves in West Yellowstone, and power lines behind the Old
Faithful Inn bounced up and down.
9/19/1974 Washakie County, 6 miles north-northwest of Ten Sleep
4.4 V Felt in Ten Sleep Canyon.
3/25/1975 Fremont County, 18 miles northwest of Jeffrey City
4.8 II A mobile home located 35 miles southeast of Riverton was moved an inch off its foundation by this earthquake.
6/30/1975 Central YNP 6.4 VII Landslides closed 12 miles of road between Norris Junction and Madison Junction for almost a day. 3 to 4 foot deep cracks, 15-20 feet long were found in
the Virginia Cascades area. 1/27/1976 Carbon County, 12 miles north of Rawlins 2.2 V Reports from the Park Drive area in Rawlins indicated that dishes were rattled,
pictures fell from walls, lamps were knocked off tables, and one wall in a residence was reportedly cracked.
9/2/1976 Johnson County, 33 miles northeast of Kaycee
4.8 IV-V No significant damage was reported.
12/9/1976 Northwestern YNP 5.1 V Caused small objects to fall at Canyon Village and caused turbidity in the Gibbon River.
12/19/1976 Northwestern YNP 4.9 VI Christmas decorations and household items were knocked to the floor and cracked windows at Mammoth.
3/3/1977 Carbon County, 18.5 miles west-northwest of Encampment
4.2 V Doors and dishes were rattled in southern Carbon County homes.
3/1/1982 West of Freedom in eastern Idaho 3.6 V Felt as intensity IV in Freedom, Etna, and Thayne. 2/6/1983 Central YNP 4.7 V Intensity V at Old Faithful. Overturned small objects. Water level in Gention Pool
dropped 30 inches. 2/8/1983 12 miles northwest of Alpine in Idaho 4.4 V Snow avalanches in some areas were initiated. Felt as intensity IV in Etna and
Teton Village. 12/20/1983 Teton County, 10 miles south of Jackson 4.5 IV In Jackson, there were reports of Christmas trees falling over and dishes
breaking. Felt from Jackson to Palisades Reservoir.
5/29/1984 Campbell County, 24 miles west-southwest of Gillette
5.0 V Felt in Gillette, Sheridan, Buffalo, Casper, Douglas, Thermopolis, and Sundance. Pictures were shaken from the walls of a ranch house 35 miles west

Wyoming Multi-Hazard Mitigation Plan 6.18 June 2011
Table 6.2—History Of Damaging Or Potentially Damaging Earthquakes In Wyoming.
Start Date Location Magnitude Intensity Info of Gillette.
9/7/1984 Johnson County, 33 miles east-southeast of Buffalo
5.1 V Felt throughout northeastern Wyoming.
10/18/1984 4 miles west-northwest of Toltec in northern Albany County
5.5 VI Felt in Wyoming, South Dakota, Nebraska, Colorado, and Utah. Cracks were found in the exterior brick walls of the Douglas City Hall and a public school in Medicine Bow. Chimneys were cracked at Casper, Douglas, Guernsey, Lusk,
and Rock River. 11/3/1984 Fremont County, 10 miles northwest of
Atlantic City 5.1 VI Felt in Lander, Dubois, Altantic City, and Casper. Residents in Lander and
Atlantic City reported cracked walls, foundations, and windows.
8/21/1985 Lincoln County, 10 miles east of Alpine 4.8 V Felt as intensity V in Alpine. The Teton County Sheriff’s Department reported that the earthquake caused a motorist to drive off the highway in the Snake
River Canyon. 8/30/1985 Lincoln County, 7 miles east of Alpine 4.3 V Felt as intensity V in Alpine. 9/6/1985 Lincoln County, 15 miles east-southeast of
Alpine 4.6 V Felt as intensity V in Alpine and as intensity IV in Wilson. An earthquake-
induced landslide temporarily closed a portion of U.S. Highway 89 in the Snake River Canyon.
11/13/1988 Lincoln County, near Smoot, south of Afton 4.0 V Felt as intensity V in Smoot and as intensity IV in Afton and Fairview. 7/20/1992 YNP - Near Lake Hotel 3.9 V Many guests were awakened and some packed up and left the area. 11/1/1992 Niobrara County, southeast of Lusk 3.0 V No significant damage was reported.
11/10/1992 Eastern Idaho 4.8 V Felt as intensity V at Alpine and Grover. 11/10/1992 Eastern Idaho 4.7 V Felt as intensity V in Grover. 12/28/1993 Teton County, 34 miles east of Jackson 4.7 V Most reports indicated that the earthquake felt like a heavy truck passing by. A
ranch near the epicenter reported swinging lights, but no damage.
2/2/1994 Draney Peak, ID area 4.0 V Felt as intensity V at Afton and Freedom. 2/3/1994 Draney Peak, ID 5.9 VII At the Auburn Fish Hatchery, located just into Idaho, near Auburn, Wyoming,
one wall separated from the roof of the facility. In addition, one home near Auburn had cracks in both the foundation and ceiling. The earthquake also
shook dishes off shelves and clocks off walls in Afton and surrounding communities. Felt in Rock Springs and Salt Lake City. Thousands of aftershocks
followed. 2/11/1994 Draney Peak area, ID 5.3 In Grover, a resident reported that his house had been damaged to the point
where a front door would not close. There was also a report from Grover that a set of concrete steps had pulled away from a house. In Afton, cracks appeared
in the walls of some homes. In Fairview, there were reports of lamps tipped over.
4/7/1994 Draney Peak area, ID 5.2 No significant damage was reported.

Wyoming Multi-Hazard Mitigation Plan 6.19 June 2011
Table 6.2—History Of Damaging Or Potentially Damaging Earthquakes In Wyoming.
Start Date Location Magnitude Intensity Info 2/3/1995 Sweetwater County, near Little America 5.3 V Collapse of a 3,000-foot wide by 7,000-foot long portion of a trona mine
operated by the Solvay Minerals, Inc. One miner lost his life as a result of the collapse. Minor damage was reported at a school administration building in
Green River and at a motel near Little America. 2/28/1995 Lincoln County, 17 miles south- southwest
of Afton 4.0 V Felt as intensity V in Afton and intensity IV in Smoot.
8/27/1995 Teton County, vicinity of Joy Park and Enos Lake
4.5 At Flagg Ranch, there were reports of buildings vibrating and dishes rattling. At Grant Village, the event was felt for 10-15 seconds, and a few items fell off the
shelves at the Hamilton Store. 5/16/1996 Eastern Idaho, 20 miles southwest of Afton 4.3 V Felt as intensity IV in Afton. 4/25/1997 Fremont County, 10 miles south of Lander 3.1 Lander city officials reported that the earthquake may have caused a crack in
the city’s water tank, releasing 600,000 gallons of water.
4/5/1999 Carbon County, 29 miles north-northwest of Baggs
4.3 Residents of Rawlins reported that pictures fell off walls, and a ranch house 30 miles north of Baggs, reported that cinder block walls in the basement of the
home cracked and separated. A motel and associated residence in Wamsutter also suffered cracks in the cinderblock walls in the basement.
1/7/2004 Teton County, east of Kelley 5.0 IV The non-damaging earthquake occurred east of Kelly, about 3 miles southeast of lower Slide Lake. The earthquake was felt for 6 seconds. The earthquake
was followed by magnitude 3.7, 4.1, and 4.0 events.

Wyoming Multi-Hazard Mitigation Plan 6.20 June 2011
Earthquake Potential The earthquake history above does not give a complete picture of the earthquake potential in Wyoming. As mentioned previously, the history is only 130 years, and cannot reflect all possible earthquakes or earthquake sources in Wyoming. The exposed active faults mentioned above have all been modeled to determine what effects they may have on the areas around them if they activate. A detailed analysis of the potential effects of the faults can be obtained at http://www.wrds.uwyo.edu/wrds/wsgs/hazards/quakes/seischar/seischar.html. One of the primary tools used in modeling the effects of earthquakes on regions or states are probabilistic acceleration maps generated by the U.S. Geological Survey (USGS). The USGS publishes probabilistic acceleration maps for 500-, 1000-, and 2500-year time frames. The maps show what accelerations may be met or exceeded in those time frames by expressing the probability that the accelerations will be met or exceeded in a shorter time frame. For example, a 10% probability that acceleration may be met or exceeded in 50 years is roughly equivalent to a 100% probability of exceedance in 500 years. The USGS recently generated new probabilistic acceleration maps for Wyoming. The maps are for 500-year (10% probability of exceedance in 50 years), 1000-year (5% probability of exceedance in 50 years), and 2500-year (2% probability of exceedance in 50 years) periods. Until recently, the 500-year map was often used for planning purposes for average structures, and was the basis of the most current Uniform Building Code. The new International Building Code, however, uses a 2500-year map as the basis for building design. The 2500-year map was updated in 2008 and is shown in Figure 6.3. The maps reflect current perceptions on seismicity in Wyoming. In many areas of Wyoming, ground accelerations shown on the USGS maps can be increased due to local soil conditions. For example, if fairly soft, saturated sediments are present at the surface, and seismic waves are passed through them, surface ground accelerations will usually be greater than would be experienced if only bedrock was present. In this case, the ground accelerations shown on the USGS maps would underestimate the local hazard, as they are based upon accelerations that would be expected if firm soil or rock were present at the surface. Intensity values can be found in Table 6.4. A comparison between the 2500-year probabilistic acceleration map and the above intensity chart indicates that the largest intensity earthquake expected in Wyoming could be Intensity IX. The Jackson area could have an Intensity VIII to IX earthquake, as could Star Valley, or parts of Uinta County. Parts of central Wyoming could have earthquakes with intensities as large as VII.

Wyoming Multi-Hazard Mitigation Plan 6.21 June 2011
http://earthquake.usgs.gov/earthquakes/states/wyoming/hazards.php Accessed 1/26/2011 Figure 6.3—2500-Year Probabilistic Acceleration Map of Wyoming.
Table 6.4—Modified Mercalli Intensity and Peak Ground Acceleration (PGA).
Modified Mercalli Intensity
Acceleration (%g) (PGA)
Perceived Shaking Potential Damage
I <0.17 Not felt None II 0.17 – 1.4 Weak None III 0.17 – 1.4 Weak None IV 1.4 – 3.9 Light None V 3.9 – 9.2 Moderate Very Light VI 9.2 – 18 Strong Light VII 18 – 34 Very Strong Moderate VIII 34 – 65 Severe Moderate to Heavy IX 65 – 124 Violent Heavy X >124 Extreme Very Heavy XI >124 Extreme Very Heavy XII >124 Extreme Very Heavy
Reference: Wald, et al 1999.

Wyoming Multi-Hazard Mitigation Plan 6.22 June 2011
Assessments of Potential Earthquake Damage Hazards U.S. (HAZUS) is nationally standardized, geographic information systems (GIS)-based, risk assessment and loss estimation computer program originally designed in 1997 to provide the user with an estimate of the type, extent, and cost of damages and losses that may occur during and following an earthquake. HAZUS was developed for the Federal Emergency Management Agency (FEMA) by the National Institute of Building Sciences (NIBS). There have been a number of versions of HAZUS generated by FEMA, with HAZUS Multi-Hazard (HAZUS-MH) being the most recent release. HAZUS-MH incorporates a flood and wind module with the previously existing earthquake module. HAZUS was originally designed to generate damage assessments and associated ground motions based largely upon analysis at the census-tract level. Census tracts average 4000 inhabitants, with the tract boundaries usually representing visible features. HAZUS-99 calculated a ground motion value for the centroid of a census tract and applied that value to the entire tract. The calculations are based on USGS National Seismic Hazard Maps. In many of the western states, census tracts are very large, and parts of the tracts may be subjected to ground shaking that is considerably different than the value at the centroid. In 2003 and 2004, FEMA Region VIII and their subcontractor on HAZUS, PBS&J from Atlanta, have worked closely with the State of Wyoming to develop a census-block-based analysis for HAZUS-MH in Wyoming. Census blocks are a subdivision of census tracts. Many blocks correspond to individual city blocks bounded by streets, but blocks—especially in rural areas—may include many square miles and may have some boundaries that are not streets. Ground motion values for Wyoming can now be calculated at the centroid of census blocks. The results of the HAZUS-MH analysis for each county are presented in Table 6.5. There are two methods of ranking counties to determine where earthquake impacts may be the greatest. Either the loss ratios (Table 6.6) or total damage (Table 6.7) figures can be used. The loss ratio is determined by dividing the sum of the structural and non-structural damage by the total building value for the county. The loss ratio is a better measure of impact for a county as it gives an indication of the percent of damage to buildings. The total damage figure by itself does not reflect the percentage of building damage. If a county has a number of valuable buildings, such a Laramie County, small damage to a number of valuable buildings may result in a higher total damage figure that may be found in a county with fewer, less expensive buildings with a higher percentage of damage. Local mitigation plans utilize information provided by the State Multi-Hazard Mitigation Plan, and reflect little-to-no additional information regarding estimated potential losses. Statewide, HAZUS-MH analyses have been generated using both a census-tract and a census block method of analysis. The statewide results of both methods of analysis for building damage (structural and non-structural) are presented below:
Statewide Building Damage - Census Block Analysis: $2,436,291,000
Statewide Building Damage - Census Tract Analysis: $2,054,470,000

Wyoming Multi-Hazard Mitigation Plan 6.23 June 2011
Table 6.5—HAZUS-MH Summaries for Wyoming Counties.
County Capital Stock Losses (Thousands of Dollars)
Loss Ratio (%)
Income Losses (Thousands of Dollars)
Total Loss (Thousands of Dollars)
Structural Non-structural Contents Inventory Relocation Capital-
related Wages Rental Loss
Albany 9,714 36,865 13,946 151 2.32 276 2,717 3,198 4,210 71,078
Big Horn 3,470 12,203 4,647 65 2.43 84 533 694 963 22,660
Campbell 5,116 20,093 9,419 282 1.37 144 1,484 2,013 1,592 40,144
Carbon 7,140 26,320 10,480 170 3.08 190 2,120 2,700 1,810 50,920
Converse 6,054 24,172 9,787 185 4.15 152 984 1,303 1,845 44,482
Crook 836 2,640 896 17 1.04 21 107 139 211 4,867
Fremont 14,890 61,030 24,640 460 3.75 380 2,920 3,940 3,190 111,450
Goshen 2,168 6,982 2,543 69 1.13 57 392 528 623 13,364
Hot Springs 3,038 10,871 4,176 52 4.20 82 799 1,149 969 21,136
Johnson 3,293 13,062 5,514 94 3.40 86 557 648 1,066 24,320
Laramie 13,605 47,839 17,577 233 1.25 406 3,926 4,402 4,976 92,963
Lincoln 65,670 225,594 64,429 2,538 31.08 1,211 8,579 10,359 15,347 391,727
Natrona 36,764 137,379 57,269 1,149 3.99 981 9,890 13,033 12,245 268,911
Niobrara 423 1,585 617 12 1.20 12 72 83 132 2,935
Park 11,430 42,694 15,289 429 2.98 285 5,173 6,217 4,487 86,004
Platte 1,875 6,894 2,697 36 1.60 51 326 418 554 12,850
Sheridan 7,830 29,154 12,057 233 2.09 213 1,898 2,402 2,636 56,423
Sublette 9,654 30,667 9,436 222 8.24 206 2,438 3,052 2,665 58,340
Sweetwater 12,782 50,213 20,753 542 2.84 313 2,180 2,514 3,719 93,017
Teton 92,477 359,169 110,323 2,402 24.72 1,821 37,784 43,975 34,030 681,981
Uinta 39,912 135,111 38,841 1,007 15.84 782 5,888 8,741 11,004 241,284
Washakie 4,115 13,761 5,656 134 3.54 99 904 1,019 1,236 26,925
Weston 897 3,016 1,085 21 0.96 26 147 266 302 5,760

Wyoming Multi-Hazard Mitigation Plan 6.24 Draft Plan 2011
Regional Impacts of Earthquakes Using the loss ratios in Table 6.6, Lincoln, Teton, Uinta, and Sublette counties would have the most significant impact from earthquakes. This is consistent with probabilistic acceleration maps, and projected damage potential from exposed active fault models. Total dollar loss in those counties is projected to be nearly $1.4 billion. The second most impacted areas would be Hot Springs, Converse, Natrona, Fremont, Washakie, Johnson, Carbon, Park, and Sweetwater counties. Total dollar loss in those counties is projected to be just over $657.4 million. The third most impacted areas would be Big Horn, Albany, Sheridan, Platte, and Campbell counties. Total dollar loss in those counties is projected to be about $203.2 million.
Table 6.7—County Impacts Rated by Dollar Loss.
County Total loss
(thousands of dollars)
Loss ratio
Teton 681,981 24.72 Lincoln 391,727 31.08
Natrona 268,911 3.99
Uinta 241,284 15.84 Fremont 111,450 3.75
Sweetwater 93,017 2.84
Laramie 92,963 1.25 Park 86,004 2.98
Albany 71,078 2.32
Sublette 58,340 8.24 Sheridan 56,423 2.09
Carbon 50,920 3.08
Converse 44,482 4.15 Campbell 40,144 1.37
Washakie 26,925 3.54
Johnson 24,320 3.4 Big Horn 22,660 2.43
Hot Springs 21,136 4.2
Goshen 13,364 1.13 Platte 12,850 1.6
Weston 5,760 0.96
Crook 4,867 1.04 Niobrara 2,935 1.2
Table 6.6—County Impacts Rated by Loss Ratio.
County Loss ratio
Total loss (thousands of dollars)
Lincoln 31.08 391,727
Teton 24.72 681,981
Uinta 15.84 241,284
Sublette 8.24 58,340
Hot Springs 4.20 21,136
Converse 4.15 44,482
Natrona 3.99 268,911
Fremont 3.75 111,450
Washakie 3.54 26,925
Johnson 3.40 24,320
Carbon 3.08 50,920
Park 2.98 86,004
Sweetwater 2.84 93,017
Big Horn 2.43 22,660
Albany 2.32 71,078
Sheridan 2.09 56,423
Platte 1.60 12,850
Campbell 1.37 40,144
Laramie 1.25 92,963
Niobrara 1.20 2,935
Goshen 1.13 13,364
Crook 1.04 4,867
Weston 0.96 5,760

Wyoming Multi-Hazard Mitigation Plan 6.25 Draft Plan 2011
The counties with the least impact would be Laramie, Niobrara, Goshen, Crook, and Weston counties. Total dollar loss in those counties is projected to be almost $119.9 million. This is consistent with probabilistic acceleration maps, and projected damage potential from exposed active fault models. Local Mitigation Plan Risk Assessments A review of the local plans reflects they have utilized the most accurate earthquake data available at the time their plan was written, provided through HAZUS in 2004. Most also utilize maps contained within the Wyoming State Multi-Hazard Mitigation Plan. In February, 2011 each county was offered information in draft form. The information provided utilized HAZUS estimates in scenario-based calculations. It is anticipated the HAZUS data will be finalized soon. It is assumed those counties impacted by potential earthquake hazards in Wyoming (most counties) will utilize, in their next local plan, this best available data. Below is a table outlining information mined from the local plans’ earthquake hazard information. The table outlines the local perspective on earthquake risk within the county, ranking it from high to low, based on three areas of concern in the local plan: population impacted, probability of occurrence within their borders, and property impacted. When compared to the percentage of population increase in the state it is noted those counties in zones where earthquakes are most prevalent, the western part of the state, are experiencing some of the most significant growth. This would indicate earthquake hazards do not appear to significantly modify growth patterns within Wyoming. It would also lead one to draw the conclusion that in the event of a significant earthquake, those counties experiencing greater growth within their boundaries will have greater need of critical infrastructure like hospitals, police and fire departments, which are likely to be operating at a decreased capacity. The draw on critical infrastructure from surrounding areas may also be taxed. However, when compared to the overall risk table, found in Chapter 3, which is based on population composition and density, the areas in the west tend to be populated by those better able to address the demands of an emergency because of the low density and greater resilience of the population (see p.6.28 and 6.29).

Wyoming Multi-Hazard Mitigation Plan 6.26 Draft Plan 2011
Proposed State Mitigation Projects The following mitigation projects have been proposed by state, federal, and local entities in the process of generating the Wyoming Multi-Hazard Mitigation Plan. Chapter 22 has all proposed mitigation projects.
• Conduct HAZUS analyses to determine effects building code adoption may have on reducing loss estimates.
• Conduct study on phasing in of earthquake provisions of code for state funded and/or inspected buildings.
• Development of enhanced soil layer for use in HAZUS. • Study on retrofit feasibility of government owned buildings, essential facilities,
culverts, and bridges. • Retrofit government owned buildings, essential facilities, culverts, and bridges. • Analysis of pipeline crossings with active faults. • Education on earthquakes and on seismic provisions of the building code. • Analysis of effects of earthquakes on public buildings and shelters. • Retrofit State Capitol and Herschler Building. • Provide all-hazards weather radios to all residences in Wyoming. • Identify and inspect shelters in hazard prone areas. • Research feasibility and costs of adding new frontage roads /detour routes to I-
80, I-90, and I-25 to prevent significant delay in traffic flow and resultant
Wyoming Multi-Hazard Mitigation Plan 6.27 Draft Plan 2011
economic loss and possible loss of life. • Provide hazards information to shelters, emergency facilities in public buildings,
campgrounds, and phone books. • Provide emergency phones at strategic locations with direct lines to emergency
dispatch services. • Develop reseeding plans for losses due to all hazard events. • GIS training for local jurisdictions with emphasis on hazards recognition and
analysis for application to mitigation planning. • Investigate opportunities for developing or improving warning systems as a
means to reduce loss of life, damage to property, and economic losses. • Education programs encompassing multi-hazard insurance for business, resident
and government application. • Education programs encompassing multi-hazard mitigation for business, resident
and government application. • Planning studies regarding transportation of essential and/or key personnel
during all hazard events • Continue outreach to counties on identifying cost effective and feasible
mitigation projects. • Promote Continuity of Operations and Continuity of Government, statewide. • Maintain and continue to expand hazards databases that were generated for the
State Hazard Mitigation Plan. Seek new sources of information. • Identify, document, and advertise all volunteer agency’s locations and contact
information. Reference Cited
Wald, D.J., Quitoriano, V., Heaton, T., Kanamori, H., 1999, Relationships between peak ground acceleration, peak ground velocity, and modified Mercalli intensity in California: Earthquake Spectra, v. 15, no. 3, p. 557-564.