chapter 6 facies and depositional environments from...
TRANSCRIPT

Chapter 6
Facies and depositional environments fromsurface level composite logs of
SP and resistivity
6.1 Introduction
Recognition of depositional environment is made through the physical,
chemical, biological and geomorphologic imprints left in the deposits (Serra,
1985). These imprints define fades. And they characterize the environment and a
typical sequence of fades both space and time (Walker, 1976). This sequence
can be described by fades model. Lithofacies and microfacies analyses of
limestone and siliciclastics were utilized to decipher the depositional environment
(Singh and Bhat, 2002). In subsurface study involving well logs the equivalent of
facies model will be the concept of electrofacies model. An electrofacies is the set
of log responses which characterizes a bed and permits it to be distinguished
from others (Serra, 1979). Any environment can be characterized by an
arrangement of electrofacies which will be grouped into electrosequences. The
electrofacies analysis can be used to interpret the nature of the sedimentary
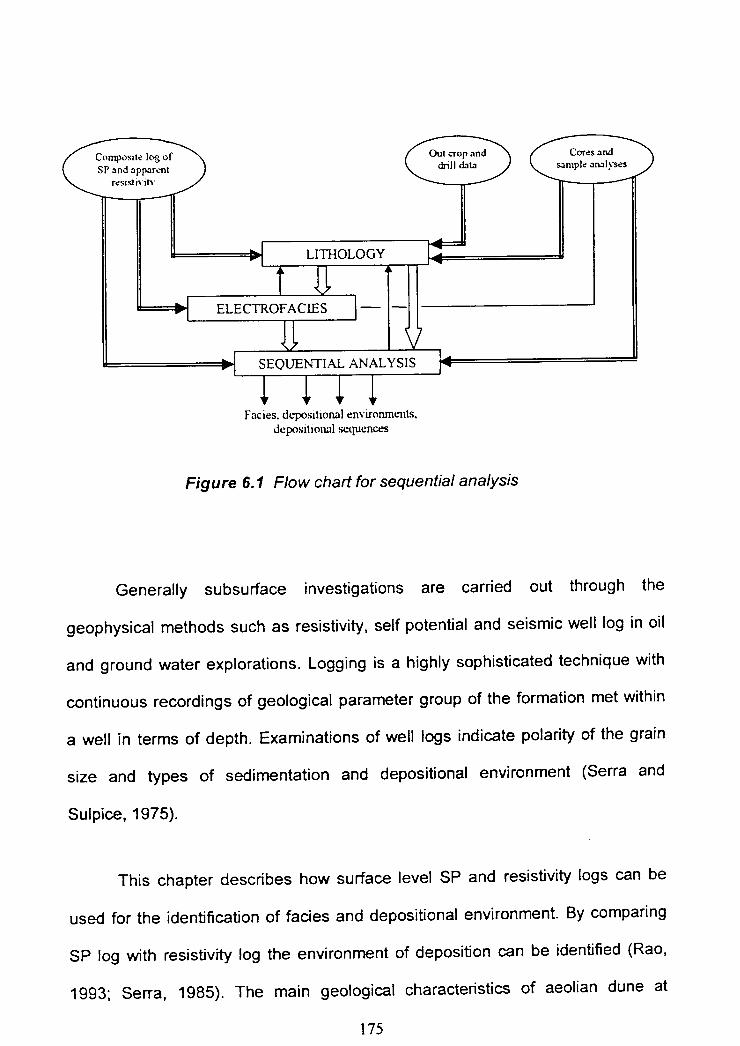
environments (Rao, 1993). In this work the fades interpretation, reconstruction of
depositional environment and depositional sequences and establishment of
lithology were made through the sequential sedimentological analysis of log
shape from the bottom to top of the basin. The essential steps of a proper
sequential analysis is given in the flow chart (Fig. 6.1)
174
Composite log of
QF^Cores and
SP and 3pp1rent s3.Ilea1s
resisi itv
LITHOLOGY
ELECTROFACIES I -
SEQUENTIAL ANALYSIS
Fades. depositional environments.depositional sequences
Figure 6.1 Flow chart for sequential analysis
Generally subsurface investigations are carried out through the
geophysical methods such as resistivity, self potential and seismic well log in oil
and ground water explorations. Logging is a highly sophisticated technique with
continuous recordings of geological parameter group of the formation met within
a well in terms of depth. Examinations of well logs indicate polarity of the grain
size and types of sedimentation and depositional environment (Serra and
Sulpice, 1975).
This chapter describes how surface level SP and resistivity logs can be
used for the identification of fades and depositional environment. By comparing
SP log with resistivity log the environment of deposition can be identified (Rao,
1993; Serra, 1985). The main geological characteristics of aeolian dune at
175

Manapad in Tuticorin district (Fig. 5.2) and fluvial environment at Neyveli in
Cudalore district (Fig. 3.11) on a single profile are described through geological
facies model concept.
6.1.1 Fades
The changes that take place owing to the differences in environmental
conditions in sedimentary formations are known as sedimentary facies.
Sedimentary geology is process oriented, focusing on how sediment was
deposited. Sedimentologists are geologists who attempt to interpret past
environments based on the observed characteristics, called facies, of
sedimentary rocks. Fades analysis uses physical, chemical, and biological
characteristics to reconstruct ancient environments. Facies analysis helps
sedimentologists to determine the features of the layers such as their geometry,
or layer shape; porosity, or how many pores the rocks in the layers have; and
permeability, or how permeable the layers are to fluids. This type of analysis is
important economically for understanding oil and gas reservoirs as well as
ground water supplies. The disappearance of permeability updip might be the
result of depositional environment producing different sedimentary facies
(Microsoft Encarta, 2002).
Originally a sedimentotogical study from logs involved examining the
shapes of various curves for indications of the types of sedimentation and
depositional environment. Classification of electrofacies by the shapes of
spontaneous potential response has been correlated with grain size distribution.
176

6.2 Electrofacies Analysis of the Litho Stratigraphy of NeyveliArea
The Neyveli deposit consists of a number of horizontal layers.
Knowledge of vertical variation is known from drilling data and the thicknesses of
each layer of sedimentary strata above the lignite seam are measured on the
walls of the opencast mine-I area (N) and Thoppulikuppam (Nm) in Neyveli mine
area. Vertical electrical sounding (yES) and self potential measurements were
carried out in the close proximity of the drilling sites of the study areas N and NTh
where the lithologs have been collected. The measured values of SP and
resistivity values are given in the Table 6.1. Then the graphical plots were made
using these values as in the previous chapters.
The manual identification of curve elements such as peak, and trough from
the curves of the apparent resistivity and the SP were used for electrofacies
analysis (Fig. 6.3a & 6.4a). The pattern recognition such as peak and peak (PP),
peak and trough (PT), trough and peak (TIP), trough and trough (TI) and trough
and flat (TF) of the composite log of SP and apparent resistivity helps to identify
the lithological sequences.
To interpret the lithology, a systematic approach is followed by knowing
the lithology from borehole data and by measuring the thickness of each
horizontal formation in the benches of the Neyveli mine area. These data are
utilized for depthwise correlation and for comparisons of gross lithology derived
from the composite logs of apparent resistivity and the SP values.
177

Table 6.1 Self potential and apparent resistivity values with respective electrodespacing 'a'
Neyveli N
a SP App. Res. a SP App.Res.
Jj (my) (ohm-m) (p) (mV) (ohm-m)
2 -20 19.47 118 128 61.51
6 -108 10.59 122 155 22.22
10 42 12.94 126 25 48.49
14 -31 16.18 132 114 48.38
16 153 17.18 138 66 43.60
20 237 21.35 1 144 211 46.42
26 -162 25.80 150 27 46.91
30 -83 24.12 156 62 45.82
34 31 29.47 162 113 1 44.20
38 171 27.44 168 70 43.41
42 67 29.54 174 188 43.67
46 1 -151 28.60 1 180 -121 38.43
50 128 30.77 186 -116 44.31
54 -141 20.01 192 -116 41.45
58 58 34.60 198 -155 39.00
62 -136 35.43 204 70 37.98
66 -161 37.30 206 24 53.61
70 -212 36.93 208 78 48.36
74 -182 38.57 212 23 41.23
78 138 40.17 216 24 40.92
82 110 33.99 220 -23 41.31
86 17 44.29 226 38 41.67
90 73 41.82 228 -44 47.29
94 107 42.50 232 44 37.15
98 -27 54.77 236 31 43.67
102 1 31 41.00 1 240 2 45.10
106 -17 42.60 244 1 7 48.82
110 -44 37.30
114 125 43.67
Neyveli Nm
a SP App.Res.
JJ (my) (ohm-m)
6 50 84.78
12 41 27.51
18 1
-14 47.82
24 -137 43.26
30 -74 40.88
36 -20 39.79
42 -9 26.38
48 -55 41.00
54 -14 38.32
60 56 39.19
66 39 40.62
72 -72 41.15
78 56 47.51
84 -32 49.06
90 83 49.74
92 1 111 50.27
94 74 50.77
96 -35 51.85
98 -78 53.54
100 1 -19 52.75
106 27 52.59
112 -27 56.27
118 193 55.58
120 250 54.26
122 164 58.23
124 1 165 59.96
126 93 62.51
138 95 58.93
150 14 64.06
178
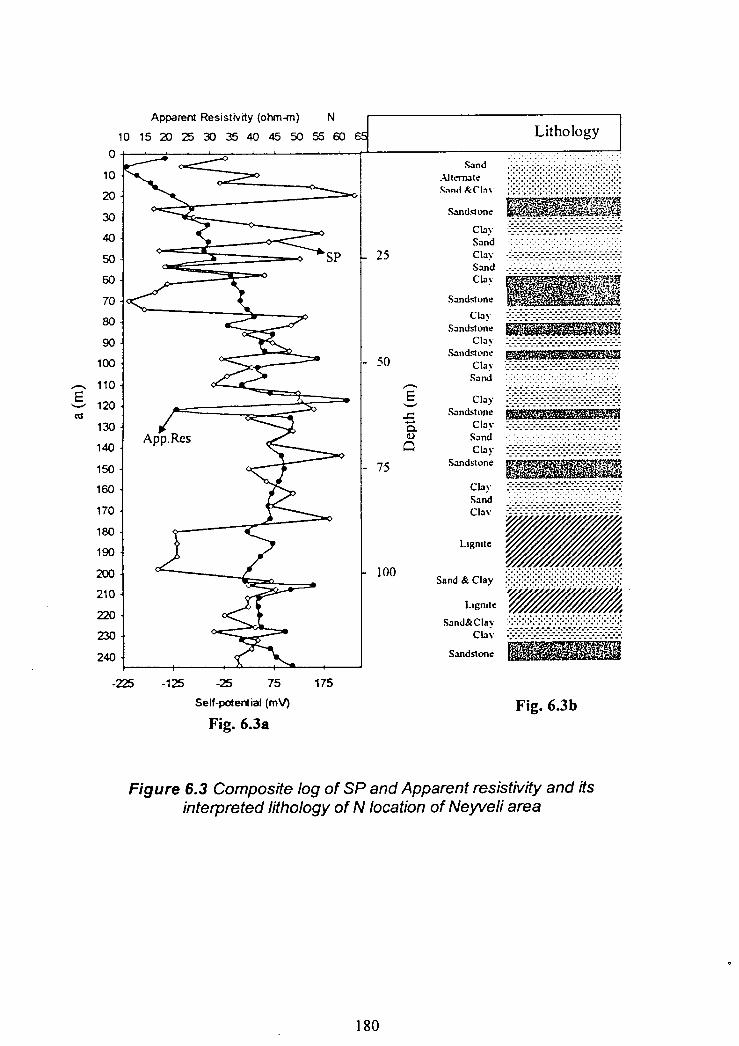
The pattern recognition of the curve elements of SP and apparent resistivity
forms groups such as PP, PT, TP, TF and IT. These groupings of the curve
elements identify various types of lithology like sands, sandstones, clay, ball clay,
lignite, intercalated sand and clay and laterite. The comparison and corroboration
of gross lithology obtained from the composite logs with cores and outcrops were
carried out and it is found that all corroborate the same interpretation, and then
the lithology is marked. The interpreted depthwise lithology of Neyveli area from
the logs of apparent resistivity and SP is marked by the side of the plot (Fig. 6.3b
and 6.4b). The depth and bed thickness of the corresponding lithounits are
displayed in Table 6.2.
- - jFigure 6.2 Author with research scholars at the Neyveli mines
179
Apparent Resistivity (ohm-m) N
1015202530354045505560
0
10
20
30
40
50
60
70
80
90
100
110E
120CO
170
180
190
200
210
220
230
240
L itho logy
Sand-\Jternates.,M &ri
andsi one
CbSandClaySandCv
Sandstone
ClaySandstone
ClaySandstone
ClaySand ::::::::.:.........
ClaySandstone
ClaySandClay
Sandstone
ciSandClay
Lignite
Sand&ClavClay
Sandstone
50
App. Res
J75
SP
25
Lignite
100Sand & Clay
-225 -125 -25 75
175
Self-potential (mV)
Fig. 6.3bFig. 6.3a
Figure 6.3 Composite log of SP and Apparent resistivity and itsinterpreted lithology of N location of Neyveli area
180

Lithology j
Lateritesoil
Clay
MAOS.andslone
Sandidune
CbV
SandOL
CLaV
SandM one
Clay
Lignite
Clay
Lignite
Clay
Sandstone
App. Res.
Apparent Resstrvity(ohm-m) Nm
35 45 55 65 75 85
SP
-50 50 150Self-Potential(mV)
250-
10
20
30
40<
50
60
,_. 70
' 30
90
100
110
120
130
140
150-150
25
50
475250
Fig. 6.4bFig. 6.4a
Figure 6.4 Composite log of SP and Apparent resistivity and itsinterpreted lithology of Nm location of Neyveli area
181

Table 6.2: Depthwise litho units and their layer thickness of N & Nm locations of
Neyveli area
N locationS.No Litho unit Depth Bed
(m) Thickness
1 Top Sand - 4.1
2 Intercalated 4.1 7.7
3 Sandstone 11.8 4.1
4 Clay 15.9 5.3
5 Sand 21.2 3.5
6 Clay 24.7 2.3
7 Sand 27.0 1.8
8 Limestone 28.8 2.4
9 Sandstone 31.2 7.6
10 Clay 38.8 3.5
11 Sandstone 42.3 3.0
12 Clay 45.3 2.9
13 Sandstone 48.2 2.4
14 Clay 50.6 2.9
15 Sand 53.5 3.0
16 Limestone 56.5 3.5
17 Clay 60.0 2.3
18 Sandstone 62.3 1.8
19 Limestone 64.1 2.9
20 Sand 67.0 3.0
21 Limestone 70.0 3.5
22 Sandstone 73.5 4.7
23 Clay 78.2 4.7
24 Sand 82.9 3.0
25 Clay 85.9 2.9
26 Lignite 88.8 11.8
27 Intercalated 100.6 4.1
28 Lignite 104.7 7.6
29 Sandstone 112.3 3.6
30 and 115.9 2.3
31 Sandstone 118.2 -
NTb location.
S.No Litho unit Depth Bed
(m) thickness
1 Top Soil - 4.0
2 Clay 4.0 4.5
3 Sandstone 8.5 7.5
4 Clay 16.0 6.5
5 Sandstone 22.5 6.0
6 Clay 28.5 6.0
7 Sand 34.0 5.5
8 Ball Clay 37.5 3.5
9 Sandstone 41.0 3.0
10 Clay 44.0 3.5 -
11 Lignite 47.5 11.0
12 Clay 58.5 2.2
13 Sand 60.7 1.8
14 Lignite 62.5 4.3
15 Clay 66.8 4.7
16 Sandstone 1 71.5 -
182

6.3 SP Log Shapes Analysis of Neyveli Area
Formation: A geometrical approach
The SP log shapes have been used to recognize the sedimentary fades
(Coleman and Prior, 1982). Based on geometrical consideration SP log shapes
are classified into bell, cylinder and funnel shapes (Fig. 6.5).
Smooth Serrated
•
MV
- rnjBell
Cylinder(Block)
Funnel
Figure 6.5 Log shape classification to analyze SP log shapes
The variation of log shape depends upon the grain size and amount of
clay content. Bell shaped SP log indicates increase of clay content or decrease of
grain size upward. Funnel shape SP log shows the reverse of the bell shape
indication. Third option of cylinder shape exhibits a sand body with constancy of
183
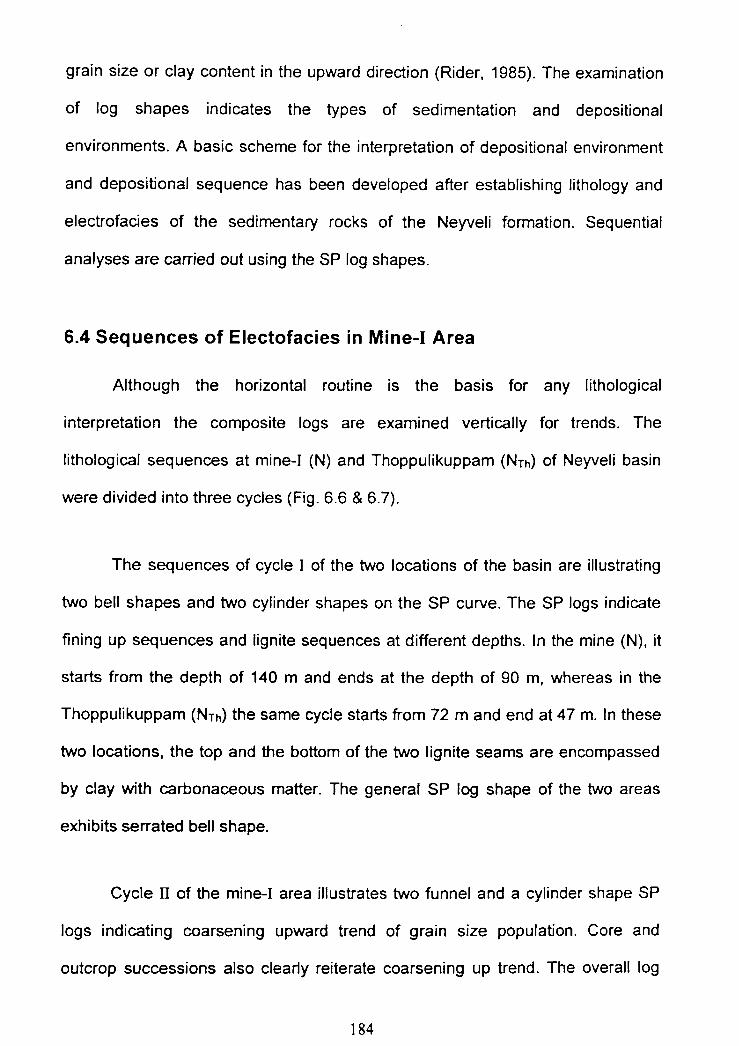
grain size or clay content in the upward direction (Rider, 1985). The examination
of log shapes indicates the types of sedimentation and depositional
environments. A basic scheme for the interpretation of depositional environment
and depositional sequence has been developed after establishing lithology and
electrofacies of the sedimentary rocks of the Neyveli formation. Sequential
analyses are carried out using the SP log shapes.
6.4 Sequences of Electofacies in Mine-1 Area
Although the horizontal routine is the basis for any lithological
interpretation the composite logs are examined vertically for trends. The
lithological sequences at mine-1 (N) and Thoppulikuppam (N Ih) of Neyveli basin
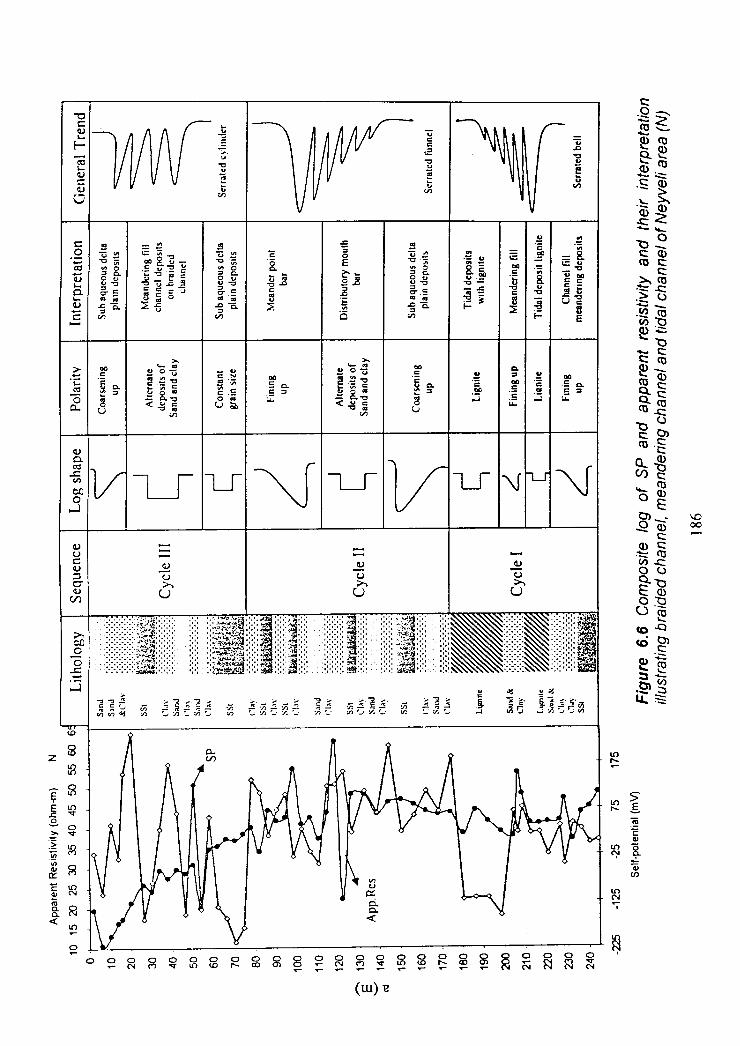
were divided into three cycles (Fig. 6.6 & 6.7).
The sequences of cycle I of the two locations of the basin are illustrating
two bell shapes and two cylinder shapes on the SP curve. The SP logs indicate
fining up sequences and lignite sequences at different depths. In the mine (N), it
starts from the depth of 140 m and ends at the depth of 90 m, whereas in the
Thoppulikuppam (NTh) the same cycle starts from 72 m and end at 47 m. In these
two locations, the top and the bottom of the two lignite seams are encompassed
by clay with carbonaceous matter. The general SP log shape of the two areas
exhibits serrated bell shape.
Cycle H of the mine-I area illustrates two funnel and a cylinder shape SP
logs indicating coarsening upward trend of grain size population. Core and
outcrop successions also clearly reiterate coarsening up trend. The overall log
184
trend also forms a serrated funnel shaped SP curve from 89 m to 37.5 m in
upward direction. Similar trends of the SP curve indicating coarsening up for
Thoppulikuppam area at the depth of 7 m to 45 m.
In the third cycle, two cylinders and one funnel shape SP curves indicate
intercalations of sand and clay and coarsening upward trends for the grain size
population in mine-I area. But in the Thoppulikuppam fining up trends for
sediment of 7 m thick is being recorded.
While comparing the thickness of each cycle in the two locations, the
thicknesses of cycle I of Neyveli mine area is greater than the cycle I of the
Thoppulikuppam area by 16 m, the thickness of cycle II of Neyveli mine area
greater by 17 m than the cycle II of the Thoppulikuppam area and the cycle III of
Neyveli mine area is greater thickness than the thickness of cycle III of
Thoppulikuppam area by 29 m. It is found that the cycle III, i.e. the top most
sequence, exhibits the highest difference in thickness between the two locations
of the Neyveli basin. In the Thoppulikuppam area the reduction of the bed
thickness in cycle III is due to the missing of the uppermost sequence of beds.
The reduction of the bed thickness in the other two cycles I and II of
Thoppulikuppam area are due to the diminution of beds because the deposition
in Thoppulikuppam area might have been at the periphery of the basin whereas
the Neveli mine-I area was at the centre of the basin.
185
lflJflV/fl-
oco
. .u•"Q
) O
CLI_. •
I._.
9
o -CL U
-L_F -L-F -\f -L^
V —c_) —V - V
C-) 0
C->U U
ITc '. . a- UI- -I-
2 2 0000 •
00
NJ -\f
V0
U
Co '-
'-a)
cz
a).-
CQ)
^ ().Co
crj
caCL
coO
.-...a)-LQ)
QC!
Co
CL
"-Cu
110
QL
-215 —
OC.
._'
VL.
VV
0- Eou - 22rE 2
U,
0
-u 00
j I co
CL
V0.cc-c
0
X. ^\Ml
IlCL II I7 Il (I) It It 2 U
LOEt() I_c IoO 21
IIC
LO II01
cn
-c I.; 1I?01 4)
C\I It)
aoCN
C C 0 0 0 0 0 CD 0 0 0 0C
(1u) L,

(w)
o 0 00 U,
£
E0
>00
0a0.
0
C',
co
criLzt
CO
cu
CL
L(#).-. 0
QQ)
C/)
o-,
cuty) 00
cri
-
C,)0
OC')
toWq3
C/)
N
>E0
r. C
0
0U,
6.5 Depositional Environment
The thicknesses of each facies or sequence of facies and grain size
evolution are related to depositional environments (Selley, 1978; Miall, 1984).
The geometry of sedimentary bodies is an important parameter for facies and
environment recognition (Curry and Curry, 1972; Sabins, 1982). There is a close
relationship between SP log and grain size. This relationship leads to direct
correlation between facies and log shapes (Krueger, 1968; Galloway, 1968;
Fisher, 1969; Coleman and Prior, 1982; Galloway and Hobday, 1983). Shapes of
the SP log can also be interpreted as grain size trends. It is already noted that the
bell shaped and funnel shaped logs indicate channel point of fluvial and delta
border progradation respectively. The same log shapes also indicate the
transgressive marine shelf and prograding marine shelf. To differentiate between
the various environments which may give similar log shapes, a theoretical
scheme has been proposed (Selley, 1976). As per the scheme the presence of
glauconite along with bell shape or funnel shape log indicates the marine
environment and the presence of carbonaceous matter indicates nonmarine
environment.
In the present study the encounter of lignite and Marcasite in the lower
part of the basin indicates the depositional environment was nonmarine. In the
Neyveli formation the clay materials are dispersed throughout the sandy mass so
that fine grained sand had been entrapped a greater amount of clay than medium
grained sand. This explanation for the differences in relationship between clay
content and grain size is probably found in hydraulic regimes in Neyveli region.
This relationship has also been attested by the results of the textural studies of
188
the Neyveli sediment. The mean grain size of the sediment population varies
from 1.5(p to 3.4p. Of which the 64% of the sediment populations are of coarse
and medium grained and 29% are of medium and fine grained and remaining 7%
are of silt and clay. Even though the majority of sediment population belongs to
coarse and medium group the presence of little percentage of clay has reduced
the sorting efficiency. In the grain size analyses it is found that 58% of sediment
population are poorly sorted and 28% are moderately sorted and only 8% of the
sediment population are moderately well sorted (Sebastian Chandy et al, 1989).
This result exemplified that the correspondence between clay and grain size in
the fluviate environment shows that the winnowing action is low and so sorting is
poor.
The depositional environment of Neyveli sedimentary basin is reflected
primarily in the lithological sequences and distribution of lithofacies such as
sandstones, clays and biofacies like lignite found within the piles of sedimentary
strata.
The evidences obtained from the three depositional megacycles clearly
corresponded with the SP logs. They indicate the depositional environments of
the Neyveli basin. The SP log of lower most (cycle I) sequence is a serrated bell
indicating meander point bar into tidal channel connecting swampy lake to bay
and the SP log shape formed (block) cylinder shape towards the lignite seam.
This area was a transitional environment characterized by sediments that have
been transported to the end of a channel by a current of continental water of
ephemeral stream from the streams adjoining hilly terrain and deposited mostly
sub aqueous but partially sub aerially at the margin of standing swampy lake. The
189
bars are developed in front of swamps and fluvial channel complex and so these
deposits are quite distinctive with lignite deposits. The sediments found in this
cycle exhibit broad spectrum of grain size from clay to sand particles. These
sediments are terngenous sediments. Lignite formation in lower most cycle
indicates the depositional environment was nonmarine swamps in which large
scale accumulation of organic debris were deposited. Remnants of vegetable
matter like branches and leaves of trees found in the lignite seams in the lower
part of the Neyveli basin suggest that the swamp was saturated environment with
stagnant water and supporting a stand of trees. All saturated environments that
continued to accumulate peat, then bogs to lignite formation.
During the decay of the plant substance hydrogen sulfide generated was
precipitated as iron sulfide. Bacteria also induced the depositional process to
form a deposit of iron sulfide and reduced iron sulfate to sulfide by lignite was
possible as wall. Sulfide (Marcasite) is the most important form of sulfur in lignite
deposits in Neyveli basin.
In a rare exception the SP deflections towards left even when the
formation is not permeable are due to mineralization like Marcasite. The same
excessive left or negative side SP deflections for lignite bed which were formed
into extremely reduced condition are recorded in the cycle-1 of the Neyveli
formation. This excessive SP deflection may be due to electrical inequilibrium in
the subsurface condition (Hallenburg, 1978).
The overall log signature of sedimentary sequences of cycle II of Neyveli
basin shows the serrated funnel shape which includes funnel, block and bell
us 11

shapes. These sequences demonstrate the depositional environments of
distributaries mouth bar, distributing channel fill and meander point bar.
The distributary's mouth bars of the cycle II exhibits upward coarsening
sequences (89 m - 74 m) of 15 m thick consist of sandstone, clay and sand.
Distributary's channel fill comprises of clay, fine sand, sandstone and ball clay of
(74 m - 56 m) 18 m thick is present above the mouth bar deposits. The top most
deposits of cycle II, deposited in meander point bar consists of alternate layers of
sand stone and clay beds of (56 m - 40 m) 16 m and followed by 7 m thick
massive aquifer sandstone body. In this cycle the upward coarsening sequence
and cross bedding sedimentary structure evince the depositional environment as
distributaries mouth bar.
Sequences of cycle III consisting of serrated cylinder were deposited in
distributaries channel fill in which alternate layers of clay and sandstone capped
with latente at the top of the cycle are found. But laterite capping is missed in the
cycle Ill of Thoppulikkuppam area.
One of the main factors in environmental analysis through electrical study
is to find out the chemical and physical nature of medium from which the
sediments were deposited. In our study it has been seen that in all sequences,
alternate layers of clay, sand and sand stone beds are encountered. The sand
stone beds are interbedded with massive in character. The internal structure of
the sand bodies exhibits cross bedding, such as diagonal cross bedding which
indicates a shallow depositional environment and the transport of the
sedimentation was caused by swift current deposits of ephemeral streams.
191
Sequence of clays in the study area shows a cyclic stratification nature.
Thin and even lamination of the clay zones suggests that the deposition
environment was of quiet water. The alternate layers of sand bodies and clay
zones in each cycle reflect the seasonal and long term fluctuation in the weather
pattern dunng the deposition of Neyveli sedimentation. Both clay and sandstone
deposits were formed in an aerobic environment.
The chemical nature of the depositional setting of Neyveli basin is
retrieved from the clastic and nonclastic deposits. The clay sequences are spread
out throughout. The entire formation is mainly composed of kaolinite. Rangama
and Sahama (1952) categorically stated that the formation of kaolinite takes
place in river and bog water. The type of clay indicates an acid environment for
its formation (pH <7). The depositional environment of Neyveli basin is indeed a
complex one and is characterized by various sets of physical and chemical
parameters having good correspondence with log shapes. The physical nature of
depositional bodies is identified through the log signatures i.e. the SP log is
reliable indicator of day and sand body. In conclusion, the log shapes indicate
depositional environment.
It has been already stated that a strong deflection towards left side, when
the formation is not permeable, is definitely due to the chemical condition of the
formation. We have recorded strong negative deflections for lignite seam with
Marcasite mineral in an anaerobic environment.
192

In the environmental analysis, the physical nature of the depositional
media is identified through the combination of the logs. The SP log shape clearly
depicts the depositional environment and their depthwise grain size trends as
coarsening up or fining up. The thickness of each sedimentary strata and the
corresponding SP log shape clearly identifies the depositional environment as
meander point bar or distributary's mouth bar etc.
The heaping up of the organic matter has markedly reduced the
depositional environment of the swampy region of Neyveli as reducing facies.
The environment was reducing because carbon compound accumulates the
presence of the reducing agents such as plant debris and other by-products like
Marcasite established redox potential of the environment. The ability of a natural
environment to oxidize sulfur, or being about any other oxidation or deduction
process, is measured by a quantity called its redox potential (Eh). However, the
direct measurements of redox potentials of the order of -0.1 V to -0.5 V for the
modern depositional environment in which organic matter is accumulating have
been recorded (Krauskopf, 1989). Another possible measure of redox potential is
the nature of inorganic mineral such as Marcasite precipitated from circulating
water with lignite deposits. It can form only at Eh values below -0.3V in acidic
environment pH < 7 (Krumbein and Carrel, 1952). Electrofacies analyses also
indicate an abnormal left side indication with fiat apparent resistivity curve.
Though the depositional basin was very close to the Bay of Bengal, the presence
of lignite seam and Marcasite in the lower part of the basin clearly shows that the
depositional environment was high acidic and reducing and not contaminated
with sea water.
193
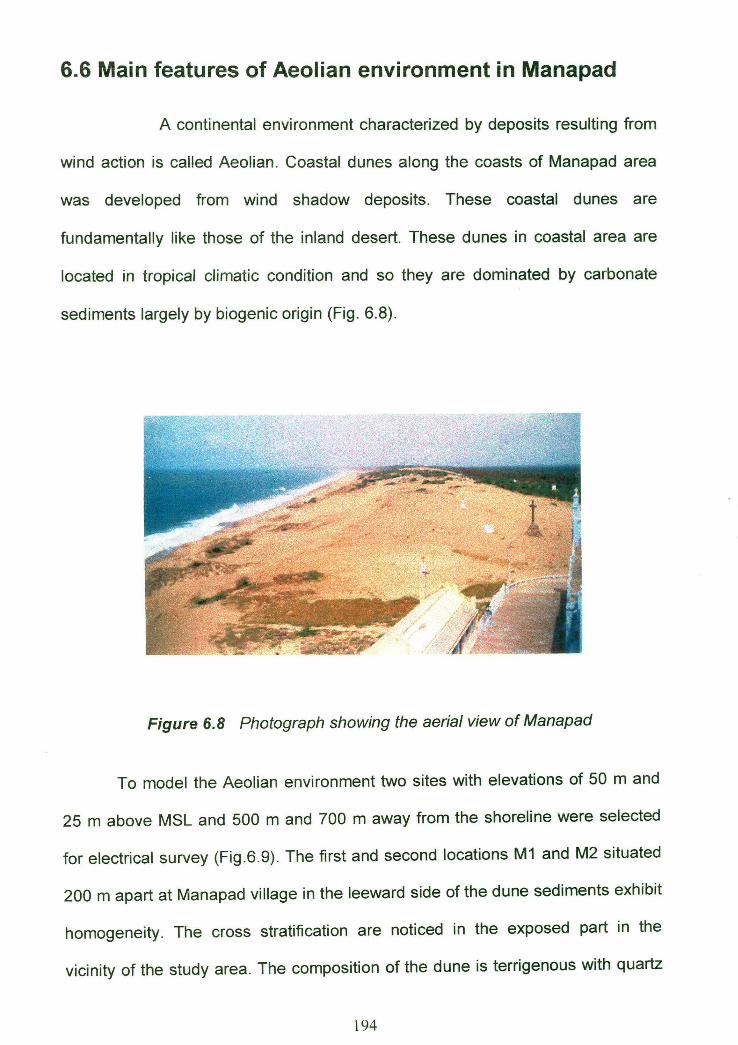
6.6 Main features of Aeolian environment in Manapad
A continental environment characterized by deposits resulting from
wind action is called Aeolian. Coastal dunes along the coasts of Manapad area
was developed from wind shadow deposits. These coastal dunes are
fundamentally like those of the inland desert. These dunes in coastal area are
located in tropical climatic condition and so they are dominated by carbonate
sediments largely by biogenic origin (Fig. 6.8).
-
Figure 6.8 Photograph showing the aerial view of Manapad
To model the Aeolian environment two sites with elevations of 50 m and
25 m above MSL and 500 m and 700 m away from the shoreline were selected
for electrical survey (Fig.6.9). The first and second locations Ml and M2 situated
200 m apart at Manapad village in the leeward side of the dune sediments exhibit
homogeneity. The cross stratification are noticed in the exposed part in the
vicinity of the study area. The composition of the dune is terrigenous with quartz
194
as dominating mineral with silt fragments. At the sites of Ml and M2 the lateral
spreading of 220 m, and 210 m for the SP and the resistivity measurements were
carried out in Wenner configuration (Table 6.3). As explained in the earlier
chapters the graphical plots were made (Fig. 6.1 Oa & Fig. 6.11 a).
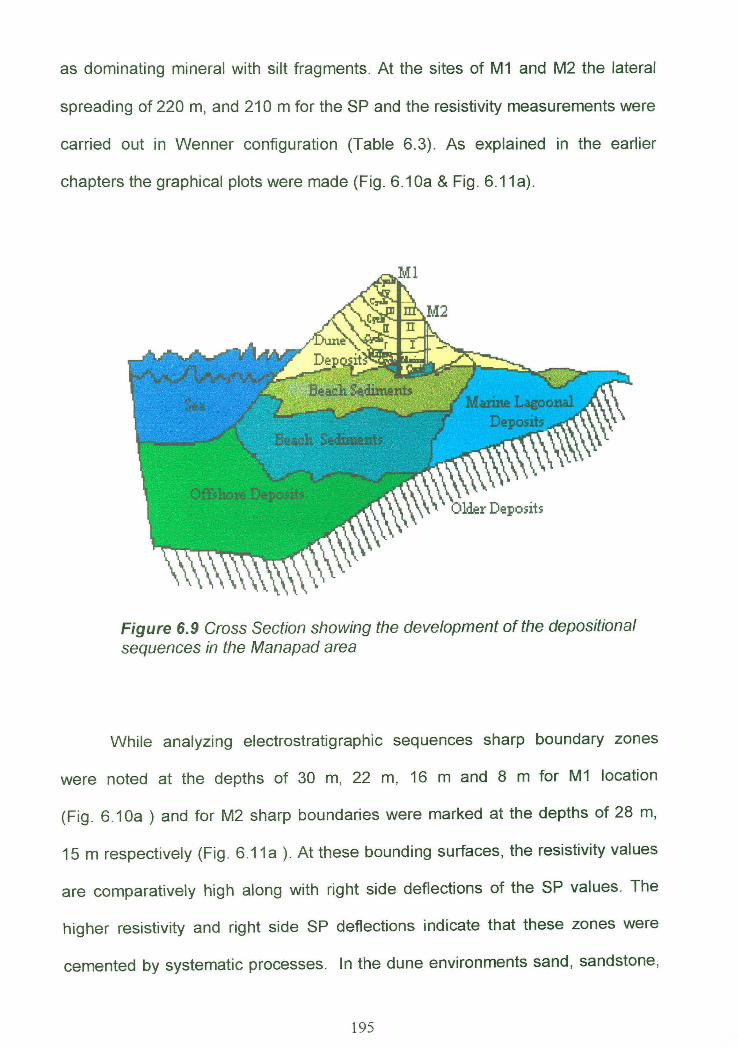
Figure 6.9 Cross Section showing the development of the depositionalsequences in the Mana pad area
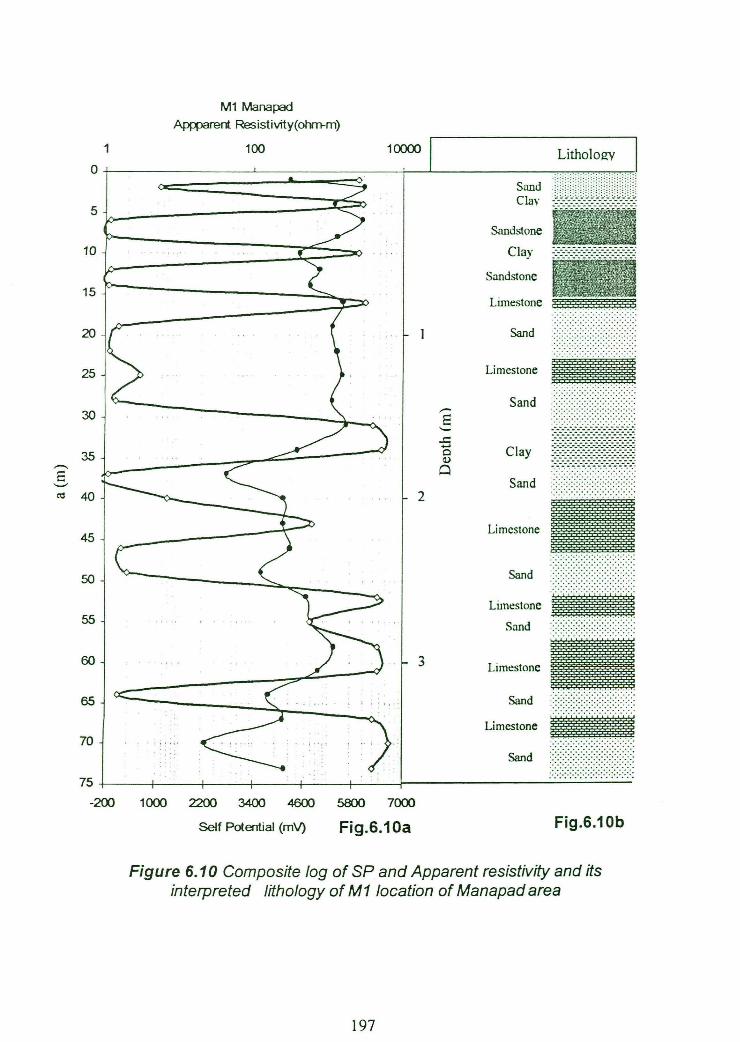
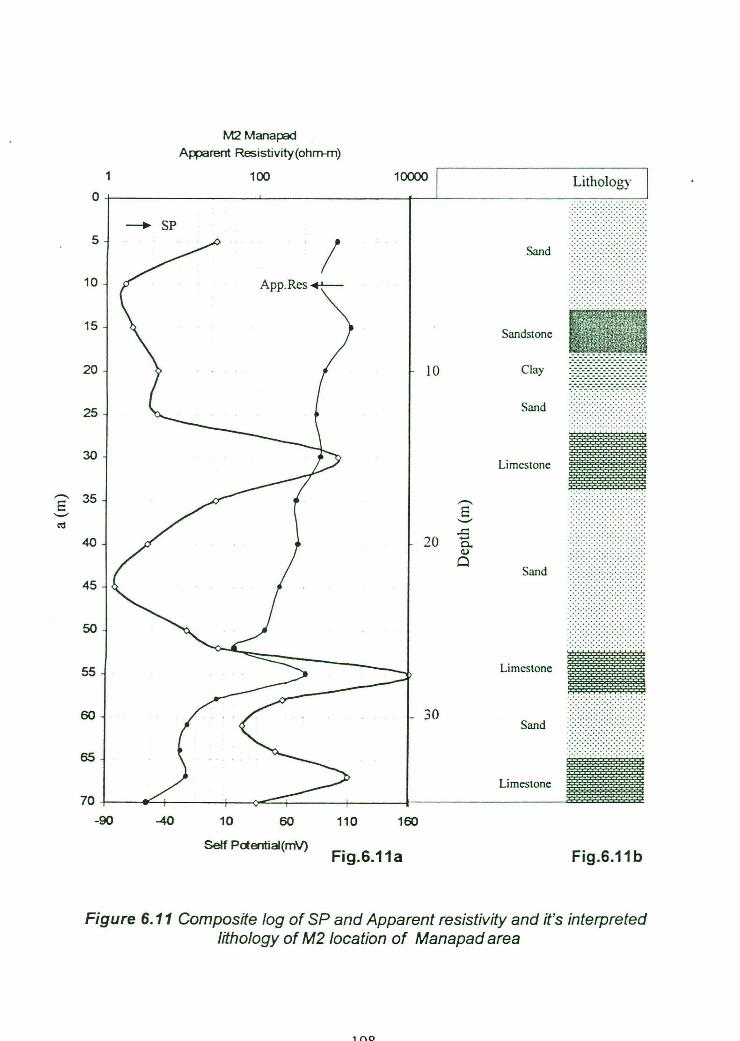
While analyzing electrostratigraphic sequences sharp boundary zones
were noted at the depths of 30 m, 22 m, 16 m and 8 m for Ml location
(Fig. 6.10a ) and for M2 sharp boundaries were marked at the depths of 28 m,
15 m respectively (Fig. 6.11a ). At these bounding surfaces, the resistivity values
are comparatively high along with right side deflections of the SP values. The
higher resistivity and right side SP deflections indicate that these zones were
cemented by systematic processes. In the dune environments sand, sandstone,
195
limestone and clay beds were identified through the analysis of the composite
logs of SP and resistivity (Fig. 6.10b & Fig. 6.11b). The encounted depthwise
lithological sequences and their layer thickness at Ml and M2 locations of
Manapad area are given in the Table 6.4.
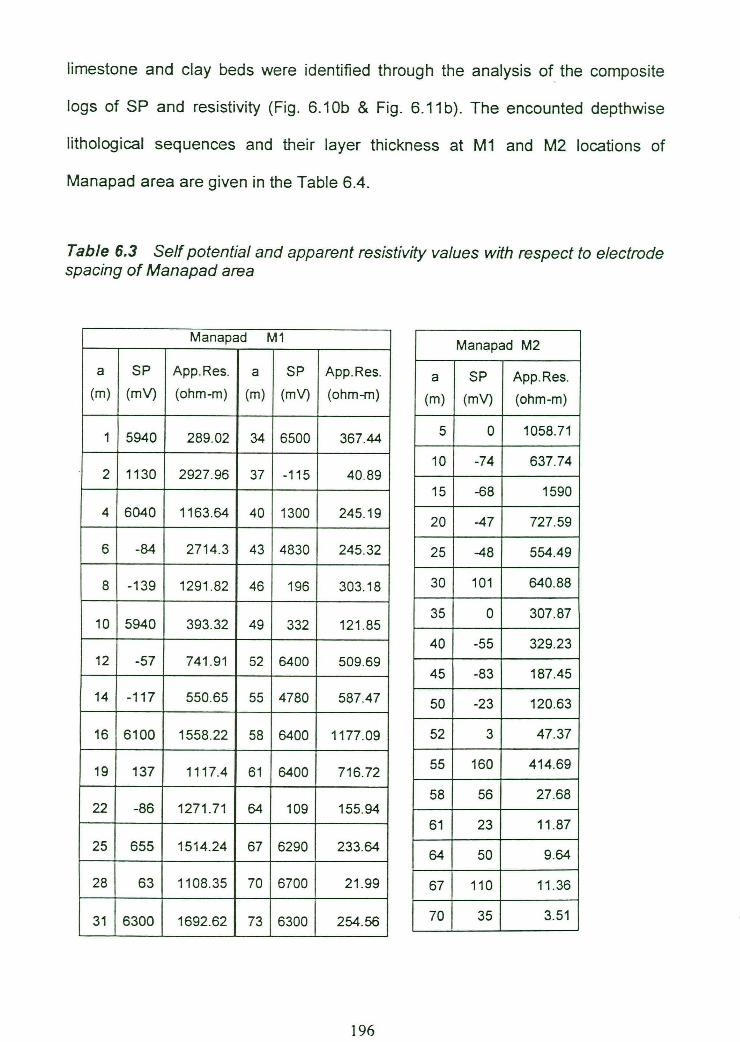
Table 6.3 Self potential and apparent resistivity values with respect to electrodespacing of Mana pad area
Manapad Ml
a SP App. Res. a SP App. Res.
(m) (my) (ohm-m) (m) (mV) (ohm-m)
1 5940 289.02 34 6500 367.44
2 1130 2927.96 37 -115 40.89
4 6040 1163.64 40 1300 245.19
6 -84 2714.3 43 4830 245.32
8 -139 1291.82 46 196 303.18
10 5940 393.32 49 332 121.85
12 -57 741.91 52 6400 509.69
14 -117 550.65 55 4780 587.47
16 6100 1558.22 58 6400 1177.09
19 137 1117.4 61 6400 716.72
22 -86 1271.71 64 109 155.94
25 655 1514.24 67 6290 233.64
28 63 1108.35 70 6700 21.99
31 6300 1692.62 73 6300 254.56
Manapad M2
a SP App. Res.
(m) (mV) (ohm-m)
5 0 1058.71
10 -74 637.74
15 -68 1590
20 -47 727.59
25 -48 55449
30 101 640.88
35 0 307.87
40 -55 329.23
45 -83 187.45
50 -23 120.63
52 3 47.37
55 160 414.69
58 56 27.68
61 23 11.87
64 50 9.64
67 110 11.36
70 35 3.51
196
Ml ManapadApppare1 Resistivity(ohm-m)
1001
04Lithology
SandC1a
Sandstone
Clay:
Sandstone
Limestone z1t_
Sand
Limestone
Sand
Clay
Sand
:
Limestone :;____
Sand
Limestone
Sand
Limestone
Sand
Limestone
Sand
75 -p P
i
i j-
-200 1000 2200 3400 4600 5800 7000
Self Potential (mV) Fig.6.10a Fig.6.1Ob
Figure 6.10 Composite log of SP and Apparent resistivity and itsinterpreted lithology of Ml location of Manapad area
5
10
15
20
25
E
30
35
ce40
45
50
55
60
65
70
2
197
E
c)
cia]
-40 10 60 110 160
Self PentiaI(mV)Fig.6.1 Ia
1
0
5
10
15
20
25
30
cc
45
50
55
60
65
70
-90
Lithology
Sand
1
Sandstone
Clay
Sand :.....;.....::....:.
Limestone
Sand
Limestone
Sand
Limestone
Fig.6.l lb
M2 ManadApparent Ristivity(ohm-m)
100
1Eio
-* SP
/App.Res c
Figure 6.11 Composite log of SP and Apparent resistivity and it's interpretedlithology of M2 location of Mana pad area
1 ('O
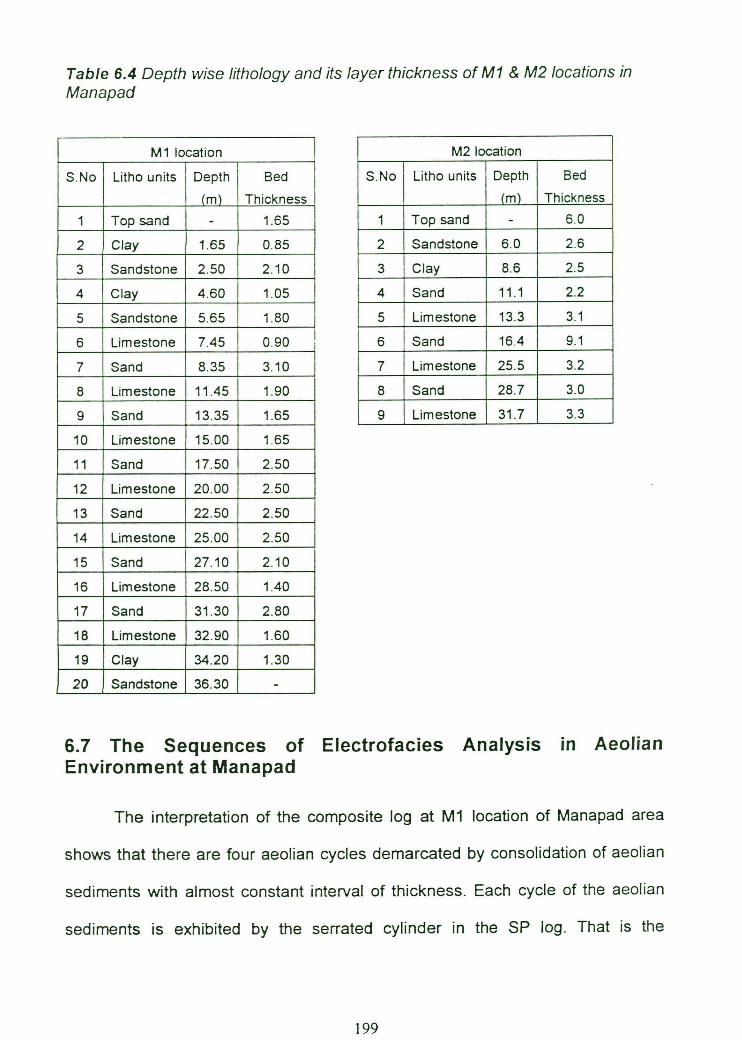
Table 6.4 Depth wise lithology and its layer thickness of Ml & M2 locations inMana pad
Ml location
S.No Litho units Depth Bed
(m) Thickness
1 Top sand - 1.65
2 Clay 1.65 0.85
3 Sandstone 2.50 2.10
4 Clay 4.60 1.05
5 Sandstone 5.65 1.80
6 Limestone 7.45 0.90
7 Sand 8.35 3.10
8 Limestone 11.45 1.90
9 Sand 13.35 1.65
10 Limestone 15.00 1.65
11 Sand 17.50 2.50
12 Limestone 20.00 2.50
13 Sand 22.50 2.50
14 Limestone 25.00 2.50
15 Sand 27.10 2.10
16 Limestone 28.50 1.40
17 Sand 31.30 2.80
18 Limestone 32.90 1.60
19 Clay 34.20 1.30
20 Sandstone 36.30 -
M2 location
S.No Litho units Depth Bed
(m) Thickness
1 Top sand - 6.0
2 Sandstone 6.0 2.6
3 Clay 8.6 2.5
4 Sand 11.1 2.2
5 Limestone 13.3 3.1
6 Sand 16.4 9.1
7 Limestone 25.5 3.2
8 Sand 28.7 3.0
9 Limestone 1 31.7 3.3
6.7 The Sequences of Electrofacies Analysis in AeolianEnvironment at Manapad
The interpretation of the composite log at Ml location of Manapad area
shows that there are four aeolian cycles demarcated by consolidation of aeolian
sediments with almost constant interval of thickness. Each cycle of the aeolian
sediments is exhibited by the serrated cylinder in the SP log. That is the
199
constancy of the grain size variation in the depositional environment was
observed.
There are two aeolian cycles which were identified with cylindrical log
shape from the composite log of M2 location of Manapad area. These cylindrical
cycles of the SF log were less serrated with more thickness.
In both locations the composite log of the SP and the apparent resistivity
of the bottom cycle exhibit clay deposits. As the location is being in close
proximity to the seashore the presence of clay deposits indicates the bottom
formations that were originated from marine deposits.
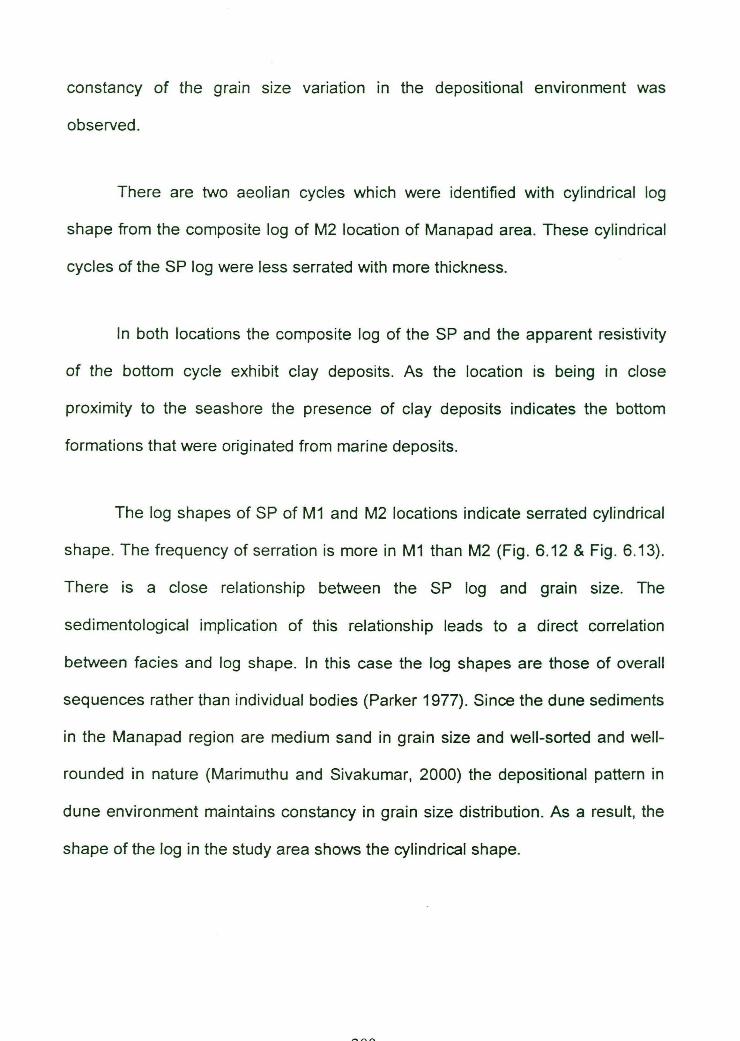
The log shapes of SF of Ml and M2 locations indicate serrated cylindrical
shape. The frequency of serration is more in Ml than M2 (Fig. 6.12 & Fig. 6.13).
There is a close relationship between the SP log and grain size. The
sedimentological implication of this relationship leads to a direct correlation
between facies and log shape. In this case the log shapes are those of overall
sequences rather than individual bodies (Parker 1977). Since the dune sediments
in the Manapad region are medium sand in grain size and well-sorted and well-
rounded in nature (Marimuthu and Sivakumar, 2000) the depositional pattern in
dune environment maintains constancy in grain size distribution. As a result, the
shape of the log in the study area shows the cylindrical shape.

L itho logy Polarity I Interpretation General Trend
Serrated
Constant
Aeolian Cylinder
Grain size
Dunes
Fining up MarineFormationS
AeolianDunes
AeolianDunes
AeolianDunes
ConstantGrain size
ConstantGrain size
ConstantGrain size
Ml ManapadAppparent Resistivity(ohm-m)
0 500 1000 1500 2000 2500 3000f Litliology Sequence0
S,ntl
clav5 Aeolian
10 Cycle IV
15
20 Sinl
25App.Res
St AeolianCycle III
Snnd
Cd SP
50
55
60
65
70
75 --200 1000 2200 3400 4600 5800 700C
Self Potential (mV)Figure 6.12 Composite log of SP and apparent resistivity and their interpretation illustratingaeolian environment of Mana pad Ml area
201
' Aeolian
Sind
Cycle 11
1St
S.intl
Aeolian' S Cycle I
Sand
I_St
MarineClay Cycle

0
5
10
15
20
25
30
'- 35
40
45
50
55
60
65
7C
M2 ManapadAnrrrt Rpsistivitv(ohm-m
-90 -40 10 60 110 160
Self Potential(mV)Figure 6.13 Composite log of SP and apparent resistivity and theirinterpretation illustrating aeolian environment of Manapad M2 area
202
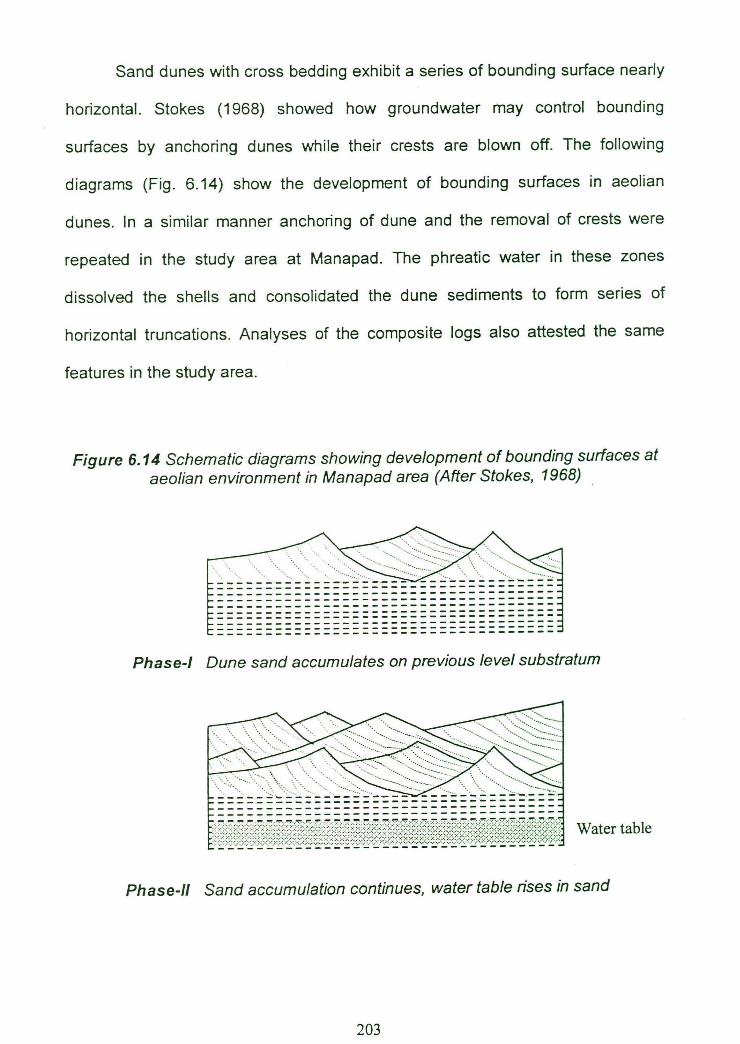
Sand dunes with cross bedding exhibit a series of bounding surface nearly
horizontal. Stokes (1968) showed how groundwater may control bounding
surfaces by anchoring dunes while their crests are blown off. The following
diagrams (Fig. 6.14) show the development of bounding surfaces in aeolian
dunes. In a similar manner anchoring of dune and the removal of crests were
repeated in the study area at Manapad. The phreatic water in these zones
dissolved the shells and consolidated the dune sediments to form series of
horizontal truncations. Analyses of the composite logs also attested the same
features in the study area.
Figure 6.14 Schematic diagrams showing development of bounding surfaces ataeolian environment in Manapad area (After Stokes, 1968)
Phase-1 Dune sand accumulates on previous level substratum
Water table
Phase-11 Sand accumulation continues, water table rises in sand
203
Water table
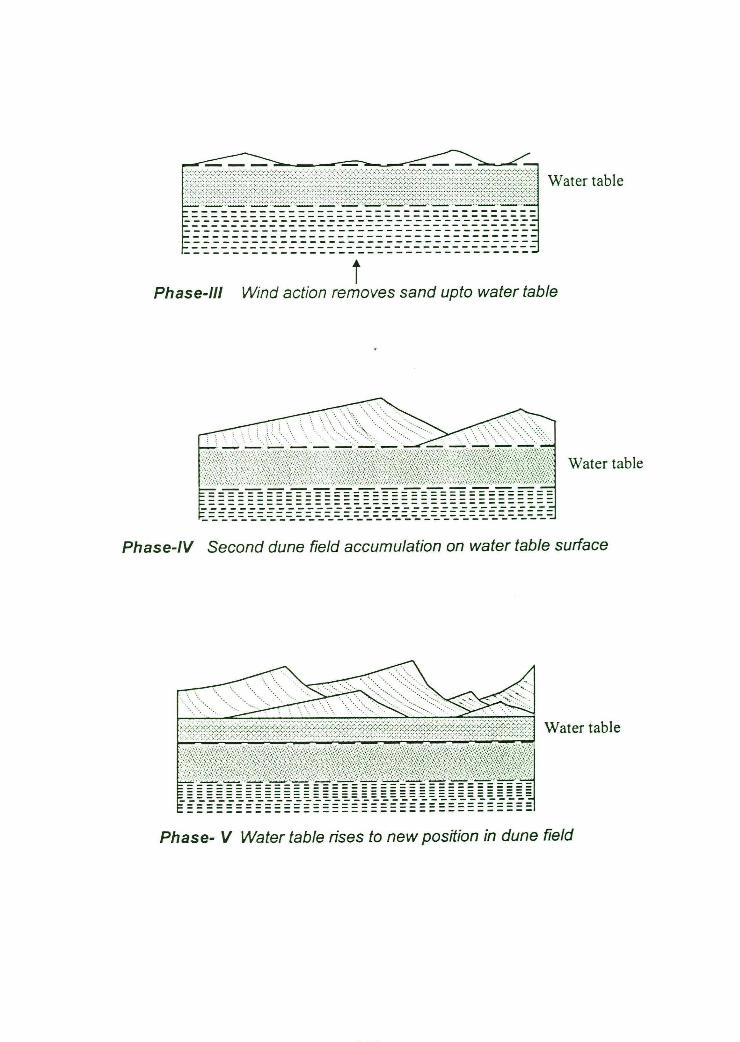
Phase-I!! Wind action removes sand upto water table
Water table
Phase-IV Second dune field accumulation on water table surface
Nino
......... ... .. ....Water table
Phase- V Water table rises to new position in dune field
Water table
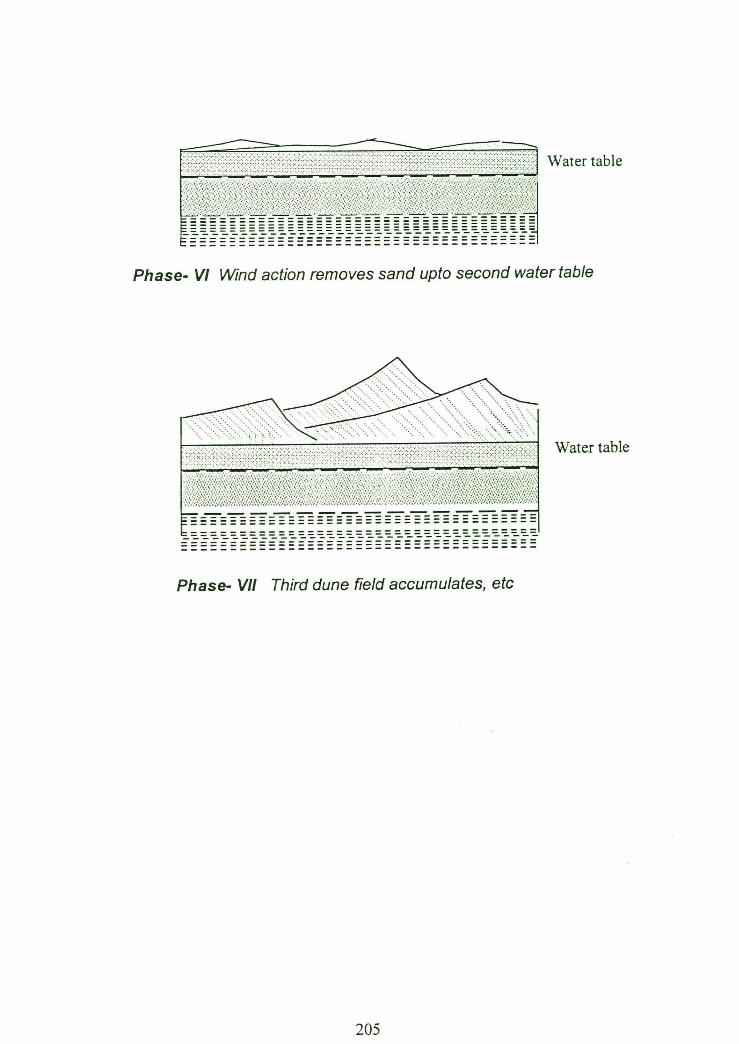
Phase- VI Wind action removes sand upto second water table
Water table
Phase- VII Third dune field accumulates, etc
205