chapter 6 fluidisation - mti.ntu.edu.iqmti.ntu.edu.iq/wp-content/uploads/2019/10/inaam-15-16.pdf ·...
TRANSCRIPT

CHAPTER 6
Fluidisation
6.1. CHARACTERISTICS OF FLUIDISED SYSTEMS
6.1.1. General behaviour of gas solids and liquid solids systems
When a fluid is passed downwards through a bed of solids, no relative movement betweenthe particles takes place, unless the initial orientation of the particles is unstable, and wherethe flow is streamline, the pressure drop across the bed is directly proportional to the rateof flow, although at higher rates the pressure drop rises more rapidly. The pressure dropunder these conditions may be obtained using the equations in Chapter 4.
When a fluid is passed upwards through a bed, the pressure drop is the same as that fordownward flow at relatively low rates. When, however, the frictional drag on the particlesbecomes equal to their apparent weight, that is the actual weight less the buoyancy force,the particles become rearranged thus offering less resistance to the flow of fluid and thebed starts to expand with a corresponding increase in voidage. This process continueswith increase in velocity, with the total frictional force remaining equal to the weight ofthe particles, until the bed has assumed its loosest stable form of packing. If the velocityis then increased further, the individual particles separate from one another and becomefreely supported in the fluid. At this stage, the bed is described as fluidised. Furtherincrease in the velocity causes the particles to separate still further from one another,although the pressure difference remains approximately equal to the weight per unit areaof the bed. In practice, the transition from the fixed to the fluidised bed condition is notuniform mainly due to irregularities in the packing and, over a range of velocities, fixedand fluidised bed regions may co-exist. In addition, with gases, surface-related forces giverise to the formation of conglomerates of particles through which there is a minimal flowand, as a result, much of the gas may pass through the bed in channels. This is an unstablecondition since the channels that offer a relatively low resistance to flow, tend to openup as the gas flowrate is increased and regions of the bed may remain in an unfluidisedstate even though the overall superficial velocity may be much higher than the minimumfluidising velocity.
Up to this point, the system behaves in a similar way with both liquids and gases,although at high fluid velocities, there is usually a fairly sharp distinction between thebehaviour of the two systems. With a liquid, the bed continues to expand as the velocityis increased and it maintains its uniform character, with the degree of agitation of theparticles increasing progressively. This type of fluidisation is known as particulate fluidi-sation. With a gas, however, uniform fluidisation is frequently obtained only at lowvelocities. At higher velocities two separate phases may form — a continuous phase,often referred to as the dense or emulsion phase, and a discontinuous phase known as
291
A-PDF Content Splitter Demo. Purchase from www.A-PDF.com to remove the watermark
292 CHEMICAL ENGINEERING
the lean or bubble phase. The fluidisation is then said to be aggregative. At much highervelocities, the bubbles tend to break down — a feature that leads to a much more chaoticstructure. When gas bubbles pass through a relatively high-density fluidised bed the systemclosely resembles a boiling liquid, with the lean phase corresponding to the vapour andthe dense or continuous phase corresponding to the liquid. The bed is then often referredto as a boiling bed, as opposed to the quiescent bed usually formed at low flowrates.As the gas flowrate is increased, the velocity relative to the particles in the dense phasedoes not change appreciably, and streamline flow may persist even at very high overallrates of flow because a high proportion of the total flow is then in the form of bubbles.At high flowrates in deep beds, coalescence of the bubbles takes place, and in narrowvessels, slugs of gas occupying the whole cross-section may be produced. These slugsof gas alternate with slugs of fluidised solids that are carried upwards and subsequentlycollapse, releasing the solids which fall back.
In an early attempt to differentiate between the conditions leading to particulate oraggregative fluidisation, WILHELM and KWAUK(1) suggested using the value of the Froudenumber (u2
mf /gd) as a criterion, where:
umf is the minimum velocity of flow, calculated over the whole cross-sectionof the bed, at which fluidisation takes place,
d is the diameter of the particles, andg is the acceleration due to gravity.
At values of a Froude group of less than unity, particulate fluidisation normally occurs and,at higher values, aggregative fluidisation takes place. Much lower values of the Froudenumber are encountered with liquids because the minimum velocity required to producefluidisation is less. A theoretical justification for using the Froude group as a meansof distinguishing between particulate and aggregative fluidisation has been provided byJACKSON(2) and MURRAY(3).
Although the possibility of forming fluidised beds had been known for many years,the subject remained of academic interest until the adoption of fluidised catalysts by thepetroleum industry for the cracking of heavy hydrocarbons and for the synthesis of fuelsfrom natural gas or from carbon monoxide and hydrogen. In many ways, the fluidised bedbehaves as a single fluid of a density equal to that of the mixture of solids and fluid. Sucha bed will flow, it is capable of transmitting hydrostatic forces, and solid objects withdensities less than that of the bed will float at the surface. Intimate mixing occurs withinthe bed and heat transfer rates are very high with the result that uniform temperatures arequickly attained throughout the system. The easy control of temperature is the feature thathas led to the use of fluidised solids for highly exothermic processes, where uniformityof temperature is important.
In order to understand the properties of a fluidised system, it is necessary to study theflow patterns of both the solids and the fluid. The mode of formation and behaviour offluid bubbles is of particular importance because these usually account for the flow of ahigh proportion of the fluid in a gas–solids system.
In any study of the properties of a fluidised system, it is necessary to select condi-tions which are reproducible and the lack of agreement between the results of manyworkers, particularly those relating to heat transfer, is largely attributable to the existenceof widely different uncontrolled conditions within the bed. The fluidisation should be of

FLUIDISATION 293
good quality, that is to say, that the bed should be free from irregularities and channelling.Many solids, particularly those of appreciably non-isometric shape and those that havea tendency to form agglomerates will never fluidise readily in a gas. Furthermore, thefluid must be evenly distributed at the bottom of the bed and it is usually necessary toprovide a distributor across which the pressure drop is equal to at least that across thebed. This condition is much more readily achieved in a small laboratory apparatus thanin large-scale industrial equipment.
As already indicated, when a liquid is the fluidising agent, substantially uniform condi-tions pervade in the bed, although with a gas, bubble formation tends to occur except atvery low fluidising velocities. In an attempt to improve the reproducibility of conditionswithin a bed, much of the earlier research work with gas fluidised systems was carriedout at gas velocities sufficiently low for bubble formation to be absent. In recent years,however, it has been recognised that bubbles normally tend to form in such systems, thatthey exert an important influence on the flow pattern of both gas and solids, and that thebehaviour of individual bubbles can often be predicted with reasonable accuracy.
6.1.2. Effect of fluid velocity on pressure gradient and pressure drop
When a fluid flows slowly upwards through a bed of very fine particles the flow isstreamline and a linear relation exists between pressure gradient and flowrate as discussedin Chapter 4, Section 4.2.3. If the pressure gradient (−P/l) is plotted against the super-ficial velocity (uc) using logarithmic co-ordinates a straight line of unit slope is obtained,as shown in Figure 6.1. As the superficial velocity approaches the minimum fluidisingvelocity (umf ), the bed starts to expand and when the particles are no longer in physicalcontact with one another the bed is fluidised. The pressure gradient then becomes lowerbecause of the increased voidage and, consequently, the weight of particles per unit heightof bed is smaller. This fall continues until the velocity is high enough for transport of thematerial to take place, and the pressure gradient then starts to increase again because thefrictional drag of the fluid at the walls of the tube starts to become significant. When thebed is composed of large particles, the flow will be laminar only at very low velocitiesand the slope s of the lower part of the curve will be greater (1 < s < 2) and may not
Fixedbed
Fluidisedbed
Transport
log (uc)
log
−∆P l
Figure 6.1. Pressure gradient within a bed as a function of fluid velocity

294 CHEMICAL ENGINEERING
Fixed bed Fluidisedbed
Fluidising point
log (uc )
log
(−∆P
)
A
B
CE
F
D
Velocity decreasing(bed of maximum porosity)
Velocityincreasing
Figure 6.2. Pressure drop over fixed and fluidised beds
be constant, particularly if there is a progressive change in flow regime as the velocityincreases.
If the pressure across the whole bed instead of the pressure gradient is plotted againstvelocity, also using logarithmic coordinates as shown in Figure 6.2, a linear relation isagain obtained up to the point where expansion of the bed starts to take place (A),although the slope of the curve then gradually diminishes as the bed expands and itsporosity increases. As the velocity is further increased, the pressure drop passes througha maximum value (B) and then falls slightly and attains an approximately constant valuethat is independent of the fluid velocity (CD). If the fluid velocity is reduced again, thebed contracts until it reaches the condition where the particles are just resting on oneanother (E). The porosity then has the maximum stable value which can occur for a fixedbed of the particles. If the velocity is further decreased, the structure of the bed thenremains unaffected provided that the bed is not subjected to vibration. The pressure drop(EF) across this reformed fixed bed at any fluid velocity is then less than that beforefluidisation. If the velocity is now increased again, it might be expected that the curve(FE) would be retraced and that the slope would suddenly change from 1 to 0 at thefluidising point. This condition is difficult to reproduce, however, because the bed tendsto become consolidated again unless it is completely free from vibration. In the absenceof channelling, it is the shape and size of the particles that determine both the maximumporosity and the pressure drop across a given height of fluidised bed of a given depth.In an ideal fluidised bed the pressure drop corresponding to ECD is equal to the buoyantweight of particles per unit area. In practice, it may deviate appreciably from this valueas a result of channelling and the effect of particle-wall friction. Point B lies aboveCD because the frictional forces between the particles have to be overcome before bedrearrangement can take place.
The minimum fluidising velocity, umf , may be determined experimentally by measuringthe pressure drop across the bed for both increasing and decreasing velocities and plottingthe results as shown in Figure 6.2. The two ‘best’ straight lines are then drawn through theexperimental points and the velocity at their point of intersection is taken as the minimumfluidising velocity. Linear rather than logarithmic plots are generally used, although it isnecessary to use logarithmic plots if the plot of pressure gradient against velocity in thefixed bed is not linear.

FLUIDISATION 295
The theoretical value of the minimum fluidising velocity may be calculated from theequations given in Chapter 4 for the relation between pressure drop and velocity in afixed packed bed, with the pressure drop through the bed put equal to the apparent weightof particles per unit area, and the porosity set at the maximum value that can be attainedin the fixed bed.
In a fluidised bed, the total frictional force on the particles must equal the effectiveweight of the bed. Thus, in a bed of unit cross-sectional area, depth l, and porosity e, theadditional pressure drop across the bed attributable to the layout weight of the particlesis given by:
−P = (1 − e)(ρs − ρ)lg (6.1)
where: g is the acceleration due to gravity andρs and ρ are the densities of the particles and the fluid respectively.
This relation applies from the initial expansion of the bed until transport of solids takesplace. There may be some discrepancy between the calculated and measured minimumvelocities for fluidisation. This may be attributable to channelling, as a result of whichthe drag force acting on the bed is reduced, to the action of electrostatic forces in caseof gaseous fluidisation — particularly important in the case of sands — to agglomerationwhich is often considerable with small particles, or to friction between the fluid and thewalls of the containing vessel. This last factor is of greatest importance with beds ofsmall diameters. LEVA et al.(4) introduced a term, (GF − GE)/GF , which is a fluidisationefficiency, in which GF is the minimum flowrate required to produce fluidisation and GE
is the rate required to produce the initial expansion of the bed.If flow conditions within the bed are streamline, the relation between fluid velocity uc,
pressure drop (−P ) and voidage e is given, for a fixed bed of spherical particles ofdiameter d , by the Carman-Kozeny equation (4.12a) which takes the form:
uc = 0.0055(
e3
(1 − e)2
)(−P d2
µl
)(6.2)
For a fluidised bed, the buoyant weight of the particles is counterbalanced by the frictionaldrag. Substituting for −P from equation 6.1 into equation 6.2 gives:
uc = 0.0055(
e3
1 − e
)(d2(ρs − ρ)g
µ
)(6.3)
There is evidence in the work reported in Chapter 5 on sedimentation(5) to suggest thatwhere the particles are free to adjust their orientations with respect to one another and tothe fluid, as in sedimentation and fluidisation, the equations for pressure drop in fixed bedsoverestimate the values where the particles can ‘choose’ their orientation. A value of 3.36rather than 5 for the Carman-Kozeny constant is in closer accord with experimental data.The coefficient in equation 6.3 then takes on the higher value of 0.0089. The experimentalevidence is limited to a few measurements however and equation 6.3, with its possibleinaccuracies, is used here.

296 CHEMICAL ENGINEERING
6.1.3. Minimum fluidising velocity
As the upward velocity of flow of fluid through a packed bed of uniform spheres isincreased, the point of incipient fluidisation is reached when the particles are just supportedin the fluid. The corresponding value of the minimum fluidising velocity (umf ) is thenobtained by substituting emf into equation 6.3 to give:
umf = 0.0055
(e3
mf
1 − emf
)d2(ρs − ρ)g
µ(6.4)
Since equation 6.4 is based on the Carman–Kozeny equation, it applies only to condi-tions of laminar flow, and hence to low values of the Reynolds number for flow in thebed. In practice, this restricts its application to fine particles.
The value of emf will be a function of the shape, size distribution and surface propertiesof the particles. Substituting a typical value of 0.4 for emf in equation 6.4 gives:
(umf )emf =0.4 = 0.00059(
d2(ρs − ρ)g
µ
)(6.5)
When the flow regime at the point of incipient fluidisation is outside the range overwhich the Carman-Kozeny equation is applicable, it is necessary to use one of the moregeneral equations for the pressure gradient in the bed, such as the Ergun equation givenin equation 4.20 as:
−P
l= 150
((1 − e)2
e3
)(µuc
d2
)+ 1.75
((1 − e)
e3
)(ρu2
c
d
)(6.6)
where d is the diameter of the sphere with the same volume:surface area ratio as theparticles.Substituting e = emf at the incipient fluidisation point and for −P from equation 6.1,equation 6.6 is then applicable at the minimum fluidisation velocity umf , and gives:
(1 − emf )(ρs − ρ)g = 150
((1 − emf )2
e3mf
)(µumf
d2
)+ 1.75
((1 − emf )
e3mf
)(ρu2
mf
d
)
(6.7)
Multiplying both sides byρd3
µ2(1 − emf )gives:
ρ(ρs − ρ)gd3
µ2= 150
(1 − emf
e3mf
)(umf dρ
µ
)+(
1.75
e3mf
)(umf dρ
µ
)2
(6.8)
In equation 6.8:d3ρ(ρs − ρ)g
µ2= Ga (6.9)
where Ga is the ‘Galileo number’.
and:umf dρ
µ= Re′
mf . (6.10)

FLUIDISATION 297
where Remf is the Reynolds number at the minimum fluidising velocity and equation 6.8then becomes:
Ga = 150
(1 − emf
e3mf
)Re′
mf +(
1.75
e3mf
)Re2′mf (6.11)
For a typical value of emf = 0.4:
Ga = 1406Re′mf + 27.3Re
′2mf (6.12)
Thus: Re′2mf + 51.4Re′
mf − 0.0366Ga = 0 (6.13)
and: (Re′mf )emf =0.4 = 25.7{√(1 + 5.53 × 10⁻⁵Ga) − 1} (6.14)
and, similarly for emf = 0.45:
(Re′mf )emf =0.45 = 23.6{√(1 + 9.39 × 10⁻⁵ Ga) − 1} (6.14a)
By definition:
umf = µ
dρRe′
mf (6.15)
It is probable that the Ergun equation, like the Carman-Kozeny equation, also overpredictspressure drop for fluidised systems, although no experimental evidence is available onthe basis of which the values of the coefficients may be amended.
WEN and YU(6) have examined the relationship between voidage at the minimumfluidising velocity, emf , and particle shape, φs , which is defined as the ratio of the diameterof the sphere of the same specific as the particle d , as used in the Ergun equation to thediameter of the sphere with the same volume as the particle dp.
Thus: φs = d/dp (6.16)
where: d = 6Vp/Ap and dp = (6Vp/π)1/3.
In practice the particle size d can be determined only by measuring both the volumesVp and the areas Ap of the particles. Since this operation involves a somewhat tediousexperimental technique, it is more convenient to measure the particle volume only andthen work in terms of dp and the shape factor.
The minimum fluidising velocity is a function of both emf and φs , neither of which iseasily measured or estimated, and Wen and Yu have shown that these two quantities are,in practice, inter-related. These authors have published experimental data of emf and φs
for a wide range of well-characterised particles, and it has been shown that the relationbetween these two quantities is essentially independent of particle size over a wide range.It has also been established that the following two expressions give reasonably goodcorrelations between emf and φs , as shown in Figure 6.3:(
1 − emf
e3mf
)1
φ2s
= 11 (6.17)
(1
emf3
1
φs
)= 14 (6.18)

298 CHEMICAL ENGINEERING
00
0.2
0.4
0.6
0.8
1.0
0.2
:
:
0.4
l
0.6 0.8 1.0fs
e mf
l − emf
f2s emf
3
f2s emf
3
≅ 11
≅ 14
Figure 6.3. Relation between emf and φs
NIVEN(7) discusses the significance of the two dimensionless groups in equations 6.17and 6.18, and also suggests that d and umf in equations 6.8, 6.9 and 6.10 are moreappropriately replaced by a mean linear dimension of the pores and the mean pore velocityat the point of incipient fluidisation.
Using equation 6.16 to substitute forφs
dpfor d in equation 6.6 gives:
(1 − emf )(ρs − ρ)g = 150
((1 − emf )
2
e3mf
)(µumf
φ2s dp
2
)+ 1.75
(1 − emf
e3mf
)ρumf
2
φsdp
Thus:
(ρs − ρ)ρgd3p
µ2= 150
(1 − emf
e3mf
)1
φ2s
(ρdpumf
µ
)+ 1.75
(1
e3mf φs
)(ρ2d2
pu2mf
µ2
)
Substituting from equations 6.17 and 6.18:
Gap = (150 × 11)Re′mfp + (1.75 × 14)Re′2mfp
where Gap and Remfp are the Galileo number and the particle Reynolds number at thepoint of incipient fluidisation, in both cases with the linear dimension of the particlesexpressed as dp .
Thus: Re′2mfp + 67.3Re′mfp − 0.0408Gap = 0
giving: Re′mfp = 33.65[√(1 + 6.18 × 10⁻⁵Gap)− 1] (6.19)
where: umf =(µ
dpρ
)Re′mfp (6.20)
Example 6.1
A bed consists of uniform spherical particles of diameter 3 mm and density 4200 kg/m3. What willbe the minimum fluidising velocity in a liquid of viscosity 3 mNs/m2 and density 1100 kg/m3?

FLUIDISATION 299
Solution
By definition:
Galileo number, Ga = d3ρ(ρs − ρ)g/µ2
= ((3 × 10⁻³)3 × 1100 × (4200 − 1100) × 9.81)/(3 × 10−3)2
= 1.003 × 10⁵
Assuming a value of 0.4 for emf , equation 6.14 gives:
Re′mf = 25.7{√(1 + (5.53 × 10⁻⁵)(1.003 × 10⁵)) − 1} = 40
and: umf = (40 × 3 × 10−3)/(3 × 10−3 × 1100) = 0.0364 m/s or 36.4 mm/s
Example 6.2
Oil, of density 900 kg/m3 and viscosity 3 mNs/m2, is passed vertically upwards through a bed ofcatalyst consisting of approximately spherical particles of diameter 0.1 mm and density 2600 kg/m3.At approximately what mass rate of flow per unit area of bed will (a) fluidisation, and (b) transportof particles occur?
Solution
(a) Equations 4.9 and 6.1 may be used to determine the fluidising velocity, umf .
u = (1/K ′′)(e3/(S2(1 − e)2)(1/µ)(−P/l) (equation 4.9)
−P = (1 − e)(ρs − ρ)lg (equation 6.1)
where S = surface area/volume, which, for a sphere, = πd2/(πd3/6) = 6/d .
Substituting K ′′ = 5, S = 6/d and −P/l from equation 6.1 into equation 4.9 gives:
umf = 0.0055(e3/(1 − e))(d2(ρs − ρ)g)/µ
Hence : G′mf = ρu = (0.0055e3/(1 − e))(d2(ρs − ρ)g)/µ
In this problem, ρs = 2600 kg/m3, ρ = 900 kg/m3, µ = 3.0 × 10⁻³ Ns/m2
and d = 0.1 mm = 1.0 × 10⁻⁴ m.As no value of the voidage is available, e will be estimated by considering eight closely packed
spheres of diameter d in a cube of side 2d . Thus:
volume of spheres = 8(π/6)d3
volume of the enclosure = (2d)3 = 8d3
and hence: voidage, e = [8d3 − 8(π/6)d3]/8d3 = 0.478, say, 0.48.
Thus : G′mf = 0.0055(0.48)3(10−4)2((900 × 1700) × 9.81)/((1 − 0.48) × 3 × 10−3
= 0.059 kg/m2s
300 CHEMICAL ENGINEERING
(b) Transport of the particles will occur when the fluid velocity is equal to the terminal fallingvelocity of the particle.
Using Stokes’ law : u0 = d2g(ρs − ρ)/18µ (equation 3.24)
= ((10−4)2 × 9.81 × 1700)/(18 × 3 × 10−3)
= 0.0031 m/s
The Reynolds number = ((10−4 × 0.0031 × 900)/(3 × 10−3) = 0.093 and hence Stokes’ lawapplies.
The required mass flow = (0.0031 × 900) = 2.78 kg/m2s
An alternative approach is to make use of Figure 3.6 and equation 3.35,
(R/ρu2)Re2 = 2d3ρg(ρs − ρ)/3µ2
= (2 × (10−4)3 × (900 × 9.81) × 1700)/(3(3 × 10−3)2) = 1.11
From Figure 3.6, Re = 0.09
Hence: u0 = Re(µ/ρd) = (0.09 × 3 × 10−3)/(900 × 10−4) = 0.003 m/s
and: G′ = (0.003 × 900) = 2.7 kg/m2s
6.1.4. Minimum fluidising velocity in terms of terminal failing velocity
The minimum fluidising velocity, umf , may be expressed in terms of the free-fallingvelocity u0 of the particles in the fluid. The Ergun equation (equation 6.11) relates theGalileo number Ga to the Reynolds number Re′
mf in terms of the voidage emf at theincipient fluidisation point.
In Chapter 3, relations are given that permit the calculation of Re′0(u0dρ/µ), the particle
Reynolds number for a sphere at its terminal falling velocity u0, also as a function ofGalileo number. Thus, it is possible to express Re′
mf in terms of Re′0 and umf in terms
of u0.For a spherical particle the Reynolds number Re′
0 is expressed in terms of the Galileonumber Ga by equation 3.40 which covers the whole range of values of Re′ of interest.This takes the form:
Re′0 = (2.33Ga0.018 − 1.53Ga−0.016)13.3 (6.21)
Equation 6.21 applies when the particle motion is not significantly affected by the wallsof the container, that is when d/dt tends to zero.
Thus, for any value of Ga, Re′0 may be calculated from equation 6.21 and Re′
mf fromequation 6.11 for a given value of emf . The ratio Re′
0/Re′mf (= u0/umf ) may then be
plotted against Ga with emf as the parameter. Such a plot is given in Figure 6.4 whichincludes some experimental data. Some scatter is evident, largely attributable to the factthat the diameter of the vessel (dt ) was not always large compared with that of the particle.Nevertheless, it is seen that the experimental results straddle the curves covering a range
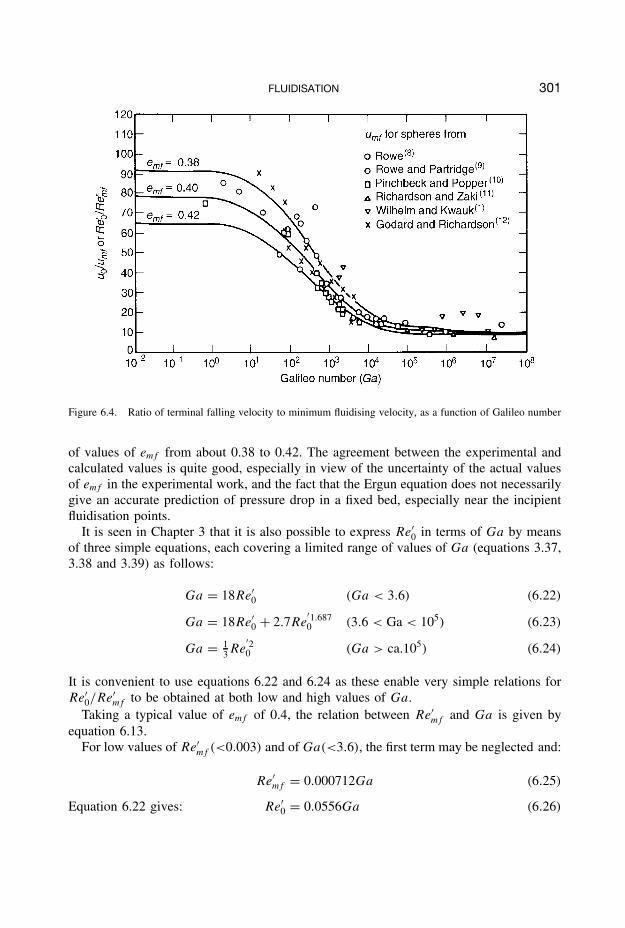
FLUIDISATION 301
Figure 6.4. Ratio of terminal falling velocity to minimum fluidising velocity, as a function of Galileo number
of values of emf from about 0.38 to 0.42. The agreement between the experimental andcalculated values is quite good, especially in view of the uncertainty of the actual valuesof emf in the experimental work, and the fact that the Ergun equation does not necessarilygive an accurate prediction of pressure drop in a fixed bed, especially near the incipientfluidisation points.
It is seen in Chapter 3 that it is also possible to express Re′0 in terms of Ga by means
of three simple equations, each covering a limited range of values of Ga (equations 3.37,3.38 and 3.39) as follows:
Ga = 18Re′0 (Ga < 3.6) (6.22)
Ga = 18Re′0 + 2.7Re
′1.6870 (3.6 < Ga < 105) (6.23)
Ga = 13 Re
′20 (Ga > ca.105) (6.24)
It is convenient to use equations 6.22 and 6.24 as these enable very simple relations forRe′
0/Re′mf to be obtained at both low and high values of Ga.
Taking a typical value of emf of 0.4, the relation between Re′mf and Ga is given by
equation 6.13.For low values of Re′
mf (<0.003) and of Ga(<3.6), the first term may be neglected and:
Re′mf = 0.000712Ga (6.25)
Equation 6.22 gives: Re′0 = 0.0556Ga (6.26)

302 CHEMICAL ENGINEERING
Combining equations 6.25 and 6.26:
Re′0
Re′mf
= u0
umf
= 78 (6.27)
Again, for high values of Re′mf (>∼ 200) and Ga(>105), equation 6.13 gives:
Re′mf = 0.191Ga1/2 (6.28)
Equation 6.24 gives:
Re′0 = 1.732Ga1/2 (6.29)
Thus :Re′
0
Re′mf
= u0
umf
= 9.1 (6.30)
This shows that u0/umf is much larger for low values of Ga, generally obtainedwith small particles, than with high values. For particulate fluidisation with liquids, thetheoretical range of fluidising velocities is from a minimum of umf to a maximum of u0.It is thus seen that there is a far greater range of velocities possible in the streamlineflow region. In practice, it is possible to achieve flow velocities greatly in excess of u0
for gases, because a high proportion of the gas can pass through the bed as bubbles andeffectively by-pass the particles.
6.2. LIQUID-SOLIDS SYSTEMS
6.2.1. Bed expansion
Liquid-fluidised systems are generally characterised by the regular expansion of the bedthat takes place as the velocity increases from the minimum fluidisation velocity tothe terminal falling velocity of the particles. The general relation between velocity andvolumetric concentration or voidage is found to be similar to that between sedimentationvelocity and concentration for particles in a suspension. The two systems are hydrody-namically similar in that in the fluidised bed the particles undergo no net movement andare maintained in suspension by the upward flow of liquid, whereas in the sedimentingsuspension the particles move downwards and the only flow of liquid is the upward flowof that liquid which is displaced by the settling particles. RICHARDSON and ZAKI(11) showedthat, for sedimentation or fluidisation of uniform particles:
uc
ui
= en = (1 − C)n (6.31)
where: uc is the observed sedimentation velocity or the empty tube fluidisationvelocity,
ui is the corresponding velocity at infinite dilution,e is the voidage of the system,C is the volumetric fractional concentration of solids, andn is an index.

FLUIDISATION 303
The existence of a relationship of the form of equation 6.31 had been established six yearsearlier by WILHELM and KWAUK(1) who fluidised particles of glass, sand and lead shotwith water. On plotting particle Reynolds number against bed voidage using logarithmicscales, good straight lines were obtained over the range of conditions for which the bedwas fluidised.
A similar equation had previously been given by LEWIS and BOWERMAN(13).Equation 6.31 is similar to equation 5.71 for a sedimenting suspension. Values of the
index n range from 2.4 to 4.8 and are the same for sedimentation and for fluidisation ata given value of the Galileo number Ga. These may be calculated from equation 6.32,which is identical to equation 5.84 in Chapter 5:
(4.8 − n)
(n − 2.4)= 0.043Ga0.57
[1 − 1.24
(d
dt
)0.27]
(6.32)
RICHARDSON and ZAKI(11) found that ui corresponded closely to u0, the free settlingvelocity of a particle in an infinite medium, for work on sedimentation as discussed inChapter 5, although ui was somewhat less than u0 in fluidisation. The following equationfor fluidisation was presented:
log10 u0 = log10 ui + d
dt
(6.33)
The difference is likely to be attributed to the fact that d/dt was very small in thesedimentation experiments. More recently, KHAN and RICHARDSON(14) have proposed thefollowing relation to account for the effect of the walls of the vessel in fluidisation:
ui
u0= 1 − 1.15
(d
dt
)0.6
(6.34)
If logarithmic co-ordinates are used to plot the voidage e of the bed against the super-ficial velocity uc (Figure 6.5), the resulting curve can be represented approximately bytwo straight lines joined by a short transitional curve. At low velocities the voidageremains constant corresponding to that of the fixed bed, and for the fluidised state thereis a linear relation between log uc and log e. The curve shown refers to the fluidisationof steel spheres in water. It should be noted that whereas, in the absence of channelling,the pressure drop across a bed of a given expansion is directly proportional to its depth,the fluidising velocity is independent of depth.
An alternative way of calculating the index n in equation 6.31 for the expansion ofparticulately fluidised systems is now considered. Neglecting effects due to the containerwall then:
uc
u0= Re′
c
Re′0
= en (6.35)
where Re′c is the Reynolds number ucdρ/µ.
Taking logarithms: n = log(uc/u0)
log e= − log(Re′
0/Re′c)
log e(6.36)

304 CHEMICAL ENGINEERING
Figure 6.5. Relation between fluid velocity (uc) and voidage (e) for the fluidisation of 6.4 mm steel spheresin water
On the assumption that equation 6.31 may be applied at the point of incipient fluidisation:
n = log(umf /u0)
log emf
= − log(Re′0/Re′
mf )
log emf
(6.37)
For a typical value of emf of 0.4, Re′mf is given by equation 6.14. Furthermore, Re′
0 isgiven by equation 6.21. Substitution into equation 6.37 then gives:
n = 2.51 log{
(1.83Ga0.018 − 1.2Ga−0.016)13.3
√(1 + 5.53 × 10⁻⁵Ga) − 1
}(6.38)
Equation 6.38 which applies to low values of d/dt is plotted in Figure 6.6, together withexperimental points from the literature, annotated according to the d/dt range which isapplicable(14). The scatter, and the low experimental values of n, are attributable partlyto the wider range of d/dt values covered and also inaccuracies in the experimentalmeasurements which are obtained from the results of a number of workers. For emf =0.43, the calculated values of n are virtually unchanged over the range 10 < Ga < 105.
An alternative method of calculating the value of Re′mf (and hence umf ) is to substitute
for Re′0 from equation 6.21 into equation 6.35, and to put the voidage e equal to its value
emf at the minimum fluidising velocity.
In this way: Re′mf = (2.33Ga0.018 − 1.53Ga0.016)13.3en
mf (6.39)
where n is given by equation 6.32.

FLUIDISATION 305
Figure 6.6. Comparison of values of the index n calculated from equation 6.37 with experimental data
The same procedure may be adopted for calculating the minimum fluidising for ashear-thinning non-Newtonian fluid which exhibits power-law behaviour, although it isnecessary to use the modified Reynolds number (Re1)n given in Chapter 4, equation 4.28.
For inelastic fluids exhibiting power-law behaviour, the bed expansion which occurs asthe velocity is increased above the minimum fluidising velocity follows a similar patternto that obtained with a Newtonian liquid, with the exponent in equation 6.31 differing byno more than about 10 per cent. There is some evidence, however, that with viscoelasticpolymer solutions the exponent may be considerably higher. Reference may be made towork by SRINIVAS and CHHABRA(15) for further details.
Example 6.3
Glass particles of 4 mm diameter are fluidised by water at a velocity of 0.25 m/s. What will be thevoidage of the bed?
The density of glass = 2500 kg/m3, the density of water = 1000 kg/m3, and the viscosity ofwater = 1mNs/m2.
Solution
Galileo number for particles in water, Ga = d3ρ(ρs − ρ)g
µ2(equation 6.9)
= (4 × 10⁻³)3 × 1000 × 1500 × 9.81
(1 × 10⁻³)2= 9.42 × 10⁵

306 CHEMICAL ENGINEERING
Reynolds number Re′0 at terminal falling velocity is given by equation 6.21:
Re′0 = (2.33Ga0.018 − 1.53Ga−0.016)13.3
Thus: u0 = 1800(
1 × 10⁻³
4 × 10−3 × 1000
)= 0.45 m/s
The value of n in equation 6.31 is given by equation 6.32 for small values of d/dt as:
(4.8 − n)
(n− 2.4)= 0.043Ga0.57 = 109.5
∴ n = 2.42
The voidage e at a velocity of 0.25 m/s is then given by equation 6.31 as:
0.25
0.45= e2.42
and: e = 0.784
6.2.2. Non-uniform fluidisation
Regular and even expansion of the bed does not always occur when particles are fluidisedby a liquid. This is particularly so for solids of high densities, and non-uniformitiesare most marked with deep beds of small particles. In such cases, there are significantdeviations from the relation between bed voidage and velocity predicted by equation 6.31.
STEWART (referred to in STEWART and DAVIDSON(16)) has shown that well-defined bubblesof liquid and slugs are formed when tungsten beads (density 19,300 kg/m3, and particlesizes 776 and 930 µm) are fluidised with water. SIMPSON and RODGER(17), HARRISON
et al.(18), LAWTHER and BERGLIN(19) and RICHARDSON and SMITH(20) have observed that leadshot fluidised by water gives rise to non-uniform fluidised beds. ANDERSON and JACKSON(21)
have shown that this system would be expected to be transitional in behaviour. HASSETT(22)
and LAWSON and HASSETT(23) have also noted instabilities and non-uniformities in liquid-solids systems, particularly in beds of narrow diameter. Similar observations have alsobeen made by CAIRNS and PRAUSNITZ(24), by KRAMERS et al.(25) and by REUTER(26), whohave published photographs of bubbles in liquid-solids systems. GIBILARO et al.(27) havemade experimental measurements of one dimensional waves in liquid–solids fluidisedbeds. BAILEY(28) has studied the fluidisation of lead shot with water and has reported theoccurrence of non-uniformities, though not of well-defined bubbles. He has shown that thelogarithmic plots of voidage against velocity are no longer linear and that the deviationsfrom the line given by equation 6.31 increase with:
(a) increase in bed weight per unit area,(b) decrease in particle size.
The deviation passes through a maximum as the velocity is increased, as shown inFigure 6.7.
The importance of particle density in determining the nature of fluidised systems is wellestablished, and increase in density generally results in a less uniform fluidised system.

FLUIDISATION 307
Equation 6.31 (0.5 kg bed)
Figure 6.7. Bed expansion for the fluidisation of 0.5–0.6 mm lead shot in water in a 100 mm tube
It is, however, surprising that a reduction in particle size should also cause increaseddeviations from the ideal system. It may be noted from Figure 6.7 that, over a widerange of liquid velocities, the mean voidage of the bed is less than that predicted byequation 6.31. This may be explained in terms of part of the fluid taking a low resistancepath through the bed, remaining there for less than the average residence time, and nottherefore contributing fully to the expansion of the bed. The effect of partial channellingwill certainly be more marked with fine solids than with coarse, since the ratio of theresistance of the bed to that of the channel will be much greater, and a comparativelysmall channel will accommodate the flow of a proportionately larger amount of fluid.
A simple model may be built up to represent what is happening under these circum-stances. The bed may be considered to be divided into two portions, one with uniformlydispersed particles and the other consisting of fluid channels. It is assumed that the voidageof the region of uniformly dispersed particles is determined according to equation 6.31by the flowrate through that part of the bed. If, then, a fraction f of the fluid introducedto the bottom of the bed flows through the channels at a velocity uf , it can be readilyshown that the relation between the mean voidage of the bed e and the mean superficialvelocity of the liquid uc is given by:
e = fuc
uf
+(
uc
ui
(1 − f )
)1/n (1 − f
uc
uf
)1−(1/n)
(6.40)

308 CHEMICAL ENGINEERING
Equation 6.40 gives the relation between all possible corresponding values of uf andf . For a typical experiment on the fluidisation of 5 kg of lead shot (d = 0.55 mm) in a100 mm diameter tube with water flowing at a mean superficial velocity of 0.158 m/s,the measured voidage of the bed was 0.676. This would give a value of f = 0.53 for achannel velocity uf = 1.58 m/s, or 0.68 for a channel velocity uf = 0.80 m/s.
Local variations in voidage in a liquid-solids fluidised bed have also been observedby VOLPICELLI et al.(29) who fluidised steel, aluminium and plastic beads with water andglycerol in a column only 3.55 mm thick, using particles ranging from 2.86 to 3.18 mmdiameter which thus gave effectively a bed one particle thick. This system facilitated obser-vation of flow patterns within the bed. It was found that the velocity–voidage relationshipwas of the same form as equation 6.31, but that it was necessary to use the actual measuredfalling velocity of the particle in the apparatus to represent ui . Non-uniformities withinthe bed were not apparent at voidages near unity or near umf , but rose to a maximumvalue intermediately; this is generally in line with Bailey’s work (Figure 6.7). The localvariations of voidage were found to be highly dependent on the arrangement of the liquiddistributor.
More recent work by FOSCOLO et al.(30) has shown that instabilities can also arise in thefluidisation of particles where densities are only slightly greater than that of the fluidisingliquid.
6.2.3. Segregation in beds of particles of mixed sizes
When a bed consists of particles with a significant size range, stratification occurs, with thelargest particles forming a bed of low voidage near the bottom and the smallest particlesforming a bed of high voidage near the top. If the particles are in the form of sharp-cutsize fractions, segregation will be virtually complete with what is, in effect, a numberof fluidised beds of different voidages, one above the other. If the size range is small,there will be a continuous variation in both composition and concentration of particlesthroughout the depth of the bed.
It has been shown experimentally(11) that a mixture of equal masses of 1.0 mm and0.5 mm particles when fluidised by water will segregate almost completely over the wholerange of velocities for which particles of each size will, on its own, form a fluidised bed.WEN and YU(7) have shown that this behaviour is confined to mixtures in which the ratioof the minimum fluidising velocities of the components exceeds about 2. The tendencyfor classification has been examined experimentally and theoretically by several workers,including JOTTRAND(31), PRUDEN and EPSTEIN(32), KENNEDY and BRETTON(33), AL-DIBOUNI
and GARSIDE(34), JUMA and RICHARDSON(35), GIBILARO et al.(36) and MORITOMI et al.(37).In a mixture of large and small particles fluidised by a liquid, one of three situations
may exist:
(a) Complete (or virtually complete) segregation, with a high voidage bed of smallparticles above a bed of lower voidage containing the large particles.
(b) Beds of small and of large particles as described in (a), but separated by a transitionregion in which the proportion of small particles and the voidage both increase frombottom to top.

FLUIDISATION 309
(c) A bed in which there are no fully segregated regions, but with the transition regiondescribed in (b) extending over the whole extent of the bed. If the range of particlesizes in the bed is small, this transition region may be of nearly constant compo-sition, with little segregation occurring.
At any level in the transition region, there will be a balance between the mixing effectsattributable to (a) axial dispersion and to (b) the segregating effect which will depend onthe difference between the interstitial velocity of the liquid and that interstitial velocitywhich would be required to produce a bed of the same voidage for particles of that sizeon their own. On this basis a model may be set up to give the vertical concentrationprofile of each component in terms of the axial mixing coefficients for the large and thesmall particles.
Experimental measurements(35) of concentration profiles within the bed have been madeusing a pressure transducer attached to a probe whose vertical position in the bed couldbe varied. The voidage e of the bed at a given height may then be calculated from thelocal value of the pressure gradient using equation 6.1, from which:
−dP
dl= (1 − e)(ρs − ρ)g (6.41)
It has been established that the tendency for segregation increases, not only with the ratioof the sizes of particles (largest:smallest), but also as the liquid velocity is raised. Thus,for a given mixture, there is more segregation in a highly expanded bed than in a bed oflow voidage.
Binary mixtures - particles differing in both size and density
The behaviour of a fluidised bed consisting of particles differing in both size and density,can be extremely complex. This situation may be illustrated by considering the simplestcase — the fluidisation of a binary mixture of spherical particles. If the heavy particles arealso the larger, they will always constitute the denser bottom layer. On the other hand, ifthe mixture consists of small high density particles H, and larger particles of lower densityL, the relative densities of the two layers is a function of the fluidising velocity. In eithercase, for both species of solids to be fluidised simultaneously, the superficial velocityuc of the liquid must lie between the minimum fluidising velocity umf and the terminalfalling velocity u0 for each of the solids of umf < uc < u0. In general, segregation tendsto occur, resulting in the formation of two fluidised beds of different densities, possiblyseparated by a transition zone, with the bed of higher density forming the bottom layer.In all cases, the interface between the two beds may be diffuse as a result of the effectof dispersion.
The densities of the two beds are then given by:
ρbH = (1 − eH )ρsH + eH ρ = ρsH − eH (ρsH − ρ) (6.42a)
ρbL = (1 − eL)ρsL + eLρ = ρsL − eL(ρsL − ρ) (6.42b)
where the suffix L refers to the light particles and the suffix H to the heavy particles.

310 CHEMICAL ENGINEERING
Applying equation 6.31 to each fluidised bed gives:
uc
u0H
= enHH and
uc
u0L
= enLL
Noting that the superficial velocity uc is the same in each case, and assuming that nH ≈nL ≈ n, then:
eL
eH
=(
u0H
u0L
)1/n
(6.43)
As the fluidising velocity is progressively increased, the voidages of both beds increases,although not generally at the same rate Two cases are considered:
(a) u0H > u0L
From equation 6.43, eH < eL and therefore, from equations 6.42a and 6.42b, ρbh > ρbl
at all fluidising velocities uc, and the heavy particles will always form the bottom layer.
(b) u0H < u0L
If, with increase in velocity, the density of the upper zone decreases more rapidly thanthat of the bottom zone, the two beds will maintain the same relative orientation. If thereverse situation applies, there may be a velocity uINV where the densities of the twolayers become equal, with virtually complete mixing of the two species taking place.Any further increase in velocity above uINV then causes the beds to invert, as showndiagrammatically in Figure 6.8(a).
Inversionpoint
Increasing fluid velocity
Inversionpoint
(a) (b)
Increasing fluid velocity
Figure 6.8. Bed inversion (a) Complete segregation (b) Complete and partial segregation(37)
The relative rates at which the bed densities change as the fluidising velocity is increasedmay be obtained by differentiating equations 6.42a and 6.42b with respect to uc, anddividing to give:
r = −dρbH
duc
/− dρbL
duc
= dρbH
dρbL
= (ρsH − ρ)
(ρsL − ρ)
(u0L
u0H
)1/n
= (ρsH − ρ)
(ρsL − ρ)
eH
eL
(6.44)

FLUIDISATION 311
As eH > eL and ρsH > ρsL, then from equation 6.44, r , which is independent of fluidisingvelocity, must be greater than unity. It is thus the bed of heavy particles which expandsmore rapidly as the velocity is increased, and which must therefore be forming the bottomlayer at low velocities if inversion is possible. That is, it is the small heavy particleswhich move from the lower to the upper layer, and vice versa, as the velocity is increasedbeyond the inversion velocity uINV. RICHARDSON and AFIATIN(38) have analysed the rangeof conditions over which segregation of spherical particles can occur, and have shownthese diagrammatically in Figure 6.9 for the Stokes’ law region (a) and for the Newton’slaw region (b).
It has been observed by several workers, including by MORITOMI et al.(37) and EPSTEIN
and PRUDEN(39), that a sharp transition between two mono-component layers does notalways occur and that, on each side of the transition point, there may be a conditionwhere the lower zone consists of a mixture of both species of particles, the proportion ofheavy particles becoming progressively smaller as the velocity is increased. This situation,depicted in Figure 6.8b, can arise when, at a given fluidising velocity, there is a stabletwo-component bed which has a higher density than a bed composed of either of the twospecies on its own. Figure 6.10, taken from the work of EPSTEIN and PRUDEN(39), showshow the bed densities for the two mono-component layers change as the liquid velocity isincreased, with point C then defining the inversion point when complete segregation cantake place. Between points A and D (corresponding to velocities ucA and ucB), however,a two-component bed (represented by curve ABD) may be formed which has a densitygreater than that of either mono-component bed over this velocity range. In moving alongthis curve from A to D, the proportion of light particles in the lower layer decreasesprogressively from unity to zero, as shown on the top scale of the diagram. This proportion
1.00
0.75
0.50
d H/d
L
0.25
0.000.00 0.25 0.50
(rL−r)/(rH −r)
0.75 1.00
Inversionpossible
Hea
vier
at t
he to
p
(b)
d H/d
L
1.00
0.75
0.50
0.25
0.000.00 0.25 0.50
(rL−r)/(rH −r)
0.75 1.00
Inversionpossible
Hea
vier
at t
he to
p
(a)
Heavier at the bottom Heavier at the bottom
Increasing fluid velocity Increasing fluid velocity
Figure 6.9. The possibility of inversion (a) Stokes’ law region (b) Newton’s law region(38)

312 CHEMICAL ENGINEERING
Species L
Species H
A
B
C D
Small heavy particles (copper rH = 8800 kg/m3, d = 0.135 mm)Large light particles (zirconia rL = 3800 kg/m3, d = 0.7 mm)Fluidising liquid (water r = 1000 kg/m3, m = 1 mN s/m2)Volume fraction xH = CH /(CH + CL) = 0.4; xL = CL/(CH + C ) = 0.6
(ρb)max
ucA ucB ucC
Fluidising velocity uc (m/s)
ucD
(ρb)max
(kg/m3)
ρbL,ρbH
0
1000
2000
3000
4000
50000 0.2 0.4 0.6 0.8 1
0
CL/(CL + CH)
Figure 6.10. Bed densities as a function of fluidising velocity, showing the mixed particle region(39)
is equal to that in the total mix of solids at point B, where the whole bed is the of uniformcomposition, and the velocity ucB therefore represents the effective inversion velocity.
If the flow of fluidising liquid to a completely segregated bed is suddenly stopped,the particles will all then start to settle at a velocity equal to that at which they havebeen fluidised, because equation 6.31 is equally applicable to sedimentation and fluidis-ation.
Thus, since the voidages of the two beds will both be greater at higher fluidisationvelocities, the subsequent sedimentation velocity will then also be greater. Particles inboth beds will settle at the same velocity and segregation will be maintained. Eventually,two packed beds will be formed, one above the other. Thus, if the fluidising velocity isless than the transition velocity, a packed bed of large light particles will form above abed of small dense particles, and conversely, if the fluidising velocity is greater than theinversion velocity. Thus, fluidisation followed by sedimentation can provide a means offorming two completely segregated mono-component beds, the relative configuration ofwhich depends solely on the liquid velocity at which the particles have been fluidised.
6.2.4. Liquid and solids mixing
KRAMERS et al.(25) have studied longitudinal dispersion in the liquid in a fluidised bedcomposed of glass spheres of 0.5 mm and 1 mm diameter. A step change was introduced

FLUIDISATION 313
by feeding a normal solution of potassium chloride into the system. The concentration atthe top of the bed was measured as a function of time by means of a small conductivitycell. On the assumption that the flow pattern could be regarded as longitudinal diffusionsuperimposed on piston flow, an eddy longitudinal diffusivity was calculated. This wasfound to range from 10−4 to 10−3 m2/s, increasing with both voidage and particle size.
The movement of individual particles in a liquid–solid fluidised bed has been measuredby HANDLEY et al.(40) CARLOS(41,42), and LATIF(43). In all cases, the method involvedfluidising transparent particles in a liquid of the same refractive index so that the wholesystem became transparent. The movement of coloured tracer particles, whose otherphysical properties were identical to those of the bed particles, could then be followedphotographically.
Handley fluidised soda glass particles using methyl benzoate, and obtained data onthe flow pattern of the solids and the distribution of vertical velocity components ofthe particles. It was found that a bulk circulation of solids was superimposed on theirrandom movement. Particles normally tended to move upwards in the centre of the bedand downwards at the walls, following a circulation pattern which was less marked inregions remote from the distributor.
Carlos and Latif both fluidised glass particles in dimethyl phthalate. Data on themovement of the tracer particle, in the form of spatial co-ordinates as a function oftime, were used as direct input to a computer programmed to calculate vertical, radial,tangential and radial velocities of the particle as a function of location. When plottedas a histogram, the total velocity distribution was found to be of the same form as thatpredicted by the kinetic theory for the molecules in a gas. A typical result is shownin Figure 6.11(41). Effective diffusion or mixing coefficients for the particles were thencalculated from the product of the mean velocity and mean free path of the particles,using the simple kinetic theory.
Figure 6.11. Distribution of particle speeds in fluidised bed(41)
Solids mixing was also studied by CARLOS(42) in the same apparatus, starting with a bedcomposed of transparent particles and a layer of tracer particles at the base of the bed. Theconcentration of particles in a control zone was then determined at various intervals of time

314 CHEMICAL ENGINEERING
after the commencement of fluidisation. The mixing process was described by a diffusion-type equation. This was then used to calculate the mixing coefficient. A comparison ofthe values of mixing coefficient obtained by the two methods then enabled the persistenceof velocity factor to be calculated. A typical value of the mixing coefficient was 1.5 ×10⁻³ m2/s for 9 mm glass ballotini fluidised at a velocity of twice the minimum fluidisingvelocity.
LATIF(43) represented the circulation currents of the particles in a fluidised bed, byplotting stream functions for the particles on the assumption that the particles could beregarded as behaving as a continuum. A typical result for the fluidisation of 6-mm glassparticles by dimethyl phthalate is shown in Figure 6.12; in this case the velocity has beenadjusted to give a bed voidage of 0·65. Because the bed is symmetrical about its axis, thepattern over only a radial slice is shown. It may be noted that the circulation patterns areconcentrated mainly in the lower portion of the bed, with particles moving upwards inthe centre and downwards at the walls. As the bed voidage is decreased, the circulationpatterns tend to occupy progressively smaller portions of the bed, but there is a tendencyfor a small reverse circulation pattern to develop in the upper regions of the bed.
Figure 6.12. Particle stream functions, ψ(e = 0.65) (Radial position is expressed as fraction of radial distancefrom centre line, and axial position as fraction of bed height measured from the bottom)(43)

FLUIDISATION 315
Later work on axial dispersion of particles has been carried out by DORGELO et al. (44)
who used an random-walk approach.
6.3. GAS–SOLIDS SYSTEMS
6.3.1. General behaviour
In general, the behaviour of gas-fluidised systems is considerably more complex than thatof liquid-fluidised systems which exhibit a gradual transition from fixed bed to fluidisedbed followed by particle transport, without a series of transition regions, and with bedexpansion and pressure drop conforming reasonably closely to values calculated for idealsystems.
Part of the complication with gas–solid systems arises from the fact that the purelyhydrodynamic forces acting on the particles are relatively small compared with frictionalforces between particles, electrostatic forces and surface forces which play a much moredominant role when the particles are very fine. As the gas velocity in a fluidised bed isincreased, the system tends to go through various stages:
(a) Fixed bed in which the particles remain in contact with one another and the structureof the bed remains stable until the velocity is increased to the point where thepressure drop is equal to the weight per unit area of the particles.
(b) Particulate and regular predictable expansion over a limited range of gas velocities.(c) A bubbling region characterised by a high proportion of the gas passing through
the bed as bubbles which cause rapid mixing in the dense particulate phase.(d) A turbulent chaotic region in which the gas bubbles tend to coalesce and lose their
identity.(e) A region where the dominant pattern is one of vertically upward transport of
particles , essentially gas–solids transport or pneumatic conveying. This condition,sometimes referred to as fast fluidisation, lies outside the range of true fluidisation.
6.3.2. Particulate fluidisation
Although fine particles generally form fluidised beds more readily than coarse particles,surface-related forces tend to predominate with very fine particles. It is very difficult tofluidise some very fine particles as they tend to form large stable conglommerates thatare almost entirely by-passed by the gas. In some extreme cases, particularly with smalldiameter beds, the whole of the particulate mass may be lifted as a solid ‘piston’. Theuniformity of the fluidised bed is often critically influenced by the characteristics of thegas distributor or bed support. Fine mesh distributors are generally to be preferred to aseries of nozzles at the base of the bed, although the former are generally more difficultto install in larger beds because they are less robust.
Good distribution of gas over the whole cross-section of the bed may often be difficultto achieve, although this is enhanced by ensuring that the pressure drop across thedistributor is large compared with that across the bed of particles. In general, the qualityof gas distribution improves with increased flowrate because the pressure drop across the

316 CHEMICAL ENGINEERING
bed when it is fluidised is, theoretically, independent of the flowrate. The pressure dropacross the distributor will increase, however, approximately in proportion to the squareof the flowrate, and therefore the fraction of the total pressure drop that occurs across thedistributor increases rapidly as the flowrate increases.
Apart from the non-uniformities which characterise many gas–solid fluidised beds, it isin the low fluidising-velocity region that the behaviour of the gas–solid and liquid–solidbeds are most similar. At low gas rates the bed may exhibit a regular expansion as theflowrate increases, with the relation between fluidising velocity and voidage following theform of equation 6.31, although, in general, the values of the exponent n are higher thanthose for liquid-solids systems partly because particles have a tendency to form smallagglomerates thereby increasing the effective particle size. The range of velocities overwhich particulate expansion occurs is, however, quite narrow in most cases.
6.3.3. Bubbling fluidisation
The region of particulate fluidisation usually comes to an abrupt end as the gas velocityis increased, with the formation of gas bubbles. These bubbles are usually responsiblefor the flow of almost all of the gas in excess of that flowing at the minimum fluidisingvelocity. If bed expansion has occurred before bubbling commences, the excess gas willbe transferred to the bubbles whilst the continuous phase reverts to its voidage at theminimum fluidising velocity and, in this way, it contracts. Thus, the expanded bed appearsto be in a meta-stable condition which is analogous to that of a supersaturated solutionreverting to its saturated concentration when fed with small seed crystals, with the excesssolute being deposited on to the seed crystals which then increase in size as a result, asdiscussed in Chapter 15.
The upper limit of gas velocity for particulate expansion is termed the minimumbubbling velocity, umb. Determining this can present difficulties as its value may dependon the nature of the distributor, on the presence of even tiny obstructions in the bed, andeven on the immediate pre-history of the bed. The ratio umb/umf , which gives a measureof the degree of expansion which may be effected, usually has a high value for fine lightparticles and a low value for large dense particles.
For cracker catalyst (d = 55 µm, density = 950 kg/m3) fluidised by air, values ofumb/umf of up to 2.8 have been found by DAVIES and RICHARDSON(45). During the courseof this work it was found that there is a minimum size of bubble which is stable. Smallbubbles injected into a non-bubbling bed tend to become assimilated in the dense phase,whilst, on the other hand, larger bubbles tend to grow at the expense of the gas flow inthe dense phase. If a bubble larger than the critical size is injected into an expanded bed,the bed will initially expand by an amount equal to the volume of the injected bubble.When, however, the bubble breaks the surface, the bed will fall back below the levelexisting before injection and will therefore have acquired a reduced voidage.
Thus, the bubbling region, which is an important feature of beds operating at gasvelocities in excess of the minimum fluidising velocity, is usually characterised by twophases — a continuous emulsion phase with a voidage approximately equal to that of abed at its minimum fluidising velocity, and a discontinous or bubble phase that accountsfor most of the excess flow of gas. This is sometimes referred to as the two-phase theoryof fluidisation.

FLUIDISATION 317
The bubbles exert a very strong influence on the flow pattern in the bed and providethe mechanisim for the high degree of mixing of solids which occurs. The properties andbehaviour of the bubbles are describe later in this Section.
When the gas flowrate is increased to a level at which the bubbles become very largeand unstable, the bubbles tend to lose their identity and the flow pattern changes to achaotic form without well-defined regions of high and low concentrations of particles.This is commonly described as the turbulent region which has, until fairly recently, beenthe subject of relatively few studies.
Categorisation of Solids
The ease with which a powder can be fluidised by a gas is highly dependent on theproperties of the particles. Whilst it is not possible to forecast just how a given powderwill fluidise without carrying out tests on a sample, it is possible to indicate some trends.In general, fine low density particles fluidise more evenly than large dense ones, providedthat they are not so small that the London–van der Waals attractive forces are greatenough for the particles to adhere together strongly. For very fine particles, these attractiveforces can be three or more orders of magnitude greater than their weight. Generally, themore nearly spherical the particles then the better they will fluidise. In this respect, longneedle-shaped particles are the most difficult to fluidise. Particles of mixed sizes willusually fluidise more evenly than those of a uniform size. Furthermore, the presence of asmall proportion of fines will frequently aid the fluidisation of coarse particles by coatingthem with a ‘lubricating’ layer.
In classifying particles into four groups, GELDART(46) has used the following criteria:
(a) Whether or not, as the gas flowrate is increased, the fluidised bed will expandsignificantly before bubbling takes place. This property may be quantified by theratio umb/umf , where umb is the minimum velocity at which bubbling occurs. Thisassessment can only be qualitative as the value of umb is very critically dependenton the conditions under which it is measured.
(b) Whether the rising velocity of the majority of the bubbles, is greater or less than theinterstitial gas velocity. The significance of this factor is discussed in Section 6.3.5.
(c) Whether the adhesive forces between particles are so great that the bed tendsto channel rather than to fluidise. Channelling depends on a number of factors,including the degree to which the bed has consolidated and the condition of thesurface of the particles at the time. With powders that channel badly, it is sometimespossible to initiate fluidisation by mechanical stirring, as discussed in Section 6.3.4.
The classes into which powders are grouped are given in Table 6.1, which is takenfrom the work of GELDART(46), and in Figure 6.13. In they are located approximately ona particle density–particle size chart.
The Effect of Pressure
The effect of pressure on the behaviour of the bed is important because many industrialprocesses, including fluidised bed combustion which is discussed in Section 6.8.4., are

318 CHEMICAL ENGINEERING
Table 6.1. Categorisation of Powders in Relation to Fluidisation Characteristics(46)
Typical particle Fluidisation/Powder Examples ofsize (µm) Characteristics Materials
Group A 30–100 Particulate expansion of bedwill take place oversignificant velocity range.Small particle size andlow density(ρ, <1400 kg/m3).
Cracker catalyst
Group B 100–800 Bubbling occurs at velocity>umf . Most bubbleshave velocities greaterthan interstitial gasvelocity. No evidence ofmaximum bubble size.
Sand.
Group C 20 Fine cohesive powders, Flourdifficult to fluidise andreadily form channels.
Fine silica
Group D 1000 All but largest bubbles rise Wheatat velocities less thaninterstitial gas velocity.Can be made to formspouted beds. Particleslarge and dense.
Metal shot
700060005000
4000
3000
2000
1000
500
200
20 50 100 200 500 1000
Group D
Group B
Group A
Group C
Mean particle size (µm)
Den
sity
diff
eren
ce r
s−r (
kg/m
3 )
Figure 6.13. Powder classification diagram for fluidisation by air at ambient conditions(46)

FLUIDISATION 319
carried out at elevated pressures. Several workers have reported measurements of bedexpansion as a function of gas rate for elevated pressures when very much higher valuesof the ratio umb/umf may be obtained(17,47,48,49).
Because minimum fluidising velocity is not very sensitive to the pressure in the bed,much greater mass flowrates of gas may be obtained by increasing the operating pressure.
The influence of pressure, over the range 100–1600 kN/m2, on the fluidisation of threegrades of sand in the particle size range 0.3 to 1 mm has been studied by OLOWSON andALMSTEDT(50) and it was showed that the minimum fluidising velocity became less as thepressure was increased. The effect, most marked with the coarse solids, was in agreementwith that predicted by standard relations such as equation 6.14. For fine particles, theminimum fluidising velocity is independent of gas density (equation 6.5 with ρs >> ρ),and hence of pressure.
Tapered Beds
Where there is a wide range of particle sizes in the powder, fluidisation will be moreeven in a bed that is tapered so as to provide the minimum cross-section at the bottom.If the pressure gradient is low and the gas does not therefore expand significantly, thevelocity will decrease in the direction of flow. Coarse particles which will then tend tobecome fluidised near the bottom of the bed assist in the dispersion of the fluidising gas.At the same time, the carry-over of fines from the top will be reduced because of thelower velocity at the exit.
When deep beds of solids are fluidised by a gas, the use of a tapered bed can counter-balance the effects of gas expansion. For example, the pressure drop over a 5 m deep bedof solids of density 4000 kg/m3 is about 105 N/m2. Thus, with atmospheric pressure at theoutlet, the volumetric flowrate will double from the bottom to the top of an isothermalcylindrical bed. If the area at the outlet is twice that at the base, the velocity will bemaintained approximately constant throughout.
The Effect of Magnetic and Electrical Fields
Magnetic particles may form much more stable beds when subjected to a magnetic field.SAXENA and SHRIVASTAVA(51) have examined the complex behaviour of spherical steelparticles of a range of sizes when subjected to fields of different strengths, considering inparticular the bed pressure drop, the quality of fluidisation and the structure of the surfaceof the bed.
Dielectric particles show a reduced tendency for bubbling and a larger range of veloc-ities over which particulate expansion occurs when an alternating electrical field is applied.
The Effect of Baffles
It is possible substantially to eliminate the fluctuations which are characteristic of bedsof coarse solids by incorporating baffles into the bed. The nature and arrangement ofthe baffles is critical, and it is generally desirable to avoid downward-facing horizontalsurfaces because these can give rise to regimes of defluidisation by blocking the upward

320 CHEMICAL ENGINEERING
flow of gas. For this reason, horizontal tubes immersed in a fluidised bed tend to exhibitlow values of heat transfer coefficients because of the partial defluidisation that occurs.
6.3.4. The effect of stirring
Stirring can be effective in improving the quality of fluidisation. In particular, if theagitator blades lift the particles as they rotate, fluidisation can be effected at somewhatlower gas velocities. In addition, the fluidisation of very fine particles that tend to aggregatecan be substantially improved by a slow stirrer fitted with blades that provide only a smallclearance at the gas distributor. GODARD and RICHARDSON(52) found that it was possibleto fluidise fine silica particles (d = 0.05 µm) only if the stirrer was situated less than10 mm from the support. In the absence of stirring, the fluidising gas passed throughchannels in the bed and the solids were completely unfluidised. Once fluidisation hadbeen established, the stirrer could be stopped and uniform fluidisation would then bemaintained indefinitely. With such fine solids, a high degree of bed expansion could beachieved with umb/umf ratios up to 18. Over this range, equation 6.31 is followed witha value of n ranging from 6.7 to 7.5 as compared with a value of 3.7 calculated fromequation 6.32 for a liquid at the same value of the Galileo number.
The rotation of a paddle in a fluidised bed provides a means of measuring an effectiveviscosity of the bed in terms of the torque required to rotate the paddle at a controlledspeed(53).
6.3.5. Properties of bubbles in the bed
The formation of bubbles at orifices in a fluidised bed, including measurement of theirsize, the conditions under which they will coalesce with one another, and their rate ofrise in the bed has been investigated. DAVIDSON et al.(54) injected air from an orifice into afluidised bed composed of particles of sand (0.3–0.5 mm) and glass ballotini (0.15 mm)fluidised by air at a velocity just above the minimum required for fluidisation. By varyingthe depth of the injection point from the free surface, it was shown that the injected bubblerises through the bed with a constant velocity, which is dependent only on the volumeof the bubble. In addition, this velocity of rise corresponds with that of a spherical capbubble in an inviscid liquid of zero surface tension, as determined from the equation ofDAVIES and TAYLOR(55):
ub = 0.792V1/6B g1/2 (6.45)
The velocity of rise is independent of the velocity of the fluidising air and of the propertiesof the particles making up the bed. Equation 6.45 is applicable provided that the densityof the gas in the bubbles may be neglected in comparison with the density of the solids.In other cases, the expression must be multiplied by a factor of (1 − ρ/ρc)
1/2.HARRISON et al.(18) applied these results to the problem of explaining why gas and liquid
fluidised systems behave differently. Photographs of bubbles in beds of lead shot fluidisedwith air and with water have shown that an injected bubble is stable in the former casethough it tends to collapse in the latter. The water–lead system tends to give rise toinhomogeneities, and it is therefore interesting to note that bubbles as such are apparently

FLUIDISATION 321
not stable. As the bubble rises in a bed, internal circulation currents are set up becauseof the shear stresses existing at the boundary of the bubble. These circulation velocitiesare of the same order of magnitude as the rising velocity of the bubble. If the circulationvelocity is appreciably greater than the falling velocity of the particles, the bubble willtend to draw in particles at the wake and will therefore be destroyed. On the other hand,if the rising velocity is lower, particles will not be drawn in at the wake and the bubblewill be stable.
As a first approximation, a bubble is assumed to be stable if its rising velocity is lessthan the free-falling velocity of the particles, and therefore, for any system, the limitingsize of stable bubble may be calculated using equation 6.45. If this is of the same order ofsize as the particle diameter, the bubble will not readily be detected. On the other hand, if itis more than about ten times the particle diameter, it will be visible and the system will beseen to contain stable bubbles. On the basis of this argument, large bubbles are generallystable in gases, whereas in liquids the largest size of stable bubble is comparable with thediameter of the particles. It should be possible to achieve fluidisation free of bubbles withvery light particles by using a gas of high density. LEUNG(48) succeeded in reaching thiscondition by fluidising hollow phenolic microballoons at pressures of about 4500 kN/m2.It was found possible to form stable bubbles with glycerine–water mixtures and lead shotof 0.77 mm particle size. This transitional region has also been studied by SIMPSON andRODGER(17).
HARRISON and LEUNG(56) have shown that the frequency of formation of bubbles at anorifice (size range 1.2–25 mm) is independent of the bed depth, the flowrate of gas andthe properties of the particles constituting the continuous phase, although the frequencyof formation depends on the injection rate of gas, tending to a frequency of 18–21 s−1
at high flowrates.In a further paper(57), it has been shown that a wake extends for about 1.1 bubble
diameters behind each rising bubble. If a second bubble follows in this wake, its velocityis increased by an amount equal to the velocity of the leading bubble, and in this waycoalescence takes place.
The differences between liquid and gas fluidised systems have also been studied theoret-ically by JACKSON(2) who showed that small discontinuities tend to grow in a fluidisedbed, although the rate of growth is greater in a gas–solids system.
ROWE and WACE(58) and WACE and BURNETT(59) have examined the influence of gasbubbles on the flow of gas in their vicinity. By constructing a thin bed 300 mm wide,375 mm deep, and only 25 mm across, it was possible to take photographs through thePerspex wall, showing the behaviour of a thin filament of nitrogen dioxide gas injectedinto the bed. In a bed consisting of 0.20 mm ballotini, it was found that the filamenttended to be drawn towards a rising bubble, as shown in Figure 6.14, and through it ifsufficiently close. This establishes that there is a flow of gas from the continuous phaseinto the bubble and out through the roof of the bubble as shown in the figure, and thatthe gas tends to flow in definite streamlines. As a result, the gas is accelerated towardsthe bubble and is given a horizontal velocity component, and the gas velocity in thecontinuous phase close to the bubble is reduced.
In a bubbling bed, there is a tendency for the bubbles to form ‘chains’ and for successivebubbles to follow a similar track, thus creating a relatively low-resistance path for the gasflow. The bubbles are usually considerably larger at the top than at the bottom of the bed,
322 CHEMICAL ENGINEERING
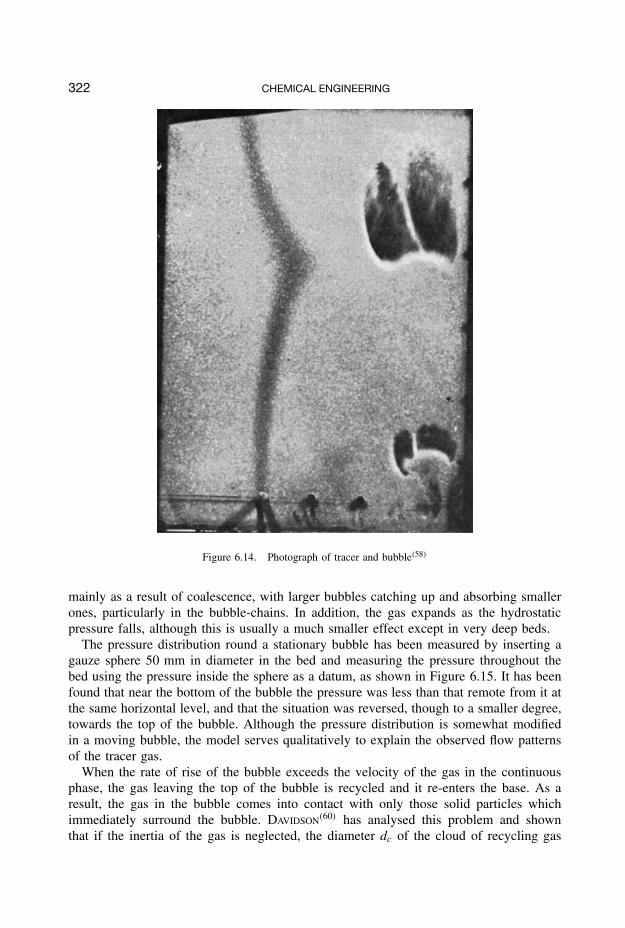
Figure 6.14. Photograph of tracer and bubble(58)
mainly as a result of coalescence, with larger bubbles catching up and absorbing smallerones, particularly in the bubble-chains. In addition, the gas expands as the hydrostaticpressure falls, although this is usually a much smaller effect except in very deep beds.
The pressure distribution round a stationary bubble has been measured by inserting agauze sphere 50 mm in diameter in the bed and measuring the pressure throughout thebed using the pressure inside the sphere as a datum, as shown in Figure 6.15. It has beenfound that near the bottom of the bubble the pressure was less than that remote from it atthe same horizontal level, and that the situation was reversed, though to a smaller degree,towards the top of the bubble. Although the pressure distribution is somewhat modifiedin a moving bubble, the model serves qualitatively to explain the observed flow patternsof the tracer gas.
When the rate of rise of the bubble exceeds the velocity of the gas in the continuousphase, the gas leaving the top of the bubble is recycled and it re-enters the base. As aresult, the gas in the bubble comes into contact with only those solid particles whichimmediately surround the bubble. DAVIDSON(60) has analysed this problem and shownthat if the inertia of the gas is neglected, the diameter dc of the cloud of recycling gas

FLUIDISATION 323
Figure 6.15. Isobars round a gauze sphere in a bed of mixed sand(58)
surrounding a bubble of diameter db is given by:
dc
db
=(
α + 2
α − 1
)1/3
(6.46)
where α is the ratio of the linear velocity of the gas in the bubble to that in the emulsionphase, that is:
α = e
(ub
uc
)(6.47)
The corresponding expression for a thin, essentially two-dimensional, bed is:
dc
db
=(
α + 2
α − 1
)1/2
(6.48)
ROWE, PARTRIDGE, and LYALL(61) have studied the behaviour of the cloud surroundinga bubble by using nitrogen dioxide gas as a tracer, and found that Davidson’s theoryconsistently overestimated the size of the cloud. A more sophisticated theory, developed byMURRAY(3), predicted the observed size of the cloud much more closely over forward face,although neither theory satisfactorily represented conditions in the wake of bubble. Thegas cloud was found to break off at intervals, and the gas so detached became dispersed inthe emulsion phase. In addition, it was shown by X-ray photographs that the bubbles wouldfrom time to time become split by fingers of particles falling through the roof of the bubble.

324 CHEMICAL ENGINEERING
In most practical gas–solid systems, the particles are fine and the rising velocities of theindividual bubbles are considerably greater than the velocity of the gas in the continuousphase. Thus, α in equation 6.47 is considerably greater than unity. Furthermore, thebubbles will tend to flow in well-defined paths at velocities considerably in excess ofthe rising velocity of individual bubbles. The whole pattern is, in practice, very complexbecause of the large number of bubbles present simultaneously, and also because of thesize range of the bubbles.
The work of ROWE and HENWOOD(62) on the drag force exerted by a fluid on a particle,discussed in Chapter 5, showed why a bubble tended to be stable during its rise. Surfacescontaining particles that face downstream, corresponding to the bottom of a bubble, tend toexpel particles and are therefore diffuse. Surfaces facing upstream tend to attract particlesand thus the top surface of a bubble will be sharp. Particles in a close-packed array werefound to be subjected to a force 68.5 times greater than that on an isolated particle for thesame relative velocity. It should therefore be possible to evaluate the minimum fluidisingvelocity as the fluid velocity at which the drag force acting on a single isolated particlewould be equal to 1/68.5 of its buoyant weight. Values calculated on this basis agree wellwith experimental determinations. A similar method of calculating minimum fluidisingvelocities has also been proposed by DAVIES(45) who gives a mean value of 71.3 insteadof 68.5 for the drag force factor.
From Figure 6.4 it is seen that for emf = 0.40, u0/umf is about 78 at low values of theGalileo number and about 9 for high values. In the first case, the drag on the particle isdirectly proportional to velocity and in the latter case proportional to the square of thevelocity. Thus the force on a particle in a fluidised bed of voidage 0.4 is about 80 timesthat on an isolated particle for the same velocity.
6.3.6. Turbulent fluidisation
The upper limit of velocity for a bubbling fluidised bed is reached when the bubblesbecome so large that they are unstable and break down and merge with the continuousphase to give a highly turbulent chaotic type of flow. Pressure fluctuations become lessviolent and the bed is no longer influenced by the effect of large bubbles bursting atthe surface, thereby causing a sudden reduction of the inventory of gas within the bed.The transition point occurs at a flowrate at which the standard deviation of the pressurefluctuations reaches a maximum. This occurs where gas bubbles occupy roughly half ofthe total volume of the bed, a value which corresponds to very much more than half of theoverall volumetric flow because, for beds composed of fine particles, the velocity of rise ofthe bubbles is much greater than the interstitial velocity of the gas in the continuous phase.The breakdown of the bubbles tends to occur when they reach a maximum sustainablesize which is often reached as a result of coalescence. This may frequently occur when afollowing bubble is drawn into the wake of a bubble that is already close to its maximumstable size.
The turbulent region has been the subject of comparatively few studies until recentyears. A comprehensive critical review of the present state of knowledge has beenpresented by BI, ELLIS, ABBA and GRACE(63) who emphasise the apparent inconsistenciesbetween the experimental results and correlations of different workers. Bi et al. define the

FLUIDISATION 325
regime of turbulent fluidisation as ‘that in which there is no clear continuous phase, but,instead, either, via intermittency or by interspersing voids and dense regions, a competitionbetween dense and dilute phases takes place in which neither gains the ascendancy’.
The onset of turbulent fluidisation appears to be almost independent of bed height, orheight at the minimum fluidisation velocity, if this condition is sufficiently well defined.It is, however, strongly influenced by the bed diameter which clearly imposes a maximumon the size of the bubble which can form. The critical fluidising velocity tends to becomesmaller as the column diameter and gas density, and hence pressure, increase. Particle sizedistribution appears to assert a strong influence on the transition velocity. With particlesof wide size distributions, pressure fluctuations in the bed are smaller and the transitionvelocity tends to be lower.
As already noted, the onset of the turbulent region seems to occur at the superficialgas velocity at which the standard deviation of the fluctuations of local pressure in thebed is a maximum. It may also be identified by an abrupt change in the degree of bedexpansion as the fluidising velocity is increased. Both of these methods give results thatare in reasonable accord with visual observations. Measurements based on differentialpressures in the bed, rather than on point values, tend to give higher values for thetransition velocity. Thus, BI and GRACE(64) give the following correlations for the Reynoldsnumber at the commencement of turbulent fluidisation, Rec, in terms of the Galileo (orArchimedes) number Ga of the gas–solids system. The Reynolds number is based on a‘mean’ particle diameter and the superficial velocity of the fluidising gas. The correlations(based, respectively, on differential pressures and on point values) take the form:
Rec = 1.24Ga0.447 (6.49)
and: Rec = 0.56Ga0.461 (6.50)
Equations 6.49 and 6.50 should be used with caution in view of the not inconsiderablescatter of the experimental data.
The upper boundary of the turbulent region, based on velocity, is set by the conditionat which particle entrainment increases so rapidly as to give rise to what is essentiallya gas–solids transport system, sometimes referred to as fast-fluidisation. There is nosharp transition because entrainment is always occurring once the gas velocity exceedsthe terminal falling velocity of the smallest particles though, in the bubbling region inparticular, a high proportion of the particles may still be retained in the bed at highsuperficial velocities because these do not necessarily ‘see’ the high proportion of the gaswhich rises in the bubbles.
Because of the complex flow pattern, it is not generally possible to determine visuallythe velocity at which the system ceases, in effect, to be a fluidised bed. From measurementsof pressure fluctuations, the following approximate relation may be used, although withconsiderable care:
Rec ≈ 2Ga0.45 (6.51)
It may be seen by comparison with equations 6.49 and 6.50 that the turbulent fluidisedbed region covers an approximately 2–4 fold range of fluidising velocities.