chapter 6 housing - newburyport ma · chapter 6 housing. over the past ... inadequate housing...
TRANSCRIPT

Master Plan
2016 Master Plan Housing City of Newburyport, Massachusetts Page H - 1
Chapter 6 Housing
Over the past several decades, Newburyport has become an extremely desirable place to call home. With its vibrant and historic downtown, its location along the Merrimack River and its excellent highway and rail access, the City is an appealing community in which to live. Newburyport has long attracted affluent individuals and families into the community, which has caused both housing and land prices to rise and the amount of developable land to decrease. Home prices and rental costs have risen while the number of rental units and the availability of affordable housing have gone down. There are few opportunities for first-time homebuyers and many City residents have been forced to move to neighboring communities in search of housing that is affordable. The City of Newburyport has an obligation to ensure that the people who currently live and work here, including our senior community and young families, can continue to afford to live here. The current inadequate housing supply, lack of housing options and escalating rents and home prices are causing displacement. Furthermore, the salaries of the people who provide services to the local community, i.e. teachers, City workers, health care providers and others are not sufficient to meet the current costs of housing. This chapter seeks to ensure that the diversity of the City’s housing stock is enhanced and preserved through the construction of a variety of housing types including single-, two-, and multi-family homes that will provide a variety of housing options to the community, to first time home buyers, to the elderly population, and for current residents who want to stay in their community as housing prices continue to rise. Additionally, this chapter seeks to support economic diversity through the development of housing that accommodates the workforce at all wage levels that supports Newburyport’s businesses. Accomplishing this will include supporting the work of the Newburyport Affordable Housing Trust and its efforts to implement the City’s Housing Production Plan, which was released in March 2013. It also includes the employment of a variety of strategies to help the City meet or exceed its goal of having 10 percent of the total housing stock be affordable. Newburyport is also home to several individuals and families who lack a regular, fixed place to live. An initial attempt to address the needs of these homeless households is included in this chapter with a focus on engaging the community in a dialog regarding the cause of homelessness and possible solutions, as well as supporting local non-profit organizations currently providing aid and assistance to homeless households and those households that are at risk of becoming homeless. The City must be proactive in bringing about choices to ensure a broad spectrum of options of housing types and costs. Otherwise, the community will suffer from lack of diversity, negatively impacting the economic, social and cultural well-being. In keeping with Newburyport’s Vision of sustainability, these housing choices must be compatible with protection of natural resources, preservation of open space, and should enhance and blend into existing neighborhoods and the fabric of the community.
Master Plan
2016 Master Plan Housing City of Newburyport, Massachusetts Page H - 2
Section A: Existing Conditions There is a nexus between the City’s population and its housing needs. It is only by understanding Newburyport’s demographics and changes within the community, can the City determine the current and future housing needs of its citizenry. Newburyport’s Population Trends
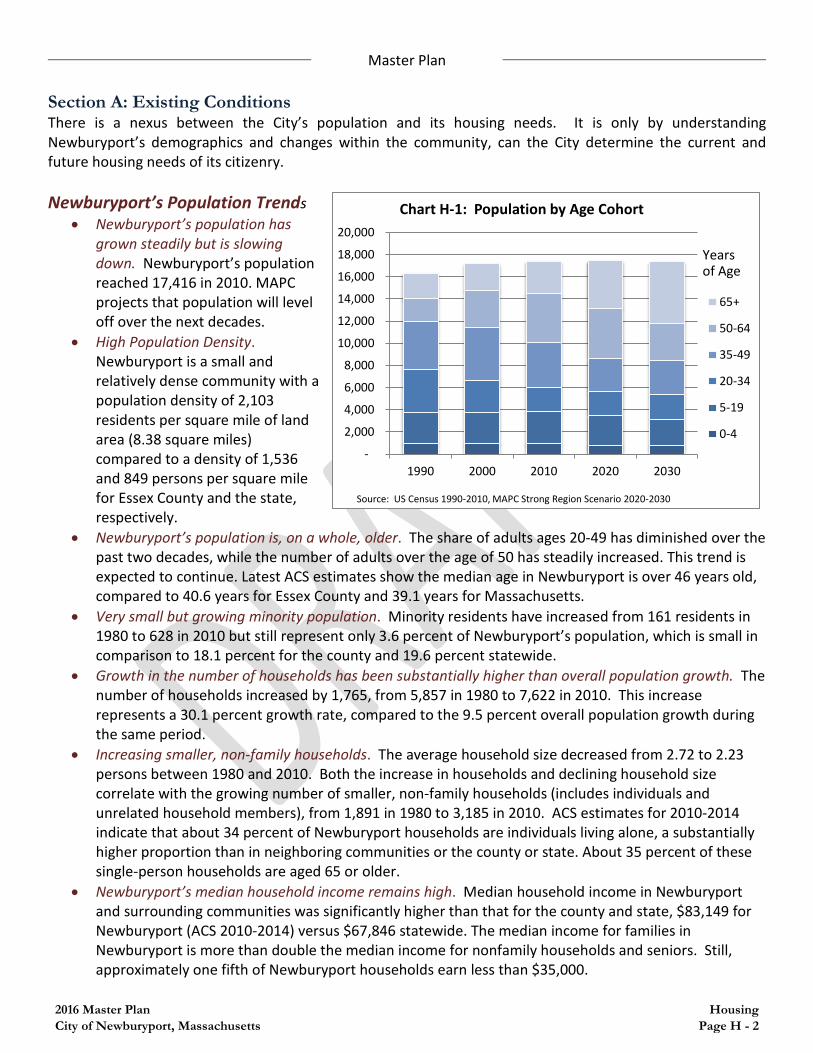
• Newburyport’s population has grown steadily but is slowing down. Newburyport’s population reached 17,416 in 2010. MAPC projects that population will level off over the next decades.
• High Population Density. Newburyport is a small and relatively dense community with a population density of 2,103 residents per square mile of land area (8.38 square miles) compared to a density of 1,536 and 849 persons per square mile for Essex County and the state, respectively.
• Newburyport’s population is, on a whole, older. The share of adults ages 20-49 has diminished over the past two decades, while the number of adults over the age of 50 has steadily increased. This trend is expected to continue. Latest ACS estimates show the median age in Newburyport is over 46 years old, compared to 40.6 years for Essex County and 39.1 years for Massachusetts.
• Very small but growing minority population. Minority residents have increased from 161 residents in 1980 to 628 in 2010 but still represent only 3.6 percent of Newburyport’s population, which is small in comparison to 18.1 percent for the county and 19.6 percent statewide.
• Growth in the number of households has been substantially higher than overall population growth. The number of households increased by 1,765, from 5,857 in 1980 to 7,622 in 2010. This increase represents a 30.1 percent growth rate, compared to the 9.5 percent overall population growth during the same period.
• Increasing smaller, non-family households. The average household size decreased from 2.72 to 2.23 persons between 1980 and 2010. Both the increase in households and declining household size correlate with the growing number of smaller, non-family households (includes individuals and unrelated household members), from 1,891 in 1980 to 3,185 in 2010. ACS estimates for 2010-2014 indicate that about 34 percent of Newburyport households are individuals living alone, a substantially higher proportion than in neighboring communities or the county or state. About 35 percent of these single-person households are aged 65 or older.
• Newburyport’s median household income remains high. Median household income in Newburyport and surrounding communities was significantly higher than that for the county and state, $83,149 for Newburyport (ACS 2010-2014) versus $67,846 statewide. The median income for families in Newburyport is more than double the median income for nonfamily households and seniors. Still, approximately one fifth of Newburyport households earn less than $35,000.
-
2,000
4,000
6,000
8,000
10,000
12,000
14,000
16,000
18,000
20,000
1990 2000 2010 2020 2030
Chart H-1: Population by Age Cohort
65+
50-64
35-49
20-34
5-19
0-4
Source: US Census 1990-2010, MAPC Strong Region Scenario 2020-2030
Years of Age
Master Plan
2016 Master Plan Housing City of Newburyport, Massachusetts Page H - 3
• Recent estimates suggest that poverty levels have increased. US Census and ACS estimates indicate that the proportion of individuals living in poverty in Newburyport increased from 5.2 percent in 2000 to 7.4 percent, increasing from 877 to 1,290 residents. The poverty level is highest among children, with an estimated 9.2 percent of Newburyport children living in poverty by latest estimates.
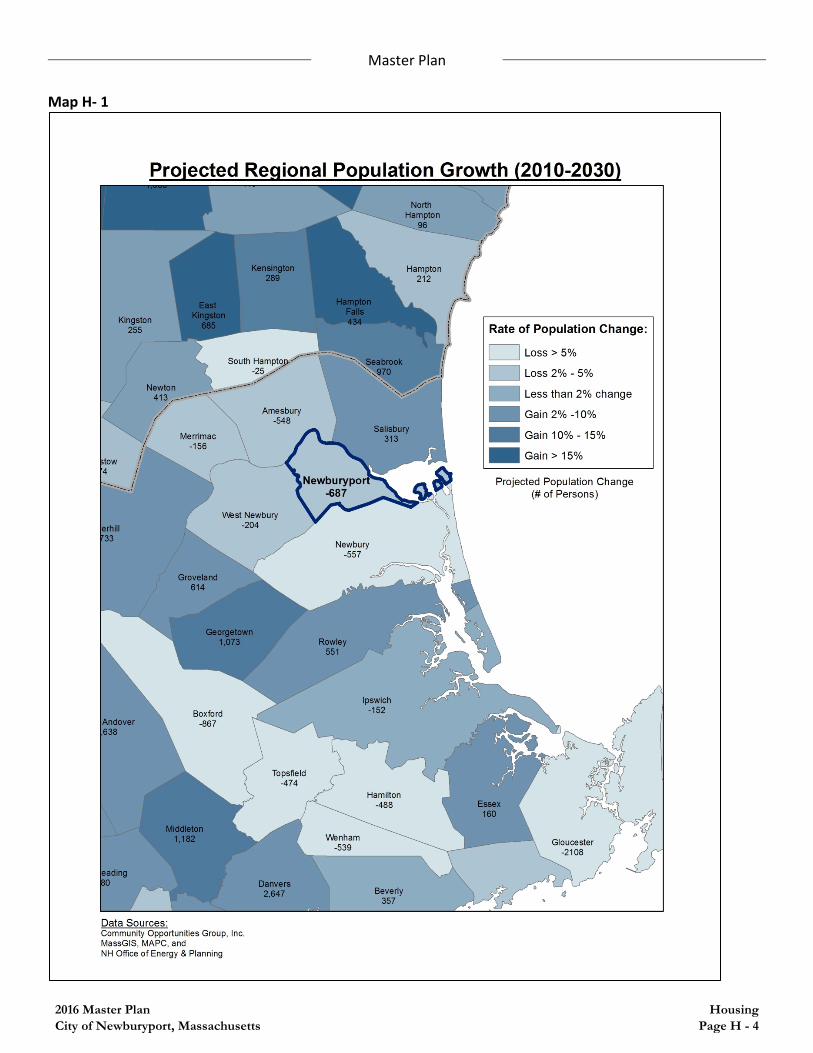
• Newburyport’s population is expected to decline by 3.9 percent over the next 15 years. Along with many communities in the surrounding region, Newburyport is expected to lose population between 2010 and 2030, according to MAPC’s “Status Quo” population projections which assume a continuation of historic development trends. Under MAPC’s “Strong Region” scenario which assumes greater housing and economic growth, Newburyport is expected to maintain the same population in 2030 as it had in 2010.
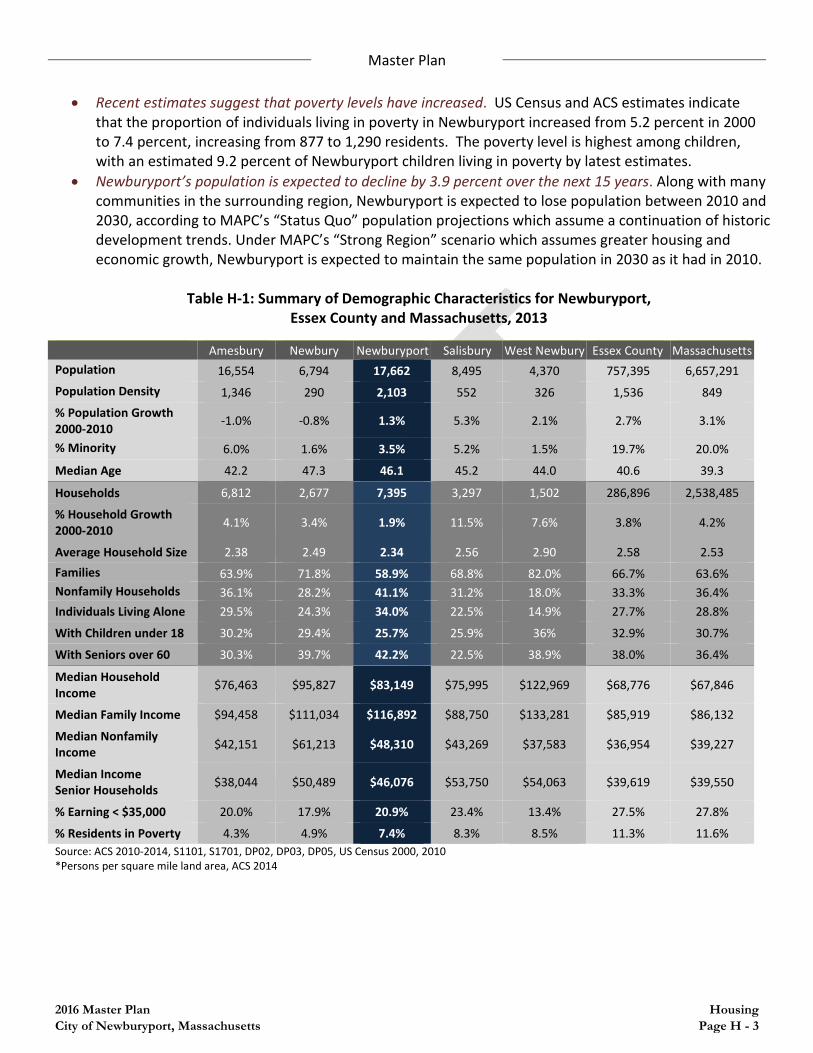
Table H-1: Summary of Demographic Characteristics for Newburyport,
Essex County and Massachusetts, 2013
Amesbury Newbury Newburyport Salisbury West Newbury Essex County Massachusetts Population 16,554 6,794 17,662 8,495 4,370 757,395 6,657,291 Population Density 1,346 290 2,103 552 326 1,536 849 % Population Growth 2000-2010 -1.0% -0.8% 1.3% 5.3% 2.1% 2.7% 3.1%
% Minority 6.0% 1.6% 3.5% 5.2% 1.5% 19.7% 20.0%
Median Age 42.2 47.3 46.1 45.2 44.0 40.6 39.3
Households 6,812 2,677 7,395 3,297 1,502 286,896 2,538,485
% Household Growth 2000-2010 4.1% 3.4% 1.9% 11.5% 7.6% 3.8% 4.2%
Average Household Size 2.38 2.49 2.34 2.56 2.90 2.58 2.53 Families 63.9% 71.8% 58.9% 68.8% 82.0% 66.7% 63.6% Nonfamily Households 36.1% 28.2% 41.1% 31.2% 18.0% 33.3% 36.4% Individuals Living Alone 29.5% 24.3% 34.0% 22.5% 14.9% 27.7% 28.8%
With Children under 18 30.2% 29.4% 25.7% 25.9% 36% 32.9% 30.7%
With Seniors over 60 30.3% 39.7% 42.2% 22.5% 38.9% 38.0% 36.4%
Median Household Income $76,463 $95,827 $83,149 $75,995 $122,969 $68,776 $67,846
Median Family Income $94,458 $111,034 $116,892 $88,750 $133,281 $85,919 $86,132
Median Nonfamily Income $42,151 $61,213 $48,310 $43,269 $37,583 $36,954 $39,227
Median Income Senior Households $38,044 $50,489 $46,076 $53,750 $54,063 $39,619 $39,550
% Earning < $35,000 20.0% 17.9% 20.9% 23.4% 13.4% 27.5% 27.8%
% Residents in Poverty 4.3% 4.9% 7.4% 8.3% 8.5% 11.3% 11.6% Source: ACS 2010-2014, S1101, S1701, DP02, DP03, DP05, US Census 2000, 2010 *Persons per square mile land area, ACS 2014
Master Plan
2016 Master Plan Housing City of Newburyport, Massachusetts Page H - 4
Map H- 1
Master Plan
2016 Master Plan Housing City of Newburyport, Massachusetts Page H - 5
Newburyport’s Housing Trends • Housing growth has been steady, but modest. Newburyport added 475 housing units between 2000
and 2014, an average of 32 units per year. Amesbury and Salisbury permitted construction of more units over this period, averaging 40-50 units per year. Newburyport’s housing growth rate of 4.4 percent between 2000 and 2010 was lower than 6.8 percent for Essex County and 7.1 percent statewide. It should be noted that the teardown and replacement of the existing housing stock has been a factor in new housing growth.
• High level of owner-occupancy and declining rental stock. According to ACS 2010-2014 estimates, 71.6 percent of Newburyport’s housing stock was owner-occupied. Newburyport experienced a net loss of rental units over the past several decades, going from 2,464 rental units in 1980, or 38 percent of all occupied housing units, down to 2,172 units by 2010, representing only 28.5 percent of all units.
• Housing prices remain high despite the recent poor economic climate and slower market. ACS estimates (2010-2014) indicate that the median value of all owner-occupied homes is approximately $435,000, compared to $350,000 for Essex County and $330,000 statewide. Median sales price reflects the cost of housing for those who seek to become homeowners in Newburyport today. In addition to the high cost, the difficulty in securing financing remains a challenge, providing a significant constraint to those entering the housing market.
• Rental costs are increasing. The 2010 median rent was estimated by the Census Bureau to be $1,080 while the lowest rent advertised on Craigslist in February of 2015 was $875 for a one-bedroom unit and approximately $1,200 for a two-bedroom unit. Landlords also typically require first and last month’s rent up-front, plus a security deposit. A strong rental housing market has pushed going rents well beyond the means of many, including most low- and moderate-income individuals and families.
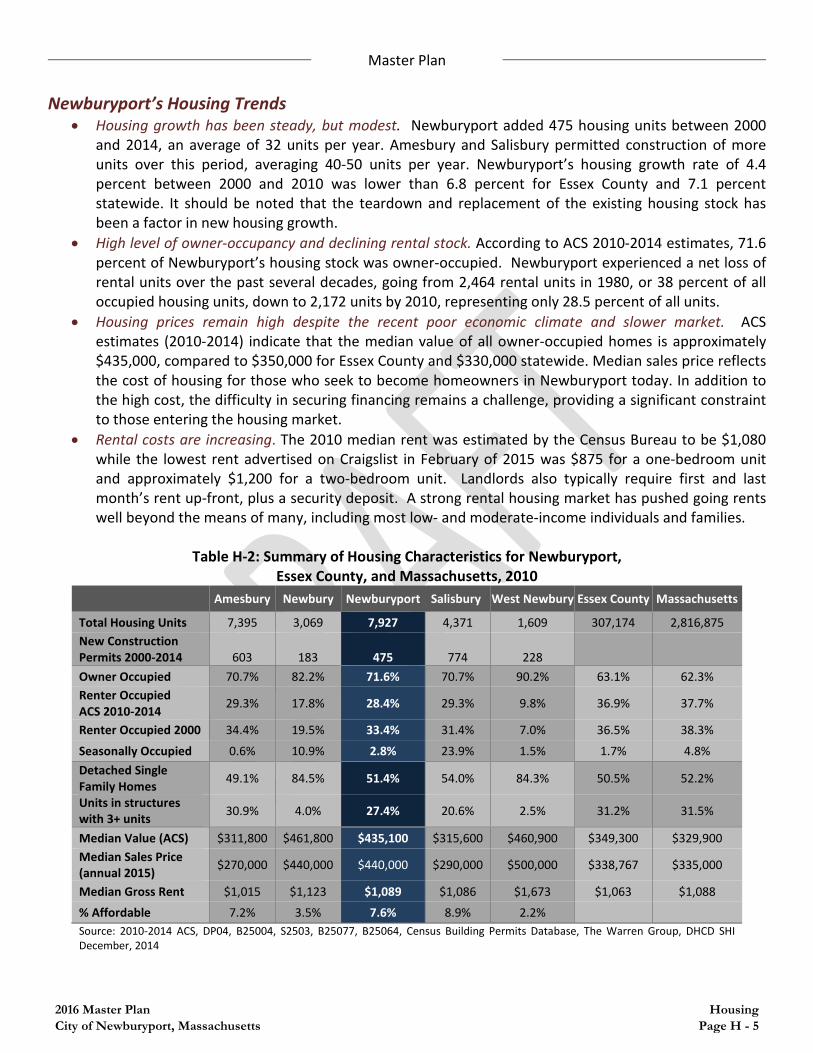
Table H-2: Summary of Housing Characteristics for Newburyport,
Essex County, and Massachusetts, 2010 Amesbury Newbury Newburyport Salisbury West Newbury Essex County Massachusetts
Total Housing Units 7,395 3,069 7,927 4,371 1,609 307,174 2,816,875 New Construction Permits 2000-2014 603 183 475 774 228
Owner Occupied 70.7% 82.2% 71.6% 70.7% 90.2% 63.1% 62.3% Renter Occupied ACS 2010-2014 29.3% 17.8% 28.4% 29.3% 9.8% 36.9% 37.7%
Renter Occupied 2000 34.4% 19.5% 33.4% 31.4% 7.0% 36.5% 38.3%
Seasonally Occupied 0.6% 10.9% 2.8% 23.9% 1.5% 1.7% 4.8% Detached Single Family Homes 49.1% 84.5% 51.4% 54.0% 84.3% 50.5% 52.2%
Units in structures with 3+ units 30.9% 4.0% 27.4% 20.6% 2.5% 31.2% 31.5%
Median Value (ACS) $311,800 $461,800 $435,100 $315,600 $460,900 $349,300 $329,900 Median Sales Price (annual 2015) $270,000 $440,000 $440,000 $290,000 $500,000 $338,767 $335,000
Median Gross Rent $1,015 $1,123 $1,089 $1,086 $1,673 $1,063 $1,088 % Affordable 7.2% 3.5% 7.6% 8.9% 2.2% Source: 2010-2014 ACS, DP04, B25004, S2503, B25077, B25064, Census Building Permits Database, The Warren Group, DHCD SHI December, 2014
Master Plan
2016 Master Plan Housing City of Newburyport, Massachusetts Page H - 6
The convergence of these trends – increasing numbers of households, more people living alone, high housing prices, lower housing production, declining supply of rentals, difficulty in obtaining financing, large up-front cash requirements for homeownership and rentals – all point to a growing affordability gap. ACS estimates (2010-2014) that counted 2,243 households or approximately 30 percent of all Newburyport households that were living in housing that was by common definition beyond their means and unaffordable (meaning, according to the U.S. Department of Housing and Urban Development, a household is spending more than 30 percent of its income on housing), up from about one-quarter of all households surveyed in 2005-2009. Among renters the rate of households spending more than they can afford on housing is nearly 40 percent.
Section B: Housing Snapshot
• There are approximately 7,100 residential properties in Newburyport. About 61 percent of the properties are single-family, 30 percent are condominium, and 9 percent are 2-3 family, multifamily, or other housing types.
• Most the housing built in the past century has been single-family, while the vast majority of multifamily, mixed use, or other alternative housing types were built before 1900. Most multifamily housing built after 1900 has been condominiums or specialized/subsidized housing (nursing homes, assisted living, rest homes, public housing, and nonprofit-owned).
• Despite the significant presence of historic structures in Newburyport, the median year built for all single family homes is 1950.
• Half of Newburyport’s condominiums are in multifamily or alternative housing structures that were built prior to 1939 and have been converted to condominiums, thereby reducing the stock of rental housing.
• Traditionally, the size and scale of Newburyport’s housing has been modest, but recent trends are changing this pattern. The average size living space for single family homes built prior to 1900 was about 2,000 square feet. Houses built during much of the 20th Century were smaller, with average sizes around 1,500. Sizes have increased substantially in recent decades, with an average of 2,700 square feet for houses built after 2000. Houses built prior to 1969 typically had lot sizes of less than 0.30 acres, while those built since 1980 average closer to 0.5 acres.
• Typically smaller than single family houses, condominiums are also increasing in average size. Unit size in structures built before 1939 averages around 1,300 square feet. Condominiums in structures built in the 1960’s and 70’s are considerably smaller, with average size well below 1,000 square feet. Unit sizes in recently constructed buildings are around 1,500 square feet.
• The average value for single family houses is $521,115, while the average for condominiums is $320,272. The quality of houses, as reflected by the average value per square foot, has remained fairly level for single family houses over all of the eras of construction, ranging between $258 and $302 per square foot. Condominiums, on the other hand, have seen considerable fluctuation in quality; units in buildings constructed during the 1960’s and 70’s have values per square foot of approximately $150 and an average unit value of $110,000, compared to condominiums built prior to 1939 or after 1980, in which value per square foot ranges from $245 to $268 and average unit values of $310,000-$411,000.
• The City’s rental housing inventory is primarily located in multifamily or other residential building types, including 2-3 family homes or lots with multiple structures, multifamily structures with 4+ units, mixed use structures, rooming houses, and specialized or subsidized housing developments. Many of these structures have been converted to condominiums, and very few have been built in over a century.

Master Plan
2016 Master Plan Housing City of Newburyport, Massachusetts Page H - 7
Table H-3: Residential Properties by Land Use
Use/Year Built # Average Lot Size (Acres) Average Value Average Living
Area (s.f.) Value per Square
Foot Single Family 4,334 0.29 $521,115
before 1900 1,423 0.22 $563,211 2,026 $278 1900-1939 524 0.21 $479,350 1,586 $302 1940-1949 194 0.23 $422,792 1,419 $298 1950-1959 400 0.23 $389,292 1,435 $271 1960-1969 510 0.30 $402,151 1,472 $273 1970-1979 237 0.28 $416,567 1,493 $279 1980-1989 374 0.47 $527,710 2,047 $258 1990-1999 360 0.49 $648,412 2,488 $261 after 2000 312 0.43 $748,498 2,706 $277
Condominiums 2,121 $320,272 before 1900 935 - $333,727 1,253 $266 1900-1939 121 - $313,660 1,278 $245 1940-1949 4 - $309,925 1,167 $266 1950-1959 9 - $267,444 1,119 $239 1960-1969 109 - $102,983 667 $154 1970-1979 156 - $110,141 740 $149 1980-1989 220 - $352,213 1,389 $254 1990-1999 170 - $411,298 1,536 $268 after 2000 397 - $377,452 1,504 $251
Other Residential # Median Year Built Two Family 325 1850 Three Family 59 1850 Multiple Houses on Single Lot 24 1880 Multi-family Apartments (4+ Units) 94 1850 Mixed-Use (Residential/Commercial) 69 1852 Rooming Houses 2 1844 Specialized/Subsidized Housing1 25 1967 Source: Vision Governmental Solutions, City of Newburyport Assessor’s Database, FY2016
Newburyport has a traditional development pattern in that the densest residential neighborhoods are located in and around the downtown core. Housing density is greatest in this area where single-, two-, and multi-family homes are located. Density generally lessens the further away from the downtown core you are, where minimum lot sizes increase from 8,000 square feet near downtown to 20,000 square feet west of Route 95. Plum Island is a fairly compact, densely developed neighborhood. In recent years, the City has seen the redevelopment of the Island’s “beach shacks” into larger single-family homes.
1 Includes nursing homes, assisted living, rest homes, public housing, and nonprofit-owned housing

Master Plan
2016 Master Plan Housing City of Newburyport, Massachusetts Page H - 8
Map H- 2: Newburyport Neighborhoods
Table H-4: Housing Structure Types by Neighborhood
Neighborhood Single Family Condominium Two
Family Three-Family
Multi-Family
Downtown 184 89 52 14 47 North End 1,754 211 144 27 30 South End 671 114 101 21 20 West End 871 0 2 0 0 Back Bay 83 24 7 3 2
Plum Island 443 9 19 0 1 Source: Vision Governmental Solutions, Newburyport’s Assessor’s Database as of December 31, 2014
Newburyport’s Housing Values, Costs and Affordability Value and costs continue to rise as the housing market slowly rebounds from the recession. The desire to live in Newburyport combined with the lack of land on which to build homes has kept home values high and the housing market strong despite economic fluctuation. Values are rising and median sales prices are increasing faster than the household incomes of renters and homeowners. While rental costs have not increased as dramatically as home prices, the median household income of renters did not change between 2000 and 2010, so the affordability gap widened considerably. The proportion of households (renters and homeowners paying more than what they could afford for housing (commonly defined as more than 30 percent of household income) grew from 27 percent in 2000 to 30 percent in 2010.

Master Plan
2016 Master Plan Housing City of Newburyport, Massachusetts Page H - 9
Table H-5: Change in Median Housing Costs and Median Income
2000 2010 Change 2000-2010 % Change
Median Gross Rent $764 $1,080 $316 41.4% Median Value Single Family Owner Occupied Units $253,600 $445,000 $191,400 75.5% Median Sales Price Single Family Homes $300,000 $415,250 $115,250 38.4% Median Household Income $58,215 $76,300 $18,085 31.1%
Renters $37,648 $37,658 $10 0.0% Homeowners $72,043 $100,290 $28,247 39.2%
Households with Housing Cost Burden 27.0% 30.4% 3.4% 12.6% Source: Census 2000, ACS 2010-2014
Chart H-2 shows that the total number of rental units has declined over the past 20 years, while the cost of renting has increased. ACS estimates the gross rent based on a sample of renters surveyed over a five year period, without indicating whether the rents were subsidized or discounted for any reason. No data is available on actual market rents in the region, however advertised rents for Newbury apartments currently range from $1200 to $2600.2
Table H-6 shows the rent that is affordable to households at various income levels. Over half of Newburyport’s renters earn less than $50,000 per year, which is approximately the income required to afford apartments at the lowest current market rents. About one third of renter households in the lowest income brackets are cost burdened, that is they spend between 30-50 percent of their income on housing. Those who spend more than 50 percent of their income on housing are considered to be severely cost burdened. In all, ACS identifies 824 renter households who spend more than they can afford on housing, virtually all of whom are low income households.
2 Craigslist, February 15, 2016
2,545 units 2,506 units
2,145 units
0
500
1000
1500
2000
2500
3000
1990 2000 2010
$1,500+
$1,000 - $1,499
$750 - $999
$500 - $749
$300 - $499
$200 - $299
Under $200
No Cash Rent
Chart H-2, Rental Units by Cost, 1990 - 2010
Source: US Census Bureau, Census 1990 and 2000 Summary File 3 and 2006-2010 American Community Survey

Master Plan
2016 Master Plan Housing City of Newburyport, Massachusetts Page H - 10
Table H-6: Rental Housing Demand by Income Threshold
Income Max. Affordable Gross Rent Renters % % Cost
Burdened % Severely Cost
Burdened <$35,000 $625 891 42.4% 31.5% 41.9% $35,000 – 49,999 $1,250 335 15.9% 32.2% 13.1% $50,000 - $74,999 $1,875 420 20.0% 10.0% 0.0% $75,000 - $99,999 $2,500 170 8.1% 0.0% 0.0% >$100,000 >$2,500 285 13.6% 0.0% 0.0% Total 2,101 100% 20.5% 19.8% Source: ACS 2010-2014, COG
Charts H-3 and H-4 demonstrate that housing values and prices have risen over the past two decades. Newburyport has added more than 2000 homes since 1990, and most homes are valued over $300,000, compared with less than a third of homes priced above this range in 2000. Table H-6 provides Warren Group data on median sales prices and number of sales from 1995 to the end of 2015, offering a long-range perspective on sales activity. This data is tracked through Multiple Listing Service information based on actual sales. Despite a few dips in the market, the median prices and numbers of sales of both single-family homes and condominiums have been on an upward trajectory in Newburyport.
Table H-7 below provides an estimate of the maximum purchase price for households within various income brackets. The majority of homeowners in Newburyport earn more than $100,000 per year, which is approximately the income required to purchase a median priced single family home in 2015. To purchase a median priced condominium in 2015 requires a household income of approximately $75,000. The proportion of renter households within incomes required to purchase homes is much smaller. Among current homeowners, there are many households in moderate income brackets as well as low income households who experience housing cost burden. More than half of homeowners who earn less than $50,000 per year spend more than 30 percent of their income on housing, with the lowest income households
3,338
4,068
5,409
0
1000
2000
3000
4000
5000
6000
1990 2000 2010
$1 million +
$500,000 to $999,999
$300,000 to $499,999
$200,000 to $299,999
$150,000 to $199,999
$100,000 to $149,999
$50,000 to $99,999
Less than $50,000
Chart H-3, Homeownership Units by Value, 1990 - 2010
Source: US Census Bureau, 1990 and 2000, Summary File 1 and US Census Bureau, 2006-2010 American Community Survey
0
100,000
200,000
300,000
400,000
500,000
600,000
1995 1997 1999 2001 2003 2005 2007 2009 2011 2013 2015
Single Family
Condominiums
Source: The Warren Group/Banker & Tradesman, February 5, 2016
Chart H-4, Median Sales Price, Newburyport 1995 - 2015

Master Plan
2016 Master Plan Housing City of Newburyport, Massachusetts Page H - 11
experiencing the most severe housing cost burden. In all, ACS identifies 1,263 homeowners who are either cost burdened or severely cost-burdened.
Table H-7: Housing Demand and Supply by Income Threshold
Income Max. Affordable Purchase Price* Owners % of
Owners % Cost Burdened
Households % Severely Cost
Burdened Households <$35,000 $115,000 496 9.4% 27.4% 36.3% $35,000 - $49,999 $225,000 570 10.8% 37.9% 14.5% $50,000 - $74,999 $340,000 712 13.4% 40.2% 8.4% $75,000 - $99,999 $460,000 665 12.6% 21.5% 4.4% $100,000 - $149,999 $680,000 1,051 19.9% 9.8% 0.0% >$150,000 >$680,000 1,800 34.0% 1.3% 0.3%
Total 5,294 100% 17.1% 6.7% Sources: ACS 2010-2014, COG *Assumes mortgage + property tax + insurance payment = 30% of monthly income with 10% down payment, 4% interest rate, and estimated tax and insurance.
As the housing market gets stronger, finding homes that are affordable to young families and professionals and seniors becomes increasingly difficult. There are few opportunities for first-time homebuyers and many current residents have been forced to move to neighboring communities in search of housing that meets their needs. For the majority of the workforce employed in Newburyport, wages do not support the cost of housing in the City; average wages in manufacturing, professional services, public administration are between $50,000 and $75,000, while retail, hospitality, and restaurants pay average wages below $25,000. The City needs to focus on increasing the supply of housing at various levels of affordability, including both rental and homeownership options. Under Massachusetts law “Chapter 40B”, all communities are supposed to have a minimum of 10 percent of their housing stock be affordable to lower income households. To count toward this 10 percent, units must have a permanent or long-term restriction to sell or rent to households earning less than 80 percent of the median income in the region as defined by the U.S. Department of Housing and Urban Development (HUD). The Median Family income for the Boston-Cambridge-Quincy area region which includes Newburyport was $98,500 in FY 2015. The Massachusetts Department of Housing and Community Development (DHCD) maintains an inventory of housing units which have been subsidized to remain affordable to low and moderate income households. Table H-8 lists the affordable housing units that are included in Newburyport’s Subsidized Housing Inventory (SHI). Although Newburyport is credited for having SHI units representing 7.56 percent of its housing stock (as of 2010, the last Decennial Census), there are many units who’s affordability restriction is scheduled to expire within the next 10 years, and which may not actually meet the requirements for eligibility. These units were added to the SHI because they were improved utilizing a subsidy program to assist low income homeowners maintain decent and safe housing. Although this program is important for preserving existing homes for low-income households, they do not represent long-term affordable units. The number of actual subsidized housing units is estimated at 513, or 6.4 percent of the city’s housing stock.

Master Plan
2016 Master Plan Housing City of Newburyport, Massachusetts Page H - 12
Table H-8, Newburyport Subsidized Housing Inventory
Name Address Type SHI Units Affordability Expires
Horton Terrace N. Atkinson St. & Simmons Dr. Rental 50 Perp n/a Simmons Dr. Rental 8 Perp
n/a V St./Avenue A Rental 42 Sullivan Apartments Temple St. Rental 100 Perp n/a Milk St. Rental 8 Perp n/a 93 Storey Ave. Rental 8 Perp Heritage House 32 Low St. Rental 101 2031 James Steam Mill 1 Charles St. Rental 99 2033 1997 YWCA Family Residence Market St. Rental 5 2018 Maritime Landing Condominiums 68 and 70 Rear Story Ave Rental 29 Perp Moseley Village Condominiums Moseley Ave. Ownership 1 2103 Ocean View Condominiums Ship Street Ownership 2 2103 The Foundry 129 Merrimac St. Ownership 13 2056 Titcomb & Woodland Woodland St. & Titcomb St. Rental 8 Perp Oleo Woods Richardson Path Ownership 2 Perp
DDS/DMH Group Homes Confidential Rental 37 n/a Newburyport Housing Rehab Program Water St. Rental 5 2018 Newburyport Housing Rehab Program Various Ownership 88 2014-2026 Total Units on SHI 606 7.56% Total Eligible Units on SHI (Less Housing Rehab Program) 513 6.40%
Source: DHCD, 2016 In addition to the units listed on the SHI, rental voucher programs offered by the federal and state governments allow some low income households to rent through the private market, making up the difference between a fair market rent and what a low- or moderate-income household can afford. These vouchers are administered by the Newburyport Housing Authority and other administering agencies throughout the region, and households having vouchers may seek housing in any community. It is not clear how many households may be utilizing vouchers to live within Newburyport. Now, more than ever, the City is focused on supporting the construction and creation of affordable homes and apartments to house these populations and to diversify the housing stock to provide options to its residents. Homelessness The issue of homelessness has become more pronounced in the North Shore Region as housing costs have increased relative to household incomes and the supply of affordable housing throughout the region does not meet the level of need. In addition to those who may be in shelters or unsheltered, the population that can be considered to be homeless include those who live in unstable housing situations, such as doubling up with other families, or residing in hotels or temporary (seasonal) rentals. The Newburyport YWCA coordinates an annual count of homelessness in the region which includes Newburyport, Amesbury, Salisbury, Newbury, and Rowley. Part of a national homelessness count coordinated by the US Department of Housing and Urban Development (HUD), the Newburyport YWCA conducts a count of all of the homeless population residing in the region’s shelters and on the streets, as well as various agencies serving the homeless population, including schools that administer the McKinney-Vento program for homeless students. The numbers of homeless

Master Plan
2016 Master Plan Housing City of Newburyport, Massachusetts Page H - 13
identified in the count has increased as the volunteer capacity and cooperation of partner organizations and agencies has grown. In 2016, the YWCA counted 494 homeless individuals and family members throughout the region. Many of the homeless – in particular, those who may be doubled up or living in seasonal rental units may be difficult to identify and include in the count. Some seasonal housing units may be occupied by households who rent for the winter months only and must find housing elsewhere in the summer season. In addition, there are some homeless who live in encampments during the summer months or throughout the year. Over the past five years, homelessness among veterans has been all but eliminated through a program which combines veterans’ services with housing vouchers. Nonprofit organizations that address the housing needs of Newburyport families and individuals who are homeless or at risk of homelessness include the Newburyport YWCA, the Roof Over Head Collaborative, Turning Point, and the Salvation Army. Section C: Newburyport’s Housing Goals Newburyport remains a vibrant community and continues to be a desirable place to move to, to work in and in which to raise our children. The population and housing trends illustrate the need to create new housing, both ownership and rental, to meet the needs of the citizenry. This housing must be affordable to working individuals, young families and the senior community. This growing affordability gap presents a major challenge to the City over the next decade; but it is not the only housing challenge in Newburyport. As new housing is constructed and redevelopment of the City’s existing housing stock occurs to close the affordability gap, the City must work to ensure that residential development is sensitive to, cohesive and compatible with Newburyport’s distinct, often historic, neighborhoods. The architectural, cultural, economic, political and social history of Newburyport is one of its most valued and important assets. As new residential growth is developed and older homes are redeveloped to meet the needs of today’s families, it is important to recognize and respect both the historical fabric of the City’s unique neighborhoods and the City’s natural resources. In addition to creating and sustaining a diverse housing stock, the City must take steps necessary to ensure that development is compatible with the existing built environment and does not unnecessarily impede on open spaces and conservation lands. The preservation, rehabilitation and enhancement of the City’s natural and historic character are critical to the preservation of the Newburyport’s heritage and land values and a benefit to the general welfare of its citizens and property owners. This Plan includes actions focused on ensuring that new- and redevelopment will be historically sensitive through the creation and refinement of existing regulations. The housing component of this Plan seeks to build upon the existing strengths of the City’s housing stock while supporting the Master Plan Vision of sustainability, by crafting goals, objectives and actions that together:
• Promote a lively, active and diverse population that supports a vibrant economy; • Create new affordable housing opportunities so that working professionals, young families and the
senior community are able to live in and enjoy the City; • Preserve home values by allowing appropriately-scaled residential development that will preserve the
historic character of the City; • Protect open spaces through thoughtful site planning that promotes safe and efficient pedestrian
movement throughout the City; and • Promote energy conservation and production.

Master Plan
2016 Master Plan Housing City of Newburyport, Massachusetts Page H - 14
The Goals discussed in the remainder of this chapter provide a coherent framework for meeting Newburyport’s future housing needs with a focus on creating more diverse, moderately priced and affordable housing options in proximity to goods and services.
Goal H-1: Increase the variety of housing options to promote a lively, active and diverse population and to accommodate households with varying housing needs and family structures. The Objectives and Actions supporting Goal H-1 recommend ways to diversify Newburyport’s housing stock, increasing housing choice and establish neighborhoods that bring different groups of people together. Future housing development should strive to meet the needs of all community members, including low- and middle-income households, and should avoid the creation of enclaves of poverty or wealth or uniform concentrations of housing types (single-family, multi-family units, same design/size, etc.) in segregated neighborhoods. Development incentives, regulations, zoning, and favorable financing are a few of the tools that can be used to spur mixed income, diverse housing development.
Goal H-2: Continue to implement the strategies found in the City’s 2013 Housing Production Plan to achieve the State-mandated goal of having at least 10 percent of the City’s year-round housing stock defined as affordable through both the creation of new affordable housing options as well as the preservation of Newburyport’s existing affordable housing stock by the year 2017. In the Housing Production Plan, the City has a clear, concise course of action to create housing that meets the needs of the community and achieve the goal of having at least 10 percent of the housing stock be comprised of affordable units. The City must continue to assess its affordable housing needs and future growth projections on a continual basis and develop appropriate regulatory tools and financial incentives to spur the development of affordable housing. Along with the creation of new affordable and moderately priced housing units, the preservation of existing affordable housing stock is critical to the success of an affordable housing plan. Successful projects rely upon the availability of favorable funding and financing opportunities, and frequently draw upon resources provided by the federal government, local governments, or philanthropic institutions. Elected officials, City staff, and volunteer Board and Commission members must work collaboratively with the private development community and housing and service-oriented non-profit organizations to further Newburyport’s affordable housing goals.
Goal H-3: Ensure that new residential development and redevelopment is appropriate in terms of location, size, scale and massing in addition to complementing the historic character of the neighborhoods. Appropriately-designed development and redevelopment can promote neighborhood revitalization. With proper design standards, especially for multi-family dwellings, community acceptance of a diversity of housing types may be increased. Design standards can be used to guide development of all types of dwellings. They may be crafted to reflect Newburyport’s architectural and cultural history and each of its distinctive neighborhoods, which in turn will be more easily accepted by neighboring residents.

Master Plan
2016 Master Plan Housing City of Newburyport, Massachusetts Page H - 15
Goal H-4: Housing development and redevelopment shall be designed to protect the City’s natural and cultural resources, to preserve open space corridors and to allow for safe pedestrian movement within and among the City’s neighborhoods. New housing development and redevelopment presents an opportunity to promote environmentally-friendly design. The site planning aspect of housing development and redevelopment offers an opportunity to design housing so that residents are able to safely access and appreciate Newburyport’s open spaces and resources. By ensuring that neighborhoods are compact, walkable and safe for both motorized and non-motorized users, the City will be able to help residents maintain their quality of life.
Goal H-5: Promote energy conservation and renewable energy production in both the creation of new housing and the redevelopment of existing housing. Throughout this Master Plan, the concept of sustainability is threaded through each individual Plan element. In housing redevelopment, there are opportunities to incorporate Low Impact Design (LID) techniques that lower our impacts on both the environment and on the City’s services and infrastructure (i.e. water and sewer systems). Promoting energy conservation includes strategies focused on retrofitting existing structures to promote energy efficiency, updating/creating regulatory provisions to incorporate green technologies like renewable energy generation and gray water recycling systems and partnering with local organizations and financial institutions to offer incentives and aid for these types of improvements.

Master Plan
2016 Master Plan Housing City of Newburyport, Massachusetts Page H - 16