chapter 6 page 299
TRANSCRIPT

© 2004 Key Curriculum Press
American installationartist Amy Stacey Curtis(b 1970) created thissculpture. The rectangulararrangement of egg cartons isused to organize an even largerarrangement of photocopiedimages. The egg cartons and theircompartments divide the piece into rowsand columns, while the small images—some darker or lighter than others—helpcertain elements of the piece to stand outmore prominently. Fragile and detail from Fragile by Amy StaceyCurtis Egg cartons, acrylic, dye, thread, beads,photocopies
In this chapter you will
use matrices to organizeinformation
add, subtract, and multiplymatrices
solve systems of linearequations with matrices
graph two-variableinequalities on acoordinate plane and solve
write and graph inequalitiesthat represent conditionsthat must be metsimultaneously
Chapter 6 Page 299 http://acr.keypress.com/KeyPressPortalV3.0/ImportingCourses/DAA/ch...
1 de 1 31-03-2009 20:01
All dimensions arecritical dimensions,otherwise why arethey there?
RUSS ZANDBERGEN
Matrix Representations
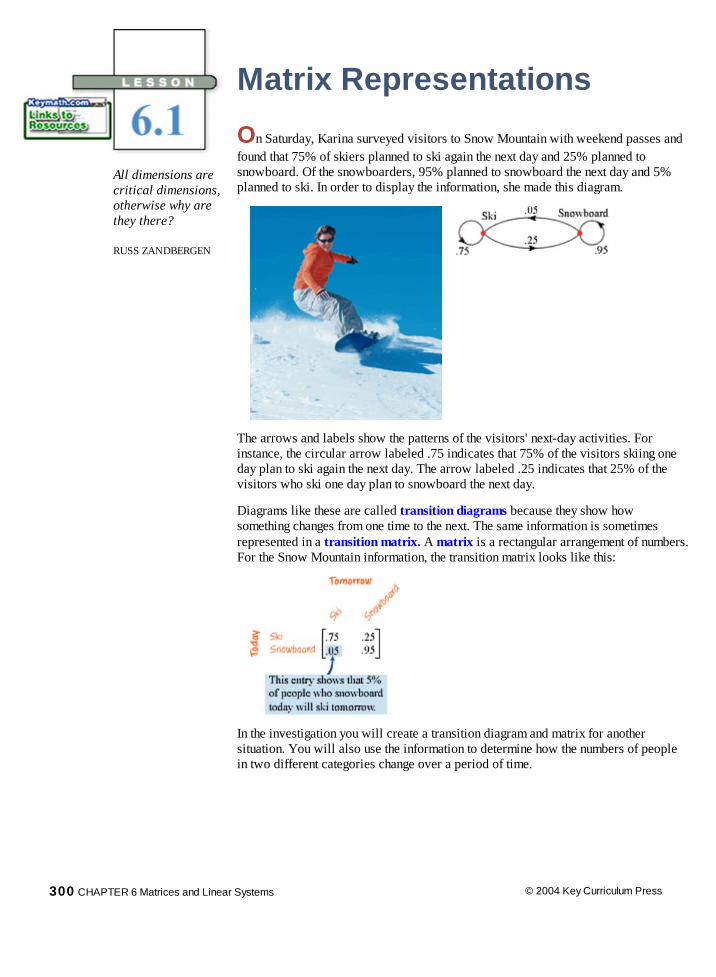
On Saturday, Karina surveyed visitors to Snow Mountain with weekend passes andfound that 75% of skiers planned to ski again the next day and 25% planned tosnowboard. Of the snowboarders, 95% planned to snowboard the next day and 5%planned to ski. In order to display the information, she made this diagram.
The arrows and labels show the patterns of the visitors' next-day activities. Forinstance, the circular arrow labeled .75 indicates that 75% of the visitors skiing oneday plan to ski again the next day. The arrow labeled .25 indicates that 25% of thevisitors who ski one day plan to snowboard the next day.
Diagrams like these are called transition diagrams because they show howsomething changes from one time to the next. The same information is sometimesrepresented in a transition matrix. A matrix is a rectangular arrangement of numbers.For the Snow Mountain information, the transition matrix looks like this:
In the investigation you will create a transition diagram and matrix for anothersituation. You will also use the information to determine how the numbers of peoplein two different categories change over a period of time.
300 CHAPTER 6 Matrices and Linear Systems © 2004 Key Curriculum Press
Lesson http://acr.keypress.com/KeyPressPortalV3.0/Viewer/Lesson.htm
1 de 7 31-03-2009 21:00

© 2004 Key Curriculum Press LESSON 6.1 Matrix Representations 301
The school cafeteria offers a choice of ice cream or frozen yogurt for dessert once a week.During the first week of school, 220 students choose ice cream but only 20 choose frozenyogurt. During each of the following weeks, 10% of the frozen-yogurt eaters switch to icecream and 5% of the ice-cream eaters switch to frozen yogurt.
Step 1 Complete a transition diagram that displays this information.
Step 2
Complete a transition matrix thatrepresents this information. The rowsshould indicate the present condition, andthe columns should indicate the nextcondition after the transition.
Step 3
In the second week, how many studentschoose ice cream and how many studentschoose frozen yogurt?
Step 4 How many will choose each option in the third week?
Step 5 Write a recursive routine to take any week's values and give the next week's values.
Step 6
What do you think will happento the long-run values of thenumber of students whochoose ice cream and thenumber who choosefrozen yogurt?
Chilly Choices
Lesson http://acr.keypress.com/KeyPressPortalV3.0/Viewer/Lesson.htm
2 de 7 31-03-2009 21:00

You can use matrices to organize many kinds of information. For example, the matrix belowcan be used to represent the number of math, science, and history textbooks sold this week atthe main and branch campus bookstores. The rows represent math, science, and history, fromtop to bottom, and the columns represent the main and branch bookstores, from left to right.
The dimensions of the matrix give the numbers of rows andcolumns, in this case, 3 2 (read "three by two"). Eachnumber in the matrix is called an entry, or element, and isidentified as aij where i and j are the row number andcolumn number, respectively. In matrix [A] at right, a21 =65 because 65 is the entry in row 2, column 1.
Example A shows how to use matrices to representcoordinates of geometric figures.
EXAMPLE A Represent quadrilateral ABCD as a matrix, [M].
Solution
You can use a matrix to organize the coordinates of theconsecutive vertices of a geometric figure. Becauseeach vertex has 2 coordinates and there are 4 vertices,use a 2 4 matrix with each column containing the x-and y-coordinates of a vertex. Row 1 containsconsecutive x-coordinates and row 2 contains thecorresponding y-coordinates.
Example B shows how a transition matrix can be used to organize data andpredictions. In Lesson 6.2, you'll learn how to do computations with matrices.
EXAMPLE B In Karina's survey from the beginning of this lesson, sheinterviewed 260 skiers and 40 snowboarders. Howmany people will do each activity the next day if hertransition predictions are correct?
Solution The next day, 75% of the 260 skiers will ski again and5% of the 40 snowboarders will switch to skiing.
Skiers: 260(.75) + 40(.05) = 197
So, 197 people will ski the next day.
The next day, 25% of the 260 skiers will switch to snowboarding and 95% of the 40snowboarders will snowboard again.
Snowboarders: 260(.25) + 40(.95) = 103
302 CHAPTER 6 Matrices and Linear Systems © 2004 Key Curriculum Press
Lesson http://acr.keypress.com/KeyPressPortalV3.0/Viewer/Lesson.htm
3 de 7 31-03-2009 21:00
So, 103 people will snowboard the next day.
You can organize the information for the first day and second day as matricesin the form [number of skiers number of snowboarders].
[260 40][197 103]
You can use transition diagrams and transition matrices to show changes in a closed system. (Aclosed system is one in which items may change, but nothing is added or removed.) Thediagram, though very informative for simple problems, is difficult to use when you have 5 ormore starting conditions, as this would create 25 or more arrows, or paths. The transition matrixis just as easy to read for any number of starting conditions as it is for two. It grows in size, buteach entry shows what percentage changes from one condition to another.
EXERCISES
Practice Your Skills
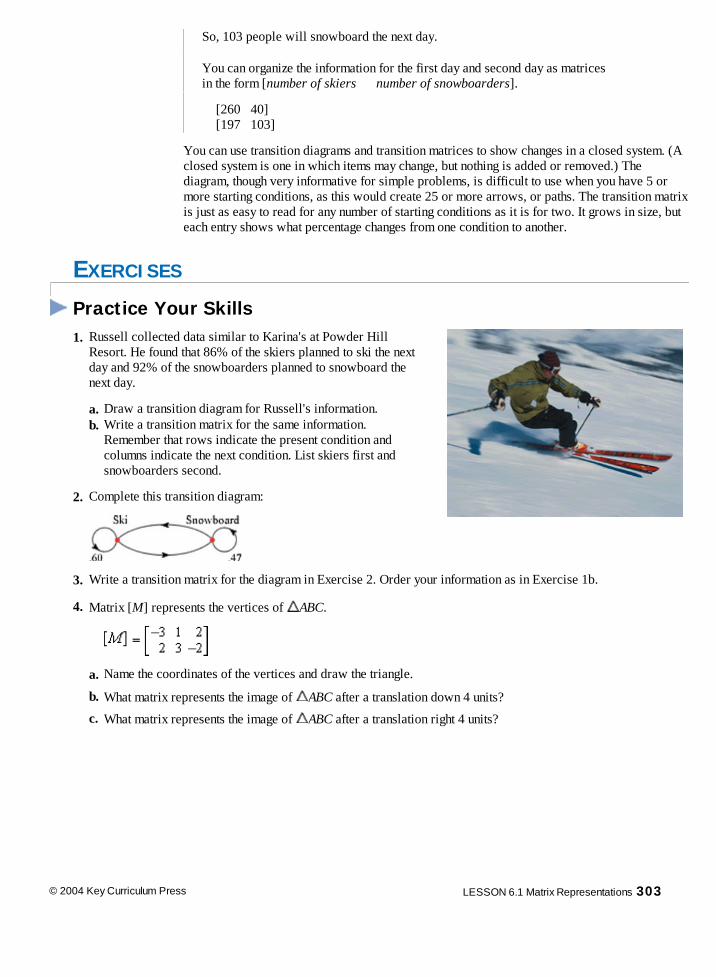
1. Russell collected data similar to Karina's at Powder HillResort. He found that 86% of the skiers planned to ski the nextday and 92% of the snowboarders planned to snowboard thenext day.
a. Draw a transition diagram for Russell's information.b. Write a transition matrix for the same information.
Remember that rows indicate the present condition andcolumns indicate the next condition. List skiers first andsnowboarders second.
2. Complete this transition diagram:
3. Write a transition matrix for the diagram in Exercise 2. Order your information as in Exercise 1b.
4. Matrix [M] represents the vertices of ABC.
a. Name the coordinates of the vertices and draw the triangle.
b. What matrix represents the image of ABC after a translation down 4 units?
c. What matrix represents the image of ABC after a translation right 4 units?
© 2004 Key Curriculum Press LESSON 6.1 Matrix Representations 303
Lesson http://acr.keypress.com/KeyPressPortalV3.0/Viewer/Lesson.htm
4 de 7 31-03-2009 21:00
5. During a recent softball tournament, information about which side players bat from was recorded in amatrix. Row 1 represents girls and row 2 represents boys. Column 1 represents left-handed batters,column 2 represents right-handed batters, and column 3 represents those who can bat with either hand.
a. How many girls and how many boys participated in the tournament?b. How many boys batted right-handed?c. What is the meaning of the value of a12?
Reason and Apply
6.
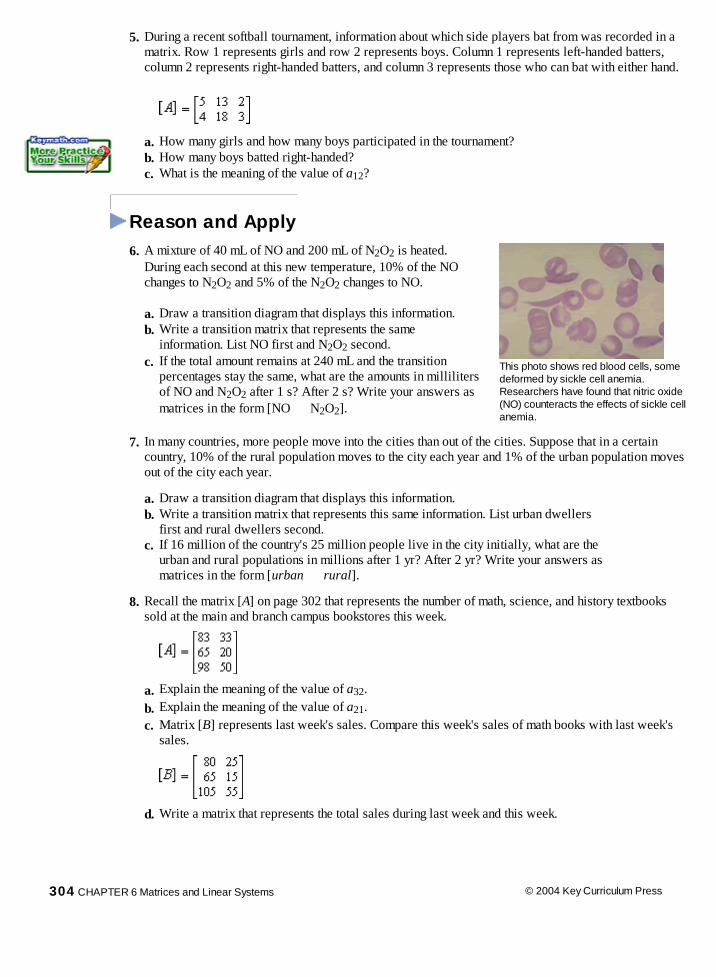
A mixture of 40 mL of NO and 200 mL of N2O2 is heated.During each second at this new temperature, 10% of the NOchanges to N2O2 and 5% of the N2O2 changes to NO.
This photo shows red blood cells, somedeformed by sickle cell anemia.Researchers have found that nitric oxide(NO) counteracts the effects of sickle cellanemia.
a. Draw a transition diagram that displays this information.b. Write a transition matrix that represents the same
information. List NO first and N2O2 second.c. If the total amount remains at 240 mL and the transition
percentages stay the same, what are the amounts in millilitersof NO and N2O2 after 1 s? After 2 s? Write your answers asmatrices in the form [NO N2O2].
7. In many countries, more people move into the cities than out of the cities. Suppose that in a certaincountry, 10% of the rural population moves to the city each year and 1% of the urban population movesout of the city each year.
a. Draw a transition diagram that displays this information.b. Write a transition matrix that represents this same information. List urban dwellers
first and rural dwellers second.c. If 16 million of the country's 25 million people live in the city initially, what are the
urban and rural populations in millions after 1 yr? After 2 yr? Write your answers asmatrices in the form [urban rural].
8. Recall the matrix [A] on page 302 that represents the number of math, science, and history textbookssold at the main and branch campus bookstores this week.
a. Explain the meaning of the value of a32.b. Explain the meaning of the value of a21.c. Matrix [B] represents last week's sales. Compare this week's sales of math books with last week's
sales.
d. Write a matrix that represents the total sales during last week and this week.
304 CHAPTER 6 Matrices and Linear Systems © 2004 Key Curriculum Press
Lesson http://acr.keypress.com/KeyPressPortalV3.0/Viewer/Lesson.htm
5 de 7 31-03-2009 21:00

9. The three largest categories of motor vehicles are sedan, SUV, and minivan. Suppose that of the buyers ina particular community who now own a minivan, 18% will change to an SUV and 20% will change to asedan. Of the buyers who now own a sedan, 35% will change to a minivan and 20% will change to anSUV, and of those who now own an SUV, 12% will buy a minivan and 32% will buy a sedan.
a. Draw a transition diagram that displays these changes.b. Write a transition matrix that represents this scenario. List the rows and columns in the order minivan,
sedan, SUV.c. What is the sum of the entries in row 1? Row 2? Row 3? Why does this sum make sense?
10. Lisa Crawford is getting into the moving-truck rental business in three nearby counties. She has the funds tobuy about 100 trucks. Her studies show that 20% of the trucks rented in Bay County go to Sage County, and15% go to Thyme County. The rest start and end in Bay County. From Sage County, 25% of rentals go toBay and 55% stay in Sage, whereas the rest move to Thyme County. From Thyme County, 40% of rentalsend in Bay and 30% in Sage.
a. Draw a transition diagram that displays this information.
b. Write a transition matrix that represents this scenario. List your rows and columns in the order Bay,Sage, Thyme.
c. What is the sum of the entries in row 1? Row 2? Row 3? Why does this sum make sense?
d. If Lisa starts with 45 trucks in Bay County, 30 trucks in Sage County, and 25 trucks in Thyme County,and all trucks are rented one Saturday, how many trucks will she expect to be in each county the nextmorning?
11. APPLICATION Fly-Right Airways operates routes out of five cities as shown in the route map below.Each segment connecting two cities represents a round-trip flight between them. Matrix [M] displays theinformation from the map in matrix form with the cities, A, B, C, D, and E, listed in order in the rows andcolumns. The rows represent starting conditions (departure cities), and the columns represent nextconditions (arrival cities). This matrix is called an adjacency matrix. For instance, the value of the entry inrow 1, column 5 shows that there are two round-trip flights between City A and City E.
a. What are the dimensions of this matrix?b. What is the value of m32? What does this entry represent?c. Which city has the most flights? Explain how you can tell using the route map and using the matrix.d. Matrix [N] below represents Americana Airways's routes connecting four cities, J, K, L, and M. Sketch
a possible route map.
© 2004 Key Curriculum Press LESSON 6.1 Matrix Representations 305
Lesson http://acr.keypress.com/KeyPressPortalV3.0/Viewer/Lesson.htm
6 de 7 31-03-2009 21:00

Graph theory is a branch of mathematics that deals withconnections between items. In Exercise 11, a paragraphdescription of the flight routes could have been made, buta vertex-edge graph of the routes allows you to show thematerial quickly and clearly. You could also use a graph todiagram a natural gas pipeline, the chemical structure of amolecule, a family tree, or a computer network. The datain a graph can be represented, manipulated mathematically,and further investigated using matrices.
Review
12. Solve this system using either substitution or elimination.
13. Each slice of pepperoni pizza has approximately 7.4 slices of pepperoni on it, and each slice of supreme pizza
has approximately 4.7 slices of pepperoni on it. Write an equation that shows that p slices of pepperoni pizza ands slices of supreme pizza would have a total of 100 slices of pepperoni.
14. Solve the equation 2x + 3y = 12 for y and then graph it.
15. APPLICATION The table at right shows the
number of cellular telephone subscribers inthe United States from 1985 to 2000.
Cellular Phone Subscribers
Year Number ofSubscribers Year Number of
Subscribers1985 340,000 1993 16,009,000 1986 682,000 1994 24,134,000 1987 1,231,000 1995 33,786,000 1988 2,069,000 1996 44,043,000 1989 3,509,000 1997 55,312,000 1990 5,283,000 1998 69,209,000 1991 7,557,000 1999 86,047,000 1992 11,033,000 2000 109,478,000
(The World Almanac and Book of Facts 2002)
a. Create a scatter plot of the data.b. Find an exponential function to model the data.
c. Use your model to predict the number of subscribers
in 2003. Do you think this is a realistic prediction?Why or why not? Do you think an exponentialmodel is appropriate? Why or why not?
16. APPLICATION The equation y = 20 log measures the intensity of a sound as a functionof the pressure it creates on the eardrum. Theintensity, y, is measured in decibels (dB), and thepressure, x, is measured in Pascals (Pa).
a. What is the intensity of the sound of a humming refrigerator, if it causes0.00356 Pa of pressure on the eardrum?
b. A noise that causes 20 Pa of pressure on the eardrum brings severe pain to mostpeople. What is the intensity of this noise?
c. Write the inverse function that measures pressure on the eardrum as a functionof intensity of a sound.
d. How much pressure on the eardrum is caused by a 90 dB sound?
306 CHAPTER 6 Matrices and Linear Systems © 2004 Key Curriculum Press
Lesson http://acr.keypress.com/KeyPressPortalV3.0/Viewer/Lesson.htm
7 de 7 31-03-2009 21:00

It is not once nortwice but timeswithout number thatthe sameideas make theirappearance inthe world.
ARISTOTLE
Matrix Operations
A matrix is a compact way of organizing data, similar to a table. Representing data ina matrix instead of a table allows you to perform operations such as addition andmultiplication with your data. In this lesson you will see how this is useful. Consider this problem from Lesson 6.1. Matrix [A] represents math, science, andhistory textbooks sold this week at the main and branch campus bookstores. Matrix [B]contains the same information for last week. What are the total sales, by category andlocation, for both weeks?
[A] = [B] =
To solve this problem, you add matrices [A] and [B].
To add two matrices, you simply add corresponding entries. So in order to add (orsubtract) two matrices they both must have the same dimensions. The correspondingrows and columns should also have similar interpretations if the results are to makesense. [ See Calculator Note 6A to learn how to enter matrices into yourcalculator.Calculator Note 6B shows how to perform operations with matrices. ]
When you add matrices, you addcorresponding entries. This illustrationuses the addition of color to show how theaddition carries through to the matrixrepresenting the sum.
In Lesson 6.1, you used a matrix to organize the coordinates of the vertices of atriangle. You can use matrix operations to transform a figure such as a triangle just asyou transformed the graph of a function.
© 2004 Key Curriculum Press LESSON 6.2 Matrix Operations 307
Lesson http://acr.keypress.com/KeyPressPortalV3.0/Viewer/Lesson.htm
1 de 11 31-03-2009 21:02

EXAMPLE A This matrix represents a triangle.
a. Graph the triangle and its image after a translation left 3 units. Write a matrix equation torepresent the transformation.
b. Describe the transformation represented by this matrix expression:
c. Describe the transformation represented by this matrix expression:
2 ·
Solution The original matrix represents a triangle withvertices (–3, 2), (1, 3), and (2, –2).
a. After a translation left 3 units, thex-coordinates of the image are reducedby 3. There is no change to the y-coordinates.You can represent this transformation as a subtractionof two matrices.
– =
b. =
This matrix addition represents a translation left 4 units and down 3 units.
c. 2 · = + =
2 · = =
Multiplying a matrix by a number is called scalar multiplication. Each entry in the matrixis simply multiplied by the scalar, which is 2 in this case.
308 CHAPTER 6 Matrices and Linear Systems © 2004 Key Curriculum Press
Lesson http://acr.keypress.com/KeyPressPortalV3.0/Viewer/Lesson.htm
2 de 11 31-03-2009 21:02

The resulting matrix represents stretches, bothhorizontally and vertically, by the scale factor2. A transformation that stretches or shrinksboth horizontally and vertically by the samescale factor is called a dilation.
[ See Calculator Note 6C to learn how to to useyour calculator to graph polygons with matrices. ]
Addition and scalar multiplication operate on one entry at a time. The multiplication of twomatrices is more involved and uses several entries to find one entry of the answer matrix.Recall this problem from the investigation in Lesson 6.1.
EXAMPLE B The school cafeteria offers a choice of ice cream or frozen yogurt fordessert once a week. During the first week of school, 220 students chooseice cream and 20 choose frozen yogurt. During each of the following weeks,
10% of the frozen-yogurt eaters switchto ice cream and 5% of the ice-cream eatersswitch to frozen yogurt. How many studentswill choose each dessert in the second week?In the third week?
Solution You can use this matrix equation to find the answer for the second week:
= [ice cream frozen yogurt]
The initial matrix, [A] = [220 20], represents the original numbers of ice-cream eatersand frozen-yogurt eaters.
In the transition matrix , the top row represents the transitions
in the current number of ice-cream eaters, and the bottom row represents the transitions inthe current number of frozen-yogurt eaters.
You can define matrix multiplication by looking at how you calculate the numbers for thesecond week. The second week's number of ice-cream eaters will be 220(.95) + 20(.10),or 211 students, because 95% of the 220 original ice-cream eaters don't switch and 10%of the 20 original frozen-yogurt eaters switch to ice cream. In effect, you multiply the twoentries in row 1 of [A] by the two entries in column 1 of [B] and add the products. Theresult, 211, is entry c11 in the answer matrix, [C].
Initialmatrix
Transitionmatrix Answer
matrix [A] · [B] = [C]
[220 20] = [211 frozen yogurt]
© 2004 Key Curriculum Press LESSON 6.2 Matrix Operations 309
Lesson http://acr.keypress.com/KeyPressPortalV3.0/Viewer/Lesson.htm
3 de 11 31-03-2009 21:02

310 CHAPTER 6 Matrices and Linear Systems © 2004 Key Curriculum Press
Likewise, the second week's number of frozen-yogurt eaters will be220(.05) + 20(.90), or 29 students, because 5% of the ice-cream eaters switch tofrozen yogurt and 90% of the frozen-yogurt eaters don't switch. The numberof frozen-yogurt eaters in the second week is the sum of the products of the entries inrow 1 of [A] and column 2 of [B]. The answer, 29, is entry c12 in the answermatrix, [C].
[220 20] = [211 29]
To get the numbers for the third week, multiply the result of your previous calculations by thetransition matrix again.
Approximately 203 students will choose ice cream and 37 will choose frozen yogurt in thenext week.
You can continue multiplying to find the numbers in the fourth week, the fifth week,and so on. [ Revisit Calculator Note 6B to learn how to multiply matrices on yourcalculator. ]
In the investigation you will model a real-world situation with matrices. You'll also practicemultiplying matrices.
In this investigation you will simulatethe weekly movement of rentalcars between cities and analyzethe results.
Each person represents arental car starting atCity A, City B, orCity C.
Find Your Place
Lesson http://acr.keypress.com/KeyPressPortalV3.0/Viewer/Lesson.htm
4 de 11 31-03-2009 21:02

© 2004 Key Curriculum Press LESSON 6.2 Matrix Operations 311
Step 1 In a table, record the number of cars that start in each city. Follow the ProcedureNote to simulate the movement of cars.
Step 2 Work with your group to make a transition diagram and a transition matrix thatrepresent the rules of the simulation.
Step 3 Write an initial condition matrix for the starting quantities at each city. Then, show
how to multiply the initial condition matrix and the transition matrix for the firsttransition. How do these theoretical results for week 1 compare with theexperimental data from your simulation?
Step 4 Use your calculator to find the theoretical number of cars in each city for the nextfour weeks. Find the theoretical long-run values of the number of cars in each city.
Step 5 Compare these results with the experimental values in your table. If they are notsimilar, explain why.
Just as only some matrices can be added(those with the same dimensions), onlysome matrices can be multiplied. ExampleC and Exercise 3 will help you explorethe kinds of matrices that can bemultiplied.
American artist Robert Silvers (b 1968)combined thousands of worldwide moneyimages in a matrix-like arrangement to createthis piece titled Washington.
Lesson http://acr.keypress.com/KeyPressPortalV3.0/Viewer/Lesson.htm
5 de 11 31-03-2009 21:02

EXAMPLE C Consider this product.
a. Determine the dimensions of the answer to this product.
b. Describe how to calculate entries in the answer.
Solution a. To multiply two matrices, you multiply each entry in a row of the first matrix by each entry
in a column of the second matrix.
You can multiply a 2 2 matrix by a 2 3 matrix becausethe inside dimensions are
the same- the 2 row entries match up with the2 column entries.
The outside dimensions tell you the dimensions ofyour answer.
The answer to this product has dimensions 2 3.
=
b. To find the values of entries in the first row of your solution matrix, you add the products
of the entries in the first row of the first matrix and the entries in the columns of the secondmatrix.
To find the values of entries in the second row of your solution matrix, you add theproducts of the entries in the second row of the first matrix and the entries in the columnsof the second matrix.
The product is
312 CHAPTER 6 Matrices and Linear Systems © 2004 Key Curriculum Press
Lesson http://acr.keypress.com/KeyPressPortalV3.0/Viewer/Lesson.htm
6 de 11 31-03-2009 21:02
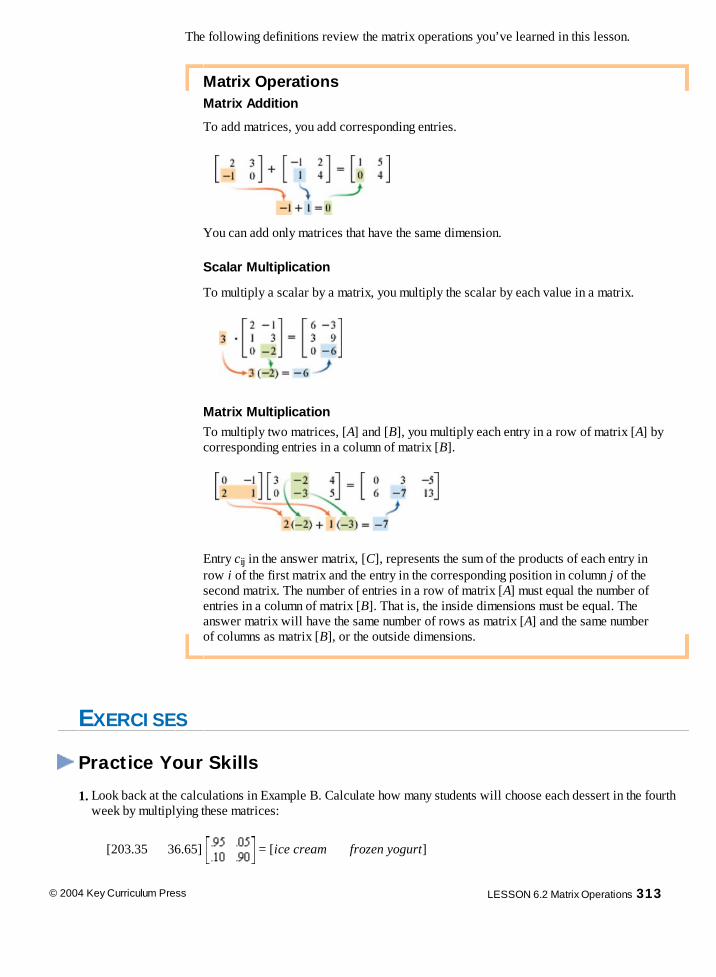
The following definitions review the matrix operations you’ve learned in this lesson.
Matrix Operations Matrix Addition
To add matrices, you add corresponding entries.
You can add only matrices that have the same dimension.
Scalar Multiplication
To multiply a scalar by a matrix, you multiply the scalar by each value in a matrix.
Matrix Multiplication
To multiply two matrices, [A] and [B], you multiply each entry in a row of matrix [A] bycorresponding entries in a column of matrix [B].
Entry cij in the answer matrix, [C], represents the sum of the products of each entry inrow i of the first matrix and the entry in the corresponding position in column j of thesecond matrix. The number of entries in a row of matrix [A] must equal the number ofentries in a column of matrix [B]. That is, the inside dimensions must be equal. Theanswer matrix will have the same number of rows as matrix [A] and the same numberof columns as matrix [B], or the outside dimensions.
EXERCISES
Practice Your Skills
1. Look back at the calculations in Example B. Calculate how many students will choose each dessert in the fourthweek by multiplying these matrices:
[203.35 36.65] = [ice cream frozen yogurt]
© 2004 Key Curriculum Press LESSON 6.2 Matrix Operations 313
Lesson http://acr.keypress.com/KeyPressPortalV3.0/Viewer/Lesson.htm
7 de 11 31-03-2009 21:02

2. Find the missing values.
American painter Chuck Close (b 1940) creates photorealistic portraits by painting a matrix-like grid ofrectangular cells. Close is a quadriplegic and paints with amouth brush. This portrait is from 1992.Janet by Chuck Close, oil on canvas, 102 84 in.
a. [13 23] + [–6 31] = [x y]
b. =
c. + =
d. 10 · =
e. + 5 · =
3. Perform matrix arithmetic in 3a-f. If a particularoperation is impossible, explain why.
a.
b.
c. d.
e. f.
4. Find matrix [B] such that
Reason and Apply
5. This matrix represents a triangle:
a. Graph the triangle. b. Find the result of this matrix multiplication:
c. Graph the image represented by the matrix in 5b. d. Describe the transformation.
314 CHAPTER 6 Matrices and Linear Systems © 2004 Key Curriculum Press
Lesson http://acr.keypress.com/KeyPressPortalV3.0/Viewer/Lesson.htm
8 de 11 31-03-2009 21:02

6. Find matrix [A] and matrix [C] such that the triangle represented by
[T] =
matrix [T] is reflected across the x-axis.
=
7. Of two-car families in a small city, 88% remain two-car families inthe following year and 12% become one-car families in thefollowing year. Of one-car families, 72% remain one-car familiesand 28% become two-car families. Suppose these trends continuefor a few years. At present, 4800 families have one car and 4200have two cars.
a. Draw a transition diagram that displays this information. b. What matrix represents the present situation? Let a11 represent
one-car families that remain one-car families.
c. Write a transition matrix that represents the same information asyour transition diagram.
d. Write a matrix equation to find the numbers of one-car andtwo-car families one year from now.
e. Find the numbers of one-car and two-car families two yearsfrom now.
8. Mini-Investigation Enter these matrices into your calculator.
a. Find [A][B] and [B][A]. Are they the same?
b. Find [A][C] and [C][A]. Are they the same? What do you notice?
c. Find [A][D] and [D][A]. Are they the same? What do you notice?
d. Is matrix multiplication commutative? That is, does order matter?
9. Find the missing values.
a. b.
10. Recall the ice cream and frozen yogurt problem from Example B. Enter these matrices into your
calculator, and use them to find the long-run values for the number of students who choose icecream and the number of those who choose frozen yogurt. Explain why your answer makes sense.
[A] = [220 20] [B] =
11. A spider is in a building with three rooms. The spider moves fromroom to room by choosing a door at random. If the spider starts inroom 1 initially, what is the probability that it will be in room 1again after four room changes? What happens to the probabilities inthe long run?
© 2004 Key Curriculum Press LESSON 6.2 Matrix Operations 315
Lesson http://acr.keypress.com/KeyPressPortalV3.0/Viewer/Lesson.htm
9 de 11 31-03-2009 21:02
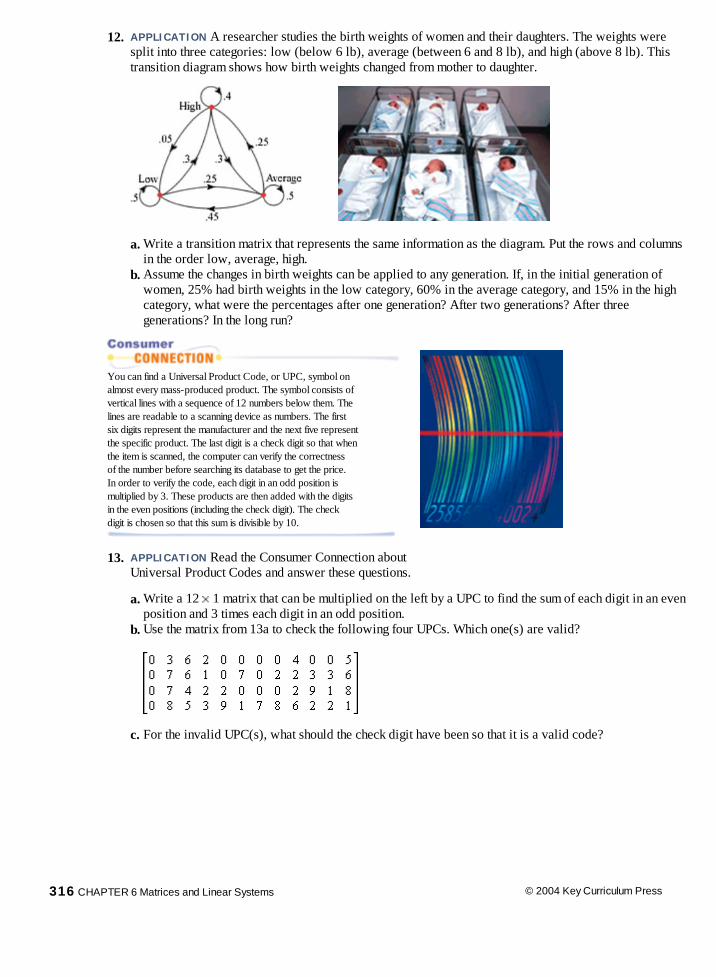
12. APPLICATION A researcher studies the birth weights of women and their daughters. The weights were
split into three categories: low (below 6 lb), average (between 6 and 8 lb), and high (above 8 lb). Thistransition diagram shows how birth weights changed from mother to daughter.
a. Write a transition matrix that represents the same information as the diagram. Put the rows and columnsin the order low, average, high.
b. Assume the changes in birth weights can be applied to any generation. If, in the initial generation of
women, 25% had birth weights in the low category, 60% in the average category, and 15% in the highcategory, what were the percentages after one generation? After two generations? After threegenerations? In the long run?
You can find a Universal Product Code, or UPC, symbol onalmost every mass-produced product. The symbol consists ofvertical lines with a sequence of 12 numbers below them. Thelines are readable to a scanning device as numbers. The firstsix digits represent the manufacturer and the next five representthe specific product. The last digit is a check digit so that whenthe item is scanned, the computer can verify the correctnessof the number before searching its database to get the price.In order to verify the code, each digit in an odd position ismultiplied by 3. These products are then added with the digitsin the even positions (including the check digit). The checkdigit is chosen so that this sum is divisible by 10.
13. APPLICATION Read the Consumer Connection aboutUniversal Product Codes and answer these questions.
a. Write a 12 1 matrix that can be multiplied on the left by a UPC to find the sum of each digit in an evenposition and 3 times each digit in an odd position.
b. Use the matrix from 13a to check the following four UPCs. Which one(s) are valid?
c. For the invalid UPC(s), what should the check digit have been so that it is a valid code?
316 CHAPTER 6 Matrices and Linear Systems © 2004 Key Curriculum Press
Lesson http://acr.keypress.com/KeyPressPortalV3.0/Viewer/Lesson.htm
10 de 11 31-03-2009 21:02

Review
14. Mini-Investigation A system of equations that has at least one solution is called consistent. A system of
equations that has no solutions is called inconsistent. A system with infinitely many solutions is calleddependent. A system of equations that has exactly one solution is called independent. Follow the steps in 14a-gto make some discoveries about inconsistent and dependent systems.
a. Graph each of the following systems of linear equations. Use your graphs to identify each system asconsistent, inconsistent, dependent, and/or independent.
i.
ii. iii.
iv.
v. vi.
vii.
viii. ix. b. Describe the graphs of the equations of the inconsistent systems.
c. Try to solve each inconsistent system by substitution or by elimination. Show your steps. Describe theoutcome of your attempts.
d. How can you recognize an inconsistent linear system without graphing it?
e. Describe the graphs of equations of consistent and dependent systems.
f. Try to solve each consistent and dependent system by substitution or by elimination. Show your steps.Describe the outcome of your attempt.
g. How can you recognize a consistent and dependent linear system without graphing it?
15. For each segment shown in the figure at right, write an equation inpoint-slope form for the line that contains the segment. Check yourequations by graphing them on your calculator.
16. If logp x = a and logp y = b, find
a. logp xy b. logp x3 c. d. y e. logp f. logm xy
17. Solve this system of equations for x, y, and z.
© 2004 Key Curriculum Press LESSON 6.2 Matrix Operations 317
Lesson http://acr.keypress.com/KeyPressPortalV3.0/Viewer/Lesson.htm
11 de 11 31-03-2009 21:02
Rather thandenying problems,focus inventively,intentionally onwhat solutionsmight look or feellike . . .
MARSHA SINETAR
Row Reduction MethodIn Chapter 3, you learned how to solve systems of equations using elimination. Youadded equations, sometimes first multiplying both sides by a convenient factor, toreduce the system to an equation in one variable. In this lesson you will learn how touse matrices to simplify this elimination method for solving systems of equations,especially when you have more than two variables.
Any system of equations in standard form can be written as a matrix equation. Forexample
The original system.
Rewrite with matrices.
The product is equivalent to .
You can also write the system as an augmented matrix, which is a single matrix thatcontains a column for the coefficients of each variable and a final column for theconstant terms.
In this piece by Belgian painter RenéMagritte (1898-1967), a man appears in oneframe, but he is "eliminated" from the others.Man with a Newspaper (1928) by RenéMagritte, oil on canvas
You can use the augmented matrix to carry out a process similar toelimination.The row reduction method transforms an augmented matrix into asolution matrix. Instead of combining equations and multiples ofequations until you are left with an equation in one variable, youadd multiples of rows to other rows until you obtain the solutionmatrix. A solution matrix contains the solution to the system in thelast column. The rest of the matrix consists of 1's along the maindiagonal and 0's above and below it.This augmented matrix represents the system
or x = a and y = b.
This matrix is in reduced row-echelon form because each row isreduced to a 1 and a solution, and the rest of the matrix entries are0's. The 1's are in echelon, or step, form. The ordered pair (a, b)is the solution to the system.
318 CHAPTER 6 Matrices and Linear Systems © 2004 Key Curriculum Press
Lesson http://acr.keypress.com/KeyPressPortalV3.0/Viewer/Lesson.htm
1 de 9 31-03-2009 21:03

An augmented matrix represents a system of equations, so the same rules apply to rowoperations in a matrix as to equations in a system of equations.
Row Operations in a Matrix
You can multiply (or divide) all numbers in a row by a nonzero number. You can add all numbers in a row to corresponding numbers in another row. You can add a multiple of the numbers in one row to the corresponding
numbers in another row.
You can exchange two rows.
EXAMPLE A Solve this system of equations.
Solution You can solve the system using matrices or equations. Let's compare the row reductionmethod using matrices with the elimination method using equations.
Because the equations are in standard form, you can copy the coefficients and constantsfrom each equation into corresponding rows of the augmented matrix.
Let's call this augmented matrix [M]. Using only the elementary row operations, you cantransform this matrix into the solution matrix. You need both m21 and m12 to be 0, and youneed both m11 and m22 to be 1.
Add –2.5 times row 1 to row 2 to get 0 form21.
Multiply equation 1 by –2.5 and add to row 2 toeliminate x.
Multiply row 2 by 2 to change m22 to 1. Multiply the equation by 2 to find y. y = 1
Add –1 times row 2 to row 1 to get 0 for m12. Multiply –1 by this new equation, and add theresult to the first equation to eliminate y.
Multiply row 1 by 0.5. Multiply the equation by 0.5 to find x. x = 2
The last column of the solution matrix indicates that the solution to the system is(2, 1).
© 2004 Key Curriculum Press LESSON 6.3 Row Reduction Method 319
Lesson http://acr.keypress.com/KeyPressPortalV3.0/Viewer/Lesson.htm
2 de 9 31-03-2009 21:03

320 CHAPTER 6 Matrices and Linear Systems © 2004 Key Curriculum Press
You can represent row operations symbolically. For example, you can use R1 and R2 torepresent the two rows of a matrix, as in Example A, and show the steps this way:
The number of games a soccer league must schedule depends on the number ofteams playing in that league. This table shows the number of games required for each teamin a league to play every other team twice, once at each team's home field. In thisinvestigation you will find a function that describes the number of games for any numberof teams.
Number of teams 1 2 3 4 5 6 7 Number of games 0 2 6 12 20 30 42
Step 1 Make a scatter plot of these data. Let x represent the number of teams, and let y
represent the number of games. Describe the graph. Is it linear?
Step 2
Based on the shape of the graph, the equation could be quadratic. You canwrite a quadratic equation in the form y = ax2 + bx + c. You can use each pairof values in the table to write an equation by substituting x and y. Create threeequations with the variables a, b, and c by substituting any three pairs ofcoordinates from the above table. For example, the point (5, 20) creates theequation a(5)2 + b(5) + c = 20, or 25a + 5b + c = 20.
League Play
Lesson http://acr.keypress.com/KeyPressPortalV3.0/Viewer/Lesson.htm
3 de 9 31-03-2009 21:03

Step 3 You can now solve for the coefficients a, b, and c. Write a 3 4 augmented matrix for yoursystem of three equations.
Step 4 Find the row operations that will give 0 for m13 and m23. Describe the operations and write
them symbolically using R1, R2, and R3.
Step 5 Find row operations that give 0's in the other nondiagonal entries of your augmented matrix.Write all the row operations in terms of R1, R2, and R3.
Step 6 Find row operations that give 1's along the main diagonal. Your matrix should now be in
the form
What does this mean about your equation, y = ax2 + bx + c? Verify that youhave the correct values for a, b, and c.
Step 7 Write a summary of the steps you followed to solve this problem. Describe any problems
you ran into and any tricks or shortcuts you found.
Equations such as 2x + y = 5 or y = 3x + 4 are called linear equations becausetheir graphs in the coordinate plane are always lines. You may also notice thatin linear equations the highest power of x or y is 1 and that x and y are nevermultiplied together. Equations in three variables such as 2x + y + 3z = 12, wherethe highest power is 1, are also called linear equations. In the investigation youused an augmented matrix to solve a system of three linear equations in threevariables. Here's another example of solving a larger system with the help of matrices.
© 2004 Key Curriculum Press LESSON 6.3 Row Reduction Method 321
Lesson http://acr.keypress.com/KeyPressPortalV3.0/Viewer/Lesson.htm
4 de 9 31-03-2009 21:03

EXAMPLE B The junior class treasurer is totaling the sales and receipts from the last book sale. She has50 receipts for sales of three different titles of books priced at $14.00, $18.50, and $23.25.She has a total of $909.00 and knows that 22 more of the $18.50 books sold than the $23.25books. How many of each book were sold?
Solution The numbers sold of the three different book titles are unknown, so you can assign threevariables.
x = the number of $14.00 books y = the number of $18.50 books z = the number of $23.25 books
Based on the information in the problem, write a system of three linear equations. Thesystem can also be written as an augmented matrix.
Here is one possible sequence of row operations to obtain a solution matrix. Try these rowoperations to see how they transform the augmented matrix into reduced row-echelon form.[ See Calculator Note 6D to learn how to do row operations on your calculator. ]
This means that 12 of the $14.00 books, 30 of the $18.50 books, and 8 ofthe $23.25 books were sold.
322 CHAPTER 6 Matrices and Linear Systems © 2004 Key Curriculum Press
Lesson http://acr.keypress.com/KeyPressPortalV3.0/Viewer/Lesson.htm
5 de 9 31-03-2009 21:03
Some systems of equations have no solution, and others have infinitely manysolutions. Likewise, not all augmented matrices can be reduced to row-echelonform. An entire row of 0's means that one equation is equivalent to another;therefore, not enough information was given to find a single solution, so thereare infinitely many solutions. If, on the other hand, an entire row reduces to 0's,except for a nonzero constant in the last entry, no solution exists because a set of0 coefficients cannot result in a nonzero constant on the right side of theequation.
EXERCISES
Practice Your Skills
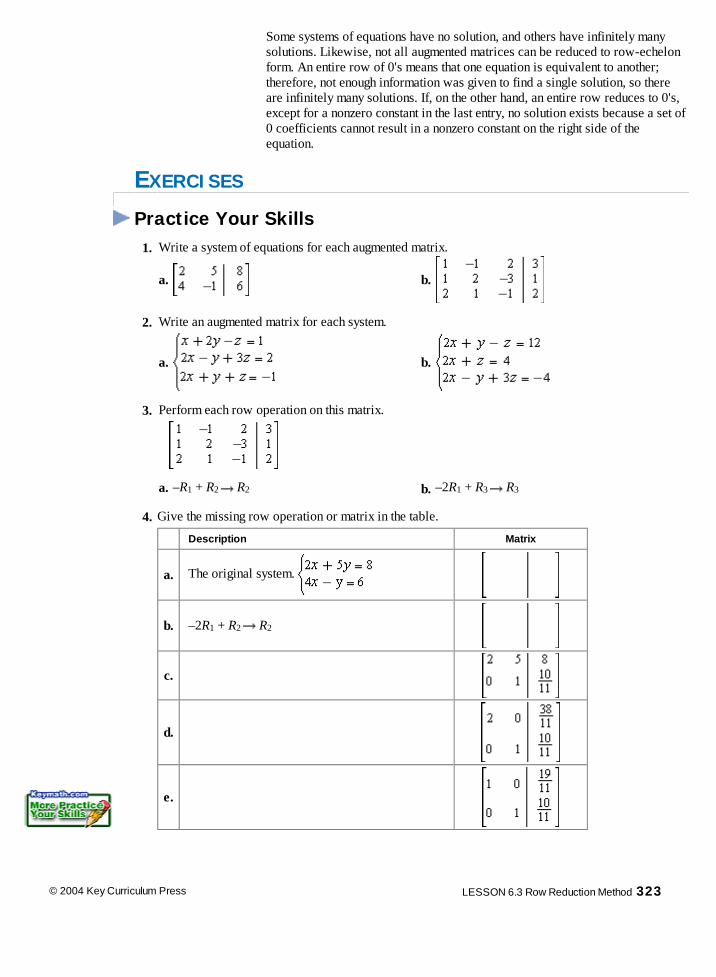
1. Write a system of equations for each augmented matrix.
a. b.
2. Write an augmented matrix for each system.
a. b.
3. Perform each row operation on this matrix.
a. –R1 + R2 R2 b. –2R1 + R3 R3
4. Give the missing row operation or matrix in the table.
Description Matrix
a. The original system.
b. –2R1 + R2 R2
c.
d.
e.
© 2004 Key Curriculum Press LESSON 6.3 Row Reduction Method 323
Lesson http://acr.keypress.com/KeyPressPortalV3.0/Viewer/Lesson.htm
6 de 9 31-03-2009 21:03

Reason and Apply
5. Rewrite each system of equations as an augmented matrix. If possible, transform the matrix into its reducedrow-echelon form using row operations on your calculator.
a. b.
c.
d.
6. A farmer raises only goats and chickens on his farm. All together he has 47 animals, and they have a total of 118legs.
a. Write a system of equations and an augmented matrix. How many of each animal does he have? [ SeeCalculator Note 6E to learn how to transform a matrix to reduced row-echelon form on your calculator. ]
b. The farmer's neighbor also has goats and chickens. She reports having 118 animals with a total of 47 legs.Write a system of equations and an augmented matrix. How many of each animal does she have?
7. The largest angle of a triangle is 4° more than twice the smallest angle. The smallest angle is 24° less than themidsize angle. What are the measures of the three angles?
8. APPLICATION The amount of merchandise that is available for sale is called supply. The amount of
merchandise that consumers want to buy is called demand. Supply and demand are in equilibrium, or balance,when a price is found that makes supply and demand equal.
Suppose the following data represent supply and demand for a drink manufacturer.
Supply for Mega-Fruit Demand for Mega-FruitPrice
(cents/gal)Quantity
(millions of gal) Price(cents/gal)
Quantity(millions of gal)
80 1304.4 80 3268.4790 2894 90 2724.87
100 4483.6 100 2181.27110 6073.2 110 1637.67120 7662.8 120 1094.07
324 CHAPTER 6 Matrices and Linear Systems © 2004 Key Curriculum Press
Lesson http://acr.keypress.com/KeyPressPortalV3.0/Viewer/Lesson.htm
7 de 9 31-03-2009 21:03

a. Find linear models for the supply and demand.
b. Find the equilibrium point graphically.
c. Write the supply and demand equations from 8a as a system in an augmented matrix.Use row reduction to verify your answer to 8b.
Supply and demand are affected by many things.The supply may be affected by the price of themerchandise, the cost of making it, or unexpectedevents that affect supply, like drought orhurricanes. Demand may be affected by the price,the income level of the consumer, or consumertastes. An increased price may slow the purchaseof the product and thus also increase supply. Thestock market illustrates how prices are determinedthrough the interaction of supply and demand inan auction-like environment.
In New York City, January 1996, grocery storeshelves emptied as residents stocked up for asevere snowstorm. Unexpected events like thiscan cause high demand and deplete supply.
9. Find a, b, and c such that the graph of y = ax2 + bx + c passes through the points (1, 3), (4, 24), and (–2, 18).
10. The yearbook staff sells ads in three sizes. The full-page ads sell for $200, the half-page ads sell for $125, and
the business-card-size ads sell for $20. All together they earned $1715 from 22 ads. There were four times asmany business-card-size ads sold as full-page ads. How many of each ad type did they sell?
Honduran-American dancer Homer Avilaperformed a solo work titled Not/Without Wordsin February 2002, one year after losing his legand part of his hip to cancer.
Review
11. APPLICATION The Life is a Dance troupehas two choices in how it will be paid forits next series of performances. The firstoption is to receive $12,500 for the seriesplus 5% of all ticket sales. The secondoption is $6,800 for the series plus 15%of ticket sales. The company will performthree consecutive nights in a hall that seats2,200 people. All tickets will cost $12.
a. How much will the troupe receiveunder each plan if a total of 3500tickets are sold for all threeperformances?
b. Write an equation that gives the amount the troupewill receive under the first plan for any number of tickets sold.
c. Write an equation that gives the amount the troupe will receive under the secondplan for any number of tickets sold.
d. How many tickets must the troupe sell for the second plan to be the betterchoice?
e. Which plan should the troupe choose? Justify your choice.
© 2004 Key Curriculum Press LESSON 6.3 Row Reduction Method 325
Lesson http://acr.keypress.com/KeyPressPortalV3.0/Viewer/Lesson.htm
8 de 9 31-03-2009 21:03

326 CHAPTER 6 Matrices and Linear Systems © 2004 Key Curriculum Press
12. Consider this graph of a system of two linear equations.a. What is the solution to this system?
b. Write equations for the two lines.
13. For each segment shown in the pentagon at right, write anequation in point-slope form for the line that contains thesegment. Check your equations by graphing them on yourcalculator.
14. Consider the graph of ABC.a. Represent ABC with a matrix [M].b. Find each product and graph the image of the triangle
represented by the result.
i.
ii.
Graphically, a system of two linear equations in two variables can be represented by two lines. Ifthe lines intersect, the point of intersection is the solution and the system is called consistent andindependent. If the lines are parallel, they never intersect, there is no solution, and the system iscalled inconsistent. If the lines are the same, there are infinitely many solutions, and the system iscalled consistent and dependent.
An equation such as 3x + 2y + 6z = 12 is also called a linear equation because the highest power ofany variable is 1. But, because there are three variables, the graph of this equation is a plane.
Graphically, a system of three linear equations in three variables can be represented by three planes.Sketch all the possible outcomes for the graphs of three planes. Classify each outcome as consistent,inconsistent, dependent, and/or independent.
Lesson http://acr.keypress.com/KeyPressPortalV3.0/Viewer/Lesson.htm
9 de 9 31-03-2009 21:03
Things that opposeeach other alsocomplement eachother.
CHINESE SAYING
Solving Systems withInverse Matrices
Consider the equation ax = b. To solve for x, you multiply both sides of the equationby , the multiplicative inverse of a. The multiplicative inverse of a nonzero number,such as 2.25, is the number that you can multiply by 2.25 to get 1. Also, the number 1 isthe multiplicative identity because any number multiplied by 1 remains unchanged.
Similarly, to solve a system by using matrices, you can use an inverse matrix. If aninverse matrix exists, then when you multiply it by the system matrix you will get thematrix equivalent of 1, which is called the identity matrix. Any square matrixmultiplied on either side by the identity matrix of the same dimensions remainsunchanged, just as any number multiplied by 1 remains unchanged. In Example A, youwill first use this multiplicative identity to find a 2 2 identity matrix.
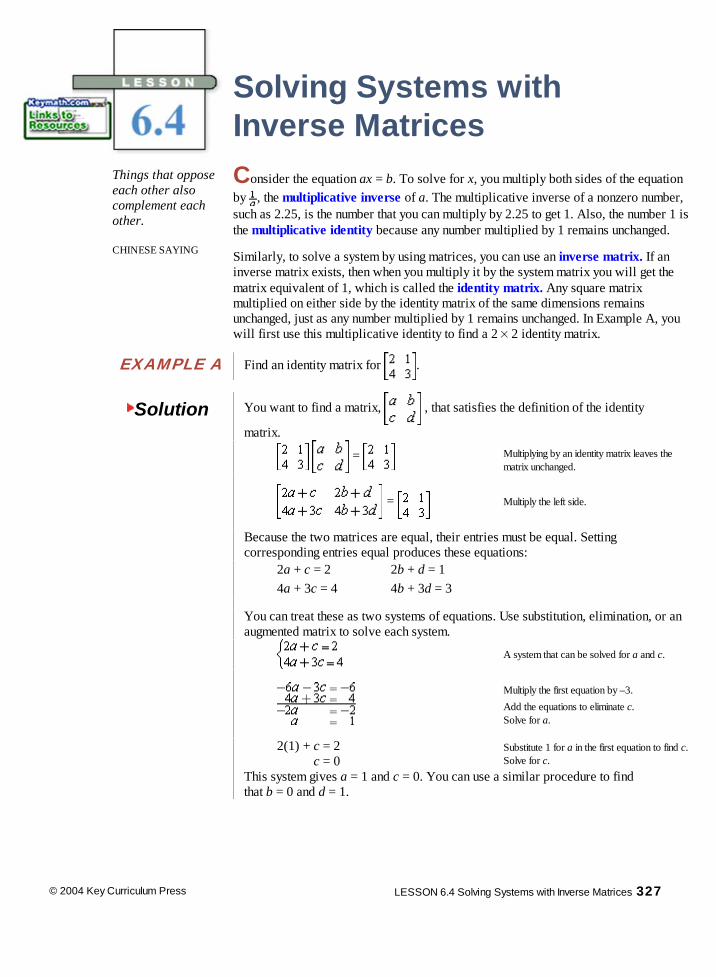
EXAMPLE A Find an identity matrix for .
Solution You want to find a matrix, , that satisfies the definition of the identity
matrix. = Multiplying by an identity matrix leaves the
matrix unchanged.
= Multiply the left side.
Because the two matrices are equal, their entries must be equal. Settingcorresponding entries equal produces these equations:
2a + c = 2 2b + d = 1 4a + 3c = 4 4b + 3d = 3
You can treat these as two systems of equations. Use substitution, elimination, or anaugmented matrix to solve each system.
A system that can be solved for a and c.
Multiply the first equation by –3.
Add the equations to eliminate c.Solve for a.
2(1) + c = 2 c = 0
Substitute 1 for a in the first equation to find c.Solve for c.
This system gives a = 1 and c = 0. You can use a similar procedure to findthat b = 0 and d = 1.
© 2004 Key Curriculum Press LESSON 6.4 Solving Systems with Inverse Matrices 327
Lesson http://acr.keypress.com/KeyPressPortalV3.0/Viewer/Lesson.htm
1 de 9 31-03-2009 21:04

328 CHAPTER 6 Matrices and Linear Systems © 2004 Key Curriculum Press
The 2 2 identity matrix is
Can you see why multiplying this matrix by any 2 2 matrix results in thesame 2 2 matrix?
The identity matrix in Example A is the identity matrix for all 2 2 matrices. Take a minute tomultiply [I][A] and [A][I] with any 2 2 matrix. There are corresponding identity matrices forlarger square matrices.
Identity Matrix
An identity matrix, symbolized by [I], is the square matrix that does not alter the entries of asquare matrix [A] under multiplication.
[A][I] = [A] and [I][A] = [A]
Matrix [I] must have the same dimensionsas matrix [A], and it has entries of 1'salong the main diagonal (from top left tobottom right) and 0's in all other entries.
Now that you know the identity matrixfor a 2 2 matrix, you can look for away to find the inverse of a 2 2 matrix.
Inverse Matrix
The inverse matrix of [A], symbolized by [A]–1, is the matrix that will produce an identitymatrix when multiplied by [A].
[A][A]–1 = [I] and [A]–1[A] = [I]
In this investigation you will learn ways to find the inverse of a 2 2 matrix.
Step 1 Use the definition of an inverse matrix to set up a matrix equation. Use these matrices and the 2 2 identity matrix for [I].
[A] = [A]-1 =
Step 2 Use matrix multiplication to find the product of [A][A]–1. Set that product equal to matrix [I].
InvestigationThe Inverse Matrix
Lesson http://acr.keypress.com/KeyPressPortalV3.0/Viewer/Lesson.htm
2 de 9 31-03-2009 21:04

Step 3 Use the matrix equation from Step 2 to write equations that you can solve to find values for a,b, c, and d. Solve the systems to find the values in the inverse matrix.
Step 4
Use your calculator to find [A]–1. If this answer does not match your answer to Step 3, checkyour work for mistakes. [ See Calculator Note 6F to learn how to find the inverse on yourcalculator. ]
Step 5 Find the products of [A][A]–1 and [A]–1[A]. Do they both give you ? Is matrix
multiplication always commutative?
Step 6 Not every square matrix has an inverse. Find the inverse of each of these matrices, if oneexists. Make a conjecture about what types of 2 2 square matrices do not have inverses.
a. b. c. d.
Step 7 Can a nonsquare matrix have an inverse? Why or why not?
You now know how to find the inverse of a square matrix, both by hand and on your calculator.You can use an inverse matrix to solve a system of equations.
Solving a System Using the Inverse Matrix
A system of equations in standard form can be written in matrix form as [A][X] = [B],where [A] is the coefficient matrix, [X] is the variable matrix, and [B] is the constant matrix.Multiplying both sides by the inverse matrix, [A]–1, with the inverse on the left, gives thevalues of variables in matrix [X], which is the solution to the system.
[A][X] = [B] The system in matrix form.
[A]–1[A][X] = [A]–1[B] Left-multiply both sides by the inverse.
[I][X] = [A]–1[B] By the definition of inverse, [A]–1[A] = [I].
[X] = [A]–1[B] By the definition of identity, [I][X] = [X].
EXAMPLE B Solve this system using an inverse matrix.
Solution First, rewrite the second equation in standard form.
The matrix equation for this system is
© 2004 Key Curriculum Press LESSON 6.4 Solving Systems with Inverse Matrices 329
Lesson http://acr.keypress.com/KeyPressPortalV3.0/Viewer/Lesson.htm
3 de 9 31-03-2009 21:04
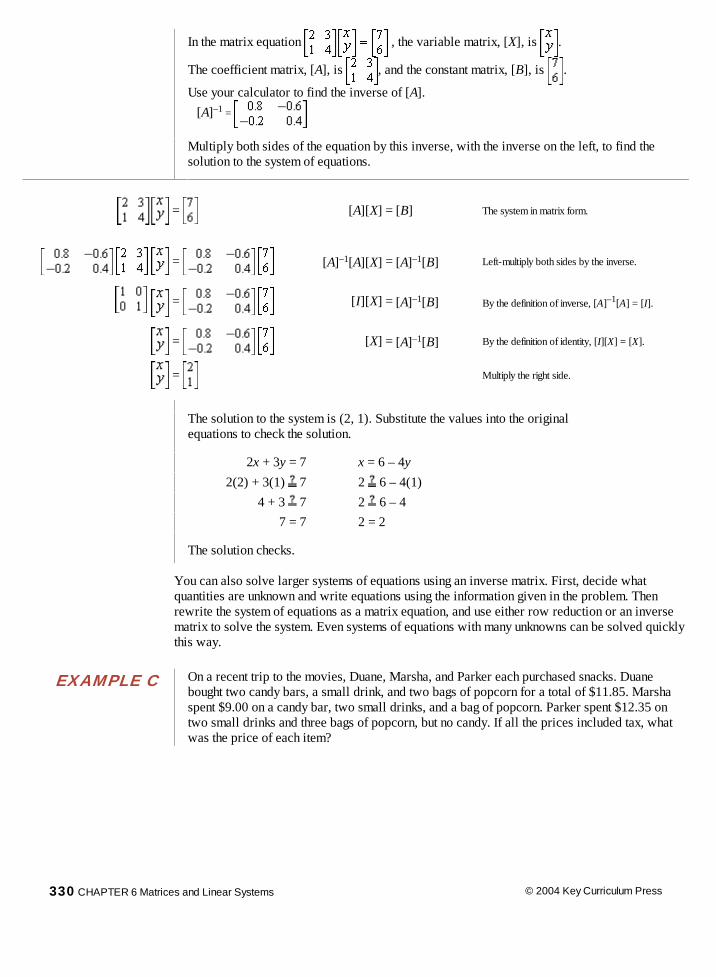
In the matrix equation , the variable matrix, [X], is .
The coefficient matrix, [A], is , and the constant matrix, [B], is .
Use your calculator to find the inverse of [A].
[A]–1 =
Multiply both sides of the equation by this inverse, with the inverse on the left, to find thesolution to the system of equations.
= [A][X] = [B] The system in matrix form.
= [A]–1[A][X] = [A]–1[B] Left-multiply both sides by the inverse.
= [I][X] = [A]–1[B] By the definition of inverse, [A]–1[A] = [I].
= [X] = [A]–1[B] By the definition of identity, [I][X] = [X].
= Multiply the right side.
The solution to the system is (2, 1). Substitute the values into the originalequations to check the solution.
2x + 3y = 7 x = 6 – 4y 2(2) + 3(1) 7 2 6 – 4(1) 4 + 3 7 2 6 – 4 7 = 7 2 = 2
The solution checks.
You can also solve larger systems of equations using an inverse matrix. First, decide whatquantities are unknown and write equations using the information given in the problem. Thenrewrite the system of equations as a matrix equation, and use either row reduction or an inversematrix to solve the system. Even systems of equations with many unknowns can be solved quicklythis way.
EXAMPLE C
On a recent trip to the movies, Duane, Marsha, and Parker each purchased snacks. Duanebought two candy bars, a small drink, and two bags of popcorn for a total of $11.85. Marshaspent $9.00 on a candy bar, two small drinks, and a bag of popcorn. Parker spent $12.35 ontwo small drinks and three bags of popcorn, but no candy. If all the prices included tax, whatwas the price of each item?
330 CHAPTER 6 Matrices and Linear Systems © 2004 Key Curriculum Press
Lesson http://acr.keypress.com/KeyPressPortalV3.0/Viewer/Lesson.htm
4 de 9 31-03-2009 21:04

Solution The prices of the items are the unknowns. Let c represent the price of a candy bar in dollars,let d represent the price of a small drink in dollars, and let p represent the price of a bag ofpopcorn in dollars. This system represents the three friends' purchases:
Translate these equations into a matrix equation in the form [A][X] = [B].
The solution to the system is simply the product [A]–1[B].
[X] = [A]–1[B] =
A candy bar costs $2.15, a small drink costs $2.05,and a bag of popcorn costs $2.75.
Substituting these answers into the original systemshows that they are correct. You can use yourcalculator to evaluate the expressions quickly andaccurately.
You have probably noticed that in order to solve systems ofequations with two variables, you must have two equations. Tosolve a system of equations with three variables, you must havethree equations. In general, you must have as many equations asvariables. Otherwise, there will not be enough information to solvethe problem. For matrix equations, this means that the coefficientmatrix must be square.
If there are more equations than variables, often one equation is equivalent to another equationand therefore just repeats the same information. Or the extra information may contradict theother equations, and thus there is no solution that will satisfy all the equations.
EXERCISES
Practice Your Skills
1. Rewrite each system of equations in matrix form.
a. b. c. d.
© 2004 Key Curriculum Press LESSON 6.4 Solving Systems with Inverse Matrices 331
Lesson http://acr.keypress.com/KeyPressPortalV3.0/Viewer/Lesson.htm
5 de 9 31-03-2009 21:04

2. Multiply each pair of matrices. If multiplication is not possible, explain why.
a. b. c.
3. Use matrix multiplication to expand each system. Then solve for each variable by using substitution orelimination.
a. = b. =
4. Multiply each pair of matrices. Are the matrices inverses of each other?
a. b.
5. Find the inverse of each matrix by solving the matrix equation [A][A]-1 = [I]. Then find the inversematrix on your calculator to check your answer.
a. b. c. d.
Reason and Apply 6. Rewrite each system in matrix form and solve by using the inverse matrix. Check your solutions.
a. b.
c. d.
7. At the High Flying Amusement Park there are three kinds ofrides: Jolly rides, Adventure rides, and Thrill rides.Admission is free when you buy a book of tickets, whichincludes ten tickets for each type of ride. Or you can pay$5.00 for admission and then buy tickets for each of therides individually. Noah, Rita, and Carey decide to pay theadmission price and buy individual tickets. Noah pays$19.55 for 7 Jolly rides, 3 Adventure rides, and 9 Thrillrides. Rita pays $13.00 for 9 Jolly rides, 10 Adventurerides, and no Thrill rides. Carey pays $24.95 for 8 Jollyrides, 7 Adventure rides, and 10 Thrill rides. (The pricesabove do not include the admission price.)
a. How much does each type of ride cost? b. What is the total cost of a 30-ride book of tickets?
c. Would Noah, Rita, or Carey have been better off purchasing a ticket book?
332 CHAPTER 6 Matrices and Linear Systems © 2004 Key Curriculum Press
Lesson http://acr.keypress.com/KeyPressPortalV3.0/Viewer/Lesson.htm
6 de 9 31-03-2009 21:04
8. A family invested a portion of $5000 in an account at 6% annual interest and the rest in an account at 7.5%
annual interest. The total interest they earned in the first year was $340.50. How much did they invest in eachaccount?
9. The midsize angle of a triangle is 30° greater than the smallest angle. The largest angle is 10° more than twicethe midsize angle. What are the measures of the three angles?
10. Being able to solve a system of equations is definitely not "new" mathematics. Mah v ra, the best-known Indianmathematician of the 9th century, worked the following problem. See if you can solve it.
The mixed price of 9 citrons and 7 fragrant wood apples is 107; again, the mixed price of 7 citrons and 9fragrant wood apples is 101. O you arithmetician, tell me quickly the price of a citron and of a wood applehere, having distinctly separated those prices well.
Mah v ra (ca. 800-870 C.E.) wrote Ganita SaraSamgraha, the first Indian text exclusively aboutmathematics. Writing in his home of Mysore, India,he considered this book to be a collection of insightsfrom other Indian mathematicians, such as ryabataI, Bh skara I, and Brahmagupta, who wrote theirfindings in astronomy texts.
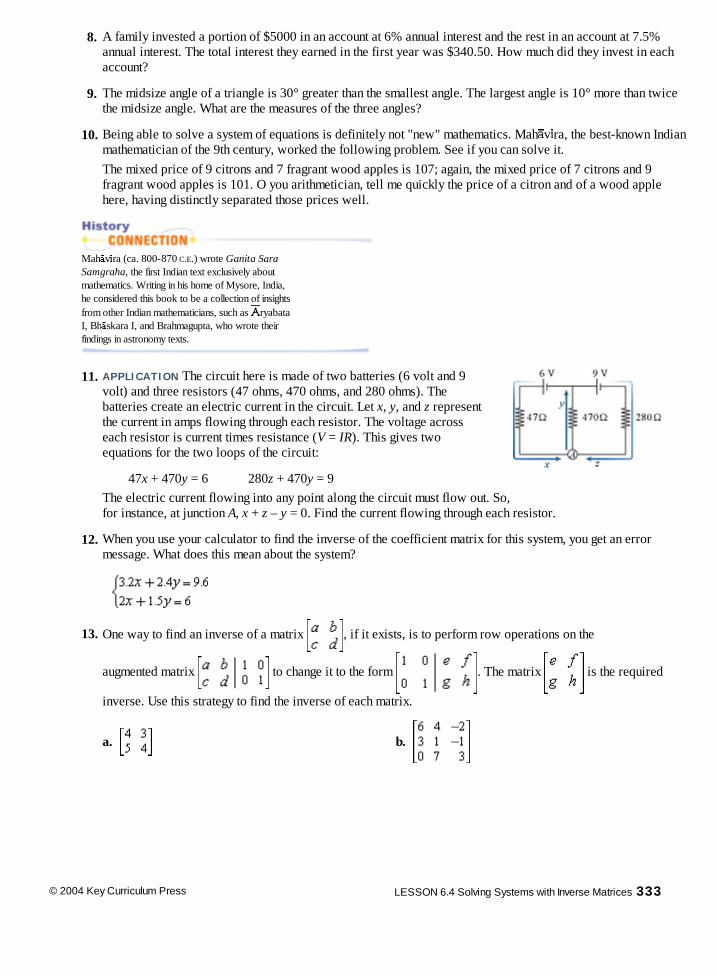
11. APPLICATION The circuit here is made of two batteries (6 volt and 9volt) and three resistors (47 ohms, 470 ohms, and 280 ohms). Thebatteries create an electric current in the circuit. Let x, y, and z representthe current in amps flowing through each resistor. The voltage acrosseach resistor is current times resistance (V = IR). This gives twoequations for the two loops of the circuit:
47x + 470y = 6 280z + 470y = 9
The electric current flowing into any point along the circuit must flow out. So,for instance, at junction A, x + z – y = 0. Find the current flowing through each resistor.
12. When you use your calculator to find the inverse of the coefficient matrix for this system, you get an error
message. What does this mean about the system?
13. One way to find an inverse of a matrix , if it exists, is to perform row operations on the
augmented matrix to change it to the form . The matrix is the required
inverse. Use this strategy to find the inverse of each matrix.
a. b.
© 2004 Key Curriculum Press LESSON 6.4 Solving Systems with Inverse Matrices 333
Lesson http://acr.keypress.com/KeyPressPortalV3.0/Viewer/Lesson.htm
7 de 9 31-03-2009 21:04

14. APPLICATION An important application in the study of economics is the study of the relationship betweenindustrial production and consumer demand. In creating an economic model, Russian-American economistWassily Leontief (1906–1999) noted that the total output less the internal consumption equals consumerdemand. Mathematically his input-output model looks like [X] – [A][X] = [D], where [X] is the total outputmatrix, [A] is the input-output matrix, and [D] is the matrix representing consumer demand.
Here is an input-output matrix, [A], for a simple three-sector economy:
For instance, the first column tells the economist that to produce an output of 1 unit of agricultural productsrequires the consumption (input) of 0.2 unit of agricultural products, 0.2 unit of manufacturing products,and 0.1 unit of service products.
The demand matrix, [D], represents millions of dollars. Use the equation [X] – [A][X] = [D] to find theoutput matrix, [X].
[D] =
During World War II, Wassily Leontief's methodbecame a critical part of planning for wartimeproduction in the United States. As a consultantto the U.S. Labor Department, he developed aninput-output table for more than 90 economicsectors. During the early 1960s, Leontief andeconomist Marvin Hoffenberg used input-outputanalysis to forecast the economic effects ofreduction or elimination of militaries. In 1973,Leontief was awarded a Nobel Prize in economicsfor his contributions to the field.
Wassily Leontief
Review
15. For each equation, write a second linear equation that would create a consistent and dependent system.
a. y = 2x + 4 b. y = – x – 3 c. 2x + 5y = 10 d. x – 2y = –6
334 CHAPTER 6 Matrices and Linear Systems © 2004 Key Curriculum Press
Lesson http://acr.keypress.com/KeyPressPortalV3.0/Viewer/Lesson.htm
8 de 9 31-03-2009 21:04
© 2004 Key Curriculum Press LESSON 6.4 Solving Systems with Inverse Matrices 335
16. For each equation, write a second linear equation that would create an inconsistent system.
a. y = 2x + 4 b. y = – x – 3 c. 2x + 5y = 10 d. x – 2y = –6
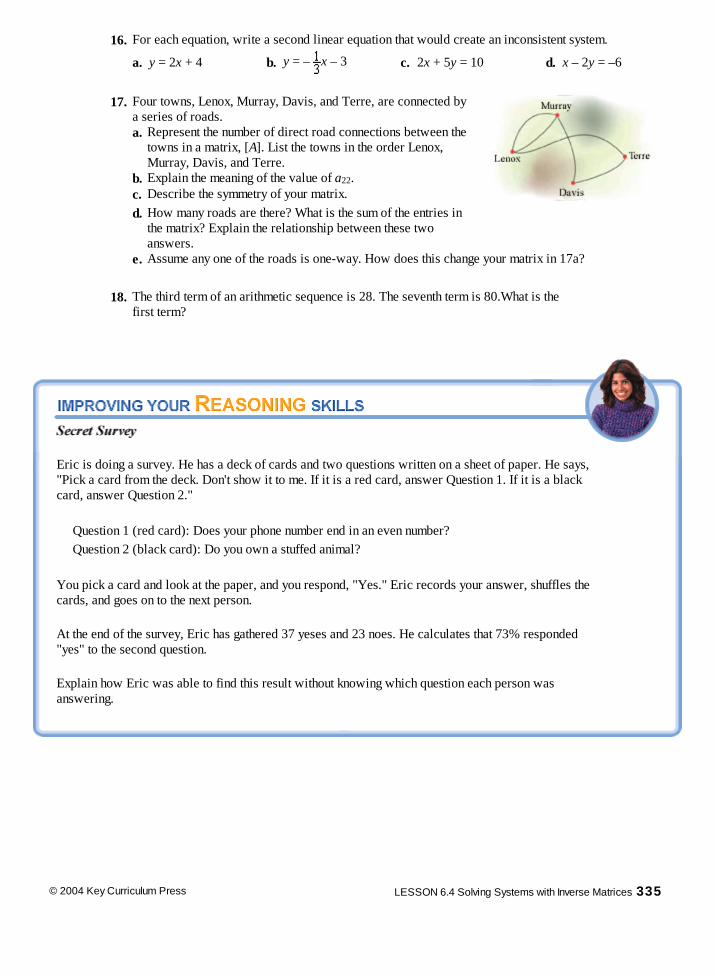
17. Four towns, Lenox, Murray, Davis, and Terre, are connected by
a series of roads.
a. Represent the number of direct road connections between the
towns in a matrix, [A]. List the towns in the order Lenox,Murray, Davis, and Terre.
b. Explain the meaning of the value of a22. c. Describe the symmetry of your matrix.
d. How many roads are there? What is the sum of the entries in
the matrix? Explain the relationship between these twoanswers.
e. Assume any one of the roads is one-way. How does this change your matrix in 17a? 18. The third term of an arithmetic sequence is 28. The seventh term is 80.What is the
first term?
Eric is doing a survey. He has a deck of cards and two questions written on a sheet of paper. He says,"Pick a card from the deck. Don't show it to me. If it is a red card, answer Question 1. If it is a blackcard, answer Question 2." Question 1 (red card): Does your phone number end in an even number? Question 2 (black card): Do you own a stuffed animal? You pick a card and look at the paper, and you respond, "Yes." Eric records your answer, shuffles thecards, and goes on to the next person. At the end of the survey, Eric has gathered 37 yeses and 23 noes. He calculates that 73% responded"yes" to the second question. Explain how Eric was able to find this result without knowing which question each person wasanswering.
Lesson http://acr.keypress.com/KeyPressPortalV3.0/Viewer/Lesson.htm
9 de 9 31-03-2009 21:04

336 CHAPTER 6 Matrices and Linear Systems © 2004 Key Curriculum Press
Systems of LinearInequalitiesFrequently, real-world situations involve a range of possible values. Algebraicstatements of these situations are called inequalities.
Situation Inequality
Write an essay between two and five pages in length. 2 E 5 Practice more than an hour each day. P > 1 The post office is open from nine o'clock until noon. 9 H 12 Do not spend more than $10 on candy and popcorn. c + p 10 A college fund has $40,000 to invest in stocks and bonds. s + b 40000
Recall that you can perform operations on inequalities very much like you do onequations. You can add or subtract the same quantity on both sides, multiply by the samenumber or expression on both sides, and so on. The one exception to remember is thatwhen you multiply or divide by a negative quantity or expression, the inequality symbolreverses.
The cost of a collegeeducation continues to rise.The good news is that over$90 billion is available infinancial aid. At four-yearpublic colleges, for example,over 60% of students receivesomeform of financial aid.Financial aid makescollege affordable formany students, despiteincreasing costs.
In this lesson you will learn how to graphically show solutions to inequalities with twovariables, such as the last two statements in the table above.
Range and Weighted Mean ofCollege Tuition and Fees, 2002-2003 Trends in College Financial Aid
A total of $40,000 has been donated to a college scholarship fund. The administrators ofthe fund are considering how much to invest in stocks and how much to invest in bonds.Stocks usually pay more but are a riskier investment, whereas bonds pay less but aresafer.
Step 1 Let x represent the amount in dollars invested in stocks, and let y represent the amount
in dollars invested in bonds. Graph the equation x + y = 40000.
Paying for College
Lesson http://acr.keypress.com/KeyPressPortalV3.0/Viewer/Lesson.htm
1 de 8 31-03-2009 21:05

Step 2 Name at least five pairs of x- and y-values that satisfy the inequality x + y < 40000 and plotthem on your graph. In this problem, why can x + y be less than $40,000?
Step 3 Describe where all possible solutions to the inequality x + y < 40000 are located. Shade this
region on your graph.
Step 4 Describe some points that fit the condition x + y 40000 but do not make sense for the
situation.
Assume that each option-stocks or bonds-requires a minimum investment of $5000, and that thefund administrators want to purchase some stocks and some bonds. Based on the advice of theirfinancial advisor, they decide that the amount invested in bonds should be at least twice theamount invested in stocks.
Step 5 Translate all of the limitations, or constraints, into a system of inequalities. A table mighthelp you to organize this information.
Step 6 Graph all of the inequalities and determine the region of your graph that will satisfy all theconstraints. Find each corner, or vertex, of this region.
When there are one or two variables in an inequality, you can represent the solution as a set ofordered pairs by shading the region of the coordinate plane that contains those points.
When you have several inequalities that must be satisfied simultaneously, youhave a system. The solution to a system of inequalities with two variables will bea set of points rather than a single point. This set of points is called a feasibleregion. The feasible region can be shown graphically as part of a plane, orsometimes it can be described as a geometric shape with its vertices given.
© 2004 Key Curriculum Press LESSON 6.5 Systems of Linear Inequalities 337
Lesson http://acr.keypress.com/KeyPressPortalV3.0/Viewer/Lesson.htm
2 de 8 31-03-2009 21:05

EXAMPLE
Rachel has 3 hours to work on her homeworktonight. She wants to spend more time working onmathematics than on chemistry, and she must spend atleast a half hour working on chemistry. State theconstraints of this system algebraically with xrepresenting mathematics time in hours and yrepresenting chemistry time in hours. Graph yourinequalities, shade the feasible region, and label itsvertices.
Solution Convert each constraint into an algebraic inequality.
Rachel has 3 h to work on homework.
She wants to spend more time working on mathematicsthan on chemistry.
She must spend at least a half hour working on chemistry.
To graph the inequality x + y 3, or y – x + 3,first graph y = –x + 3. Use a solid line because y can be equal to –x + 3. This line divides theplane into two regions. One region contains allof the points for which y is less than –x + 3, andthe other region contains all of the points forwhich y is greater than –x + 3.
To find which side to shade, choose a samplepoint on either side of the line. Test the coordinatesof this point in the inequality to see if it makes a truestatement. If it does, then it falls in the region thatsatisfies the inequality, so shade on the side of theline where the point lies. If it doesn't, shade on theother side of the line. For example, if you choose (0,0), 0 – 0 + 3, or 0 3, is a true statement, so shadeon the side of the boundary line that contains (0, 0).
Follow the same steps to graph x > y and y 0.5on the same axes. The graph of x > y will containa dashed line. [ See Calculator Note 6G to learn howto graph systems of inequalities using your calculator. ]
338 CHAPTER 6 Matrices and Linear Systems © 2004 Key Curriculum Press
Lesson http://acr.keypress.com/KeyPressPortalV3.0/Viewer/Lesson.htm
3 de 8 31-03-2009 21:05

The solution to the system is the set of points in thearea that represents the overlap of all the shadedregions-the feasible region. Every point in thisregion is a possible solution to the system.
To define the area that represents the solutions, namethe vertices of the region. You can find the vertices byfinding the intersection of each pair of equations usingsubstitution, elimination, or matrices.
Equations Intersections
x + y = 3 and x = y (1.5, 1.5) x + y = 3 and y = 0.5 (2.5, 0.5) x = y and y = 0.5 (0.5, 0.5)
The solution to this system is all points in the interior of a triangle with vertices(1.5, 1.5), (2.5, 0.5), and (0.5, 0.5), and the points on the lower and right edges of thetriangle. Any point within this region represents a way that Rachel could divide hertime. For example, (1.5, 1) means she could spend 1.5 h on mathematics and 1 h onchemistry and still meet all her constraints. Notice, however, that (0.5, 0.5) is not asolution to the system, even though it is a vertex of the feasible region. The point(0.5, 0.5) does not meet the constraint x > y.
When you are solving a system of equations based on real-world constraints, it isimportant to note that sometimes there are constraints that are not specifically statedin the problem. In the example, negative values for x and y would not make sense,because you can't study for a negative number of hours. You could have added thecommonsense constraints x 0 and y 0, although in the example it would notaffect the feasible region.
EXERCISES
Practice Your Skills
1. Solve each inequality for y. a. 2x – 5y > 10 b. 4(2 – 3y) + 2x > 142. Graph each linear inequality.
a. y –2x + 5 b. 2y + 2x > 5 c. x > 53. For 3a-d, write the equation of each graph.
a. b.
© 2004 Key Curriculum Press LESSON 6.5 Systems of Linear Inequalities 339
Lesson http://acr.keypress.com/KeyPressPortalV3.0/Viewer/Lesson.htm
4 de 8 31-03-2009 21:05
c. d.
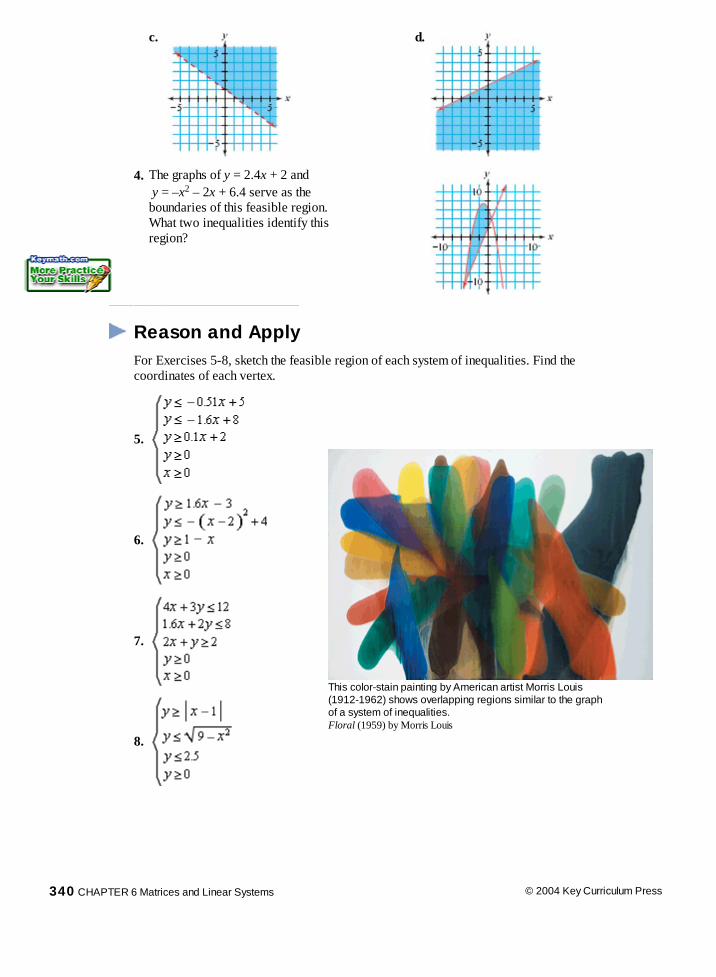
4. The graphs of y = 2.4x + 2 and y = –x2 – 2x + 6.4 serve as theboundaries of this feasible region.What two inequalities identify thisregion?
Reason and Apply
For Exercises 5-8, sketch the feasible region of each system of inequalities. Find thecoordinates of each vertex.
5.
This color-stain painting by American artist Morris Louis(1912-1962) shows overlapping regions similar to the graphof a system of inequalities.Floral (1959) by Morris Louis
6.
7.
8.
340 CHAPTER 6 Matrices and Linear Systems © 2004 Key Curriculum Press
Lesson http://acr.keypress.com/KeyPressPortalV3.0/Viewer/Lesson.htm
5 de 8 31-03-2009 21:05

9. In the Lux Art Gallery, rectangular paintings must
havean area between 200 in.2 and 300 in.2 and aperimeterbetween 66 in. and 80 in.
a. Write four inequalities involving length andwidththat represent these constraints.
b. Graph this system of inequalities to identifythefeasible region.
c. Will the gallery accept a painting thatmeasures
i. 12.4 in. by 16.3 in.? ii. 16 in. by 17.5 in.? iii. 14.3 in. by 17.5 in.?
American artist Nina Bovasso (b 1965) carriesone of herpaintings to an exhibition calledVir Heroicus Snoopicus. Would this piece,titled Black and White Crowd, be acceptedatthe Lux Art Gallery in Exercise 9?
10. APPLICATION As the altitude of a spacecraft increases, an astronaut's weight decreases
until a state of weightlessness is achieved. The weight of a 57 kg astronaut, W, at a givenaltitude in kilometers above Earth's sea level, x, is given by the formula
a. At what altitudes will the astronaut weigh less than 2 kg?
b. At an altitude of 400 km, how much will the astronaut weigh?
c. Will the astronaut ever be truly weightless? Why or why not?
Astronauts floating in space during the 1994testing of rescue system hardware appear to beweightless. One astronaut floats without beingtethered to the spacecraft by using a small controlunit.
A typical space shuttle orbits at an altitude of about400 km. At this height, an astronaut still weighsabout 88.8% of her weight on Earth. You haveprobably seen pictures in which astronauts in orbiton a space shuttle or space station appear to beweightless. This is actually not due to the absenceof gravity but, rather, to an effect called microgravity.In orbit, astronauts and their craft are being pulledtoward Earth by gravity, but their speed is such thatthey are in free fall around Earth, rather than towardEarth. Because the astronauts and their spacecraftare falling through space at the same rate, theastronauts appear to be floating inside the craft.This is similar to the fact that a car's driver canappear to be sitting still, although he is actuallytraveling at a speed of 60 mi/h.
© 2004 Key Curriculum Press LESSON 6.5 Systems of Linear Inequalities 341
Lesson http://acr.keypress.com/KeyPressPortalV3.0/Viewer/Lesson.htm
6 de 8 31-03-2009 21:05

11. Al just got rid of 40 of his dad's old records. He sold eachclassical record for $5 and each jazz record for $2. The restof the records could not be sold, so he donated them to athrift shop. Al knows that he sold fewer than 10 jazz recordsand that he earned more than $100.
a. Let x represent the number of classical records sold, andlet y represent the number of jazz records sold. Write aninequality expressing that Al earned more than $100.
b. Write an inequality expressing that he sold fewer than 10jazz records.
c. Write an inequality expressing that the total number of records sold was no more than 40.
d. Graph the solution to the system of inequalities, including any commonsense constraints.
e. Name all the vertices of the feasible region.
Review
12. A parabola with an equation in the form y = ax2 + bx + c passes through the points(–2, –32), (1, 7), and (3, 63).
a. Set up systems and use matrices to find the values of a, b, and c for this parabola.
b. Write the equation of this parabola.
c. Describe how to verify that your answer is correct.
13. These data were collected from a bouncing-ball experiment. Recall that the height incentimeters, y, is exponentially related to the number of the bounce, x. Find the valuesof a and b for an exponential model in the form y = abx .
Bounce number 3 7 Height (cm) 34.3 8.2
14. Complete the reduction of this augmented matrix to row-echelon form. Give each row operationand find each missing matrix entry.
15. APPLICATION The growth of a population of water fungus is modeled by the function y = f (x) = 2.68(3.84)x where x represents the number of hours elapsed and y represents the number of fungi spores.
a. How many spores are there initially?b. How many spores are there after 10 h?c. Find an inverse function that uses y as the dependent variable and x as the independent variable.d. Use your answer to 15c to find how long it will take until the number of spores exceeds 1 billion.
342 CHAPTER 6 Matrices and Linear Systems © 2004 Key Curriculum Press
Lesson http://acr.keypress.com/KeyPressPortalV3.0/Viewer/Lesson.htm
7 de 8 31-03-2009 21:05

© 2004 Key Curriculum Press LESSON 6.5 Systems of Linear Inequalities 343
Navajo recruits, like these two shown in the PacificIsland of Bougainville in 1943, shared their complexlanguage with U.S. Marines to communicate in codeduring World War II.
The Navajo language was used in coding messages bythe U.S. Marines in World War II, because it is acomplex unwritten language that is unintelligible toanyone without extensive training. Navajo code talkerscould encode, transmit, and decode three-line English messages in20 seconds, whereas machines of the time required 30 minutes toperform the same job. Navajo recruits developed the code, includinga dictionary and numerous words for military terms. Learn moreabout Navajo code talkers by using the links at
.
One of the uses of matrices is in the mathematical field of cryptography, the science ofenciphering and deciphering encoded messages. Here's one way that a matrix can beused to make a secret code:
Imagine encoding the word "CODE." First you convert each letter to a numerical value, based on itslocation in the alphabet. For example, C = 3 because it is the third letter in
the alphabet. So, CODE = 3, 15, 4, 5. Arrange these numbers in a 2 2 matrix:
Now multiply by an encoding matrix.
Let's use so
Now you have to convert back to letters. Notice that three of these numbers are outside of thenumbers 1-26 that represent A-Z. To convert other numbers, simply add or subtract 26 to makethem fall within the range of 1 to 26, like this:
Now, to decode the encoded message "NAYF," you convert back to numbers and multiply by the inverse ofthe coding matrix, and then you convert each number back into the corresponding letter in the alphabet:
See if you can decode this Navajo saying. Begin by taking out the spaces and breaking the letters intogroups of four letters each. CC FSLG GTQN YP OPIIY UCB DKIC BYF BEQQ WW URQLPRE.
Lesson http://acr.keypress.com/KeyPressPortalV3.0/Viewer/Lesson.htm
8 de 8 31-03-2009 21:05
344 CHAPTER 6 Matrices and Linear Systems © 2004 Key Curriculum Press
Love the momentand the energy ofthat moment willspread beyond allboundaries.
CORITA KENT
Linear ProgrammingIndustrial managers often investigate moreeconomical ways of doing business. Theymust consider physical limitations, standardsof quality, customer demand, availability ofmaterials, and manufacturing expenses asrestrictions, or constraints, that determinehow much of an item they can produce.Then they determine the optimum, or best,amount of goods to produce-usually tominimize production costs or maximize profit.The process of finding a feasible region anddetermining the point that gives the maximumor minimum value to a specific expression iscalled linear programming.
Polish artist Roman Cieslewicz(1930-1996) formed this 1988work by gluing strips of paperand fragments of photographson cardboard.Les dieux ont soif (1988) by RomanCieslewicz
Problems that can be modeled with linearprogramming may involve anywhere from twovariables to hundreds of variables.Computerized modeling programs that analyzeup to 200 constraints and 400 variables areregularly used to help businesses choosetheir best plan of action. In this lesson youwill look at problems that involve two variablesbecause you are relying on the visual assistance
of a two-dimensional graph to help you find the feasible region.
In this investigation you’ll explore a linear programming problem and makeconjectures about how to find the optimum value in the most efficient way.
The Elite Pottery Shoppe makes two kinds ofbirdbaths: a fancy glazed and a simple unglazed.An unglazed birdbath requires 0.5 h to makeusing a pottery wheel and 3 h in the kiln. Aglazed birdbath takes 1 h on the wheel and 18h in the kiln. The company's one potterywheel is available for at most 8 hours perday (h/d). The three kilns can be used a totalof at most 60 h/d. The company has a standingorder for 6 unglazed birdbaths per day, so it must produce at least that many. Thepottery shop's profit on each unglazed birdbath is $10, and the profit on each glazedbirdbath is $40. How many of each kind of birdbath should the company produce eachday in order to maximize profit?
Maximizing Profit
Lesson http://acr.keypress.com/KeyPressPortalV3.0/Viewer/Lesson.htm
1 de 7 31-03-2009 21:05

Step 1 Organize the information into a table like this one:
Amount per unglazedbirdbath
Amount per glazedbirdbath
Constrainingvalue
Wheel hours Kiln hours Profit Maximize
Step 2
Use your table to help you write inequalities that reflect the constraints given, and be sure toinclude any commonsense constraints. Let x represent the number of unglazed birdbaths, and let yrepresent the number of glazed birdbaths. Graph the feasible region to show the combinations ofunglazed and glazed birdbaths the shop could produce, and label the coordinates of the vertices.(Note: Profit is not a constraint; it is what you are trying to maximize.)
Step 3
It will make sense to produce only whole numbers of birdbaths. List the coordinates of all integerpoints within the feasible region. (There should be 23.) Remember that the feasible region mayinclude points on the boundary lines.
Step 4
Write the equation that will determine profit based on the number of unglazed and glazed birdbathsproduced. Calculate the profit that the company would earn at each of the feasible points you foundin Step 3. You may want to divide this task among the members of your group.
Step 5
What number of each kind of birdbath should the Elite Pottery Shoppe produce to maximize profit?What is the maximum profit possible? Plot this point on your feasible region graph. What do younotice about this point?
Step 6 Suppose that you want profit to be exactly $100. What equation would express this? Carefully
graph this line on your feasible region graph.
Step 7 Suppose that you want profit to be exactly $140. What equation would express this? Carefully addthis line to your graph.
Step 8
Suppose that you want profit to be exactly $170. Whatequation would express this? Carefully add this line to yourgraph.
Step 9
How do your results from Steps 6-8 show you that (14, 1)must be the point that maximizes profit? Generalize yourobservations to describe a method that you can use withother problems to find the optimum value. What would youdo if this vertex point did not have integer coordinates?What if you wanted to minimize profit?
Linear programming is a very useful real-world application of systems of inequalities. Its value isnot limited to business settings, as the following example shows.
© 2004 Key Curriculum Press LESSON 6.6 Linear Programming 345
Lesson http://acr.keypress.com/KeyPressPortalV3.0/Viewer/Lesson.htm
2 de 7 31-03-2009 21:05

EXAMPLE
Marco is planning a snack of graham crackers and blueberry yogurt to provide at his school'strack practice. Because he is concerned about health and nutrition, he wants to make sure thatthe snack contains no more than 700 calories and no more than 20 g of fat. He also wants atleast 17 g of protein and at least 30% of the daily recommended value of iron. The nutritionalcontent of each food is listed in the table below. Each serving of yogurt costs $0.30 and eachgraham cracker costs $0.06. What combination of servings of graham crackers and blueberryyogurt should Marco provide to minimize cost?
Serving Calories Fat Protein
Iron (percent of dailyrecommended value)
Graham crackers 1 cracker 60 2 g 2 g 6% Blueberry yogurt 4.5 oz 130 2 g 5 g 1%
Solution First organize the constraint information into a table, then write inequalities that reflect the
constraints. Be sure to include any commonsense constraints. Let x represent the number ofservings of graham crackers, and let y represent the number of servings of yogurt.
Amount per grahamcracker
Amount per servingof yogurt Limiting value
Calories 60 130 700 Fat 2 g 2 g 20 g Protein 2 g 5 g 17 g Iron 6% 1% 30% Cost $0.06 $0.30 Minimize
CaloriesFatProteinIronCommon senseCommon sense
Now graph the feasible region andfind the vertices.
Next, write an equation that will determine the costof a snack based on the number of servings of grahamcrackers and yogurt.
Cost = 0.06x + 0.30y You could try any possible
combination of graham crackers and yogurt that is in the feasible region, but recall that in theinvestigation it appeared that optimum values will occur at vertices Calculate the cost at each ofthe vertices to see which one is a minimum.
346 CHAPTER 6 Matrices and Linear Systems © 2004 Key Curriculum Press
Lesson http://acr.keypress.com/KeyPressPortalV3.0/Viewer/Lesson.htm
3 de 7 31-03-2009 21:05

The least expensive combination would be 8.5crackers and no yogurt. However, Marco wants toserve only whole numbers of servings. The points(8, 1) and (9, 0) are the integer points within thefeasible region closest to (8.5, 0), so test whichpoint has a lower cost. The point (8, 1) gives a costof $0.78 and (9, 0) will cost $0.54. ThereforeMarco should serve 9 graham crackers and noyogurt.
x y Cost 4.444 3.333 $1.27
4.75 1.5 $0.74 8.571 1.429 $0.94
10 0 $0.60 8.5 0 $0.51
The following box summarizes the steps of solving a linear programming problem. Refer tothese steps as you do the exercises.
Solving a Linear Programming Problem
1. Define your variables, and write constraints using the information given in theproblem. Don't forget commonsense constraints.
2. Graph the feasible region, and find the coordinates of all vertices.
3. Write the equation of the function you want to optimize, and decide whetheryou need to maximize or minimize it.
4. Evaluate your optimization function at each of the vertices of your feasible region,and decide which vertex provides the optimum value.
5. If your possible solutions need to be limited to whole number values, and youroptimum vertex does not contain integers, test the whole number values within
the feasible region that are closest to this vertex.
EXERCISES
Practice Your Skills
1. Carefully graph this system of inequalities and label the vertices.
2. For the system in Exercise 1, find the vertex that optimizes these expressions:a. maximize: 5x + 2y b. minimize: x + 3y
c. maximize: x + 4y d. minimize: 5x + ye. What generalizations can you make about which vertex provides a maximum or minimum value?
3. Graph this system of inequalities, label the vertices of the feasible region, and name the integer coordinates thatmaximize the function P = 0.08x + 0.10y. What is this maximum value of P?
© 2004 Key Curriculum Press LESSON 6.6 Linear Programming 347
Lesson http://acr.keypress.com/KeyPressPortalV3.0/Viewer/Lesson.htm
4 de 7 31-03-2009 21:05

4. APPLICATION During nesting season, two different bird species inhabit a region with area 180,000m2. Dr. Chan estimates that this ecological region can provide 72,000 kg of food during the season.Each nesting pair of species X needs 39.6 kg of food during a specified time period and 120 m2 ofland. Each nesting pair of species Y needs 69.6 kg of food and 90 m2 of land. Let x represent thenumber of pairs of species X, and let y represent the number of pairs of species Y.
a. Describe the meaning of the constraints x 0 and y 0.
b. Describe the meaning of the constraint 120x + 90y 180000.
c. Describe the meaning of the constraint 39.6x + 69.6y 72000.
d. Graph the system of inequalities, and identify each vertex of the feasible region.
e. Maximize the total number of nesting pairs, N, by considering the function N = x + y.
Reason and Apply
5. Use a combination of the four lines shown on the graph along
with the axes to create a system of inequalities whose graphsatisfies each description.
a. The feasible region is a triangle.
b. The feasible region is a quadrilateral with one side onthe y-axis.
c. The feasible region is a pentagon with sides on boththe x-axis and the y-axis.
6. APPLICATION The International Canine Academy raises and
trains Siberian sled dogs and dancing French poodles.Breeders can supply the academy with at most 20 poodles and 15 Siberian huskies each year. Eachpoodle eats 2 lb/d of food and each sled dog eats 6 lb/d. Food supplies are restricted to at most 100lb/d. A poodle requires 1,000 h/yr of training, whereas a sled dog requires 250 h/yr. The academycannot provide more than 15,000 h/yr of training time. If each poodle sells for a profit of $200 andeach sled dog sells for a profit of $80, how many of each kind of dog should the academy raise inorder to maximize profits?
7. APPLICATION The Elite Pottery Shoppe budgets a maximum of $1,000 per month for newspaper andradio advertising. The newspaper charges $50 per ad and requires at least four ads per month. Theradio station charges $100 per minute and requires a minimum of 5 minutes of advertising per month. Itis estimated that each newspaper ad reaches 8,000 people and that each minute of radio advertisingreaches 15,000 people. What combination of newspaper and radio advertising should the business usein order to reach the maximum number of people? What assumptions did you make in solving thisproblem? How realistic do you think they are?
8. APPLICATION A small electric generating plant must decide how much low-sulfur (2%) andhigh-sulfur (6%) oil to buy. The final mixture must have a sulfur content of no more than 4%. At least1200 barrels of oil are needed. Low-sulfur oil costs $18.50 per barrel and high-sulfur oil costs $14.70per barrel. How much of each type of oil should the plant use to keep the cost at a minimum? What isthe minimum cost?
348 CHAPTER 6 Matrices and Linear Systems © 2004 Key Curriculum Press
Lesson http://acr.keypress.com/KeyPressPortalV3.0/Viewer/Lesson.htm
5 de 7 31-03-2009 21:05
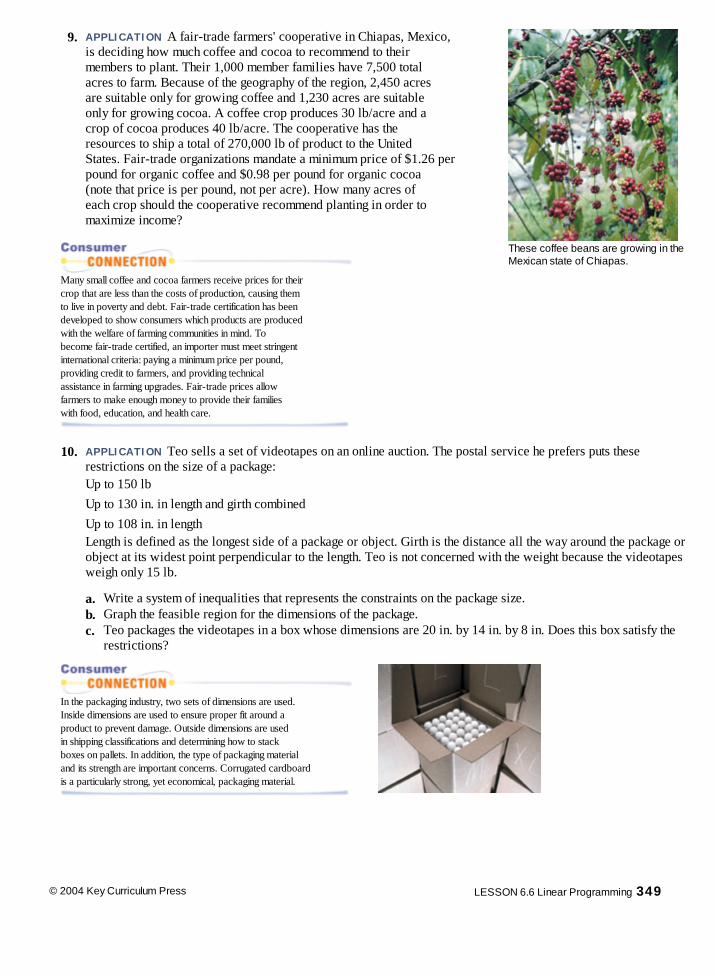
9.
APPLICATION A fair-trade farmers' cooperative in Chiapas, Mexico,is deciding how much coffee and cocoa to recommend to theirmembers to plant. Their 1,000 member families have 7,500 totalacres to farm. Because of the geography of the region, 2,450 acresare suitable only for growing coffee and 1,230 acres are suitableonly for growing cocoa. A coffee crop produces 30 lb/acre and acrop of cocoa produces 40 lb/acre. The cooperative has theresources to ship a total of 270,000 lb of product to the UnitedStates. Fair-trade organizations mandate a minimum price of $1.26 perpound for organic coffee and $0.98 per pound for organic cocoa(note that price is per pound, not per acre). How many acres ofeach crop should the cooperative recommend planting in order tomaximize income?
These coffee beans are growing in theMexican state of Chiapas.
Many small coffee and cocoa farmers receive prices for theircrop that are less than the costs of production, causing themto live in poverty and debt. Fair-trade certification has beendeveloped to show consumers which products are producedwith the welfare of farming communities in mind. Tobecome fair-trade certified, an importer must meet stringentinternational criteria: paying a minimum price per pound,providing credit to farmers, and providing technicalassistance in farming upgrades. Fair-trade prices allowfarmers to make enough money to provide their familieswith food, education, and health care.
10. APPLICATION Teo sells a set of videotapes on an online auction. The postal service he prefers puts theserestrictions on the size of a package:
Up to 150 lb Up to 130 in. in length and girth combined Up to 108 in. in length
Length is defined as the longest side of a package or object. Girth is the distance all the way around the package orobject at its widest point perpendicular to the length. Teo is not concerned with the weight because the videotapesweigh only 15 lb.
a. Write a system of inequalities that represents the constraints on the package size.b. Graph the feasible region for the dimensions of the package.c. Teo packages the videotapes in a box whose dimensions are 20 in. by 14 in. by 8 in. Does this box satisfy the
restrictions?
In the packaging industry, two sets of dimensions are used.Inside dimensions are used to ensure proper fit around aproduct to prevent damage. Outside dimensions are usedin shipping classifications and determining how to stackboxes on pallets. In addition, the type of packaging materialand its strength are important concerns. Corrugated cardboardis a particularly strong, yet economical, packaging material.
© 2004 Key Curriculum Press LESSON 6.6 Linear Programming 349
Lesson http://acr.keypress.com/KeyPressPortalV3.0/Viewer/Lesson.htm
6 de 7 31-03-2009 21:05
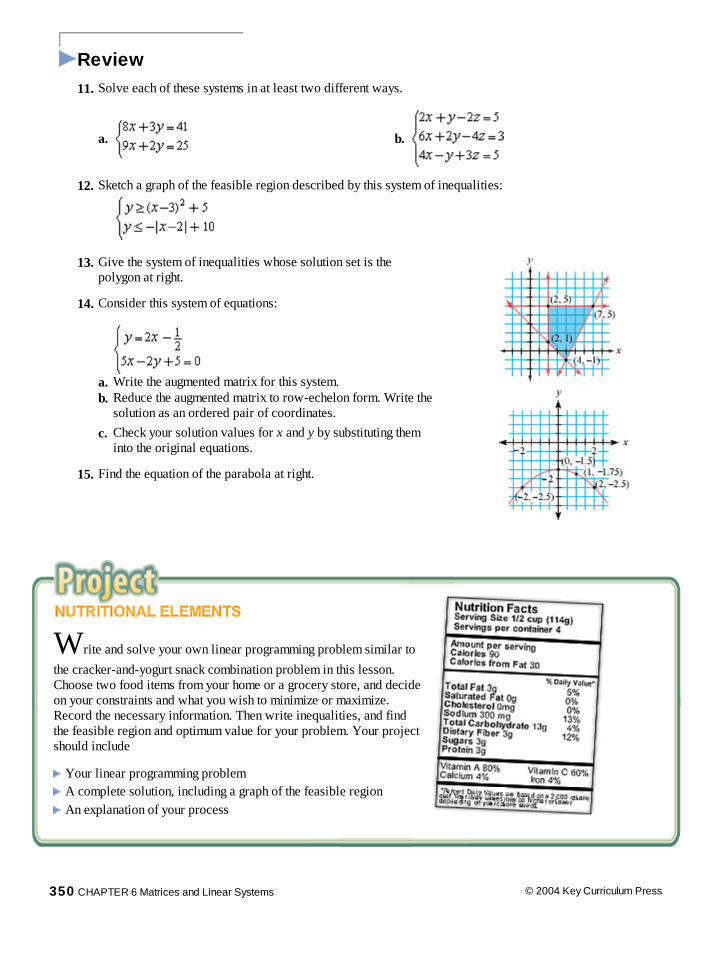
350 CHAPTER 6 Matrices and Linear Systems © 2004 Key Curriculum Press
Review
11. Solve each of these systems in at least two different ways.
a. b.
12. Sketch a graph of the feasible region described by this system of inequalities:
13. Give the system of inequalities whose solution set is thepolygon at right.
14. Consider this system of equations:
a. Write the augmented matrix for this system.b. Reduce the augmented matrix to row-echelon form. Write the
solution as an ordered pair of coordinates.
c. Check your solution values for x and y by substituting theminto the original equations.
15. Find the equation of the parabola at right.
Write and solve your own linear programming problem similar tothe cracker-and-yogurt snack combination problem in this lesson.Choose two food items from your home or a grocery store, and decideon your constraints and what you wish to minimize or maximize.Record the necessary information. Then write inequalities, and findthe feasible region and optimum value for your problem. Your projectshould include
Your linear programming problemA complete solution, including a graph of the feasible regionAn explanation of your process
Lesson http://acr.keypress.com/KeyPressPortalV3.0/Viewer/Lesson.htm
7 de 7 31-03-2009 21:05

Matrices have a variety of uses. They provide ways to organize dataabout such things as inventory or the coordinates of vertices of a polygon.A transition matrix represents repeated changes that happen to a system.You can use matrix arithmetic to combine data or transform polygons on acoordinate graph, and you can also use matrix multiplication to determinequantities at various stages of a transition simulation.
Another important application of matrices is to solve systems ofequations. In Chapter 3, you solved systems of linear equationsby looking for a point of intersection on a graph or by usingsubstitution or elimination. With two linear equations, the systemwill be consistent and independent (intersecting lines with onesolution), or consistent and dependent (the same line withinfinitely many solutions), or inconsistent (parallel lines with nosolution). You can use an inverse matrix and matrix multiplication tosolve a system, or you can use an augmented matrix and the rowreduction method. Matrix methods are generally the simplest way to solvesystems that involve more than three equations and three variables.
When a system is made up of inequalities, the solution usually consists ofmany points that can be represented by a region in the plane. One importantuse of systems of inequalities is in linear programming. In linearprogramming problems, an equation for a quantity that is to be optimized(maximized or minimized) is evaluated at the vertices of the feasibleregion.
EXERCISES 1. Use these matrices to do the arithmetic problems 1a-d. If a particular operation is impossible, explain why.
[A] = [1 –2] [B] = [C] = [D] =
a. [A] + [B] b. [B] – [C] c. 4 · [D] d. [C] [D] e. [D] [C] f. [A] [D]
2. Find the inverse, if it exists, of each matrix.
a. b. c. d.
3. Solve each system by using row reduction.
a. b.
© 2004 Key Curriculum Press CHAPTER 6 REVIEW 351
Lesson http://acr.keypress.com/KeyPressPortalV3.0/Viewer/Lesson.htm
1 de 8 31-03-2009 21:06

4. Solve each system by using an inverse matrix.
American artist Joseph Cornell(1903-1972) assembled sculpturesfrom collections of objects, frequentlydrugstore items. This piece placesmedicine bottles in a matrix-likearrangement.Untitled (Grand Hotel Pharmacy) (1947), JosephCornell
a. b.
5. Identify each system as consistent and independent (has one
solution), inconsistent (has no solution), or consistent anddependent (has infinitely many solutions).
a. b.
c. d.
6. Graph the feasible region of each system of inequalities. Find the
coordinates of each vertex. Then identify the point that maximizesthe given expression.
a.
maximize: 1.65x + 5.2y
b.
maximize: 6x + 7y
7. APPLICATION Heather's water heater needs repair. The plumber says it will cost $300 to fix the unit,
which currently costs $75 per year to operate. Or Heather could buy a new energy-saving water heaterfor $500, including installation, and the new heater would save 60% on annual operating costs. Howlong would it take for the new unit to pay for itself?
8. APPLICATION A particular color of paint requires a mix of five parts red, six parts yellow, and two
parts black. Thomas does not have the pure colors available, but he finds three pre-mixed colors thathe can use. The first is two parts red and four parts yellow; the second is one part red and two partsblack; the third is three parts red, one part yellow, and one part black.
a. Write an equation that gives the correct portion of red by using the three available pre-mixed colors.
b. Write an equation that gives the correct portion of yellow and another equation that gives the correctportion of black.
c. Solve the systems of equations in 8a and b.
d. Find an integer that you can use as a scalar multiplier for your solutions in 8c to provide integer solutionvalues.
e. Explain the real-world meaning to your solutions to 8d.
352 CHAPTER 6 Matrices and Linear Systems © 2004 Key Curriculum Press
Lesson http://acr.keypress.com/KeyPressPortalV3.0/Viewer/Lesson.htm
2 de 8 31-03-2009 21:06

9. Interlochen Arts Academy 9th and 10th graders are housed in three dormitories: Picasso,Hemingway, and Mozart. Mozart is an all-female dorm, Hemingway is an all-male dorm, andPicasso is coed. In September, school started with 80 students in Mozart, 60 in Picasso, and 70 inHemingway. Students are permitted to move from one dorm to another on the first Sunday ofeach month. This transition graph shows the movements this past year.
a. Write a transition matrix for this situation. List thedorms in the order Mozart, Picasso, Hemingway.
b. What were the populations of the dorms in
i. October?
ii. November?
iii. May?
10. APPLICATION Yolanda, Myriam, and Xavier havea small business producing handmade shawls andblankets. They spin the yarn, dye it, and weave it.A shawl requires 1 h of spinning, 1 h of dyeing, and1 h of weaving. A blanket needs 2 h of spinning, 1 hof dyeing, and 4 h of weaving. They make a $16 profitper shawl and a $20 profit per blanket. Xavier doesthe spinning on his day off, when he can spend atmost 8 h spinning. Yolanda dyes the yarn on her dayoff, when she has at most 6 h. Myriam does all theweaving on Friday and Saturday, when she has atmost 14 h available. How many of each item shouldthey make each week to maximize their profit?
MIXED REVIEW
11. Graphs 11a-c were produced by a recursive formula in the form u0 = a un = un – 1 (1 + p) + d where n 1
For each case, tell if a, p, and d are greater than zero (positive), equal to zero, or less than zero (negative).
a. b. c.
© 2004 Key Curriculum Press CHAPTER 6 REVIEW 353
Lesson http://acr.keypress.com/KeyPressPortalV3.0/Viewer/Lesson.htm
3 de 8 31-03-2009 21:06

12. The graph of y = f (x) is shown at right.
a. Find f (–3). b. Find x such that f (x) = 1. c. How can you use the graph to tell whether or not f is a function? d. What is the domain of f ? e. What is the range of f ?
13. Last semester, all of Ms. Nolte's students did projects. One-halfof the students in her second-period class investigated fractals,one-fourth of the students in that class did research projects,and the remaining students conducted surveys and analyzedtheir results. In her third-period class, one-third of the studentsinvestigated fractals, one-half of the students did researchprojects, and the remaining students conducted surveys andanalyzed their results. In the seventh-period class, one-fourthof the students investigated fractals, one-sixth of the studentsdid research projects, and the remaining students conducted asurvey and analyzed their results. Overall, 22 studentsinvestigated fractals, 18 students did research projects, and 22students conducted surveys. How many students are in eachof Ms. Nolte's classes?
14. APPLICATION Canada's oil production has increased over the
last half century. This table gives the production of oil per dayfor various years.
Canada's Oil Production
Year 1960 1970 1980 1990 1995 1998 1999
Barrels per day (millions) 0.52 1.26 1.44 1.55 1.80 1.98 1.91
(The New York Times Almanac 2002)
This oil-drilling ship was frozenin six feet of ice on the BeaufortSea, Northwest Territories, Canada,in 1980.
a. Define variables and make a scatter plot of the data.
b. Find M1, M2, and M3, and write the equation of the
median-median line.
c. Use the median-median line to predict Canada's oilproduction in 2002.
15. Solve.
a. log 35 + log 7 = log x b. log 500 – log 25 = log xc. log = x log8 d. 15(9.4)x = 37000e. f. log6 342 = 2x
354 CHAPTER 6 Matrices and Linear Systems © 2004 Key Curriculum Press
Lesson http://acr.keypress.com/KeyPressPortalV3.0/Viewer/Lesson.htm
4 de 8 31-03-2009 21:06

16. APPLICATION Suppose the signal strength in a fiber-optic cable diminishes by 15% every 10 mi.
a. What percentage of the original signal strength is left after a stretch of 10 mi?
b. Create a table of the percentage of signal strength remaining in 10 mi intervals, and make a graphof the sequence.
c. If a phone company plans to boost the signal just before it falls to 1%, how far apart should thecompany place its booster stations?
Fiber-optic technology uses light pulses to transmitinformation from one transmitter to another downfiber lines made of silica (glass). Fiber-optic strandsare used in telephone wires, cable television lines,power systems, and other communications. Thesestrands operate on the principle of total internalreflection, which means that the light pulses cannotescape out of the glass tube and instead bounceinformation from transmitter to transmitter.
The photo on the left shows strands of fiber-optic cable. The illustration on the rightshows how light is reflected along a strand of fiber-optic cable, creating total internalreflection.
17. The graph of an exponential function passes through the points (4, 50) and (6, 25.92).
a. Find the equation of the exponential function.
b. What is the rate of change? Does the equation model growth or decay?
c. What is the y-intercept?
d. What is the long-run value?
18. This data set gives the weights in kilograms of the crewmembers participating in the 2002 Boat Race betweenOxford University and Cambridge University.(www.cubc.org.uk and www.ourcs.org)
{83, 95, 91, 90, 93, 97.5, 97, 79, 55,89, 89.5, 94, 89, 100, 90, 92, 96, 54}
a. Make a histogram of these data.
b. Are the data skewed left, skewed right, or symmetric?
c. Identify any outliers.
d. What is the percentile rank of the crew member who
weighs 94 kg?Photographed on London’s Thames River in1949, this television crew films the Oxford-Cambridge Boat Race, which was the BritishBroadcasting Corporation’s first broadcast withequipment in motion.
© 2004 Key Curriculum Press CHAPTER 6 REVIEW 355
Lesson http://acr.keypress.com/KeyPressPortalV3.0/Viewer/Lesson.htm
5 de 8 31-03-2009 21:06

19. Consider the graph of y = x2. Let matrix [P], which organizes thecoordinates of the points shown, represent five points on the parabola.
[P] =
a. Describe the transformation(s) that would give five correspondingpoints on the graph of y = (x – 5)2– 2. Sketch the graph.
b. Describe the transformation(s) that would give five points on thegraph of y = –2x2. Sketch the graph.
c. Sketch the image of the portion of the graph of y = x2 represented by the product –1 · [P].Describe the transformation(s).
d. Write a matrix equation that represents the image of five points on the graph of y = x2 aftera translation left 2 units and up 3 units.
20. APPLICATION This table gives the mean population per U.S. household for various years from1890 to 1998.
Mean Household Population
Year 1890 1930 1940 1950 1960 1970 1980 1990 1998 Mean population 4.93 4.11 3.67 3.37 3.35 3.14 2.76 2.63 2.62
(The New York Times Almanac 2001)
a. Define variables and find a linear equation that fits these data. b. Write and solve a problem that you could solve by interpolation with your line of fit. c. Write and solve a problem that you could solve by extrapolation with your line of fit.
A family poses before their sod house in Nebraska in 1887. Made fromstrips of earth and plant roots collected with a plow, sod was plasteredwith clay and ashes in a brick-like pattern. Sod houses were common inthe Western U.S. plains because timber was scarce.
356 CHAPTER 6 Matrices and Linear Systems © 2004 Key Curriculum Press
Lesson http://acr.keypress.com/KeyPressPortalV3.0/Viewer/Lesson.htm
6 de 8 31-03-2009 21:06
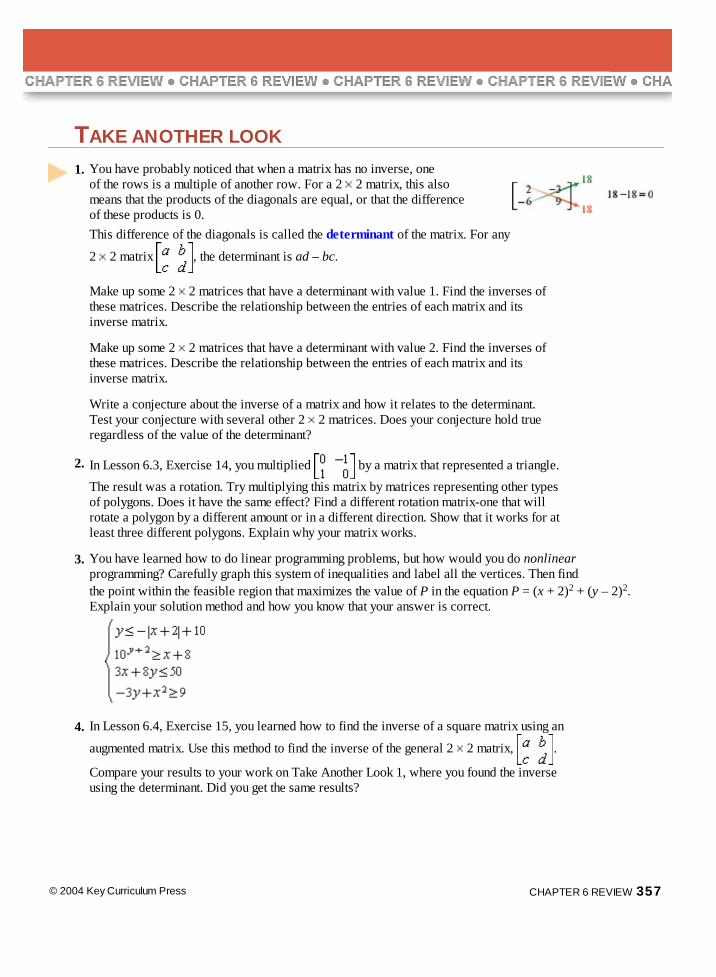
TAKE ANOTHER LOOK
1. You have probably noticed that when a matrix has no inverse, oneof the rows is a multiple of another row. For a 2 2 matrix, this alsomeans that the products of the diagonals are equal, or that the differenceof these products is 0.
This difference of the diagonals is called the determinant of the matrix. For any
2 2 matrix , the determinant is ad – bc.
Make up some 2 2 matrices that have a determinant with value 1. Find the inverses ofthese matrices. Describe the relationship between the entries of each matrix and itsinverse matrix.
Make up some 2 2 matrices that have a determinant with value 2. Find the inverses ofthese matrices. Describe the relationship between the entries of each matrix and itsinverse matrix.
Write a conjecture about the inverse of a matrix and how it relates to the determinant.Test your conjecture with several other 2 2 matrices. Does your conjecture hold trueregardless of the value of the determinant?
2. In Lesson 6.3, Exercise 14, you multiplied by a matrix that represented a triangle.The result was a rotation. Try multiplying this matrix by matrices representing other typesof polygons. Does it have the same effect? Find a different rotation matrix-one that willrotate a polygon by a different amount or in a different direction. Show that it works for atleast three different polygons. Explain why your matrix works.
3. You have learned how to do linear programming problems, but how would you do nonlinearprogramming? Carefully graph this system of inequalities and label all the vertices. Then findthe point within the feasible region that maximizes the value of P in the equation P = (x + 2)2 + (y – 2)2.Explain your solution method and how you know that your answer is correct.
4. In Lesson 6.4, Exercise 15, you learned how to find the inverse of a square matrix using an
augmented matrix. Use this method to find the inverse of the general 2 2 matrix, .
Compare your results to your work on Take Another Look 1, where you found the inverseusing the determinant. Did you get the same results?
© 2004 Key Curriculum Press CHAPTER 6 REVIEW 357
Lesson http://acr.keypress.com/KeyPressPortalV3.0/Viewer/Lesson.htm
7 de 8 31-03-2009 21:06

Assessing What You've Learned
PERFORMANCE ASSESSMENT While a classmate, a friend, a family member,or a teacher observes, show how to solve a system of equations using both aninverse matrix and the row reduction method. Explain all of your steps and whyeach method works.
WRITE IN YOUR JOURNAL Choose one or more of the following questionsto answer in your journal.
What kinds of matrices can be added to or subtracted from one another? What kinds ofmatrices can you multiply? Is matrix multiplication commutative? Why or why not? Whatare the identity matrix and the inverse matrix, and what are they used for? You have learned five methods to find a solution to a system of linear equations:graphing, substitution, elimination, matrix row reduction, and multiplication by aninverse matrix. Which method do you prefer? Which one is the most challenging to you?What are the advantages and disadvantages of each method?
You have now studied half the chapters of this book. What mathematical skills in theprevious chapters were most crucial to your success in this chapter? Which concepts areyour strengths and weaknesses?
UPDATE YOUR PORTFOLIO Pick a linear programming problem for which you areespecially proud of your work, and add it to your portfolio. Describe the steps you followedand how your graph helped you to solve the problem.
358 CHAPTER 6 Matrices and Linear Systems © 2004 Key Curriculum Press
Lesson http://acr.keypress.com/KeyPressPortalV3.0/Viewer/Lesson.htm
8 de 8 31-03-2009 21:06