chapter 6 traffic management
TRANSCRIPT

The Study on Integrated Urban Transportation Master Plan for Istanbul Metropolitan Area in the Republic of Turkey Final Report
Chapter 6
6-1
Source : Study Team
Figure 6.1.1 Camera Detector
on Top of Signal Lantern
Chapter 6 Traffic Management
Various kinds of traffic management measures are already in place in the study area.
They are intended to improve efficiency as well as the safety of road traffic in general.
This chapter describes typical traffic management measures and systems being adopted
in Istanbul. In addition, traffic accident situation and enforcement of traffic regulation are
also presented.
6.1 Traffic Signal System
6.1.1 Existing Signal System
There are some 1300 traffic signals in Istanbul. Among them, about 800 signals are
connected to the Traffic Control Center located in the municipality building in Merter. All
hardware and software components of the system have been developed locally including
signal controller, signal light and control software. A unique approach has been taken in
the design of the system as described below.
Cellular phone technologies are adopted in the traffic control system and data
communication between the local controller and the Center uses TCP/IP1 protocol over
GPRS2. No data exchange is made between the Center and the local controllers under
normal condition. Local controllers independently operate in a time-of-day mode with its
built-in timing parameters.
In area traffic control (ATC) system commonly adopted in other cities, the data exchange
between the center and the local controllers is much more frequent and normally done at
one second intervals. In such system, signal control command and other downloading
data are sent to the local controller, while local controller status data and vehicle detector
data are sent to the Center. With the frequent data exchange between the local controller
and the center, traffic signal operates very efficiently with traffic adaptive or traffic
responsive control algorithms.
The Istanbul system was built based on the policy to
reduce data communication costs as much as possible
and limit the data exchange to a minimum. The use of
GPRS achieves the goal but there is a risk associated
with less frequent data transmission. If an emergency
happens, the communication circuit could be congested
and the data communication would not work properly.
If local controller detects any abnormality in its operation,
it automatically informs the Control Center of the
controller’s status. On the other hand, it is possible to
interrogate each local controller and determine its
operating status from the Center anytime. Moreover, the
data stored in the local controller can be uploaded or
downloaded through the data communication system.
1 Transmission Control Protocol/Internet Protocol: A data exchange technology used in Internet.
2 General Packet Radio Service: Data transmission system over GSM (Global System for Mobile
communications) cellular phone system.

The Study on Integrated Urban Transportation Master Plan for Istanbul Metropolitan Area in the Republic of Turkey Final Report Chapter 6
6-2
Signal control is of the time-of-day type, in which each local controller has four sets of
timing plan and the different plans are applied according to the time of the day. Thus
signal operates with different systems timing at different times of the day to cope with the
change in the traffic volume. Flashing operation is also possible by time-of-day control.
In addition to the existing inductive loop vehicle detector, traffic camera type vehicle
detector was introduced recently and there are 100 units of the detector in operation.
They detect presence of vehicles within its sensing zone and output the presence signal
to local controller to enable actuated signal control. If an approaching vehicle is detected
near the end of green, green signal is extended to allow the vehicle to pass the
intersection without stopping. On the other hand, if no vehicle is detected, green signal is
cut shorter than the preset duration. Such operation is effective in reducing the total
waiting time at intersection. The actuation control is, however, not used to a series of
signals closely located along an arterial street to maintain a “green wave” or offset
between signals.
6.1.2 Traffic Signal Design and Maintenance
New signal is designed in the following manner:
Geometric design of intersection is undertaken by Transportation coordination
Directorate.
Traffic Directorate will then design signal, and the location of signal post and local
controller is decided. Minor modification of intersection design may be made but basic
element such as road width or bus stop location cannot be changed.
ISBAK, a company established by the Municipality engaged in signal installation and
maintenance, carries out detailed design of signal including signal timing calculation.
Commercially available signal timing software was used before. But the results were
found not directly applicable to the signals in Istanbul. For example, SYNCHRO tends
to produce longer timing than necessary. ISBAK wants to try any signal timing
software that can produce better results than those they have used.
In reality, the signal timing and coordination (green wave) is prepared based on the
traffic volume data, site observation and the experience with the signal design at
similar intersections. The signal timing software is used only to confirm the adequacy
of the calculation.
No evaluation study has been made comparing traffic condition before and after the
signal installation or signal timing updating.
The signal maintenance and timing plan updating system is organized as follows: Whole
Istanbul is divided into five areas. For each area, two teams are assigned and each team
consists of two members; electronic engineer and computer engineer. They work in two
shifts with first shift from 06:00 to 14:00 and the second shift from 14:00 to 22:00. There
are 31 staff in total. Maintenance team routinely patrols the area assigned and checks the
suitability of signal timing. If timing is found not properly set, the team modify the timing on
the spot using notebook computer connected to the local controller.
The existing signal system still uses loop detector at about 300 locations. Because of
inferior pavement condition, 30 – 35 % of them are always not working and maintenance

The Study on Integrated Urban Transportation Master Plan for Istanbul Metropolitan Area in the Republic of Turkey Final Report
Chapter 6
6-3
of them is very difficult and costly.
In order to reinforce the signal maintenance capability, additional four engineers are
scheduled to join the team. They will engage not only in the review and updating of the
signal timing but also in the design of traffic management improvement plan.
6.1.3 New Signal System
There is a movement to improve and upgrade the existing traffic signal system. In 2008,
the Municipality is planning to introduce local adaptive signal control system. More
sophisticated signal control software will be installed in the local controller and signal
timing will be automatically adjusted to the changing traffic volume.
Traffic Directorate is also planning to introduce centrally operated dynamic traffic signal
system in which signal timing is automatically adjusted in response to traffic demand. The
candidate system to be introduced is called ITACA and supplied by SAINCO TRAFICO of
Spain. The location of the pilot project has not yet been decided.
Traffic Directorate is aware of the limitation of GPRS data communication system and
planning to introduce a system using fiber optical cable. In the new data communication
system, 9600 Baud data transmission circuit system will be leased from a telephone
company but the cost is very high at US$120 per month per circuit or traffic signal. In
comparison, the Municipality currently pays only US$5.000 per month for the data
communication using GPRS of the existing traffic signal system.
6.2 Traffic Monitoring System
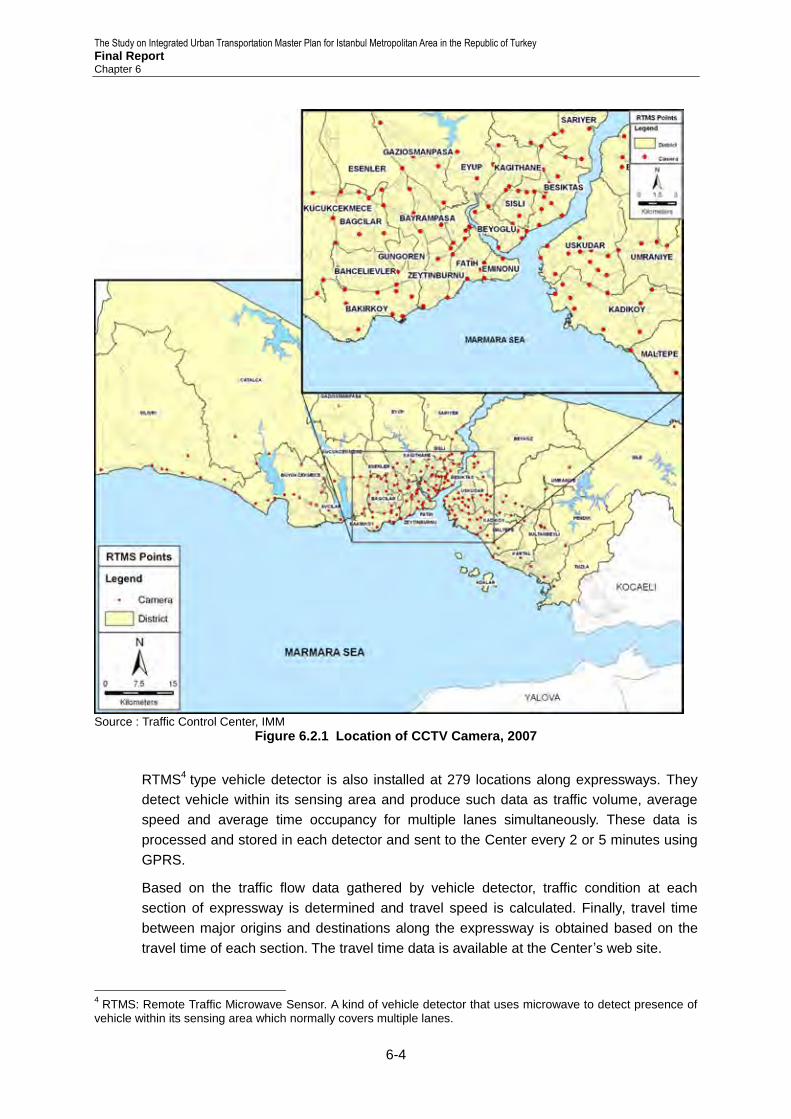
Traffic on the major streets in the city is monitored through two systems; CCTV (closed
circuit television) monitoring system and vehicle detector system. A total of 116 units of
CCTV cameras are installed and 60 unit are planned mainly along the expressways and
arterial streets. The cameras are equipped with pan, tile, and zoom function that can be
remotely operated from the Center to control the video coverage. These cameras send
live video image of the site to the control center through the communication line leased
from a telecommunication company. The system adopts MPEG43 data compression
technology over 2 Mbits/sec circuit. Due to the reduced frame rate, the video image on
the monitor display is not as smooth as images that use higher speed communication
lines. But it is sufficient to monitor traffic flows.
A large multi-screen wall map display measuring 15 columns by 5 rows capable of
showing a maximum of 75 separate displays is installed at the Center. The wall map is
also capable of showing a display over multiple screens from both video images taken by
CCTV camera and other computer outputs.
The operators in the Center constantly monitor traffic conditions through the video image
on the wall map. As the number of cameras is more than the number of multiple screens,
the operator has to select the sites and cameras to monitor the specific location. In
addition, watching as many as 75 screens constantly is a daunting task.
3 MPEG4: Moving Picture Coding Experts Group 4. One of the video signal compression methods.
The Study on Integrated Urban Transportation Master Plan for Istanbul Metropolitan Area in the Republic of Turkey Final Report Chapter 6
6-4
Source : Traffic Control Center, IMM
Figure 6.2.1 Location of CCTV Camera, 2007
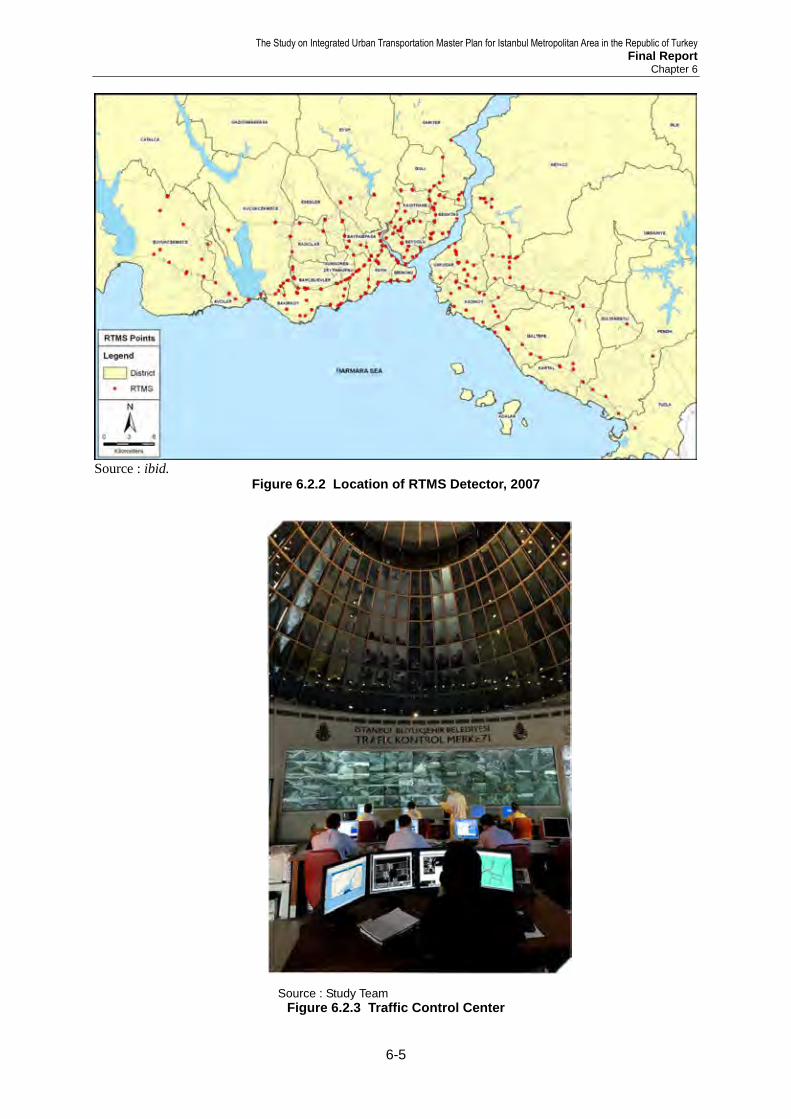
RTMS4 type vehicle detector is also installed at 279 locations along expressways. They
detect vehicle within its sensing area and produce such data as traffic volume, average
speed and average time occupancy for multiple lanes simultaneously. These data is
processed and stored in each detector and sent to the Center every 2 or 5 minutes using
GPRS.
Based on the traffic flow data gathered by vehicle detector, traffic condition at each
section of expressway is determined and travel speed is calculated. Finally, travel time
between major origins and destinations along the expressway is obtained based on the
travel time of each section. The travel time data is available at the Center’s web site.
4 RTMS: Remote Traffic Microwave Sensor. A kind of vehicle detector that uses microwave to detect presence of
vehicle within its sensing area which normally covers multiple lanes.
The Study on Integrated Urban Transportation Master Plan for Istanbul Metropolitan Area in the Republic of Turkey Final Report
Chapter 6
6-5
Source : ibid.
Figure 6.2.2 Location of RTMS Detector, 2007
Source : Study Team
Figure 6.2.3 Traffic Control Center
The Study on Integrated Urban Transportation Master Plan for Istanbul Metropolitan Area in the Republic of Turkey Final Report Chapter 6
6-6
6.3 Traffic Information
Three types of traffic information: congestion degree, travel time and traffic camera image
from the video camera installed along expressways, are provided by the Traffic Control
Center. Information dissemination is made through three systems, variable message sign,
the internet and cellular phone.
6.3.1 Congestion
Although traffic flow parameters (volume, occupancy rate and average speed) are
measured by vehicle detectors, traffic condition is monitored and judged by the operator
in the Center. There are no established clearly defined criteria to classify traffic conditions
like normal, lightly congested or heavily congested. Judgment is left to the discretion of
operators. Thus results may vary among the operators.
Another issue to be addressed is that the number of cameras that an operator has to
monitor. It is very hard to notice any abnormal traffic condition on the multi-screen display
that shows video images from as many as 75 cameras. Even though a camera at the site
of abnormal traffic condition is selected, the camera may not cover the scene where
troubles occur. The issue is compounded by the fact that there are nearly 200 cameras.
The number of cameras is simply too many to be monitored by the operator. Some kind of
automatic traffic control mechanism must be introduced.
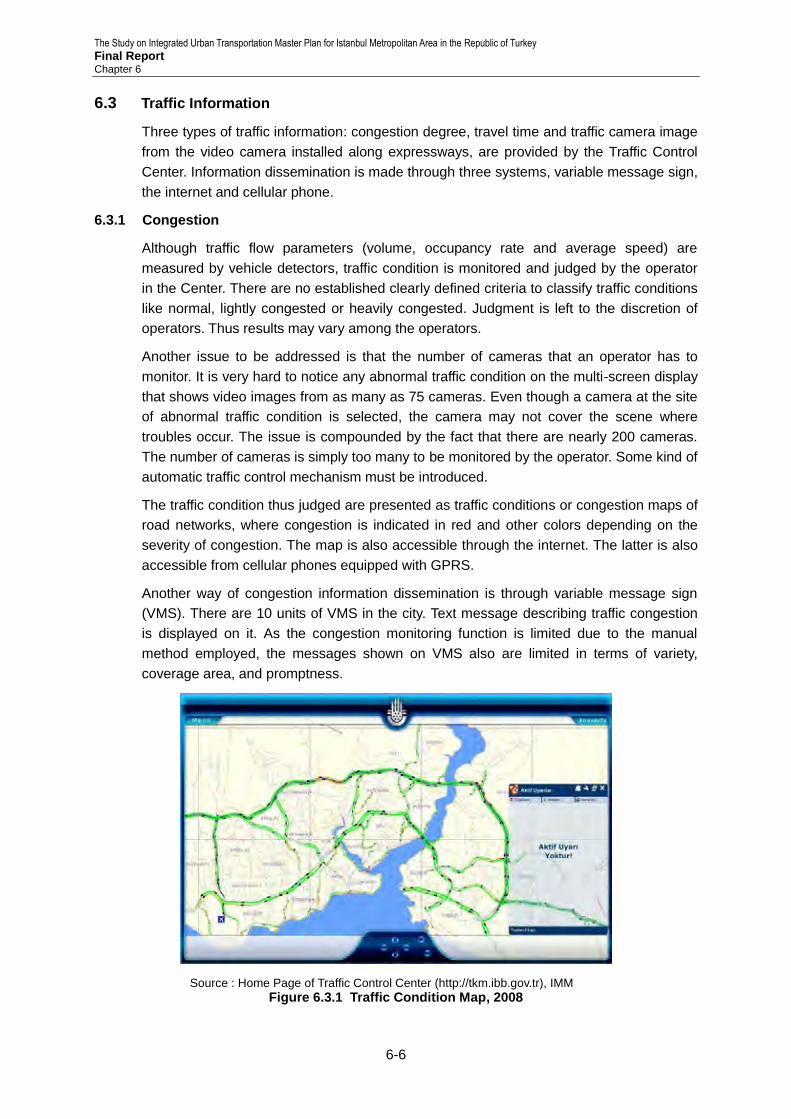
The traffic condition thus judged are presented as traffic conditions or congestion maps of
road networks, where congestion is indicated in red and other colors depending on the
severity of congestion. The map is also accessible through the internet. The latter is also
accessible from cellular phones equipped with GPRS.
Another way of congestion information dissemination is through variable message sign
(VMS). There are 10 units of VMS in the city. Text message describing traffic congestion
is displayed on it. As the congestion monitoring function is limited due to the manual
method employed, the messages shown on VMS also are limited in terms of variety,
coverage area, and promptness.
Source : Home Page of Traffic Control Center (http://tkm.ibb.gov.tr), IMM
Figure 6.3.1 Traffic Condition Map, 2008
The Study on Integrated Urban Transportation Master Plan for Istanbul Metropolitan Area in the Republic of Turkey Final Report
Chapter 6
6-7
6.3.2 Travel Time
Travel time between the selected locations on the D100, O-1 and O-2 is calculated based
on the traffic condition parameters measured by the RTMS type vehicle detector.
Expressways are divided into sections and travel time at each section is estimated. Then
travel time along a route from origin to destination is obtained as the sum of the travel
time at each section comprising the route. The travel time thus calculated is the
instantaneous travel time of several minutes ago and not the forecast in the future.
Nonetheless, it is a good indicator of traffic condition and useful for road users in
understanding traffic conditions and helpful for their route selection.
Source : ibid.
Figure 6.3.2 Travel Time Information on Internet, 2008
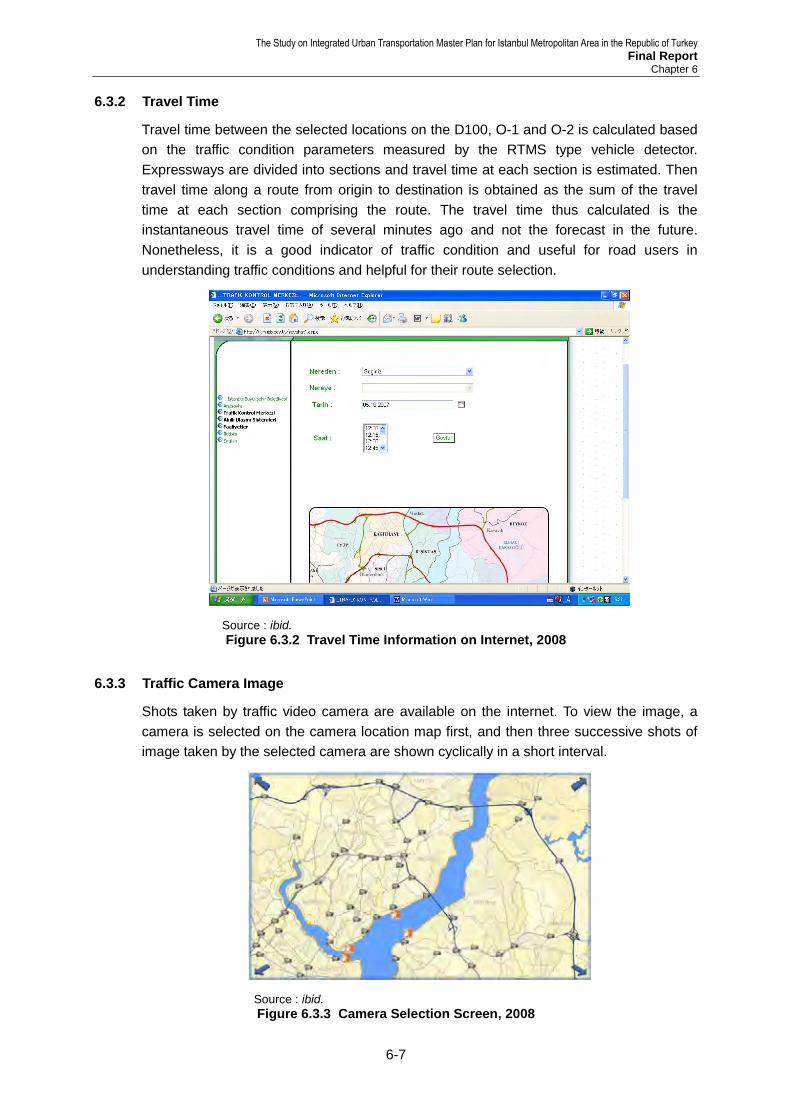
6.3.3 Traffic Camera Image
Shots taken by traffic video camera are available on the internet. To view the image, a
camera is selected on the camera location map first, and then three successive shots of
image taken by the selected camera are shown cyclically in a short interval.
Source : ibid.
Figure 6.3.3 Camera Selection Screen, 2008

The Study on Integrated Urban Transportation Master Plan for Istanbul Metropolitan Area in the Republic of Turkey Final Report Chapter 6
6-8
Source : ibid.
Figure 6.3.4 Image Taken by Traffic Camera
6.3.4 Traffic Information Through Cellular Phone
Access to the traffic information service is also possible through cellular phone equipped
with GPRS capability. The service menu is the same as normal internet access by
computer and consists of congestion map, travel time information and live traffic video
camera image.
The traffic information service for cellular phone has been available since 2006 but it was
announced officially in January 2008 by the mayor.
Unlike normal Internet access, registration is required to subscribe the service. There
have been about 60,000 requests for registration in two weeks since the announcement.
But only 10,000 subscribers have been accepted. There were many incorrect requests
that caused troubles in application processing by the server.
The monthly subscription cost is about 10 YTL per month if live video is viewed 2 or 3
times a day in addition to the congestion information.
The Municipality receives 25% of subscription fee after deducting tax and the rest goes to
the cellular phone company that provides data communication service.
6.3.5 Variable Message Sign
Variable message sign is a device installed at roadsides that displays text messages sent
from the Center to disseminate information to road users. Currently there are ten (10)
units of VMS in Istanbul as listed below.
Airport
Otogar
Kozyatagi
Barbaros boulevard – Yildiz entry
Halic bridge exit – Okmeydani
Zeytinburnu

The Study on Integrated Urban Transportation Master Plan for Istanbul Metropolitan Area in the Republic of Turkey Final Report
Chapter 6
6-9
Piyale Pasa Bulvari
Kartal intersection
Gaglayan
Haramidere
Types of message that VMS displays are:
Congestion along routes
Congestion caused by traffic accident
Warning during adverse weather
Road construction
Service information by Municipality
Guidance of people in case of earthquake, heavy rain, and other natural disaster
All types of message are manually inputted by an operator. Thus, the system is
dependent on diligence and the capabilities of operator. There is a plan to automate the
travel time display system. But the details are yet to be studied and designed.
6.4 Traffic Management Measures
Several typical traffic management measures are already in place in Istanbul. Some of
them are briefly described below.
6.4.1 Reversible Lane
Reversible lane system is effective in handling tidal traffic flow that has larger volume
toward the city center in the morning and less volume in opposite direction in the evening.
In the study area, reversible lane system is adopted along the routes below.
1st Bosporus bridge
2nd Bosporus bridge
Bakirkoy Sahil Yolu (Kennedy Street)
Ciragan street
Source : Study Team
Figure 6.4.1 Start/End Point of Reversible Lane

The Study on Integrated Urban Transportation Master Plan for Istanbul Metropolitan Area in the Republic of Turkey Final Report Chapter 6
6-10
Source : Traffic Control Center, IMM
Figure 6.4.2 Location of Reversible Lane, 2008
6.4.2 Truck Ban
In general, large trucks are prohibited from entering the area surrounded by shore line
and the E5 as shown in Figure 5.4.3. Heavy vehicle are banned from 6:00 – 10:00 a.m.
and 16:00 – 22:00 p.m. in the restricted areas. But vehicles having curb weights of less
than 4000 kg are allowed to enter these areas. Also, heavy vehicles are prohibited to use
the first Bosporus Bridge except for official vehicle for technical reasons.
Source : ibid.
Figure 6.4.3 Truck Ban Area, 2008
The Study on Integrated Urban Transportation Master Plan for Istanbul Metropolitan Area in the Republic of Turkey Final Report
Chapter 6
6-11
6.4.3 Congestion alleviation
Transportation Coordination Directorate of the Municipality is working to mitigate traffic
congestion problem. One of the activities they engage in is the arterial street improvement
using a computer simulation program called VISSIM.
A small area with congested arterial streets is first selected. Turning movement count
survey is then conducted at problematic intersections to obtain necessary data for the
morning peak, noontime and evening peak. Traffic volume data are input into microscopic
traffic simulation software VISSIM. Various improvement options are planned and
evaluated using the simulation program. If the result is positive, the measure is
implemented by other department.
These activities can be applied to many areas. But there is no systematic approach as to
the area selection and formation of solutions. Another issue is that Transportation
Coordination Directorate is in charge of designing improvement works, while
implementation is not ensured as it is the task of other department.
6.5 Parking Management
6.5.1 Municipality Owned Parking Facility
Parking is one of the main causes of traffic congestion. But there is no clear parking
management policy in the Municipality. The current practice of the Municipality is to
construct as many parking spaces as possible at locations where land is available. There
has been very few research or study about parking demands.
There is a new approach recently being taken by the Municipality. One is the introduction
of build-operate-transfer (BOT) scheme to the development of parking facility on lands
owned by the Municipality. The scheme is expected to accelerate the parking facility
development.
There is a regulation regarding the requirement for parking space for each type of building.
But enforcement of the regulation is lax and the regulation does not function well at the
moment.
The Municipality is concerned mainly with the design of entry and exit points of off-street
parking facilities and the impact caused by the vehicles entering into or exiting from them.
There is no regulation about the details of the facility. The Municipality has no control over
the privately owned and operated parking spaces. No consideration is given to them in
the parking facility development by the Municipality.
The Municipal government is concerned with its own parking facilities. Parking facility
operated by private entities is not controlled or managed by the city. Thus there is no data
for privately operated parking facilities. According to a city official, each district may have
the data about private parking facilities.
Table below shows the revenue from the parking facility. It is increasing. The increase can
be attributed to the development of on-road parking facilities and the transfer of their
operation to ISPARK.

The Study on Integrated Urban Transportation Master Plan for Istanbul Metropolitan Area in the Republic of Turkey Final Report Chapter 6
6-12
Source : Study Team
Figure 6.5.1 Roadside
Parking Operated by ISPARK
Table 6.5.1 Revenue from the Parking Facility
Year Amount (YTL) Remarks
2001 660,719
2002 663,021
2003 1,457,962
2004 2,411,833
2005 5,623,686
2006 14,982,882
2007 15,420,020 Up to 20 September
Source: Istanbul Metropolitan Municipality Web site
6.5.2 ISPARK
The parking facility of the Municipality is managed by
ISPARK, one of the companies under the Municipality.
The tasks of ISPARK are stipulated in Articles 7 and 26 of
Law 5216. Article 7 authorizes ISPARK to designate and
operate roadside parking in Istanbul. Article 27 allows it to
construct and operate off-street parking facilities.
ISPARK is tasked to take over the operation of all parking
facilities that the Municipality possesses and the turn-over
process is being implemented.
As of September 2007, ISPARK manages a total of 328
parking sites, (406 locations) with a total capacity of
33,109 parking spaces. The site refers to streets while
there are multiple locations along a street. Most of the
parking facility operates from 8:00 am to 8:00 pm but
some operate 24 hours.
There is a special implementation of parking operation in which shopping plaza rents the
parking spaces of ISPARK for a fee and offers these to its customers without collecting
parking fees.
Another special implementation is free parking spaces operated by ISPARK. There are 58
locations with a total capacity of 1,345 cars. These locations are included in the total
figures above.
There are 1 or 2 locations where private parking facilities are operated by ISPARK
Currently parking fee collection is done manually by parking personnel and there is no
collection system that uses any kind of machine such as parking meter. The amount of
fee is set relatively high (4 YTL for first 2 hours, for example) at the central area and low
(3 YTL for whole day) at peripheral areas. Electronic payment system using cell phone is
planned by the company.
With the establishment of ISPARK on December 1, 2005 and the introduction of an
organized parking fee collection system, malpractices in the collection of parking fees by
unauthorized persons has been significantly reduced.
Introduction of parking meter is not planned as the system is considered not suitable for
Istanbul. ISPARK is planning to introduce a number of electronic parking fee payment

The Study on Integrated Urban Transportation Master Plan for Istanbul Metropolitan Area in the Republic of Turkey Final Report
Chapter 6
6-13
systems.
One measure being planned is the use of PDA (personal digital assistant, hand-held
computer) by ISPARK personnel. PDA is used to enter the parking data (location, plate
number and time of parking) into central database. With the use of the system, disputes
regarding parking time can be avoided.
Source : ISPARK
Figure 6.5.2 Parking Facility of Istanbul Metropolitan Municipality, 2007
6.6 Transfer Center (Park and Ride Facility)
In order to reduce private car use and promote public transport, the Municipality
government is planning to set up transfer centers.
There are 33 planned transfer centers with a total capacity of 52,454 vehicles on the
European side, while 28 transfer centers with the total capacity of 87,321 vehicles are
planned on the Anatolian side. Some of the transfer centers have very large capacities.
The largest transfer center will be Kartal Intersection Transfer Center with a capacity of
14,000 vehicles. Such a large facility would require long transfer time from parked private
cars to public transport. As most of the transfer centers are still at planning or project
preparation stage, the details such as number of stories, number of entry and exit points,
and accessibility to public transport are not yet clear. It can be said, however, that some of
the transfer centers are planned near the central business district and may not be helpful
in encouraging use of public transport.

The Study on Integrated Urban Transportation Master Plan for Istanbul Metropolitan Area in the Republic of Turkey Final Report Chapter 6
6-14
Source : Transport Planning Dept., IMM
Figure 6.6.1 Location of Transfer Centers Planned, 2008
6.7 Traffic Accidents and Safety
6.7.1 Number of Accidents
Traffic accident is a social problem for Turkey as well as for Istanbul. The table 6.7.1
below shows the number of accidents in the whole country and in Istanbul in 2006. The
annual fatality is about 3,300 for the whole country and 262 in Istanbul. Istanbul has about
the same share for injury accidents too. As to the property damage accident, however,
Istanbul occupies much higher share of more than 30% as compared with the whole
country. It is pointed out that one must be careful in interpreting these accident data.
Because accident is judged as fatal if accident victim is already dead upon arrival at
hospital. The practice is different from the international standards in which fatality count
includes the persons who die within 30 days of accident. Thus, the number of fatalities
would be much higher if the international standards are applied.
Notwithstanding the incorrectness caused by the accident recording system, fatality rate
is considered much higher than the developed countries. The detailed accident data from
the Traffic Police also shows a higher accident rate in younger generation as drivers while
many aged people die as pedestrians.
Table 6.7.1 Traffic Accidents in Turkey and Istanbul, 2006
Nation Istanbul Share (%)
Fatal accident 2,581 262 10
Injury accident 76,615 8,193 11
Property damage accident 585,344 209,544 36
Total 664,540 217,999 33
Persons died 3,365 282 8
Persons injured 135,224 12,809 9
Property damage (YTL) 1,152,919,799 349,279,296 30
Source: Istanbul Police Department

The Study on Integrated Urban Transportation Master Plan for Istanbul Metropolitan Area in the Republic of Turkey Final Report
Chapter 6
6-15
The yearly trend of traffic accident in Istanbul is shown in Figure 6.7.1 below. Total
number of accidents has been increasing for the last five years. But the number of fatal
accidents stays at the same level of 210 to 260 accidents per year.
0
50
100
150
200
250
300
2002 2003 2004 2005 2006
Year
Fata
lity
0
5,000
10,000
15,000
20,000
25,000
30,000
35,000
Inju
ry,
Pro
pert
y &
Tota
l
Fatality Injury Property Total
Source : ibid.
Figure 6.7.1 Number of Accidents in Istanbul
The number of people died or injured in traffic accident is shown in Figure 6.7.2 below. It
indicates a similar trend as the number of accidents. The number of persons died stays at
the same level while the number of persons injured increases every year.
0
50
100
150
200
250
300
2002 2003 2004 2005 2006
Year
Die
d
0
2,000
4,000
6,000
8,000
10,000
12,000
14,000In
juried
Died Injured
Source : ibid.
Figure 6.7.2 Number of Person Died and Injured
Figure 6.7.3 shows the type of accident. It is alarming that there are many accidents that
involve pedestrians who are most vulnerable in road traffic. High risk for pedestrians is
confirmed by the largest share of pedestrian in the number of persons died as shown in
Figure 6.7.4. These data suggest the necessity of traffic safety measures that protect
pedestrians.

The Study on Integrated Urban Transportation Master Plan for Istanbul Metropolitan Area in the Republic of Turkey Final Report Chapter 6
6-16
282 Died
Driver (33%)
Passenger (21%)
Pedestrian (46%)
12,809
Injured
Driver (41%)
Passenger (43%)
Pedestrian (16%)
Source : Traffic Police
Figure 6.7.3 Type of Accident, 2006
Source : Traffic Police
Figure 6.7.4 Accident Victims, 2006
6.7.2 Accident Data Recording System
Currently, when an accident happens, it is requested to call Traffic Police to the accident
site for investigation. The traffic policemen then prepare accident report. The report
includes the X and Y coordinates of accident site obtained by a GPS device provided to
every traffic patrol car. All traffic accident data are sent to the Traffic Police Headquarter in
Ankara for input into accident database.
Starting April 2008, it is planned to change the accident reporting system. Traffic Police
will not be required to be at accident site for property-damage accident. This is to
minimize the traffic congestion caused by the vehicles standing at the middle of road at
accident site waiting for the arrival of Traffic Police.
Instead, insurance company will keep the record of property-damage accident. A
computer system established by the insurance companies keeps traffic accident database.
Accident data will be provided to Traffic Police from the center.
Hit from side
Hit pedestrian
Hit from back
Hit object
Head on collision
Thrown out of road
Hit parked car
Turn over

The Study on Integrated Urban Transportation Master Plan for Istanbul Metropolitan Area in the Republic of Turkey Final Report
Chapter 6
6-17
Another issue regarding traffic accident recording system is the two organizations, Traffic
Police and Jandarma, both of them collect accident data. Some intercity roads are under
the jurisdiction of Jandarma, an organization under the military. Accident records are kept
by the respective organizations based on the classification of the road where accident
occurred. Accident data on the intercity roads are collected by Jandarma and they have
their own traffic accident data recording system. Thus, there is no consolidated accident
data system at the moment.
6.7.3 National Traffic Safety Program
Turkish Government embarked the road improvement and traffic safety project in 1996
with a financial assistance from the World Bank. A component of the project is the
National Traffic Safety Program aimed at reducing the number of traffic accidents. The
program defined safety vision, safety objectives and safety targets. In order to attain these
targets, institutional and technical action plans were developed.
As part of the program, necessary equipment was purchased and improvement works
were implemented at more than 317 accident black spots all over the country. The results
of black spot improvement were very positive and the number of accidents and fatalities
were dramatically reduced.
The program was to be applied for 10 years from 2002 to 2012 with an interim evaluation
of the results scheduled in 2006. The review was, however, not conducted, and the
program was not updated. Most of the action plans proposed were also discontinued.
Although the National Traffic Safety Program is a nation wide project, many
recommendations for improvement made in the program are a good reference and
applicable to Istanbul in enhancing traffic safety.
6.7.4 Black spot analysis and improvement
The Municipality did black spot analysis in 2003. A total of 548 accident locations along
D100 highway between Uskudar – Kadikoy section during 2001 and 2002 were input to
GIS system. Then a location was identified as black spot if two or more accidents
occurred within 250 meter distance. A total of 21 locations were found as black spot.
Deficits in road design, lack of safety devices such as signage and operational problem
like loading and unloading of minibus at improper location were identified as cause of
traffic accident. Improvement works were designed and implemented at these locations.
No evaluation works have been made to compare traffic accident data before and after
the implementation of improvement works. Thus no data is available as to the
effectiveness of the improvement works.
The black spot analysis and design of improvement works were carried out only once.
Since then no similar project has been implemented.
6.7.5 Traffic Education
Efforts have been exerted by the Municipality and traffic safety education activities are
carried out. One of such activities is Traffic Education Parks and Mobile Education Buses
under Istanbul National Education Head Directorate. These projects are for the student of
8-14 year old age group.
The Study on Integrated Urban Transportation Master Plan for Istanbul Metropolitan Area in the Republic of Turkey Final Report Chapter 6
6-18
There are two education parks, Topkapı Traffic Education Park and Florya Traffic
Education Park. In addition, another traffic education park is planned at Maltepe. These
education parks are equipped with facilities to provide modern traffic education and teach
student the traffic rules and manner.
The Municipality has two units of traffic education bus, one unit each for European side
and Asian side. The bus has the capacity to provide traffic education for 35 students and
normally visit two schools a day.
The achievement of the traffic education park and traffic education bus is summarized
below.
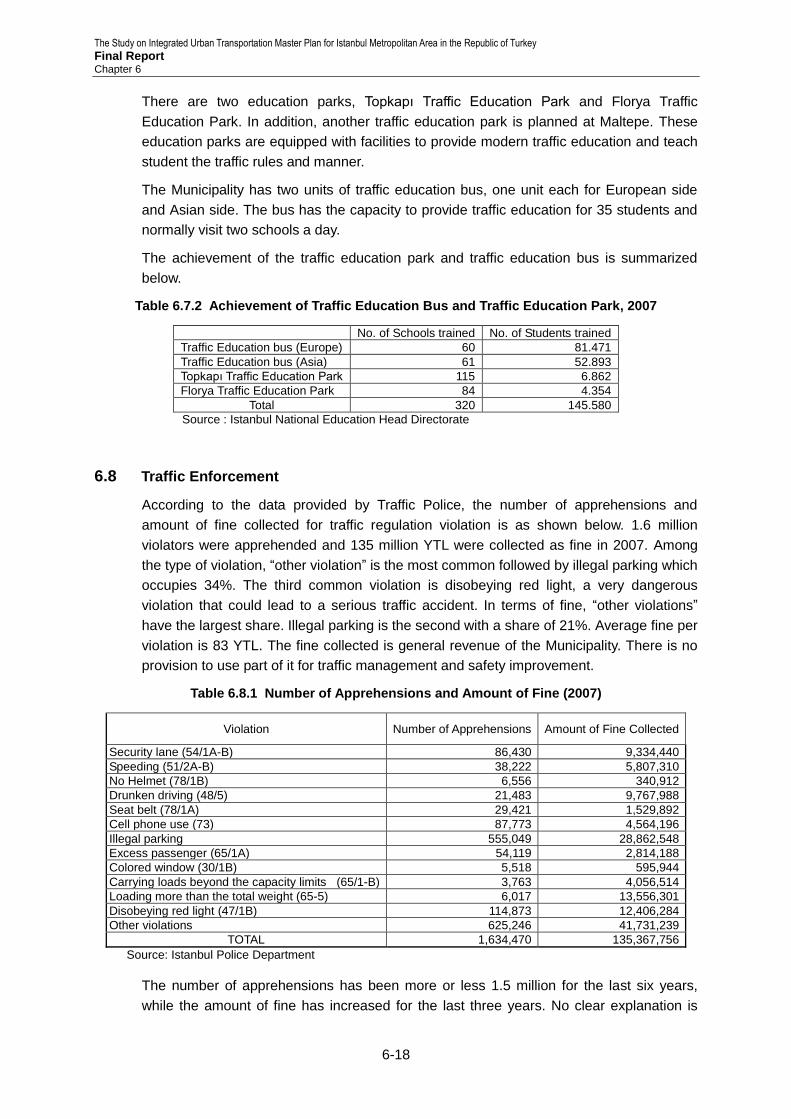
Table 6.7.2 Achievement of Traffic Education Bus and Traffic Education Park, 2007
No. of Schools trained No. of Students trained
Traffic Education bus (Europe) 60 81.471
Traffic Education bus (Asia) 61 52.893
Topkapı Traffic Education Park 115 6.862
Florya Traffic Education Park 84 4.354
Total 320 145.580
Source : Istanbul National Education Head Directorate
6.8 Traffic Enforcement
According to the data provided by Traffic Police, the number of apprehensions and
amount of fine collected for traffic regulation violation is as shown below. 1.6 million
violators were apprehended and 135 million YTL were collected as fine in 2007. Among
the type of violation, “other violation” is the most common followed by illegal parking which
occupies 34%. The third common violation is disobeying red light, a very dangerous
violation that could lead to a serious traffic accident. In terms of fine, “other violations”
have the largest share. Illegal parking is the second with a share of 21%. Average fine per
violation is 83 YTL. The fine collected is general revenue of the Municipality. There is no
provision to use part of it for traffic management and safety improvement.
Table 6.8.1 Number of Apprehensions and Amount of Fine (2007)
Violation Number of Apprehensions Amount of Fine Collected
Security lane (54/1A-B) 86,430 9,334,440
Speeding (51/2A-B) 38,222 5,807,310
No Helmet (78/1B) 6,556 340,912
Drunken driving (48/5) 21,483 9,767,988
Seat belt (78/1A) 29,421 1,529,892
Cell phone use (73) 87,773 4,564,196
Illegal parking 555,049 28,862,548
Excess passenger (65/1A) 54,119 2,814,188
Colored window (30/1B) 5,518 595,944
Carrying loads beyond the capacity limits (65/1-B) 3,763 4,056,514
Loading more than the total weight (65-5) 6,017 13,556,301
Disobeying red light (47/1B) 114,873 12,406,284
Other violations 625,246 41,731,239
TOTAL 1,634,470 135,367,756
Source: Istanbul Police Department
The number of apprehensions has been more or less 1.5 million for the last six years,
while the amount of fine has increased for the last three years. No clear explanation is

The Study on Integrated Urban Transportation Master Plan for Istanbul Metropolitan Area in the Republic of Turkey Final Report
Chapter 6
6-19
possible as to the increase in the total amount of fine.
Source : ibid.
Figure 6.8.1 Number of Apprehension and Fines Collected
Traffic police is interested in deputizing the enforcement of illegal parking to private
organization. But amendment of the existing laws is required to introduce such a system.
6.9 Summary
Current traffic management systems and measures in the study area were briefly
described above. The following comments are raised as a summary.
6.9.1 Technology Oriented Approach
It is very much appreciated that many new traffic engineering as well as information
technologies have been vigorously introduced for traffic management in the study area.
Current traffic conditions and expected travel time along expressways are available
through cellular phones. Data stored in the traffic signal can be uploaded or downloaded
from anywhere using data communication system of cellular phones. Instead of
conventional inductive loop type vehicle detector, video camera type vehicle detectors are
installed at some intersections for signal control. These are examples of the new
technology being used.
Unlike the process control in a chemical plant, traffic management involves human factor
as both road administrator and road user. In order to further upgrade the existing system,
consideration must be given to the role of human factor in the traffic control system.
Monitoring of traffic conditions through video camera is an important task of traffic control
system and video monitoring has become a standard facility. But incidents such as
congestion or accidents cannot be detected in a timely manner by an operator if there are
too many cameras. When a system is designed, due consideration must be given to the
operation of the system by the staff and a system that is balanced from the viewpoint of
operation must be constructed.
Dissemination of expressway traffic condition and expected travel time through the
internet including cellular phones is a technically interesting system. But usefulness of the
0
500
1,000
1,500
2,000
2,500
2002 2003 2004 2005 2006 2007
Year
Ap
pre
he
nsio
n (
x1
00
0)
0
20
40
60
80
100
120
140
160
Fin
e (
x m
illio
n Y
TL
)
Apprehension Fine

The Study on Integrated Urban Transportation Master Plan for Istanbul Metropolitan Area in the Republic of Turkey Final Report Chapter 6
6-20
existing system is limited. Because coverage area is limited to expressways and there will
be very few trips that start and end on or near expressways. Besides, reliability of the
information has to be examined.
Although technically simple, collecting the traffic condition data on the general road
network requires a laborious work to design, construct and maintain, the traffic control
system will be more useful if the data on the general road network are available.
6.9.2 Traffic Signal Control
Currently about 800 traffic signals are connected to the Control Center. But the system is
not a centralized control system as the signals are not controlled from the Center and
their operation is not constantly monitored. Data communication between the Center and
the controller is made only when an abnormality is detected in the controller, or if there is
a need to examine or alter the data stored in the controller. Thus the system is actually a
collection of individual signals and each signal operates in an isolated mode with fixed
signal control patterns. Such system is rigid in a sense that it does not respond to
changing traffic conditions.
The existing system was built with an objective of reducing initial and operating costs.
Limitation of data exchange and use of GPRS are very effective way to meet the
requirement compared with standard traffic control system in which each controller is
connected to the control center through a dedicated communication line and data is
exchanged every one second or shorter. Saving the data communication, however,
results in the limitation of signal control.
More sophisticated traffic control system must be introduced as traffic conditions in
Istanbul is already at critical level and small disturbances in the traffic flow have large
impacts thus requiring a highly efficient signal system. The introduction of camera
detectors is an improvement. But signals still operate in an isolated mode and their
effectiveness is limited. Fundamental changes in the signal control system will be required.
The Municipality is already aware of the necessity of upgrading signal system. Some
recommendations on the new signal system will be made later in this report.
6.9.3 Traffic Information System
In order to establish an effective and useful traffic information system, information
collection function must be strengthened. In the existing system, the traffic monitoring
relies on the operator to get traffic information. Amount, coverage area, frequency, and
consistency are therefore very limited and may vary among operators. It is simply
impossible to manually watch the traffic flow, judge the traffic condition and produce traffic
information for an area as large as Istanbul. The process must be automated and an
information collection system based on measured traffic condition data must be
introduced. Installation of many vehicle detectors incurs both initial investment costs and
maintenance costs, but the investment will be worth it considering the benefits it will bring
about through an improved traffic information system.
Standards must be established so as to better define congestion and the description of
traffic condition must be normalized. Message structures and terms used on variable
message signs must also be defined to correctly convey traffic information to the road
users.
The Study on Integrated Urban Transportation Master Plan for Istanbul Metropolitan Area in the Republic of Turkey Final Report
Chapter 7
7-1
Chapter 7 Institution, Finance and Environment
7.1 Institutional Framework
7.1.1 The Foundation of Metropolitan Governance
The municipality of Istanbul was created in 1854, a year after a decade Ottoman State
was divided into provinces, districts and villages. Following the establishment of Republic
of Turkey in 1923 as a unitary state, a local administration system was set up based on
the principles of a strong central government. Local authorities were considered public
corporate entities established to meet the needs of citizens in Turkey‟s provinces,
municipalities and villages.
1) The Legal Framework
(1) The Law on Municipalities No. 1580 of 1930
The Municipalities Law No. 1580 of 1930 delineated the duties and responsibilities of the
local authorities and remains the basic legislation for today‟s municipalities. During the
early years local authorities were seen as an extension of the central government. The
growing number of urban residents gradually began to make their voices heard and in the
70‟s formed an important power-base catching the interest of local politicians. So, the
mayors emerged as an influential group and demands were made to secure financing for
urban services.
The Municipal Law of 1930 failed to equip the municipal administrations to cope with the
above-mentioned challenges.
(2) The Constitution of 1982
The Turkish Constitution of 1982 stipulates that in terms of its establishment and functions
public administration constitutes a unified whole and is regulated by law (Article 123).
Article 127 designates that the central administration has the legal authority to practice
administrative tutelage (trusteeship) over local governments.
Some of the decisions of local authorities are subject to control by central administrative
bodies. This control can be in the form to approve, postpone, cancel, decide on behalf, or
to seek for prior permission. The central government exercises considerable control over
local authorities, mainly through the Ministry of Interior. The central government oversight
relies largely on exante controls to ensure compliance with laws.
The aims of this supervision are ensuring the functioning of local services in conformity
with the principle of integral unity of administration, uniformity of public services,
safeguarding public interest, satisfying and meeting local needs, increasing the
effectiveness, efficiency and stability in local authorities‟ activities.
Local administration is governed by Article 123 and 127 of the 1982 Constitution.
According to the Constitution, the central administration has “the power of administrative
tutelage over local authorities with the objective of securing uniform public services and
meeting local needs in an appropriate manner” (Article 127). While the central
government oversight has worked in the past, it is becoming increasingly difficult to
manage more than the 3,200 municipalities in an effective manner.

The Study on Integrated Urban Transportation Master Plan for Istanbul Metropolitan Area in the Republic of Turkey Final Report Chapter 7
7-2
(3) The Law on Metropolitan Municipalities No. 3030 of 1984
Some important changes in the local government system that enhances the autonomy
and local decision-making capabilities have occurred in the 1980‟s. According to the
legislative system, there were four types of local authorities in Turkey:
Special Provincial Administrations (81) – these cover areas that fall neither
among municipal or village boundaries.
Municipalities (3,226) - in areas which have more than 2,000 inhabitants.
Metropolitan municipalities (16) - are main urban areas which the district
municipalities are organized under umbrella organizations referred to as
Metropolitan municipalities.
Villages (about 35,000) – a village is governed by a head-man and average
village has a population of about 500.
The metropolitan area of Istanbul consists of (i) the metropolitan administration called
“Istanbul Metropolitan Municipality (IMM)”, (ii) 32 district municipalities, (iii) 37 sub-districts
municipalities, (iv) a Special Provincial Administration, (v) villages and (vi) Association of
local authorities. The IMM has an authorization of only 46% of the land in Istanbul
Province.
The Metropolitan Municipalities Law of 1984 established the new responsibilities and
areas of action for metropolitan and district municipalities. Metropolitan municipalities‟
responsibilities are as follows:
Preparation of master and investment plans.
Construction of major roads.
Building of passenger and freight terminals.
Consumer product testing laboratories.
Solid waste disposal sites and treatment plants.
Wholesale markets.
Implementation of city-scale joint venture.
The urban district municipalities are responsible for all basic municipal services which are
not specifically assigned to the metropolitan municipalities.
In the metropolitan municipalities, water and wastewater management is the responsibility
of semi-autonomous water and sewerage authorities. Solid waste collection is the
responsibility of the district municipalities while waste transfer and disposal are the
responsibility of the metropolitan municipalities. Construction and maintenance of the
main road is the responsibility of the metropolitan municipalities, while the secondary
roads are the responsibility of the district municipalities.
(4) The Settlement Law No. 3194 of 1985
The Settlement Law No. 3194 of 1985 has radically changed planning practices in Turkey.
Before this law, planning was strictly a centralized effort. Planning processes and
approval rights belonged to the Ministry of Public Works and implementations and control
of the plans were the duties of municipalities within the municipal boundaries. With the
legislative reforms in 1985, planning preparation, approval, planning implementation and

The Study on Integrated Urban Transportation Master Plan for Istanbul Metropolitan Area in the Republic of Turkey Final Report
Chapter 7
7-3
controlling rights and responsibilities were given to the municipalities within the municipal
boundaries.
Specifically, the Settlement Law of 1985 included the allocation of powers within the
planning hierarchies:
The right of preparation and approval of regional and sub-regional plans having
1/500,000 and 1/1000, 000 scales falls under the control of the State Planning
Organization (SPO). The preparation and approval of the development plans for
coastal zones, major industrial development areas, or environmentally critical
areas with a 1/25,000 scale, is the responsibility of the General Directorate of
Technical Research and Application (TAU) of the Ministry of Public Works and
Settlement
The detailed development plan with 1/5000, 1/1000 and 1/500 scales became
the duties of municipalities within the municipal boundaries.
Whereas out of those boundaries the responsibility for preparation, approval and
control of the implementations belonged to the local branches of the ministry.
(5) The Law on Metropolitan Municipalities No. 1850 of 2004
By the enactment of the Law No. 1850 on July 2004, the boundaries of IMM‟s authority
area became the territorial boundaries of the province (see Figure 7.1.1). The Law on
Metropolitan Municipalities (No.1850 of 2004) has, at first hand, transferred a substantial
amount of governmental authorities of local governance to IMM. This has not only
widened the spatial borders of authority, but also introduced a depending authority with
increased responsibility of areas.
2) Legislative and Institutional Reforms Related to Metropolitan Governance and Spatial
Planning and Development
Changes across the world and in Turkey have forced further developments and
restructuring in the role of the state and its organization. Public sector reform in Turkey
was aimed at:
Decentralization in administrative structuring.
Efficient and effective administrative structure.
Decentralization of the administrative structure and getting rid of inert structures.
Delivery of better quality services to citizens at the most appropriate locations in
the shortest amount of time and with relevant cost effective solutions.
Public sector reform efforts in Turkey date back to the 1960‟s. Since then, official 5-year
development plans and the report were prepared by the Public Administration Institute of
Turkey and the Middle East (TODAIE) addressed the problems of public administration
and local governments (i.e. Central Government Mechanisms Research Project 1963;
Restructuring Administration: Principles and Proposals -1971: Public Administration
Research Project-1991). The 1980‟s trend in western countries that favor smaller states
had an impact on Turkey, resulting in an elevated official agenda for redefining the role of
the state, downsizing its public sector, and increasing the efficiency of public service
delivery. Nevertheless, lack of a strong political leadership impeded such plans from
translating into concrete legislative reforms and actions. As a result, Turkey‟s public
The Study on Integrated Urban Transportation Master Plan for Istanbul Metropolitan Area in the Republic of Turkey Final Report Chapter 7
7-4
administrative system remained ineffective and failed to match extensive economic
liberalization that took place in the 1980‟s. Recognizing this gap and Turkey‟s low
performance compared to many other countries around the world, AKP included public
sector reform into its Urgent Action Plan in 2002, in addition to its government program.
In essence, the Urgent Action was intended to restructure intergovernmental relationships
among the central government, provincial authorities (governors) and municipalities
(mayors). They envisioned relegating some of the powers of the central government to
regional and local administrative entities. By such a reform schedule, AKP government
claimed to increase transparency and accountability, strengthen administrative capacities
and productivity, and encourage a participatory and result-oriented decision-making
process. To this end, it introduced through draft laws concepts such as “city councils”,
“voluntary participation in local government services”, and the “right to information”.
3) Public Sector Reform Efforts since 2003
Studies on restructuring the public management, carried out in Turkey since 2003, are
based on the development of the world, the current situation of the country, the Urgent
Action Plan and the Program of the 58th and 59th governments. In the light of these
undertakings, it has become essential to adapt with the changes taking place in Turkey
and throughout the world, to shift to a knowledge-based economy, to enhance the trust
between citizens and the state by developing an effective and efficient organization in
public services, public management reforms, which the government planned to achieve in
a rolling process, including making cultural changes, and by introducing numerous
methods which have been adopted by developing countries.
Restructuring efforts in public management launched in 2003 have a wide scope:
a) To redefine the duties, powers and responsibilities of the central and local authorities.
To establish a legal infrastructure in accordance with redefined roles.
To restructure central public administration in line with their new roles.
b) To identify the work procedures of central public departments and to fight red tape and
bureaucracy in the public services.
c) To undertake reforms on legislation in order to simplify the legislation and to reduce
the administrative burden imposed by regulations. And,
d) To improve the human resources management according to New Public Management.
4) Institutional Capacity Building through Strategic Planning at the Institutional Level
As the accomplishments of restructuring efforts since 2003, the legal infrastructure of the
central and local administrations were established: The new legislative reforms, including
the Law on Municipalities (No. 5393/2005), the Law on Metropolitan Municipalities(No.
5216/2005) and Law on Provincial Local Government (No. 5302/2005) and the Law on
Public Financial Management and Control, require all public institutions, as well as
municipalities and local governments, to prepare institutional strategic plans. Specifically,
these legislative changes related to metropolitan governance and urban and regional
development-management focuses on the following issues:
Decentralization of authority to local authorities
New laws enable local municipalities to enjoy more local tax incomes generated by
The Study on Integrated Urban Transportation Master Plan for Istanbul Metropolitan Area in the Republic of Turkey Final Report
Chapter 7
7-5
real estate markets and other local resources, which provide the necessary funds for
implementing a local strategic of development.
Widening the borders of the Greater Municipality of Istanbul.
The new law on metropolitan municipalities has at first hand transferred a substantial
amount of governmental authorities of local government to IMM. This has not only
widened the spatial borders of authority, but also introduced a depending authority
with increased responsibility over areas.
Enabling private-public-non governmental organization partnerships
Though the municipalities have before been able to establish different types of
partnership with the private sector, the new laws provide that a city council should be
established to represent different groups of society. The Law on Regional
Development Agency (No.5549/2006) is to enable a well defined organizational form
of private-public and non-governmental organization partnership that would be the key
to successful strategic planning at the urban-regional level.
Enabling horizontal partnerships and cooperation between local governments:
The Law on Municipalities (No. 5393/2005), the Law on Metropolitan Municipalities
(Nr. 5216/2005), the Law on Provincial Local Government (No.5302/2005) and the
Law on Associations of Local Authorities (No. 5355/2005) enable the establishment of
horizontal partnerships and cooperation between local governments‟ spatial planning
and better management of space.
The Law on Municipalities, Law on Metropolitan Municipalities, Law on Provincial Local
Government and the Law on Public Financial Management and Control has all changed
in accordance with each other, and the Planning and Redevelopment law is changing.
These developments which were meant for a unified planning approach touching on the
issue of the borders of the Greater Municipality of Istanbul extended to the provincial
borders, thus full spatial planning power was transferred to the municipality.
5) Evaluation of Current Legislative and Administrative Reforms
The years 2004-2006 were important periods for administrative reforms in Turkey. The
adaptation of a transition plan for national development to synchronize national plans and
budgets with the European Union (EU) Policy Period 2007-2013 was a necessary step.
The 9th National Development Plan 2007-2013 is heavily influenced by the membership
process to the EU. These policies which take place within the Community Strategy
Guidelines for 2007-2013 has become more important for both national and regional
development studies and approaches. Further decentralization of governance to local
authorities and the introduction of other laws related to spatial planning and development
in this recent period in Turkey has also introduced more opportunities for local
governments to implement strategic development decisions, either in line with overall
OECD or United Nations Millennium Goals.
Administrative Reforms of Central, Regional and Local Governments
Legislative reforms have been brought into the administrative reforms of the central,
regional and local governments to cope with the increase and diversification of the
social and economic needs in parallel with economic reforms, although the structure
and tradition of centralized public administration still persists in spite of many support
The Study on Integrated Urban Transportation Master Plan for Istanbul Metropolitan Area in the Republic of Turkey Final Report Chapter 7
7-6
for self-governance and devolution of powers from the central government to the
provincial governments.
Decentralization Policy and Local Administration Reform
The government aim is to restructure the local governments to become compliant with
the principles laid down in the European Charter of Local Self-Government and to be
more efficient, accountable, participative and transparent. A reform process was
started in respect with the organization, duties and power, financial resources,
personnel and relations with the State government of the local administration in line
with the Urgent Action Plan (2002), and also the government has brought two bills to
the parliament for public administration reforms and local government administration.
The administrative tasks and services between the state and local governments were
demarcated in these bills.
6) Distribution of Powers between the Various Categories of Central and Local Authorities
A. Service Provided by Central Government
Public Administration systems in Turkey are basically composed of the central
government and the local government. According to the 1982 Constitution, Turkey was
divided into provinces. The administration is based on the principles of devolution. The
functions and powers of this organization shall be regulated by law (Article 126). The
central government is composed of the ministries and their field organizations. The
country has been divided into provinces, sub-provinces and communities.
Central authorities directly provide many urban services through the field offices of
relevant ministries or via some regional organizations of central government bodies.
Among the most important of these services are security and police, planning, educational
institutions at all levels, health services, museums and cultural facilities, major intercity
expressways, postal and telecommunications services and electricity supply and
distribution.
B. Service Responsibilities of Municipalities
The functional framework of municipalities was set by the Municipalities Law of 1930
which assigns a broad range of responsibilities to these institutions. The mandatory
(compulsory) services for which municipalities are responsible according to the Law are:
Urban planning and mapping, regulation of construction
Land development
Urban renewal
Construction of social housing
Mass transportation
Construction of urban roadways, bridges
Provision of water, sewerage
Refuse collection and disposal
Fire prevention
Recreational, cultural, educational facilities
Veterinary services
Health and social welfare facilities
Protection of areas of natural and historical value.
The Study on Integrated Urban Transportation Master Plan for Istanbul Metropolitan Area in the Republic of Turkey Final Report
Chapter 7
7-7
In addition, municipalities may carry out any type of optional (arbitrary) activity for the
common well-being of their inhabitants.
Since the 1930‟s, as a result of major socio-economic development, there have been
significant changes in local level public needs and in the structure of urban settlements. In
the 1970‟s, there has been a significant expansion in the scope of the municipal activities
to meet the rapidly changing needs.
Today, the core municipality responsibilities are transportation, water and wastewater
services and solid waste management. The services are provided by municipalities and
municipal enterprises. There are also municipal enterprises that run commercial
operations and are not directly connected to the core services.
7.1.2 Institutional Framework
1) IMM Administration of Urban Transportation and Land Use Planning and Management
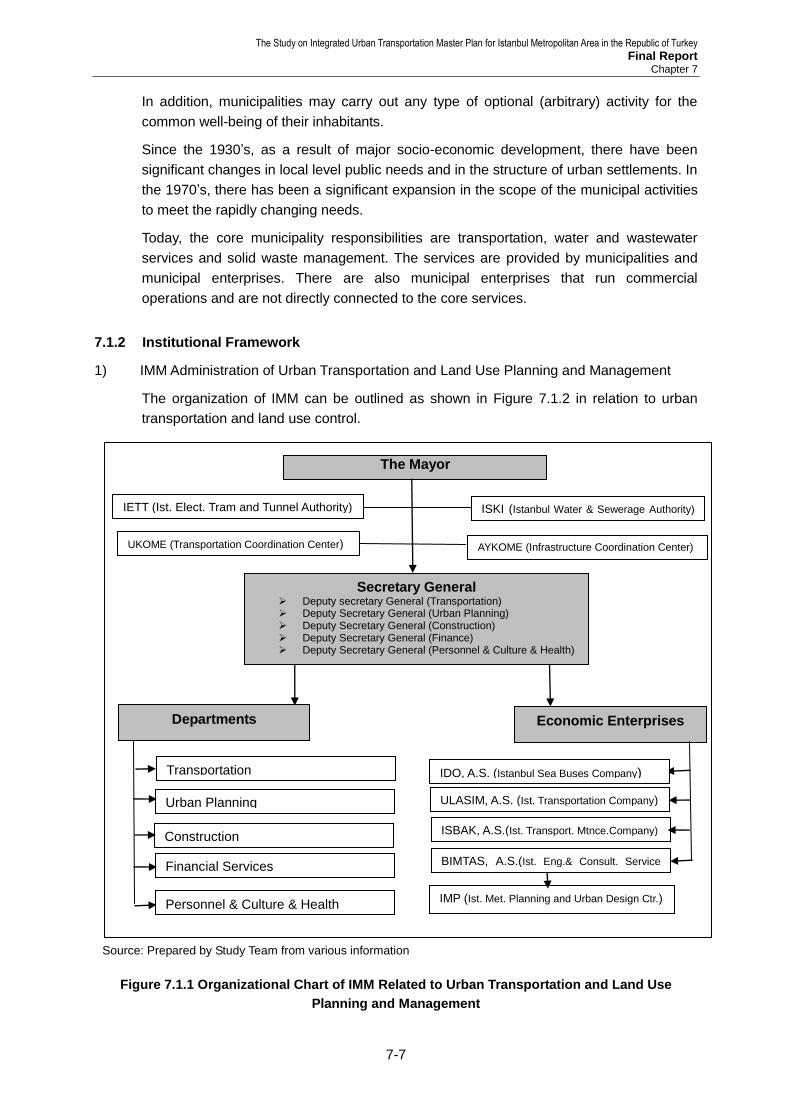
The organization of IMM can be outlined as shown in Figure 7.1.2 in relation to urban
transportation and land use control.
Source: Prepared by Study Team from various information
Figure 7.1.1 Organizational Chart of IMM Related to Urban Transportation and Land Use
Planning and Management
Economic Enterprises
Financial Services
UKOME (Transportation Coordination Center)
ISKI (Istanbul Water & Sewerage Authority)
Authority)
Departments
The Mayor
AYKOME (Infrastructure Coordination Center)
Transportation
Urban Planning
Construction
Personnel & Culture & Health
IDO, A.S. (Istanbul Sea Buses Company)
ISBAK, A.S.(Ist. Transport. Mtnce.Company)
IMP (Ist. Met. Planning and Urban Design Ctr.)
IETT (Ist. Elect. Tram and Tunnel Authority)
Secretary General Deputy secretary General (Transportation) Deputy Secretary General (Urban Planning) Deputy Secretary General (Construction) Deputy Secretary General (Finance) Deputy Secretary General (Personnel & Culture & Health)
BIMTAS, A.S.(Ist. Eng.& Consult. Service Co.)
ULASIM, A.S. (Ist. Transportation Company)

The Study on Integrated Urban Transportation Master Plan for Istanbul Metropolitan Area in the Republic of Turkey Final Report Chapter 7
7-8
2) Decision-making Bodies
The following bodies are responsible for the planning and implementation of urban
transportation and land use development and management:
(1) The Metropolitan Municipality Council (the “City Council”)
(2) The Metropolitan Mayor (the “Mayor”)
(3) IETT (Istanbul Electric, Tram and Tunnel Authority)
(4) ISKI (Istanbul Water and Sewerage Authority)
(5) UKOME (Transportation Coordination Center)
(6) AYKOME (Infrastructure Coordination Center)
(7) Secretary General
Deputy Secretary General (Transportation)
Deputy Secretary General ( Urban Planning)
Deputy Secretary General (Construction)
Deputy Secretary General (Finance)
Deputy Secretary General (Personnel & Culture & Health)
(8) Economic Enterprises
ULASIM, A.S (Istanbul Transportation Company)
IDO, A.S.(Istanbul Sea Buses Company)
ISBAK, A.S (Istanbul Transportation Maintenance Company)
BIMTAS, A.S.(Istanbul Engineering and Consultancy Services Company)
IMP (Istanbul Metropolitan Planning and Urban Design Center)
(9) Departments and Directorates
Department of Transportation
(i) Directorate of Transportation Planning
(ii) Directorate of Transport Coordination
(iii) Directorate of Rail Transit Systems
(iv) Directorate of Road Maintenance and Repair
(v) Directorate of Traffic
(vi) Directorate of Public Transportation Services
Department of Urban Planning
Department of Construction
Department of Financial Services
(i) Directorate of Budget and Supervision
(ii) Directorate of Expenditures
(iii) Directorate of Revenues
(iv) Directorate of Finance
(v) Directorate of Financial Supervision
Department of Personnel & Culture & Health
The Study on Integrated Urban Transportation Master Plan for Istanbul Metropolitan Area in the Republic of Turkey Final Report
Chapter 7
7-9
3) Duties and Authorities
(1) The City Council
The City Council is the ultimate decision-making organ of IMM. It is composed of the
representatives of district municipalities within the metropolitan boundaries, who gain the
most number of electoral votes, and the mayors of the district municipalities. The council
is chaired by the metropolitan mayor. The term of each member of the council is five
years.
(2) The Mayor
The mayor is the highest authority of the municipal organization, directing and
administering the municipal organization and protects the rights and interests of the
municipality. The mayor has the power to conclude contracts on behalf of the municipality
and represents the municipality in the courts as plaintiff or defendant.
(3) IETT
IETT, which is a public corporation, provides intra-city transportation services throughout
Istanbul. IETT was founded in 1939 with the adaptation of Law No. 3645. It has a fleet of
2,377 busses on 531 Lines; 0.573 km tunnel and 1.7km Tunnel-Taksim Tram Line on
2500 km of the metropolitan area. IETT is also responsible for the management of the
private buses (OZ) and double decker buses.
(4) ISKI
ISKI, a public corporation with its own independent budget, is attached to IMM.
It was initially set up in 1981 with the adaptation of Law No: 2560 and was under the
control of Istanbul Governor‟s Office, before it was transferred to the control of IMM under
the terms of Law No. 3009 in 1984. The services provided by the General Directorate of
ISKI were confined to areas within the jurisdiction of IMM. However, its service area was
extended to provide drinking water and sewage services for IMM. Duties and authorities
of ISKI include the following:
To manage all types of groundwater and especially surface water resources to
provide a drinking and domestic water supply and to distribute water to demand
centers.
To collect wastewater and storm water and remove them from centers of
habitation.
(5) UKOME
UKOME provides coordination among transportation services, determines routes,
schedules, fares of public transportation, prepares or contracts out transportation plans
and traffic commission.
Members of UKOME include:
Mayor of IMM
Secretary General of IMM
Director of Transportation Department
Deputy Secretary General
1st Legal Advisor

The Study on Integrated Urban Transportation Master Plan for Istanbul Metropolitan Area in the Republic of Turkey Final Report Chapter 7
7-10
Head of Science Affairs Department
Representative of IETT Directorate General
Representative of IDO, A.S. General Director
Representative of ULASIM, A.S Directorate General
Head of Transportation Coordination Directorate
Director of Public Transportation Services
Director General of Highways (TCK) 17. Region
Representative of City Gendarme Commandership
Representative of Turkish State Railways (TCDD)
Representative of Istanbul Highway Transportation Region Directorate
Coast Security Marmara and Bosporus Region Commandership
Representative of Marine Undersecretariat Sea Transportation General
Directorate
Representative of Country Airport Administration
Representative of National Defense Ministry 1st Army Commandership Logistics
Department‟
Deputy of Istanbul Security Director
Representative of Railways, Harbors and Airport Construction (DLH) Directorate
General
(6) Secretary General
Heads the secretariat of IMM and administers the municipal affairs supported by 5 Deputy
Secretary Generals.
(7) Department of Transportation
Directorate of Transportation Planning - Prepares the transport master plan for
IMM authority area.
Directorate of Transportation Coordination - Serves as the Secretariat for
UKOME.
Directorate of Public Transportation Services - Gives permits; determines routes,
schedules, fares of public transportation (buses and trains excluded).
Directorate of Rail Transit System - Construction of rail transit system projects.
Directorate of Traffic - Road signalization and traffic monitoring.
Directorate of Road Maintenance and Repair - Road Maintenance and Repair.
Directorate of City Traffic Commission:-determines routes of public transportation.
(8) Economic Enterprises
IDO A.S. (Istanbul Sea Buses Company) - Operates the ferry services.
ULASIM A.S. (Istanbul Transportation Company) -Operates Istanbul Metro
system.
ISBAK, A.S (Istanbul Transportation Maintenance Company) -Manufactures
traffic signalization systems for IMM.
BIMTAS A.S. (Istanbul Engineering and Consultancy Services Company) -
Promotes project-based consultancy and engineering services.
IMP (Metropolitan Planning and Urban Design Center) was established in
September 2005 - IMP consists of over 400 urban planning professionals and

The Study on Integrated Urban Transportation Master Plan for Istanbul Metropolitan Area in the Republic of Turkey Final Report
Chapter 7
7-11
academics that work on 10 key areas of urban development, among them land
use planning coordinated with transportation planning. IMP is attached to
BIMTAS.
7.1.3 Roles of Central Government in Urban Transportation and Land Use Planning
1) Central Government is Responsible for Urban Transportation and Land Use Planning
The organization of the control government is shown in Figure 7.1.3 in relation to urban
transportation and land use control.
Source: Prepared by Study Team from various information
Figure 7.1.2 Organizational Chart of Central Government Concerning Urban Transportation
and Land Use Planning
Prime Ministry SPC (Supreme Planning Council)
THE GOVERNMENT
PHC (Privatization High Council)
MOTC (Ministry of Transport. & Communication)
MPWS (Ministry of Public Works &Settlement)
MOI (Ministry of Interior)
TCDD (Gen. Dir. of Turkish State Railways)
DLH (Railways, Harbors, Airport Construction)
UMA (Undersecretariat of Marin Affairs)
MOND (Ministry of National Defense)
TDI ((Turkish Maritime Transportation Company)
DHMI (Gen. Dire. of State Airport Operations)
TAU (Gen. Dir. of Tech. Research & Application)
KGM (General Directorate of Highways)
Iller Bank (The Bank of the Provinces)
UDI (Undersecretariat of Defense Industry)
SPO (State Planning Organization)
Privatization Administration
Undersecretariat of Treasury
MOT (Ministry of Tourism)
MOIT (Ministry of Industry & Trade)
MOEF (Ministry of Environment & Forestry)
The Study on Integrated Urban Transportation Master Plan for Istanbul Metropolitan Area in the Republic of Turkey Final Report Chapter 7
7-12
(1) Decision-making bodies
The following bodies are responsible for the legislation and regulations concerning urban
transportation and land use planning and management:
A SPC: Supreme Planning Council
B PHC: Privatization High Council
C Prime Ministry
SPO State Planning Organization
Privatization Administration
Undersecretariat of Treasury
D Ministry of Transportation and Communications (MoTC)
TCDD General Directorate of State Railways
DLH General Directorate of Railways Harbors and Airports Construction
DHMI General Directorate of State Airports Operations
UMA Undersecretariat of Maritime Affairs
TDI Turkish Maritime Transportation Company
E Ministry of Public Works and Settlement (MoPWS)
KGM General Directorate of Highways
TAU General Directorate of Technical Research and Application
Iller Bank Bank of Province
F Ministry of Industries and Trade (MoIT)
G Ministry of Culture and Tourism (MoCT)
H Ministry of National Defense (MoND)
UDI Under secretariat of Defense Industry
I Ministry of Environment and Forest (MoEF)
J Ministry of Interior (MOI)
(2) Duties and Authorities
A Supreme Planning Council (SPC)
The authority to make policy and implement it rests with SPC which is composed of the
following members:
Prime Minister
Deputy Prime Minister
Minister of State (Economic Affairs)
Minister of Finance
Minister of Transportation
Minister of Public Works and settlement
Minister of Industries and Commerce
Minister of Energy and National Resources
Undersecretary of State Planning Organization (SPO)
The Study on Integrated Urban Transportation Master Plan for Istanbul Metropolitan Area in the Republic of Turkey Final Report
Chapter 7
7-13
B State Planning Organization (SPO)
SPO is responsible for the preparation and implementation of Five Year Plans. It comes
under the Prime Minister‟s Office and policy direction from SPC. SPO is also responsible
for the preparation of regional plans (whole or partial area of Marmara Region) or having
them prepared through 1/500,000 and 1/100,000 scales.
C Undersecretariat of Treasury
Undersecretariat of Treasury is responsible for the legislation and regulations concerning
Foreign Direct Investments (FDI)
D Privatization High Council (PHC)
PHC is the ultimate decision-making body for privatization in Turkey headed by the Prime
Minister and composed of four ministers. PHC nominates the organizations for
privatization through taking state-owned economic enterprises in and out of the
privatization portfolio and is responsible from the methodology and timing of the
privatization procedures by approving the final transfer procedures of the organizations to
real people and /or legal entities
E Privatization Administration (PA)
The PA is the executive body for privatization process. It is a legal public entity with an
exclusive budget, reporting directly to Prime Minister. The PA‟s major duties include the
execution of PHC‟s decisions, advising the PHC in matters related to the transfer of SEE‟s
into or out of privatization portfolios and the restructuring and rehabilitation of SEE‟s in
order to prepare them for privatization.
F Ministry of Transportation and Communications (MoTC)
General Directorate of Railways, Harbors and Airports Construction (DLH)
General Directorate of Turkish State Railways (TCDD)
General Directorate of State Airports Operations(DHMI)
Undersecretariat for Maritime Affairs (UMA)
Turkish Maritime Transportation Company (TDI)
The DHL is responsible for the legislation and regulation concerning the railways, harbors
and airport constructions. It is the executing agency of the Marmaray Project which is
under construction. It has been assigned as the executing agency for the proposed
Istanbul Strait Road Tunnel Crossing Project.
TCDD is responsible for the legislation and regulations concerning commuter rail
operations and it has been involved in the Marmaray Project
The DHMI is responsible for the legislation and regulations concerning airport operations
and it serves as the executing agency for Ataturk International Airport under a lease
contract with Tepe-Afken Joint venture (TAV).
TDI is responsible for the legislation and regulations concerning port operations and has
been involved in the privatization of the Galata Port/Istanbul
UMA handles the legislation and regulations concerning maritime affairs and serves as
the regulatory authority.

The Study on Integrated Urban Transportation Master Plan for Istanbul Metropolitan Area in the Republic of Turkey Final Report Chapter 7
7-14
G Ministry of Public Works and Settlement (MoPWS)
General Directorate of Technical Research and Application (TAU)
Bank of Province (Iller Bank)
General Directorate of Highways (KGM)
MPWS is a hierarchical bureaucracy composed of (i) The executive unit (the Minister/
Undersecretary/5 Deputy Under Secretaries), (ii) consultation and inspection unit, (iii)
main service units, (iv) support units, (v) annexed units and (vi) provincial organizations.
TAU, one of the core units of MPWS, is empowered to prepare development plans of
1/50,000 and 1/25,000 scale for whole or partial areas in the IMM.
Iller Bank (The Bank of the Provinces) provides loans for investment projects of
municipalities, in compliance with the bank‟s evaluation criteria.
KGM is one of the annexed units headed by general director who was supported by 5
deputy general directors who oversee 9 functional departments, e.g. Department of
Bridges, Department of Motorways and Department of Strategic Development, etc.
KGM is responsible for the legislation and regulations concerning road and bridge
construction and is the executing agency for the construction of two suspension bridges
crossing the Bosporus and the Seismic Reinforcement Projects for Large Scale Bridges in
Istanbul (First and second Bosporus Bridges and the Old and New Golden Horn Bridges
and their approach viaducts). It is currently considering the construction of a new bridge
crossing the Bosporus (“The Third Bosporus Bridge”)
H Ministry of Industries and Trade (MoIT)
I Ministry of Culture and Tourism (MoCT)
J Ministry of Environment and Forest (MoEF)
MOIT, MOT and MOEF are approving and controlling government agencies for land-use
plans.
K Ministry of Interior (MoI)
MoI is in charge of traffic police and City Traffic Commission.
L Ministry of National Defense (MoND)
Undersecretariat of Defense Industry (UDI)
UDI is responsible for the legislation and regulations concerning airport construction and
operations. It is the Executing Agency of the Sabiha Gokcen Airport/Istanbul which has
recently awarded to the Limak-GMR-Malaysia Airport Partnership a 4.35 billion contract.
The contract involves VAT and costs 250 million euro for a 20-year lease of the airport.
UDI is also the executing agency of Antalya Airport under a $3.2 billion lease contract with
the Ictus Frankfurt Airport Consortium.
7.1.4 Decision-making on Land Use Plans and Implementation
1) Decision-making-at Central Level
The following bodies are responsible for the legislation and regulations concerning land
use planning and management:
The Study on Integrated Urban Transportation Master Plan for Istanbul Metropolitan Area in the Republic of Turkey Final Report
Chapter 7
7-15
(1) State Planning Organization (SPO) is responsible for:
The preparation of Five Year Plans.
The preparation of Regional Plans (whole or partial area of Marmara Region) or
having them prepared in 1/500,000 and 1/100,000 scales.
(2) The Ministry of Public Works and Settlement (MoPWS) is responsible for:
The preparation of territorial plans, or having them prepared, and their approval
through the Settlement Law No. 3194 (1985).
The preparation of land use plans for areas subject to disaster and their approval
through the Disaster Law No. 7269/1051 (1959).
The approval of Tourism Area and Centers Master Plan through the Tourism
Encouragement Law No. 2634 (1982).
The approval of landfill in coasts or land gained by drying through the Coastal
Law No. 3621 (1990).
The approval of land use plans related to public institutions, important for
transportation, and mass housing implementations through the Settlement Law
No. 3194 (1985).
The approval of land use plans of explosive and flammable material stores
through the regulation announced relative to second article of the Law No. 6551
(1987).
The preparation and approval of land use plans of Squatter Prevention Areas or
Rehabilitation Zones through the Squatter Law No. 775/3384 (1966). And,
The approval of Implementation Plans of National Park through the Law on
National Parks No. 2873 (1993).
(3) The Ministry of Culture and Tourism (MoCT) is responsible for:
The approval of tourism establishment implementation plan in tourism areas and
centers through the Tourism Encouragement Law No: 2634 (1982).
The approval of implementation plans on touristic uses continuing from landfill in
coasts through the Coastal Law No: 3621 (1990).
The plans within Greater Municipalities through the Law on Metropolitan
Municipalities No: 3030 (1984).
The Construction and Occupancy Permits through the Settlement Law No: 3194
(1985) and the Law on Metropolitan Municipalities No.3030 (1984).
Approval of implementation plans of municipalities in Greater Municipality
boundaries through the Law on Metropolitan Municipalities No: 3030 (1984).
(4) The Ministry of Environment and Forestry (MoEF) is responsible for:
The preparation of environmental basin plans with scale of 1/25,000 on sustainable and
ecological basis through the Government Decree on the Establishment and Duties of the
Ministry of Environment No: 443.
(5) The Institution of Specially Protected Areas is responsible for:
The preparation and approval of every type and scale of plans specially in
protected areas through the Government Decree on the Establishment. And,
Duties of the Institution of Specially Protected Areas.
The Study on Integrated Urban Transportation Master Plan for Istanbul Metropolitan Area in the Republic of Turkey Final Report Chapter 7
7-16
(6) The Bank of the Provinces (Iller Bank) is responsible for:
The preparation of land-use plans by itself or through private tenders with the request of
the municipalities, through the Law on the Bank of the Provinces No: 4759 (1945).
2) Decision-making at Regional Level:
(1) Bosporus Higher Planning Coordination council is responsible for:
The approval of plans or plan amendments in the coastal strip.
The front view areas of the Bosporus through the Bosporus Law No: 2960 (1983).
(2) Southeastern Anatolian Project Regional Development Administration is responsible for:
The use of rights and competence on planning and infrastructural issues in
South-Eastern Anatolian Region Provinces relative to the Laws No: 1580 and
3194 through the Government Decree No: 399 (1989).
(3) Regional Councils of Cultural and Natural Resources Protection Councils are responsible
for:
The instructions on land-use plans with conservation objectives in urban and
archeological natural conservation area through the Law on the Protection of
Cultural and Natural Resources No: 2863/3386 (1983).
3) Decision-making at Provincial Level:
(1) The provincial government is responsible for:
The preparation and approval of land-use plans outside the municipal and
adjacent area boundaries through the Settlement Law No: 3194 (1985).
The announcement of mass housing areas through Mass Housing Law No: 2985
(1984).
The determination of village settlement areas through Settlement Law No. 3194
(1985).
The determination of village settlement areas and approval of their plans through
the Village Law No: 442/3367 (1987).
4) Decision-making at Settlement Level:
(1) Municipality is responsible for:
The preparation of land-use plans within the boundaries of Municipalities and
Adjacent areas through Settlement Law No: 3194 (1985).
The determination of squatter areas and upgrading zones and preparation and
approval of their land-use plans through the Squatter Law No: 775/3811.
The preparation and approval of upgraded implementation plans through the
Amnesty Law on Settlement Development No: 2981/3290/3386.
The Construction and Occupancy Permits through the Settlement Law No: 3194
(1985) and the Municipality Law No: 1580 (1930).
The approval of land-use plans related to land-uses other than tourism in
touristic areas and centers through the Tourism Encouragement Law No: 2634
(1982).

The Study on Integrated Urban Transportation Master Plan for Istanbul Metropolitan Area in the Republic of Turkey Final Report
Chapter 7
7-17
(2) Metropolitan Municipality is responsible for:
The preparation and approval of master or land gained by drying through the
Law on Metropolitan Municipalities No: 3030 (1984).
(3) The Ministry of Culture and Turism (MoCT) is responsible for:
Making the decision for the regional or higher council to obey in urban,
archeological, and natural preservation areas through the Law on the Protection
of Cultural and Natural Resources No: 2863 (1983).
(4) Higher Council of Protection of Immovable Cultural and Natural Resources is responsible
for:
Taking the decisions of planning and constructing for urban, archeological and
natural preservation areas through the Law on the Protection of Cultural and
natural Resources No: 863 (1083).
(5) Ministry of Environment and Forestry (MoEF) is responsible for:
The determination and protection of national and natural parks, and preparation
of development plans through the Law on National Parks No. 2873 (1993).
7.2 Financing of Local Authorities
7.2.1 Income Sources of Local Authorities
According to Article 23 of Section 6 of the Law on Metropolitan Municipalities (No. 5216 of
2004) metropolitan municipalities are entitled to tap the following income sources:
Shares to be transferred by Iller Bank (Bank of Province) from funds to be
determined by the Council of Ministers over the total amount of general budget
tax incomes for the country and first degree municipalities;
Five percent share to be calculated over the general tax income collected within
greater city municipal borders and deposited by the Finance Ministry until the
end of the next month in the account of greater city municipality.
Fifty percent of the entertainment tax to be collected by the greater city
municipality from bets, including horse races, according to the proportions and
principles set forth in Municipal Income Law No:2464. Twenty percent of the said
amount is to be transferred to the municipality where the horse races are made
and 30% to be distributed to other municipalities and first degree municipalities
according to their population‟.
All kind of municipal taxes, charges and fees to be collected from the social and
cultural facilities, sporting, entertainment and recreation, and green areas under
the control of a greater city or municipality.
Taxes and charges collected from the bill boards and advertisements are posted.
The remaining 50%, after the distribution of 50% of incomes, is gained from the
operation of designated parking places.
Road, water and sewage expenses to be collected at the rate and according to
the principles set forth in Municipal Income Law No:2464; these services should
be performed by the greater city or municipality.
Incomes gained from rents, interests and fines.

The Study on Integrated Urban Transportation Master Plan for Istanbul Metropolitan Area in the Republic of Turkey Final Report Chapter 7
7-18
Aids from public administrations and enterprises.
Incomes are registered on the basis of final accounts of subsidiaries, and
incomes are transferred as a result of surplus accrued in expenditure.
Shares to be acquired from the net profits of economic enterprises of greater city
or municipality at a rate to be determined by the greater city or municipality.
Incomes gained from movable and immovable properties owned by the greater
city or municipality.
Fees to be collected against the rendered services.
Conditional and unconditional donations.
Other forms of incomes.
The Council of Ministers is authorized to double the 5% share mentioned above or to
reduce it to legal rates, 75% of this share is deducted from this amount and is directly
deposited to the account of concerned municipality; the remaining 25% is distributed to
the greater city or municipalities according to their populations. Calculation and
distribution transactions are executed by the Finance Ministry.
7.2.2 Financing Expenditures of Local Authorities
1) Revenues
Tax Revenues
(a) Local Tax
(b) Tax Share from General Budget
Non-Tax Revenues
Factor Income
Borrowing
(1) According to the Law on Municipal Revenue No. 2464 and the Law on Property Tax
No. 1319 tax revenues are:
Property Tax
Announcement and Advertisement Tax
Entertainment Tax
Communication Tax
Fire Insurance Tax
Environment Cleaning Tax
(2) Tax Share from General Budget is (Law on Transfer of Tax Revenues of General
Budget to Municipalities and Special Provincial Administrations No. 2380) consist of:
Six percent of general budget tax revenues transferred to municipalities.
One point twelve percent of the general budget tax revenues transferred to
special provincial administrations.
Five percent of general budget tax revenues collected within the metropolitan
municipality area.
Thirty five percent of tax share of municipalities within the metropolitan area.
2) Non-Tax Revenue
Contribution to expenditures
Revenues from the properties of municipalities

The Study on Integrated Urban Transportation Master Plan for Istanbul Metropolitan Area in the Republic of Turkey Final Report
Chapter 7
7-19
Revenues from municipal duties
Fees
Fines
Grants
Others
3) Factor Income
Sales revenues and profits of enterprises and utilities managed by local
authorities.
4) Borrowings
Borrowing decisions must be taken by the council of local authorities.
Foreign borrowing for projects in investment programs is regulated by the Law on
Public Finance and Debt Management No. 4749.
Permission from the Treasury is necessary for all foreign borrowings.
Issuance of bonds is only possible for projects in investment programs (Law on
Public Finance and Debt Management No. 4749 and the Law on Capital Market
No. 2499).
Domestic borrowings of up to 10% of the revaluated value of the preceding
annual budget revenues can be realized with the decision of City Council.
Domestic borrowings which exceed this amount must be approved by the
Ministry of Interior.
Local authorities can use investment credit and cash credit from the Iller Bank
(The Bank of the Provinces).
Domestic and foreign debt stock (including interest) of local authorities, their
related institutions and the companies, of which more than 50% of capital belong
to local authorities, can not exceed the revaluated value of the preceding year‟s
budget revenues (one and half times for metropolitan municipalities).
These limits do not apply to infrastructure projects which satisfy the following:
(a) Excessive amount of financing requirements.
(b) Approved by the Council of Ministers.
7.2.3 Fiscal Decentralization
New laws enable local authorities to enjoy more local tax income generated by real estate
market and other local resources, which provide the necessary funds for implementing a
local strategy of development. In addition, there is a draft law on the revenues of local
authorities which stipulates:
Allocation of tax revenues between central and local administration to be
redesigned.
Amount of transfers from general budgets to local administrations to be
increased.
Rates and amounts of local taxes and fees to be increased.
Transfer from local administrations revenues to various central government units
to be eliminated.

The Study on Integrated Urban Transportation Master Plan for Istanbul Metropolitan Area in the Republic of Turkey Final Report Chapter 7
7-20
7.2.4 Revenues of Istanbul Metropolitan Municipality
IMM received approximately 75% of its revenues from the Central Government in 2006
(Table 7.2.1). Figure 7.2.1 shows the composition of revenues of IMM for the previous 5
years (2001-2005) and Figure 7.2.2 represents the further breakdown of the funds
received from Central Government.
Table 7.2.1 Revenues of IMM, 2006 (YTL)
Classification of Revenues Estimated Revenues (2006)
Tax Revenues 2,202,475,000
Non-Tax Revenues 405,560,000
Capital Revenue 60,390,000
Donation and Aid 30,620,000
Debt Collection 252,500,000
Refusal and Refund -1,545,000
Total 2,950,000,000
Source: Economic Statistics of IMM, 2006
Source: IMM 2007-2011 Strategic Plan
Figure 7.2.1 Composition of Revenues of IMM
Source: IMM 2007-2011 Strategic Plan
Figure 7.2.2 Composition of Revenues of IMM Received from Central Government
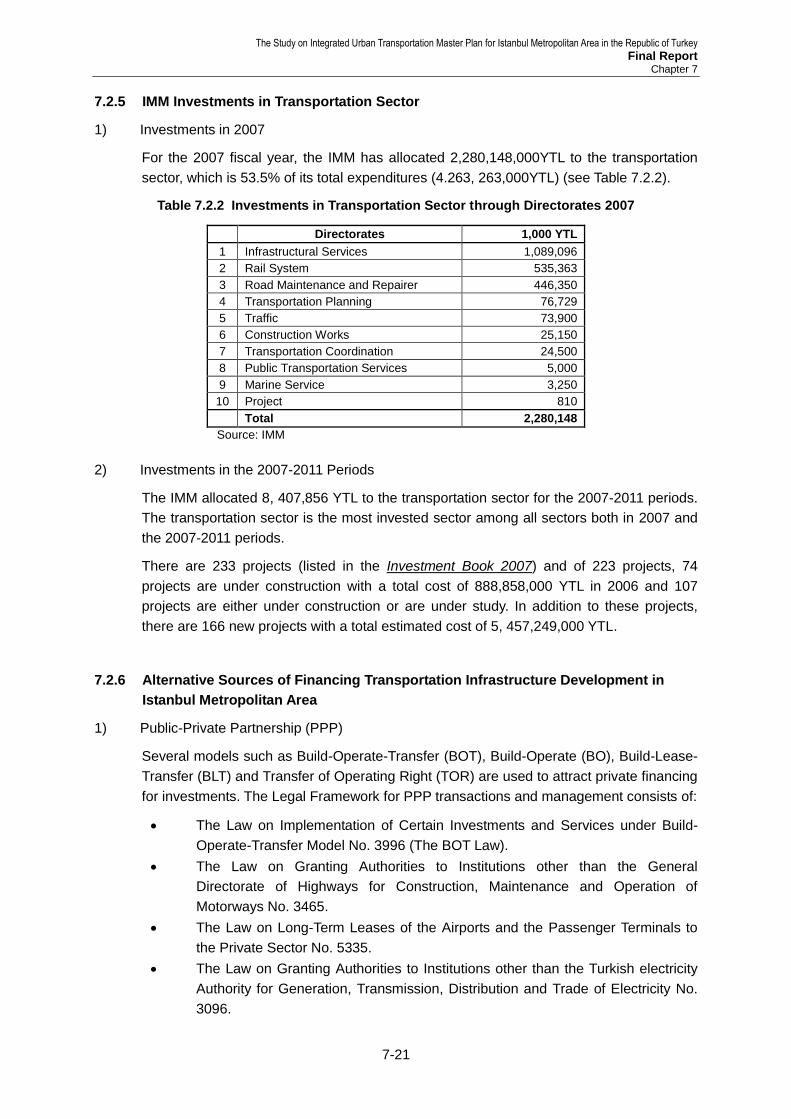
The Study on Integrated Urban Transportation Master Plan for Istanbul Metropolitan Area in the Republic of Turkey Final Report
Chapter 7
7-21
7.2.5 IMM Investments in Transportation Sector
1) Investments in 2007
For the 2007 fiscal year, the IMM has allocated 2,280,148,000YTL to the transportation
sector, which is 53.5% of its total expenditures (4.263, 263,000YTL) (see Table 7.2.2).
Table 7.2.2 Investments in Transportation Sector through Directorates 2007
Directorates 1,000 YTL
1 Infrastructural Services 1,089,096
2 Rail System 535,363
3 Road Maintenance and Repairer 446,350
4 Transportation Planning 76,729
5 Traffic 73,900
6 Construction Works 25,150
7 Transportation Coordination 24,500
8 Public Transportation Services 5,000
9 Marine Service 3,250
10 Project 810
Total 2,280,148
Source: IMM
2) Investments in the 2007-2011 Periods
The IMM allocated 8, 407,856 YTL to the transportation sector for the 2007-2011 periods.
The transportation sector is the most invested sector among all sectors both in 2007 and
the 2007-2011 periods.
There are 233 projects (listed in the Investment Book 2007) and of 223 projects, 74
projects are under construction with a total cost of 888,858,000 YTL in 2006 and 107
projects are either under construction or are under study. In addition to these projects,
there are 166 new projects with a total estimated cost of 5, 457,249,000 YTL.
7.2.6 Alternative Sources of Financing Transportation Infrastructure Development in
Istanbul Metropolitan Area
1) Public-Private Partnership (PPP)
Several models such as Build-Operate-Transfer (BOT), Build-Operate (BO), Build-Lease-
Transfer (BLT) and Transfer of Operating Right (TOR) are used to attract private financing
for investments. The Legal Framework for PPP transactions and management consists of:
The Law on Implementation of Certain Investments and Services under Build-
Operate-Transfer Model No. 3996 (The BOT Law).
The Law on Granting Authorities to Institutions other than the General
Directorate of Highways for Construction, Maintenance and Operation of
Motorways No. 3465.
The Law on Long-Term Leases of the Airports and the Passenger Terminals to
the Private Sector No. 5335.
The Law on Granting Authorities to Institutions other than the Turkish electricity
Authority for Generation, Transmission, Distribution and Trade of Electricity No.
3096.

The Study on Integrated Urban Transportation Master Plan for Istanbul Metropolitan Area in the Republic of Turkey Final Report Chapter 7
7-22
The Law on the Establishment and Operation of Electric Energy Production
Plants and regulations of Energy Sales No.I4238.
The Law on Privatization Application No.4046.
There are PPP projects executed or planned for the Istanbul Metropolitan Area. These
are:
Ataturk International Airport (Lease) TEPE/ AFKEN Joint Venture (TAV)
Sabiha Gokcen Airport (Lease) Limak-GMR-Malaysia Airport Partnership
Galata Port (Privatization)
Bosporus Bridge and Beltway(BOT-Proposed)
Istanbul Strait Road Tunnel Crossing(BOT-Proposed)
The 9th National Development Plan emphasizes the importance of private sector
participation in the transportation sector. It states that “Transporting freights mainly by
railways is the strategic objective of the transportation sector. To this end, train operation
by private sector in railways will be developed. Freight transportation will be liberalized in
order to benefit from the operational advantages of the private sector; and also TCDD will
be restructured and financial burden on the public will be drawn back to a sustainable
level. Railways connection line investments will be realized primarily in industrial regions
by introducing partnerships with the private sector and vehicle investments will be left to
the private sector”.
Passenger transportation with high-speed train will be started on the core network
consisting of the Istanbul-Ankara-Sivas, Ankara -Afyonkarahisar-Izmir, and with Ankara
being the central city. Public-private partnership models will be utilized in the construction
and operation of the lines on this network.
2) Privatization and Foreign Direct Investment (FDI)
Turkey has secured an investment friendly environment for privatization with regulations
matching European standards. With the enactment of Law 5189, the foreign ownership
restrictions on foreign investors are lifted, the scope of the golden share has been limited
and the satellite business has been taken out of Turk Telecom to function as a separate
public entity. The Turkish Government has undertaken a “tailor-made plan” for the
privatization of Turk Telekom. In this framework, an Informatory Process was launched
prior to the official tender announcement whereby, the Privatization Administration has
informed the interested parties about the forthcoming process and delivered information
about the company and the sector at large. Some of the indicators of investment friendly
environment are summarized as follows:
Disinflation (9.7% in 2006 down from 68.5% in 2001)
Tight fiscal and monetary policy
High GDP growth (7.5% for the last five year)
Lower inflation
More predictable and more hospitable
The legal framework for privatization consists of the following:
(1) The Law on Privatization Application No.4046
The principles, procedures, authorized agencies and other issues regarding privatization
are all set out in the Law No.4046 (1994), concerning Arrangements for the

The Study on Integrated Urban Transportation Master Plan for Istanbul Metropolitan Area in the Republic of Turkey Final Report
Chapter 7
7-23
Implementation of Privatization Amending Certain Laws and Decrees with the Force of
Law (The “Privatization Law”)
The Privatization Law in essence regulates the principles of privatization namely; to
improve productivity in the economy and to reduce public expenditures. This Law:
Expands the scope of assets to be privatized.
Provides adequate framework, funds and appropriate mechanisms to speed up
the privatization and restructuring processes.
Establishes a social safety net for workers who lose their jobs as a result of
privatization.
Establishes the Privatization High Council and the Privatization Administration to
facilitate the decision making process in the privatization endeavor.
The “Law Regarding Making Amendments in Some Laws and the Decrees with the Force
of Law Dealing with Establishment and Duties of the General Directorate Turkish National
Lottery” No. 4971, prepared in order to speed up privatization, was put into effect with its
publication in August 15, 2003.
In the framework of the aforementioned Law, stipulations have been placed in order to
accelerate privatization applications through the arrangements that have been made to
Law No. 4046. These include arrangements that have been made to privatize the Turkish
National Lottery by a way of handling out licenses for the planning, organizing and
arranging of game draws and those enabling the utilization of convertible bonds in the
privatization of the Turk Telecom.
The 2004 privatization program that was announced by the government comprises many
different sub-sectors of the economy, including power generation, telecommunications,
transport, petroleum, agriculture, foreign direct investments, and may prove to be an
important component of privatization in Turkey in the near future. The energy sector alone
will require US$ 3billion per year in investments. Within this perspective, the ability of
Turkey to attract foreign investments in these sectors will determine the success of
privatization in these areas.
Priority privatization projects included Turk Telekom, Turkish Airlines, Tupas, Petkim, Tekel,
Halkbank and a number of energy enterprises. Turk Telekom was sold to the Oger
Telecoms Joint Venture Group (Saudi Oger and Telecom Italy) for $ 6.5 billion
Bodies Responsible from Privatization Law No. 4046 are:
Privatization High Council (PHC)
Privatization Administration (PA)
PHC is the ultimate decision-making body for privatization in Turkey headed by the Prime
Minister and composed of four ministers. PHC nominates the organizations for
privatization through taking state-owned economic enterprises in and out of the
privatization portfolio and is responsible from the methodology and timing of the
privatization procedures by approving the final transfer procedures of the organizations to
real people and/or legal entities.
PA is the executive body for privatization processes. It is a legal public entity with an
exclusive budget reporting directly to the Prime Minister. PA‟s major duties include the
execution of PHC‟s decisions, advising the PHC in matters related to the transfer of SEE‟s

The Study on Integrated Urban Transportation Master Plan for Istanbul Metropolitan Area in the Republic of Turkey Final Report Chapter 7
7-24
into or out of privatization portfolios and restructuring and rehabilitation of SEE‟s in order
to prepare them for privatization.
(2) The Law on Foreign Direct Investments No. 4875
Law No. 4875 adapted in 2003 concerns foreign direct investments (The Foreign Direct
Investment Law”). The objective of this Law is to regulate the principles to encourage
foreign direct investments, to protect the rights of foreign investors, to define investment
and investor in line with international standards, to establish a notification-based system
for foreign direct investments rather than screening and approval, and to increase foreign
direct investments through established policies. This Law establishes the treatment to be
applied to foreign direct investments.
The Law describes foreign investors as foreign nationals or Turkish nationals residing in
foreign countries as well as legal entities and international organizations established
under foreign laws who effect direct investments in Turkey. It also describes liberal foreign
investment environments through the following:
Freedom to invest: Unless otherwise required by the international agreements
and special statutory provisions, foreign investors are free to make direct
investments in Turkey.
Freedom of profit transfers through banks and private financial institutions.
Expropriation of real estate: Foreign capitalized companies would be able to
acquire real estate.
Settlement of disputes, international arbitration: The law assures foreign
investors of the right to apply in authorized local courts, or to national and
international arbitration or other means of dispute settlements.
Assessment of the value of no-cash capital: The non-cash capital valuation of
foreign investors would be accepted as it is in their home countries. So, it is
expected that the foreign direct investments would accelerate.
Employment of foreign personnel: Previously, the General Directorate of Foreign
Investment issued working permits for foreign personnel. This law will be issued
by the Ministry of Labor and Social Security. So, it is expected that the regulation
to determine concrete procedures and rules would be issued promptly. Moreover,
the Ministry should allocate the duties of issuing working permits to its officials
who have foreign languages skills, i.e. English, etc.
7.2.7 Institutional Framework of PPPs
1) Central Government Level
State Planning Organization (SPO) is responsible for the planning and review of public
infrastructure investments. SPO serves as the secretariat of High Planning Council (YPK)
which is the highest policy-making authority for PPPs in Turkey. YPK is composed of the
Prime Minister and four (4) cabinet ministers. SPO comes under the Prime Ministry and
receives policy direction from the YPK. YPK assigns executing agencies for the PPP
projects based on the nature and scope of the projects and approves final draft contracts
between private sector investors ad executing agencies before signing the Contracts.
PPP projects are identified and feasibility studies are prepared by the relevant ministries

The Study on Integrated Urban Transportation Master Plan for Istanbul Metropolitan Area in the Republic of Turkey Final Report
Chapter 7
7-25
or public agencies by consultants and submitted to SPO and YPK for their reviews and
approvals. Implementation of the projects including various guarantees, e.g. traffic
volume guarantees, revenue guarantees, etc. are the responsibilities of the executing
agencies.
Treasury plays important role in PPPs in virtue of its authorization of sovereign guaranties
on subordinated loans or stand-by-loans to be provided in connection with the PPP
projects, if such an arrangement is made. Treasury has recently decided not to provide
any guarantee for energy projects to be implemented under PPP schemes.
2) Local Government Level
No significant PPPs projects have been undertaken at local government level to date
except Yuvacik Dam (BOT) project in Izmir. IMM has undertaken several parking
operation projects in Istanbul under a BOT financial scheme. Ispark A.S (Istanbul Parking
Operation and Trade Company) was the sponsoring agency of the BOT projects. Extra-
budgetary financing including PPP, privatization and FDI, are currently promoted by the
Mayor of IMM. It is necessary to create a private sector participation cell in IMM for the
development and implementation of PPP and other off budget projects.
7.2.8 Problems of PPP Applications to Transport Infrastructure Investments in Turkey
1) Reasons for the Difficulties to Attract Private Sector Investments to Transportation Sector
Attracting private sector capital to transportation infrastructure has not been successful in
Turkey. Some of the main reasons are:
Poorly developed domestic capital market.
Lack of access to long-term debt, domestic and international.
Absence of cohesive government policies.
Absence of a credible legal and regulatory framework.
Absence of a credible institutional and administrative framework.
Absence of a clear government commitment to conclude the PPP deals in a
reasonable time.
Inherent risks in investment in the public works, particularly highways and motorways
Lack of experience in PPP projects in public sector. Fundamental Problems in the
PPP Applications to Transportation Sector in Turkey
Both public and private sectors has gained experience in PPP during the past 25 years.
There were problems mainly deriving from lack of legal framework and risk distribution
arrangements between public and private sectors. Negative result of the lack of legal
framework was that arguments were focused on legal aspects and less or no attention
was paid to the importance of technical and economic feasibilities of the projects.
Absence of a cohesive government policy and strategy (this includes regulation, dispute
resolution, and legal enforcement), lack of institutions facilitating PPP transactions and
management, at both central and local government levels and exposure to political and
regulatory risks over a long PPP period remain constraints.
The Study on Integrated Urban Transportation Master Plan for Istanbul Metropolitan Area in the Republic of Turkey Final Report Chapter 7
7-26
2) Problems of Existing Legal Framework
One of the weaknesses of Turkey‟s legal framework for PPP operations is the absence of
a special general legislation to regulate PPP projects. In addition, there are many
shortcomings in the legislations and the followings are critical ones:
There are a limited number of PPP models in the laws and limited scope of the
existing PPP legislations; Legislations are limited to Build-Operate-Transfer (BOT),
Build-Operate (BO), Build-Lease-Transfer (BLT) and Transfer of Operation Rights
(TOR).
Lack of harmonization among PPP Laws. There are several sector-specific PPP laws,
all of which have “holes” and “no teeth”.
There are duplications in the BOT laws, e.g. Law No.3996 (1994) and Law No.4346
(1988) related to highway construction. The former should have replaced the later.
3) Problems of Existing Institutional Framework
An Institutional framework for PPP operations in Turkey are almost non-existence. There
is no central public body responsible for setting PPP policies and coordination and
implementation of PPP projects are assigned to different public bodies which lack
experiences and knowledge of PPPs. At the local government level there are no
institutions, facilitating PPP transactions, management and coordination.
7.3 Environmental Policy and Legislations in Turkey
7.3.1 Outline of Environmental Policy
In Turkey, as in many other countries, awareness on environmental issues significantly
increased in the 1970s1. As a result, main environmental issues were identified and a
framework on environmental policies drawn up and administrative structures are formed
to implement the establishment of these policies.
The Environment Law (Ministry of Environment No.2872, 1983) is Turkey‟s first
framework of environmental legislation. It is based on the “polluter pays” and “user pays”
principles and handles the environment in a holistic manner albeit in rather broad terms. It
continues to provide a legal framework for many regulations scattered throughout Turkish
legislation that seek to clarify and elaborate its intentions, including Environmental Impact
Assessment (EIA). The aim of the Law is not only to prevent and eliminate environmental
pollution, but also to ensure the management of natural, historical, and cultural assets
and land in such a way as to utilize its richness while preserving it for future generations.
Before the establishment of the national environmental authority, a General Directorate of
the Environment was designated under the Prime Ministry in 1978. In 1991, this
organization was reorganized as the Ministry of Environment (MoE). In 2003, MoE was
combined with the Ministry of Forestry to form what is now the Ministry of Environment
and Forestry (MoEF). The former MoE and the present MoEF have been responsible for
the formulation of policy, strategies and standards on pollution prevention and
environmental protection.
1 National Environmental Policy was firstly articulated in the Third Five Year Development Plan (1973-1977)

The Study on Integrated Urban Transportation Master Plan for Istanbul Metropolitan Area in the Republic of Turkey Final Report
Chapter 7
7-27
The EU EIA Directive (85/337/EEC) was issued on 3 July, 1985 and amended by Council
Directive 97/11/EC (14 March 1997) and Council Directive 2003/35/EC (25 June 2003).
Deadlines for transposition were 3 July, 1988, 14 March, 1999, and 25 June, 2005
respectively for each Member State. The National Programme for Adoption of the Acquis
(NPAA) for Turkey formally states that the adoption of the EU Directives for EIA is a
national priority.
In Turkey, the EIA Regulation was drafted by the former MoE based on United States of
America and European Union procedures and enacted on 7 February, 1993. This was the
first piece of EIA legislation in Turkey. This legislation was amended on 23 June, 1997
and 16 December 2003.
7.3.2 Environmental Legislations
Turkey‟s environmental legislation includes the 1982 Constitution, the Environment Law
and various other laws that affect the environment2. The Constitution states that citizens
and the government are obliged to cooperate to protect and upgrade the environment. It
also addresses the need to protect the shores, land and water resources, forests, and
natural, historical and cultural assets. Protection and development can only be achieved
with relevant authority, the document authorizes enforcement powers.
The Environment Law No. 2872 of 1983 embodies the “polluter pays” principle adopted
by other countries, and sets forth the concept of absolute liability in order to operate it. It
also defines activities to prevent and solve environmental problems. These involve
banning certain polluting operations, requiring environmental impact assessments (EIAs)
for specific activities (effective in 1993), identifying sensitive locales to be defined as
special environmental protection areas, providing sanctions to prevent the discharge of
hazardous chemical substances and wastes, banning noise, promoting incentives to
pollute less, creating an environmental fund, and securing participation in decision making
bodies such as the Environment Council (ENC), Higher Council for the Environment
(HCE), and Local Environment Committees (LECs).
The Environment Law is the primary tool for managing the environment as a regulatory
mechanism. Regulations specify procedures to be followed, plans to be prepared,
standards to be met, and activities to be prohibited. Also, enforcement powers are
assigned to agencies, fines and other penalties are specified, and monitoring is promoted
to ensure compliance. Few economic instruments are discussed, although, as mentioned
above, the Law adopts a “polluter pays” principle and the Five Year National Development
Plan calls for an appropriate economic and regulatory approaches.
7.3.3 Institutional Organizations
1) General
In response to the magnitude of environmental issues, national institutions were
established to identify, improve, coordinate, monitor and supervise activities, as well as
2 Other legislation that affects the environment includes: the Water Act, Water Products Act, Municipalities Act, General Hygiene Act, Tourism Incentives Act, Protection of
Cultural and Natural Assets Act, National Parks Act, Forest Villages Development Act, Bosporus Act, Metropolitan Municipalities Act, Agricultural Reform Act, Game Act,
Urban Development/Construction Act, Mining Act, Coastal Act, Reforestation and Erosion Control Act, and Forest Act.

The Study on Integrated Urban Transportation Master Plan for Istanbul Metropolitan Area in the Republic of Turkey Final Report Chapter 7
7-28
procure resources. The first institution was the Permanent Board of Consultants for
Environmental Problems in the early 1970s. Then, in 1978 an Environment Organization
was attached to the Prime Minister‟s office, later to become the General Directorate of
Environment in 1984, which was transformed into the Undersecretariat of Environment in
1989.
2) The Ministry of Environment and Forestry
Ministry of Environment was established by Government Decree No. 443 of 1991, which
empowers it to conduct activities to protect and improve the environment. These activities
involve ensuring appropriate land uses, protecting natural resources, plants and animal
species, and preventing pollution. Its duties include drafting laws, preparing rules and
internal regulations, creating institutions (such as village environment associations and
commissions to manage waste), supervising and planning environmental designs,
interventions and actions as appropriate, managing watershed water quality and regional
waste, creating environmental policies and strategies, coordinating environmental
activities at international and national levels, conducting research, applying
measurements, monitoring compliance, collecting data, managing finances, and carrying
out extension and training.
The Ministry of Environment has special consultative organs at three levels to ensure the
participation of people in line with the requirements of environmental protection and
development activities: The Environment Council (ENC), the Higher Council for the
Environment (HCE), and Local Environment Committees (LECs). At the provincial level, is
the “Provincial Directorates of Environment” which, as of 1995, were organized in 33
provinces. The National Assembly is considering proposals to reorganize the ME‟s
structure to improve efficiency. The draft reorganization of the Ministry of Environment
includes establishing a Sustainable Development Council and it is to increase public
participation, allowing more flexible hiring of experts, as well as improving salaries to
attract more qualified personnel.
In 2003, the Ministry of Environment and Ministry of Forest were merged into Ministry of
Environment and Forest.
3) The Agency for the Protection of Special Areas (APSA)
It is attached to the Ministry of Environment, which works on Ecological Management
Plans for 12 special environmental protection areas, and identified by the Council of
Ministers (1988-1990). APSA is organized as a Special Environmental Preservation
Council with departments at the centre, and directorates at the regional and branch levels.
Its duties include preparing and revising environmental regulations specific to these areas
and land use plans, conducting research, and running training courses.
4) The State Planning Organization (SPO)
It is under the Prime Minister‟s Office which is responsible for developing economic,
social and environmental policies for the 5-year development plans and preparing annual
programs and public investment programs. It is also responsible for the approval of all
public investment projects as well as those proposed by municipalities to be financed by
either domestic or foreign resources. One of its, Local Authorities, Environment and
Technological Research Department, formulates environmental policy recommendations

The Study on Integrated Urban Transportation Master Plan for Istanbul Metropolitan Area in the Republic of Turkey Final Report
Chapter 7
7-29
for the Five-year plan, evaluates the MoEF‟s investment projects and programs, and
prepares annual environment programs.
5) Higher Council for Planning (HCP)
It is chaired by the Prime Minister and is responsible for making decisions on
macroeconomic and social policies and the evaluation and allocation of financial
resources for large scale investment projects. The ministers of agriculture, forestry, energy,
transport, settlements, finance and undersecretary of SPO are the members of HCP.
6) Local Governments
Municipalities are responsible for municipal infrastructures and services for protecting and
managing the environment. They are legally responsible for managing solid waste,
installing and operating water, gas, and urban transport services, and the construction
and maintenance of streets. Although sewerage and bus services are not specified
among municipal duties, they have been assumed by the local governments in practice.
Moreover, municipalities have an important planning role of approving
building/construction permissions including building plan and foundation design3 that
affect all forms of development within their boundaries.
7) Istanbul Metropolitan Municipality
Istanbul Metropolitan Municipality is a local government explained above clause and it is
indirectly responsible for EIA in coordination with Provincial Directorate of Environment
which is main responsible body of EIA system in Istanbul Metropolitan Municipality Area.
7.3.4 Environmental Instruments
1) Planning
Plans are key features in Turkey‟s command-and-control style of environmental
management. These include:
Urban development plans
Two types are required for all municipalities:
(a) Structure plan (General Plan), which are 1/5,000 scale maps along with detailed
reports indicating patterns of land use, types of zones, projected population
densities, building densities, growth directions, magnitudes of settlement zones,
and transport systems.
(b) Implementation plans (Local Plan), which are 1/1,000 scale maps that indicate
buildings in various zones, their densities and order, roads, and stages for
providing urban services. The plans can be designed by municipalities or
assigned to the Bank of Provinces or private firms, and they become effective
after city councils approve them.
Territorial and environmental plans
Territorial plans, which were introduced in the 1960s, are expected to guide land use
and settlement decisions, especially regarding housing, industry, agriculture, tourism,
3 Building permission in Turkey is divided by four steps such as plan, foundation, construction and dwelling
permission in the course of the procedure.
The Study on Integrated Urban Transportation Master Plan for Istanbul Metropolitan Area in the Republic of Turkey Final Report Chapter 7
7-30
and transport. In general, these are formulated and approved by the Ministry of Public
Works and Settlements. Recently, the regional environmental plans were introduced
and formulated by the MoEF; it is supposed to ensure that natural resources are used
in such ways that sustain development. Both territorial and environmental plans are
1/25,000 scale or larger.
Other plans
Various other plans are formulated by 22 agencies and organizations under various
laws. These include:
(a) Regional plans are prepared by SPO or are assigned to others.
(b) Forest management plans are prepared by the General Directorate of Forestry.
(c) Long-term Development and Local Development plans are prepared by the
General Directorate of National Parks, Game and Wildlife to manage national
parks.
(d) Master plans are to direct sartorial activities such as tourism, transportation and
energy.
(e) Management plans are for specially protected areas.
(f) Forest village development plans are prepared and implemented scale by the
General Directorate of Forest-Village Relations.
2) Environmental Impact Assessment System
The flowchart shown in following page illustrates the current (after 16 December 2003)
EIA process in Turkey. For projects with major environmental impacts and national
significance, the Ministry of Environment and Forestry (MoEF), through its General
Directorate of EIA and Planning (reporting to a deputy under secretary) and its local
organizations, is responsible for coordinating EIA matters and related matters of
permission with other governmental agencies as well as provincial governors. The MoEF
is also the responsible body for examination of Annex II activities that are expected to
have environmental impacts of a more minor nature.
EIA procedure includes four steps such as screening, application, scoping and reporting.
In screening, a two-stage screening mechanism is set in place. Screening is guided by
lists of activities included in Annexes I and II to the 2003 EIA Regulation, as well as by the
criteria specified in Annex IV.
It is noted that Annex I and Annex II of the Regulation are reflective of Annexes I and II of
Directive 97/11/EC, respectively. Annex I projects listed in the Regulation require a full
EIA regardless of circumstances, while listed Annex II projects may or may not require full
EIA, as explained below.
During the screening process, MoEF makes a decision on an EIA which is required
whether or not there is a given Annex II project. This may happen when MoEF receives
notification of an intention to submit a development consent application, or the developer
may make an application for a screening opinion (in fact a decision), which must be
recorded and made public. The screening process is as follows:
1) If the project is listed in Annex I of the EIA Regulation, it requires an EIA, and MoEF will
be the competent authority.
2) If the project is listed in Annex II, MoEF decides on a case-by-case basis whether an

The Study on Integrated Urban Transportation Master Plan for Istanbul Metropolitan Area in the Republic of Turkey Final Report
Chapter 7
7-31
EIA is required or not, based on several “selection and elimination” criteria stipulated in
Annex IV of the Regulation.
Annex IV, shown in next page, includes requirements for descriptions of the site itself, the
nature of the project, the potential impacts on the environment, and the potential
alternatives. Annex V shown in next page, which is a listing of areas classified as
“sensitive” in Turkey must also be taken into account in the screening process. Preparing
such descriptions is referred to as a preliminary EIA report („pre-EIA‟ or “The Project
Introductory File” (direct translation from Turkish
required.
In deed, urban transport projects are mostly listed in Annex II of the regulation except a
few intercity motorways which are listed in Annex I.
In practice, insufficient capacity of environmental authorities at the national and local
levels; weakness of public participation, review process and the set-up of the EIA scope
determination, inspection and evaluation commission; and insufficient quality of the report
are pointed out4 as issues in the current EIA system in Turkey.
Table 7.3.1 Projects in EIA Regulation No.25318, 2003
Annex I 8- Roads, leading lines and air ports a) Intercity railway lines, b) Air ports whose runway is 2,.000 m and over, c) Construction of motorways, express roads and government roads,
9- Water routes, sea ports and shipyards a) Construction of water routes, that allows naval vessels weigh 1.350 DWT and over to pass
inside continent and the sea ports that will be constructed for waterborne traffic inside continent, b) The sea ports, port wons, sea walls where naval vessels that weigh1.350 DWT and over can
race and that are constructed for commercial purposes, c) Shipyards that are constructed for the purpose of building, maintenance, repairing of vessels of
charge and passenger vessels, d) The activities of dismantlement of ships, e) Marinas,
Annex II Transportation, infrastructure and coastal structures in Annex II i) The railway lines (that do not take place at Appendix I) j) The facilities, which have a changing purpose, which is used in the railway transportation and the
construction of railway terminals, k) Trams, the railway lines which are elevated and pass underground, similar lines used for carrying
passengers (metros, light rail transportation systems, etc.), l) The air ports (which do not take place at Appendix I) m) Province roads, n) Widening the roads which have two or less lanes to roads that four or more lanes with a 10 km
continuous length;
Annex IV 1. The features of the Project The matters those are stated below should be considered at the features of the projects
a) The flow chart, capacity, the area of the place, technology, the number of personnel that will work of the project
b) The usage of natural sources (land use, water usage, the type of energy that is used etc.) c) The amount of wastes that will be produced (solid, liquid, gas) and the chemical, physical and
biological features of the wastes d) The risk of accident that may be growth out of the technology and the materials those has been
used e) The precautions that will be taken against the probable environmental impacts of the project
2. The place of the Project The matters those are stated below should be considered when the sensitivity of the place where is likely to be affected by the project.
a) The present land use and its quality (agricultural land, forest area, planned area, water surface etc.)
b) The wetlands, sea sides, mountainous districts and forest regions, agricultural areas, national parks, specially protected areas, dense areas in terms of population, historical, cultural, archaeological and similar important areas, erosion districts, landslide districts, forestation fields, potential erosion and forestation fields, with taking into consideration of the list of Sensitive
4
Innanen. S (2004), Environmental impact assessment in Turkey: capacity building for European Union accession, Impact Assessment and Project Appraisal, volume 22, number 2, June 2004, p.p.141–151

The Study on Integrated Urban Transportation Master Plan for Istanbul Metropolitan Area in the Republic of Turkey Final Report Chapter 7
7-32
Districts that takes place at Appendix V and aquifers that should be protected in accordance with the Law About Ground Water numbered 167.
3. The alternatives of the Project and Its Place (the reasons of why that project technology and that project place are chosen)
Results The summaries of the explanations which are made in this part and the general assessment, at which the important environmental impacts of the project are listed and comparisons of its alternatives are made, will be done.
ATTACHMENTS: The environmental condition plan, main city plan, development plan, plan of site or the proposals of revision of these plans if they exist for the place that is determined for the project, A brief explanation of the information that indicates the data related to the locations of residential areas, transportation networks, energy transmission lines, present facilities and the other areas (in the case of being in the project area or its surrounding) take place at the Sensitive Districts List at Appendix V of the Regulation by showing them on the actual map (environmental condition plan if it exist; if it does not exist, topographical map) on a scale 1/25000 in order to assess present land uses of the place of the project and near surroundings. The geological map of the project area with scale, representation of ground and aboveground waters on this map, the statement of the earthquake characteristic of the area) Notes and Sources: Introduction of the persons who prepare the Project Introduction File Name, surname, profession, curriculum vitae, references and the signature which indicates that he is responsible for the file. The project Introduction report should be prepared by a working group consisting of at least 3 persons who are members of related trade branches by considering the type and place of the project.
Annex V SENSITIVE DISTRICTS The detailed presentation of the legislation which should be referred during the process of studies related to the projects which are involved in this regulation‟s scope. The probable changes in the legislation are integral part of this chapter. 1. The areas that should be protected in accordance with legislation of our Country
a) „National Parks‟, „Natural Parks‟, „Nature Monuments‟ and „Nature Protection Zones‟ which are identified at the article numbered 2 of the Natural Parks Law numbered 2873 and specified in accordance with the article numbered 3 of this law,
b) `The Wildlife Protection Areas‟ and „The Wild Animals Naturalization Areas‟ those are determined by Ministry of Forestry in accordance with the Land Hunting Law numbered 3167,
c) The areas defined as „Cultural Heritages‟, „Natural Heritages‟ and „Protected Areas‟ at the sub-paragraphs numbered 1, 2, 3 and 5 of „a- Definitions‟ paragraph of 2. article of the Law on the Protection of Cultural and Natural Heritage numbered 2863 and the areas whose ascertainment and registration are performed in accordance with relevant articles of the same law and of the law numbered 3386 (The Law on Change of Certain Articles of the Law on the Protection of Cultural and Natural Heritage numbered 2863 and Adding Certain Articles to This Law)
d) The Areas of Fishery Products Production and Reproduction those are within the scope of the Fishery Products Law numbered 1380,
e) The areas which are defined at the article numbered 17 of the Regulation of Check of Water Pollution that has been published at the Official Journal numbered 19919 and bear the date of 4/8/1988 and different articles numbered 18, 19 and 20 of the regulation that has been published at the Official Journal numbered 23742 and bear the date of 1/7/1999,
f) The „Sensitive Pollution Districts‟ those are defined at the article numbered 49 of the Protection of Air Quality Regulation that has been published at the Official Journal numbered 19269 and bear the date of 2/11/1986,
g) The areas those are ascertained and promulgated as „Specially Protected Environment Areas‟ in accordance with the article numbered 9 of the Environment Law numbered 2872 by the Council of Ministers,
h) The areas those are protected in accordance with the Boğaziçi Law numbered 2960, i) The areas promulgated as forest areas in accordance with the Forest Law numbered 6831, j) The areas those are restricted districts in accordance with Coast Law numbered 3621, k) The areas those are indicated at the Law about Improvement of Growing of Oils and Inoculation
of Wilds numbered 3573, l) The areas those are stated Pasture Law numbered 4342, m) The areas those are stated at „Regulation of Protection of Wetlands‟ which came into force after
published at the Official Journal numbered 24656 and bear the date of 0/01/2002. 2. The areas that should be protected in accordance with international agreements those we
become a party to a) The I. and II. Protection Areas, „The Habitats and Reproduction Areas of The Mediterranean
Seals‟ those are stated at „Important Reproduction Areas of Sea Turtles‟ which are from the areas those are protected in accordance with „The Agreement of Europe Wildlife and Habitat Protection‟ (BERN Agreement) which came into force after published at the Official Journal numbered 18318 and bear the date of 20/2/1984.
b) The areas those are protected in accordance with the „Agreement of Protection of Mediterranean Sea Against Pollution‟ (Barcelona Agreement) which came into force after published at the Official Journal numbered 17368 and bear the date of 12/6/1981,
i) The areas those are determined as „Specially Protected Areas‟ as required by „Protocol Relating to Protection of Specially Protected Areas at Mediterranean‟ which has been published at the Official Journal numbered 19968 and bear the date of 23/10/1988,

The Study on Integrated Urban Transportation Master Plan for Istanbul Metropolitan Area in the Republic of Turkey Final Report
Chapter 7
7-33
ii) The areas those take place at the list of „100 Coastal Historical Protected Area of Common Significance at Mediterranean‟ that has been published by United Nations Environment Program chosen as required by Genoa Declaration bear the date of 13/9/1985,
iii) The coastal areas those are habitats and nutrition environment of the „Sea Species, Endemic For Mediterranean, Whose Generation are Under the Risk of Vanishing‟ that takes place at the article numbered 17 of the Genoa Declaration,
c) The cultural, historical and natural areas those are protected as being given the status of „Cultural Heritage‟ and „Natural Heritage‟ by the Ministry of Culture in accordance with the articles numbered 1 and 2 of the „Protection of World Culture and Natural Heritage Agreement‟ which came into force after published at the Official Journal numbered 17959 bear the date of 14/2/1983,
d) The areas those are protected in accordance with the „Agreement of Protection of the Wetlands Those Especially Have International Importance As Habitats of Waterfowls‟ (RAMSAR Agreement) which came into force after published at the Official Journal numbered 21937 bear the date of 17/05/1994.
3. The areas those should be protected a) The areas those have been ascertained as restricted districts as the areas whose present
characteristics will be protected at the Environmental Condition Plans those is approved ( the areas whose natural character will be protected, biogenetic reserve areas, geothermal areas etc. )
b) Agricultural Areas: The areas of agricultural development, irrigation areas, the areas that it is possible to irrigate and the areas whose land use ability classes are I, II, III and IV, the whole areas of I. and II. class and the areas of special crop plantation where are used in agriculture depends on rain,
c) Wetlands: All of the waters, swamps, rushy those are natural or artificial, permanent or temporary, whose waters are quiet or streamy, fresh, briny or salt, those contain depths not exceeding 6 meters during the reflux period of ebb and flood, those are important as being habitats of living creatures in the first instance waterfowls, and the areas of well-watered marshy from these areas to black and dry land as from the trend of the coastline ecologically,
d) Lakes, rivers, the areas of operating underground waters, e) The areas those are important for scientific researches and/or habitats for the species that are
vanishing or likely to vanish and are endemic for our country, the areas of biosphere reserves, biotypes, biogenetics reserve areas, the areas of the geological and geomorphologic formations those have unique characteristics.
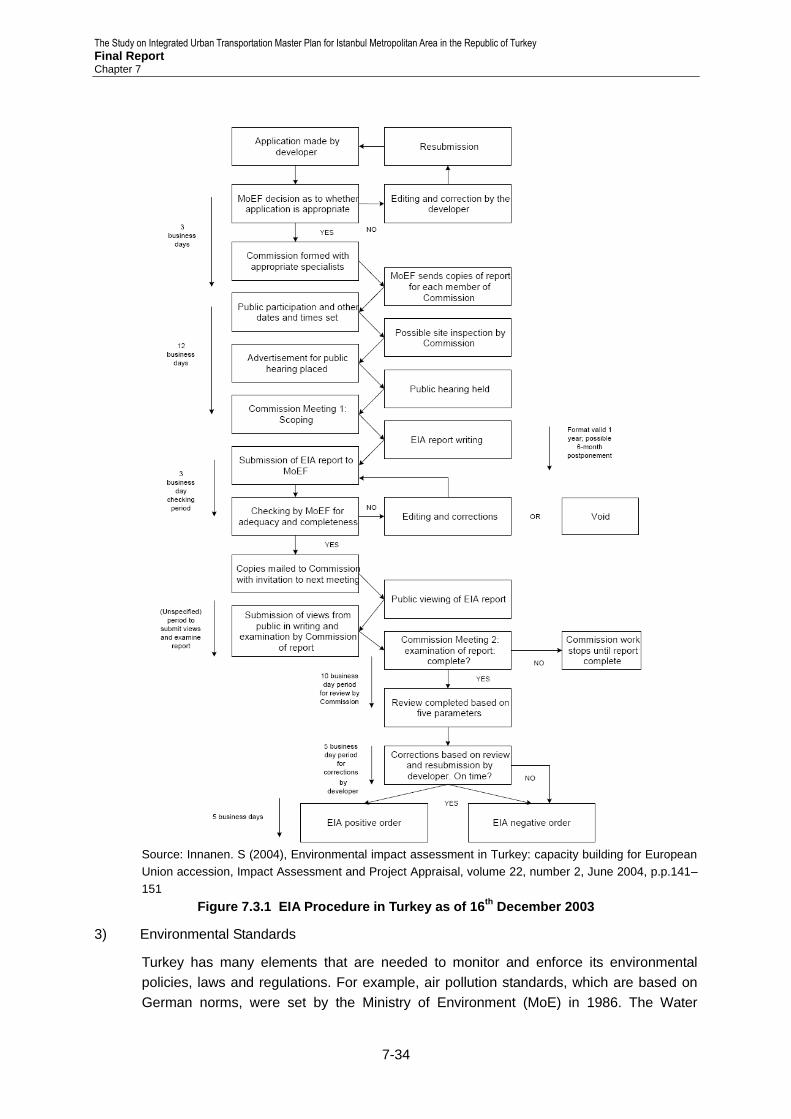
The Study on Integrated Urban Transportation Master Plan for Istanbul Metropolitan Area in the Republic of Turkey Final Report Chapter 7
7-34
Source: Innanen. S (2004), Environmental impact assessment in Turkey: capacity building for European
Union accession, Impact Assessment and Project Appraisal, volume 22, number 2, June 2004, p.p.141–
151
Figure 7.3.1 EIA Procedure in Turkey as of 16th
December 2003
3) Environmental Standards
Turkey has many elements that are needed to monitor and enforce its environmental
policies, laws and regulations. For example, air pollution standards, which are based on
German norms, were set by the Ministry of Environment (MoE) in 1986. The Water
The Study on Integrated Urban Transportation Master Plan for Istanbul Metropolitan Area in the Republic of Turkey Final Report
Chapter 7
7-35
Pollution Control Regulation (2004) presented the principles for classifying inland water
resources as well as discharging and treating wastewater. The Noise Control Regulation
(2003) set maximum levels of noise for indoor and outdoor spaces as well as mitigation
measures. Moreover, a number of regulations on waste management were approved,
including those on solid waste (1991), medical waste (1993), toxic chemicals and their
products (1993), and hazardous wastes (1995), based on West European norms. In
relation to transport, vehicle emission, noise, fuel quality standards are considered.
7.3.5 Land Acquisition
1) Procedure
This article is mostly relied on the text prepared for Land Acquisition and Resettlement
Policy Framework of Istanbul Municipal Infrastructure Project by World Bank. The process
of constructing a public facility goes through three main steps.
The first step in the process is to obtain the approval of the district municipal council and
be integrated into the municipal land use plan. In consideration by the council and entry
into the plan are both preceded by public announcements in newspapers and posting in
the municipality office, a public planning meeting, and during a 60-day period, a 60-day
period during which the public is invited to comment. If substantive negative feedback is
obtained, the decision will be reviewed by the municipal council and will either be
approved or rejected.
The second step occurs on the metropolitan municipality level, where the council must
grant approval and the land use plan must be changed to integrate its facilities. Both
actions are also preceded by similar notifications, public meetings and feedback period. If
the response is negative, the proposal will be submitted to the council for re-consideration.
After the site proposal completes the first two steps, documentation is prepared to request
a location permit. In addition to the decisions and confirmation on the site entering into the
respective plans, the documentation should consist of feasibility studies; preliminary
design; environmental assessment; ownership status; estimated land cost replacement
value of above ground assets, based on a professional valuation; estimated construction
and supervision costs; and confirmation that adequate funds are available. Once the
location permit is issued, the land can be acquired.
2) Land Ownership and Use Status
Land ownership status can include one or more of the following four scenarios:
a) Owned by the municipality and either vacant or used by the municipality, a municipal
company or a private entity under a lease or an informal arrangement.
b) Owned by the Treasury or other state agency and either vacant or used by the
owner.
c) Owned by the state or state agency or enterprise and used by another party through
a lease or an informal arrangement.
d) Private land either used by the owner or another private individual or enterprise or
used informally by a third party through a lease or an informal arrangement.

The Study on Integrated Urban Transportation Master Plan for Istanbul Metropolitan Area in the Republic of Turkey Final Report Chapter 7
7-36
Each scenario has different implications for entitlements and action which are noted
briefly below and in the following Table “Entitlement Matrix”.
(i) Municipal Ownership
The land is owned and used by the municipality and transferred to the solid waste
management office. If the land is used by a third party under a lease, the
metropolitan municipality adheres to conditions of the lease, which may or may
not include the obligation to transfer the activity to another site. If the land is used
informally, the metropolitan municipality compensates the user for assets that are
lost and assists the user to relocate the activity.
(ii) Ownership and Use by the Treasury or Other State Entity
If the land is owned and used by the State or one of its agencies, the solid waste
management office negotiates with the owner/user to transfer the land to the
metropolitan municipality. Depending on circumstances, the land will be
transferred to the metropolitan municipality without cost or leased or sold to the
metropolitan municipality after compensating the user for lost assets.
(iii) Ownership by the Treasury or Other State Entity and Used by a Third Party
If the land is leased to a third party, the owner will vacate the land and transfer or
lease it to the metropolitan municipality, adhering to the conditions of the lease,
which may or may not require compensation for lost assets or disruptions in use.
If the land is used informally, the owner will vacate the land, compensating the
user for lost assets, and assist the user to find another suitable location.
(iv) Private Ownership
If the land is privately owned, the metropolitan municipality will commission a
property assessment and contact the owner by giving notification that the land is
needed for the facility. The metropolitan municipality will then invite the owner to
negotiate for purchase, based on the assessment. The objective of negotiation is
to reach an agreement on the value of the land, assets, loss of income (if
relevant) due to relocation, and the cost of relocation and re-establishment. The
owner must be compensated fully before work can begin.
3) Other Method of Land Expropriation for Public Purpose
“Chapter 18 of Settlement Law No.3194, 1985” has stipulated to expropriate lands for
public use by land readjustment system. This system has been applied in suburban area
of Istanbul such as housing developments or housing improvement areas.
According to the law, maximum 35% of the project area can be utilized for public use such
as roads, rails, parks, open space and other public purposes without any payment to land
loads. If exceeds more than 35%, the land will be expropriated by Law No.2942. In other
word, reduction rate is up to 35%.

The Study on Integrated Urban Transportation Master Plan for Istanbul Metropolitan Area in the Republic of Turkey Final Report
Chapter 7
7-37
Table 7.3.2 Entitlement Matrix: Istanbul Municipal Infrastructure Project by World Bank
Investment Ownership Status
Use Status Final Status Transfer Mechanism
Compensation Principles
Municipality Vacant Transfer to User Simple Transfer None
New Transfer Station
Leased to Private User
Vacate , Transfer to User
Terminate Lease, Transfer
Lost Assets, Relocation Cost, Temporary Income Cost , Depending on Lease Provisions
Assets at Full Replacement Cost
Informal/Illegal Use
Vacate , Transfer to User
Relocate, Transfer to User
Lost Assets, Relocation Cost
Assets at Full Replacement Cost
Treasury, other Government Entity
Vacant Transfer to Municipality
Transfer or Purchase
Land, Subject to Negotiation between Parties
Leased to Private User
Vacate , Transfer to Municipality/ User
Terminate Lease, Transfer
Land, Subject to Negotiation: Lost Assets, Relocation Cost, Temporary Income Cost, Depending on Lease Provisions
Assets at Full Replacement Cost
Informal/Illegal Use
Vacate, Transfer to municipality/ User
Relocate, Transfer to Municipality/ User
Land subject to Negotiation: Lost Assets, Relocation Cost to user
Assets at Full Replacement Cost
Private Vacant Ownership by Municipality/ User
Purchase and Transfer
Land, Subject to Negotiation or Expropriation, if negotiation fail
Full Replacement Cost (Market Value
Residential Ownership by Municipality/ User
Relocate, Purchase and Transfer
Land, and above ground assets, Relocation Costs, subject to Negotiation or Expropriation if Negotiation fail
Full Replacement Cost (Market Value
Commercial Ownership by Municipality/ User
Relocate, Purchase and Transfer
Land, and above ground assets, Relocation Costs, Temporary income Loss, subject to Negotiation or Expropriation if Negotiation fail
Full Replacement Cost (Market Value
Source: World Bank (2007), Appraisal Document on a Proposed Loan for a Istanbul Municipal
Infrastructure Project
4) Expropriation
If negotiation fails, the metropolitan municipality can request the court to issue an
expropriation order based on the Public Expropriation Law No.2942 of 1983, documenting
the failure to reach a settlement through negotiation. The court will commission an
independent assessment prior to issuing the order and setting the price. When the order
is issued, the metropolitan municipality compensates the owner at the level set by the
court and obtains title. Work cannot commence before the payment is fully made.
If the owner is not satisfied by the court decision, he or she can appeal the financial
settlement, but cannot reverse the expropriation order. Although the metropolitan
municipality has the authority to request and obtain an expropriation order, expropriation
inevitably generates strong public criticism and thus it is rarely used.
5) Responsibility
The metropolitan municipality is ultimately responsible for land expropriation and
expropriation. The process is managed by the office that will use the land, however, in
collaboration with the municipal cadastre office.
The Study on Integrated Urban Transportation Master Plan for Istanbul Metropolitan Area in the Republic of Turkey Final Report Chapter 7
7-38
7.3.6 Issues and Problems
1) General
Spatial planning and development of the Istanbul Metropolitan Area are controlled by a
mosaic of decision-making bodies in the form of super national, national, regional and
local legislative, legal and institutional frameworks. Meanwhile, the Istanbul Metropolitan
Municipality is faced with the realities and factors such as overcrowding, immigration,
insufficient policy programs, illegitimacy, lack of execution of legislative power, etc. within
inefficient control system in the spatial development. With all these factors,
disorganization and insufficiency of planning and implementation systems appeared to
have failed.
IMM has carried out comprehensive planning as an approach since mid-1990. Some of
the planning studies were directed toward the spatial development for the expanded
boundaries of IMM: In 1995 Istanbul Metropolitan Planning Office has completed the
Istanbul Provincial Spatial Development Plan (1/50,000 scaled, Istanbul, Metropolitan
Sub Region City Plan Report, Belbim Co. Istanbul). The new legislations, which enable
IMM to cover the whole province for the first time in spatial planning work, were enacted
in 1995. However, it was reported that the plan was challenged in court by local
professional organizations questioning the legitimacy of the IMM‟s authority on planning
over expanded areas. Subsequently, the plan was cancelled.
Istanbul Metropolitan Planning and Urban Design Center (IMP) was created in September
by the metropolitan mayor in September 2005. IMP consists of over 400 urban planning
professionals and academics. It works on 10 key areas of urban development, and
among them land use planning is coordinated with transportation planning. In the summer
of 2006, a household travel survey was conducted among 36,000 households and work
has begun on the next generation of the transportation master plan. While IMP was
preparing a future land use plan, the city council and the government announced a set of
“mega projects”, among them are (i) Tunnels under 7 hills, (ii) A new Bosporus bridge and
beltway (The Third Bridge Project) and (iii) Bosporus Road Tunnel Crossing. These mega
projects, particularly, the Third Bridge Project faced massive oppositions from professional
organizations and NGOs and, is reportedly, being challenged in court, but not on the
ground of legitimacy of IMM‟s authority but on the ground of environmental and land
development issues.
2) Need for Further Decentralization and Administrative Reform
The Turkish administrative and financial system is still overwhelmingly centralist.
Legislative reforms have been brought into the administrative reforms of the central,
regional and local governments to cope with the increase and diversification of social and
economic needs parallel to economic reforms. The structure and tradition of centralized
public administration has still persisted in spite of the many supports for self-governance
and devolution of powers from the central government to the provincial government.
Membership negotiations with the EU have been the most important influence on the
reform process, which recently introduced a complete new legal framework. Legal and
institutional changes during 2004-2006 have prepared better conditions for the decision
making and implementation of strategic plans, but planning approach itself has remained
relatively conventional, without clear identification of roles of actors, and forms of

The Study on Integrated Urban Transportation Master Plan for Istanbul Metropolitan Area in the Republic of Turkey Final Report
Chapter 7
7-39
cooperation between these actors.
Much legislation, regulatory and controlling mechanisms at central, regional and local
levels interfere with the planning and implementation process of IMM. There seems to be
power struggle between local and central administration bodies as well as among
metropolitan, districts and sub-districts municipal administrations in the metropolitan area.
The problem is especially critical considering that the interests of central government and
the local government would require to be solved through institutional means. The passage
of the Regional Development Agency Law in 2006 (No.5449) and the creation of a
regional development agency may offer a required institutional system.
3) Lack of Coordination among Different Ministries and Agencies
Overlapping laws and institutions exist today to govern the implementation of institutional
and spatial plans. Lack of coordination among different ministries and agencies at the
central administration causes a major problem for decision making at the regional and
local levels. The 9th National Development Plan emphasizes the need for administrative
reforms at the central, regional and local levels to strengthen the coordination in decision
making on urban and regional development and management. The National Development
Plan states that “The necessary regulations defining the duties, authorities and
responsibilities of the units responsible for the decision, policy, implementation and
supervision of urban transportation at the national and local levels need to be put in place.
There is, however, no concrete proposal for such a coordination mechanism. The National
Development Plan also stipulates that an administrative structure must be established to
ensure coordination on decision making and programming processes by gathering the
institutions in the transportation sector under a single organizational structure. As Turkey
shapes up to become a full member of the European Union, further decentralization will
emerge as a major issue.
4) Needs for Appropriate Regulatory Framework for Privatization and Foreign Direct
Investment (FDI) in Infrastructure and Land Development
(i) Infrastructure
The 9th National Development Plan 2007-2013 emphasizes the importance of
private sector investment in infrastructure, i.e. power, transport. FDIs may prove
to be an important component of infrastructure development and privatization in
Turkey. Foreign investors consider the privatization of infrastructure even more
important and infrastructure privatizations among all have the strongest impact on
attracting additional FDI into the country. Not only do they attract investment to
power, telecommunications, transport, and water sectors but they also improve
the condition of infrastructure services, which is an important component of FDI
attraction and productivity increases. In order to make an opportunity out of a
challenge, Turkey needs greater persistence in creating the necessary regulatory
bodies for infrastructure. The establishment of an appropriate regulatory
framework is needed to introduce real competition in the infrastructure sectors.
(ii) Real Estate and Land Use Planning
Turkey already has the basic principle and system supporting the transfer of state
land to the private sector, but the process needs improvement. The problems

The Study on Integrated Urban Transportation Master Plan for Istanbul Metropolitan Area in the Republic of Turkey Final Report Chapter 7
7-40
encountered so far in the process can not be just attributable to procedures but
they also have roots in legislative ethics. The improvement of procedures,
therefore, will take a lot more effort related to privatization and civil service reform
than simply removing administrative barriers.
5) Need for further Fiscal Decentralization
All municipalities responsible for infrastructure development suffer from budgetary
constraints and weak institutional capacities.
The concept of the intergovernmental fiscal relations is the relations between the tiers of
government and the problems of sharing expenditures and revenues. In this context, the
first step is to determine the principles concerning the sharing of powers and functions,
and the expenditures. The second step is to share the revenues in order to meet the
expenditures.
Earlier fiscal decentralization of the 1980s has been assimilated and internalized. There
seems to be greater demand for further decentralization in the country.
6) Needs for Building Capacity for PPP Management at both Central and Local government
levels
As reviewed, Turkey already has the legal framework for PPP transactions and
management. However, the absence of a cohesive government policy and strategy and
lack of institutions facilitating PPP projects, particularly BOTs at the central government
still remain as constraints.
Attracting private sector finance and optimizing its financial, socio-economic and political
advantages is an important and complex task and it is under the responsibility of central
government. Such a task dictates the creation of a dedicated organization in government
with skills necessary for management of all the phases in development and
implementation of PPP projects.
The central administration-local administration relations are important for ensuring
necessary incentives to transfer foreign investment to local authorities. Under the present
administrative structure, local authorities can not access themselves into the international
capital market. Institutional and financial systems, which enable local authorities to plan,
develop and implement PPP projects, may be needed. Presently, the authority to grant
and govern concessions is in the hands of the central government. This authority can be
decentralized and the transfer of authority to grant concession to local governments
should be made an integral part of administrative reforms and fiscal decentralization.

The Study on Integrated Urban Transportation Master Plan for Istanbul Metropolitan Area in the Republic of Turkey Final Report
Chapter 8
8-1
Chapter 8 Planning Issues
Based on the fact and findings stated in antecedent chapters, main transportation
problems existing in the Istanbul Metropolitan Area are summarized in this chapter. They
will comprise an important part of planning issues for Master Plan Development.
However, this work is still on the way and to be continued in the next phase.
8.1 General Problems
A series of discussion on current transportation problems were made in the Joint Task
Force of IMM Study Team and JICA Study Team. Finally, most of discussed problems were
classified into the general problems listed in Table 8.1.1.
Table 8.1.1 General Transportation Problems in Istanbul
Transportation Problems
1 Lack of Productive, Sustainable, Multi-scale and Multi-centralized Urban Plans
Around one center, due to the linear spreading urban tissue, increase on the demand of central business areas and the transportation infrastructure in the city center is not qualified enough to meet this demand.
Because the implementation plans which are agreeable with the strategic plans cannot be implemented in the same period of time, the city development cannot be actualized adequate to the targets
For better access to the main public transit lines, there are no adequate pedestrian and bicycle paths to improve the accessibility by non-transport modes.
2 Lack of Attractive and High Capacity Public Transportation System
Due to non-existence of widespread rail system network, accession from all regions cannot be ensured
The low network speeds in the widely used rubber wheeled public transportation system
There is no synchronize integration between sea transportation and other systems
3 Capacity Deficiency of Transportation Infrastructure (Roads, Intersections and Parking Lots)
Due to the parking lot deficiency in house and business areas, the increase in the road side parking ratios and related to this, decrease in the road capacity
Due to the failure in the land route network, decrease in the road capacity
New land-use developments are proposed without the remedy plan for their adverse affects, i.e., additional traffic load produced by a new development is not accommodated by a proportion of new geometric site/street plan.
4 Lack of an effective Control and Management System
Slowness on spreading smart/ intelligent technologies for traffic detection, control and management and information systems.
The smart signalization systems are not widely spread and experts to handle new technologies are insufficient.
The deficiency of the demand management and driver information systems with the usage of smart transportation systems
Not enough law enforcement on traffic management

The Study on Integrated Urban Transportation Master Plan for Istanbul Metropolitan Area in the Republic of Turkey Final Report Chapter 8
8-2
Transportation Problems
5 Lack of Necessary Transportation Mentality of Drivers, Passengers and Pedestrians
The control deficiency on obeying of the traffic rules
Difficulties on the changing the costumes of people’s transportation use
Public transportation drivers don’t conform the passenger stop locations
6 Deficiency in Controlling Population Growth
As a result of the pressure of the availability of vast amount of land belonging to government, rapid population growth due to migration from rural cannot be prevented.
As a result of the population development going over the plan targets, the planned transportation infrastructure is inadequate.
Due to the intense migration, forming new resident areas where there is no adequate transportation infrastructure
7 Multiple Agencies Regarding to Authority and Responsibility
Lack of proper cooperation between the agencies of Central and Local Government can be named as an example regarding transport infrastructure investment. Also, traffic enforcement is done by the police who are not controlled by the Local Government. However, in general, cooperation among various transit operators in the city is overseen by the council, called UKOME led by the secretary of municipality.
Local Government cannot impose local taxes and policies concerning transportation.
Source : Study Team
8.2 Current Transportation Problems to Passengers
1) Outputs of Home Interview Survey
The IMM Study Team conducted “Person Trip” Surveys by home interview in two phase:
the first one was done in the mid-May to the mid-June of 2006 and the second in October,
2006 to January, 2007. Trip data of 72,000 households were obtained by the surveys.
In the first phase survey, a question was added, asking users’ opinion about problems and
troubles concerning the public transport service they are using. Table 8.2.1 classified the
opinions by transport mode and categories of problems and shows the number of
responses in percentage by mode. The total is over 100% because multi-answer was
allowed.
More than half of respondents indicate some problems on route of service in every mode.
Second highest indications are concerning waiting conditions, congestion, operators and
accessibility to station and bus-stop. On the other hand, comparatively few claims are
made to safety, fare system, comfortableness and operating hours. Thus, passengers
have a keen interest in such factors as relating directly to convenience.
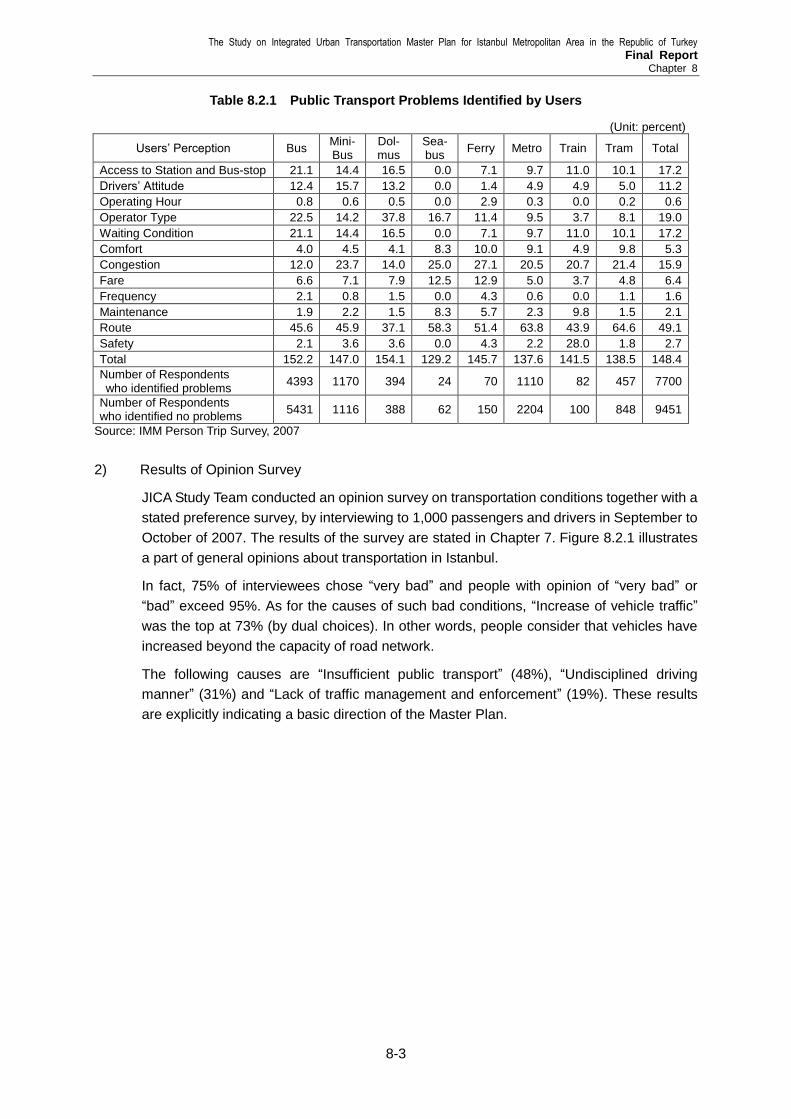
The Study on Integrated Urban Transportation Master Plan for Istanbul Metropolitan Area in the Republic of Turkey Final Report
Chapter 8
8-3
Table 8.2.1 Public Transport Problems Identified by Users
(Unit: percent)
Users’ Perception Bus Mini- Bus
Dol- mus
Sea- bus
Ferry Metro Train Tram Total
Access to Station and Bus-stop 21.1 14.4 16.5 0.0 7.1 9.7 11.0 10.1 17.2
Drivers’ Attitude 12.4 15.7 13.2 0.0 1.4 4.9 4.9 5.0 11.2
Operating Hour 0.8 0.6 0.5 0.0 2.9 0.3 0.0 0.2 0.6
Operator Type 22.5 14.2 37.8 16.7 11.4 9.5 3.7 8.1 19.0
Waiting Condition 21.1 14.4 16.5 0.0 7.1 9.7 11.0 10.1 17.2
Comfort 4.0 4.5 4.1 8.3 10.0 9.1 4.9 9.8 5.3
Congestion 12.0 23.7 14.0 25.0 27.1 20.5 20.7 21.4 15.9
Fare 6.6 7.1 7.9 12.5 12.9 5.0 3.7 4.8 6.4
Frequency 2.1 0.8 1.5 0.0 4.3 0.6 0.0 1.1 1.6
Maintenance 1.9 2.2 1.5 8.3 5.7 2.3 9.8 1.5 2.1
Route 45.6 45.9 37.1 58.3 51.4 63.8 43.9 64.6 49.1
Safety 2.1 3.6 3.6 0.0 4.3 2.2 28.0 1.8 2.7
Total 152.2 147.0 154.1 129.2 145.7 137.6 141.5 138.5 148.4
Number of Respondents who identified problems
4393 1170 394 24 70 1110 82 457 7700
Number of Respondents who identified no problems
5431 1116 388 62 150 2204 100 848 9451
Source: IMM Person Trip Survey, 2007
2) Results of Opinion Survey
JICA Study Team conducted an opinion survey on transportation conditions together with a
stated preference survey, by interviewing to 1,000 passengers and drivers in September to
October of 2007. The results of the survey are stated in Chapter 7. Figure 8.2.1 illustrates
a part of general opinions about transportation in Istanbul.
In fact, 75% of interviewees chose “very bad” and people with opinion of “very bad” or
“bad” exceed 95%. As for the causes of such bad conditions, “Increase of vehicle traffic”
was the top at 73% (by dual choices). In other words, people consider that vehicles have
increased beyond the capacity of road network.
The following causes are “Insufficient public transport” (48%), “Undisciplined driving
manner” (31%) and “Lack of traffic management and enforcement” (19%). These results
are explicitly indicating a basic direction of the Master Plan.

The Study on Integrated Urban Transportation Master Plan for Istanbul Metropolitan Area in the Republic of Turkey Final Report Chapter 8
8-4
74.7
21.1
3.7
0.4
0.1
0 20 40 60 80
Very bad
Bad
So-so
Good
Very good
Indication in %
0 10 20 30 40 50 60 70 80
Others
Increase of truck traff ic
Lack of traff ic managenent and enforcement
Incsufficiency of public transport
Undisciplined people'sdriving manner
Lack of traff ic signal
Lack of traff ic lights
Increase of vehicle traff ic
Indication in %
Source : Study team
Figure 8.2.1 People’s Perception on Transportation in Istanbul
8.3 Problems of Transportation Network
Through data processing and field investigation, the following problems were identified
upon the transportation network configuration and its services offered by each mode.
However, these are still provisional and need to be verified in the next phase.
Table 8.3.1 Current Problems of Transportation Network
Transportation Problems
1 Road Network
Absolute deficiency of arterial roads in the urbanized area, especially in the NW-SE direction. There is no East – West highway in such densely inhabited area as Gungoren and Bagcilar Area.
Parking lots are insufficient especially in down town and curbside parking is common which decreases road capacity and hinders smooth traffic flow.
Road construction does not catch up with demand in rapidly growing area in the suburbs such as Gaziomanpasa and Esenler in the European side and Maltepe and Kartal in the Asian side.
Pedestrian facilities such as sidewalk and crossing are underdeveloped.
2 Rail transit Network
Rail transit has not composed a network yet. It is in the cradle age.
Rail transits lines both existing and under construction are rather short in length
Q1. How do you feel about traffic situation in Istanbul?
Q2. If “Bad” or “Very Bad”, What are the causes?

The Study on Integrated Urban Transportation Master Plan for Istanbul Metropolitan Area in the Republic of Turkey Final Report
Chapter 8
8-5
which forces passengers to transfer frequently.
At inter-modal points, transfer to another service is often inconvenient due to lack of such facilities as a plaza, bus terminal and parking lots.
3 Bus/Minibus Network
Too many lines are operated (About 1000 bus lines and 500 mini-bus lines). Trunk / Feeder bus network has not realized yet.
4 Sea-bus/Ferry Network
Sea transport does not work effectively due to limited capacities of fleet and piers and also due to inconvenient access to piers.
Some fleet is decrepit and needs to be renewed. Source : ibid.
8.4 Problems of Traffic Management
Current transportation management system in Istanbul is reviewed in this chapter and the
problems are summarized as shown in Table 8.4.1.
Table 8.4.1 Current Problems in Traffic Management
Transportation Problems
1 Excessively Technology Oriented Approach
Application of most advanced technology such as video camera type vehicle detectors should be well balanced with human factors for efficient monitoring.
Effectiveness of the introduced new technology is often limited due to narrow service coverage, unreliable information collection, etc. (e.g. expressway traffic information system)
New technology seems to have been introduced for the sake of technology itself, while simple and time-consuming work to support the technology tends to be neglected.
2 Traffic Signal Control
Although about 800 signals are connected to the Control Center, each signal actually operates in an isolated manner with fixed signal patterns due to lack of continuous monitoring.
3 Traffic Information System
The current system of traffic information collection depends largely on the operators. But the operators provide limited information that may differ by operators.
Definition of traffic congestion and description of traffic congestion are not standardized at present.
Part II. Land Use Plan and
Demand Forecast
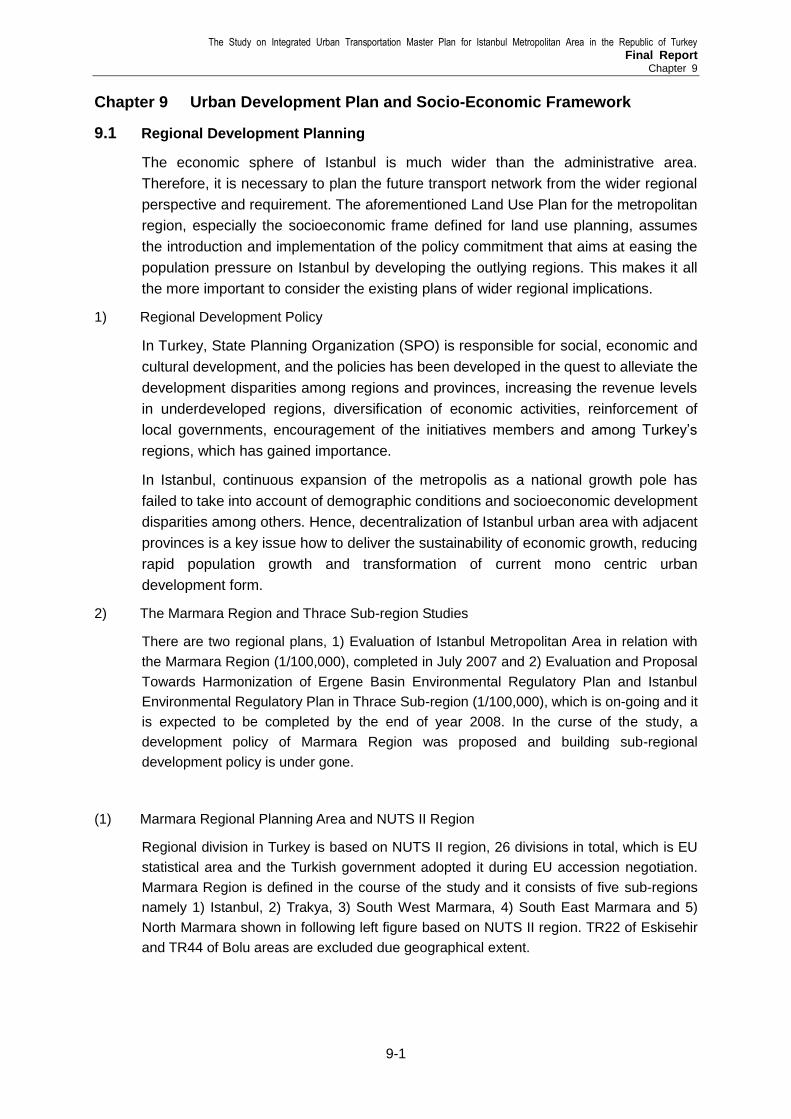
The Study on Integrated Urban Transportation Master Plan for Istanbul Metropolitan Area in the Republic of Turkey Final Report
Chapter 9
9-1
Chapter 9 Urban Development Plan and Socio-Economic Framework
9.1 Regional Development Planning
The economic sphere of Istanbul is much wider than the administrative area.
Therefore, it is necessary to plan the future transport network from the wider regional
perspective and requirement. The aforementioned Land Use Plan for the metropolitan
region, especially the socioeconomic frame defined for land use planning, assumes
the introduction and implementation of the policy commitment that aims at easing the
population pressure on Istanbul by developing the outlying regions. This makes it all
the more important to consider the existing plans of wider regional implications.
1) Regional Development Policy
In Turkey, State Planning Organization (SPO) is responsible for social, economic and
cultural development, and the policies has been developed in the quest to alleviate the
development disparities among regions and provinces, increasing the revenue levels
in underdeveloped regions, diversification of economic activities, reinforcement of
local governments, encouragement of the initiatives members and among Turkey’s
regions, which has gained importance.
In Istanbul, continuous expansion of the metropolis as a national growth pole has
failed to take into account of demographic conditions and socioeconomic development
disparities among others. Hence, decentralization of Istanbul urban area with adjacent
provinces is a key issue how to deliver the sustainability of economic growth, reducing
rapid population growth and transformation of current mono centric urban
development form.
2) The Marmara Region and Thrace Sub-region Studies
There are two regional plans, 1) Evaluation of Istanbul Metropolitan Area in relation with
the Marmara Region (1/100,000), completed in July 2007 and 2) Evaluation and Proposal
Towards Harmonization of Ergene Basin Environmental Regulatory Plan and Istanbul
Environmental Regulatory Plan in Thrace Sub-region (1/100,000), which is on-going and it
is expected to be completed by the end of year 2008. In the curse of the study, a
development policy of Marmara Region was proposed and building sub-regional
development policy is under gone.
(1) Marmara Regional Planning Area and NUTS II Region
Regional division in Turkey is based on NUTS II region, 26 divisions in total, which is EU
statistical area and the Turkish government adopted it during EU accession negotiation.
Marmara Region is defined in the course of the study and it consists of five sub-regions
namely 1) Istanbul, 2) Trakya, 3) South West Marmara, 4) South East Marmara and 5)
North Marmara shown in following left figure based on NUTS II region. TR22 of Eskisehir
and TR44 of Bolu areas are excluded due geographical extent.

The Study on Integrated Urban Transportation Master Plan for Istanbul Metropolitan Area in the Republic of Turkey Final Report Chapter 9
9-2
Source: IMM (2006), Consideration in Planning the Marmara Region and the Metropolitan Area of Istanbul
Figure 9.1.1 Marmara Regional Planning Area and NUTS II Region
Total population of the region is approximately 20.6 millions (2007), which is 27.8% of
Turkey’s population, and the region generates at 38.8 % (2001) of Turkey’s GRDP shown
in following table respectively. All sub-regions of Marmara Region account among top 10
on the ranking of socio-economic development based on NUTS II division. It can be said
this region is economic growth pole of Turkey.
Table 9.1.1 Regional Division by NUTS and the Marmara Regional Planning Area
Functional Region
NUTS-I NUTS-II NUTS-III Prime Municipality
Urban Pop.
Rural Pop.
Total GDP share (2001)
Pop. Share (2007)
1. Istanbul Istanbul Istanbul TR10
Istanbul Istanbul
11,174,257 1,399,579 12,573,836
Sub-total 12,573,836 21.30% 14.80%
2. Thrace (Trakya)
West Marmara
Tekirdag TR21
Tekirdag
Tekirdag
494,342 234,054 728,396
Edirne 259,809 136,653 396,462
Kirklaeli 212,390 120,866 333,256
Sub-total 966,541 491,573 1,458,114 2.50% 2.30%
3. South West
Marmara
Balikesir TR22
Balikesir
Balikesir
649423 468.890 649,423
Canakkale 247,443 228,685 476,128
Sub-total 896,866 228,685 1,125,551 2.20% 2.20%
4. South East
Marmara
East Marmara
Bursa TR41
Bursa
Bursa MM
1,979,999 459,877 2,439,876
Bilecik 145,126 58,651 203,777
Sub-total 2,125,125 518,528 2,643,653 5.20% 4.50%
5. Northern Marmara
Kocaeli TR42
Kocaeli
Kocaeli MM
894,242 543,684 1,437,926
Sakarya 594,114 241,108 835,222
Duzce 157,894 165,434 323,328
Yalova 122,075 59,683 181,758
Sub-total 1,768,325 1,009,909 2,778,234 7.60% 4.00%
Region-Total 20,579,388 38.80% 27.80%
Source: Census 2007, Turkish Statistical Institute and National Program 2008 Note: TR22 Balikesir excludes Eskisehir and TR42 Kocaeli excludes Bolu in the Marmara Regional Planning Area NUTS: The Nomenclature of Territorial Units for Statistics (EU Statistical area). Turkish government adopted during the EU accession negotiation.
(2) Marmara Regional Development
The outlying areas of the Metropolitan Region consist of those provinces surrounding
Marmara Sea, collectively known as the Marmara Region. Three most important
provinces are Kocaeli immediately to the east, Trakya (Thrace) in the west and Bursa
on the opposite shore of the sea.
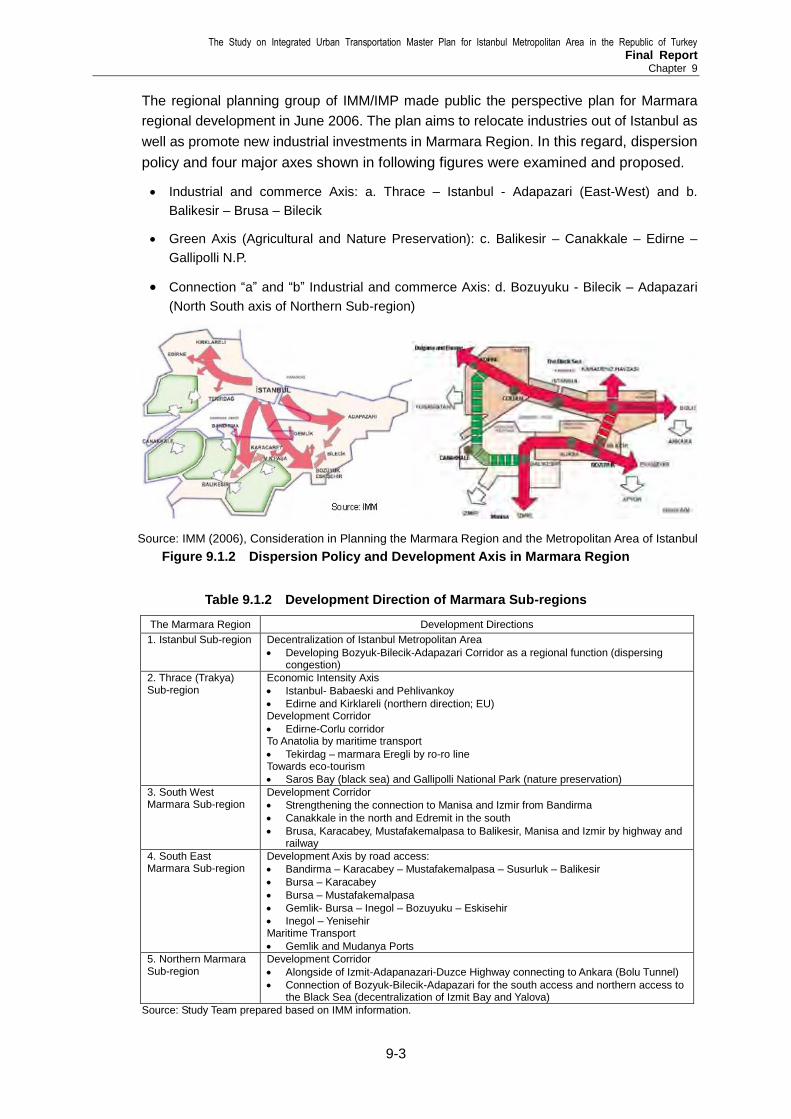
The Study on Integrated Urban Transportation Master Plan for Istanbul Metropolitan Area in the Republic of Turkey Final Report
Chapter 9
9-3
The regional planning group of IMM/IMP made public the perspective plan for Marmara
regional development in June 2006. The plan aims to relocate industries out of Istanbul as
well as promote new industrial investments in Marmara Region. In this regard, dispersion
policy and four major axes shown in following figures were examined and proposed.
Industrial and commerce Axis: a. Thrace – Istanbul - Adapazari (East-West) and b.
Balikesir – Brusa – Bilecik
Green Axis (Agricultural and Nature Preservation): c. Balikesir – Canakkale – Edirne –
Gallipolli N.P.
Connection “a” and “b” Industrial and commerce Axis: d. Bozuyuku - Bilecik – Adapazari
(North South axis of Northern Sub-region)
Source: IMM (2006), Consideration in Planning the Marmara Region and the Metropolitan Area of Istanbul
Figure 9.1.2 Dispersion Policy and Development Axis in Marmara Region
Table 9.1.2 Development Direction of Marmara Sub-regions
The Marmara Region Development Directions
1. Istanbul Sub-region Decentralization of Istanbul Metropolitan Area
Developing Bozyuk-Bilecik-Adapazari Corridor as a regional function (dispersing congestion)
2. Thrace (Trakya) Sub-region
Economic Intensity Axis
Istanbul- Babaeski and Pehlivankoy
Edirne and Kirklareli (northern direction; EU) Development Corridor
Edirne-Corlu corridor To Anatolia by maritime transport
Tekirdag – marmara Eregli by ro-ro line Towards eco-tourism
Saros Bay (black sea) and Gallipolli National Park (nature preservation)
3. South West Marmara Sub-region
Development Corridor
Strengthening the connection to Manisa and Izmir from Bandirma
Canakkale in the north and Edremit in the south
Brusa, Karacabey, Mustafakemalpasa to Balikesir, Manisa and Izmir by highway and railway
4. South East Marmara Sub-region
Development Axis by road access:
Bandirma – Karacabey – Mustafakemalpasa – Susurluk – Balikesir
Bursa – Karacabey
Bursa – Mustafakemalpasa
Gemlik- Bursa – Inegol – Bozuyuku – Eskisehir
Inegol – Yenisehir Maritime Transport
Gemlik and Mudanya Ports
5. Northern Marmara Sub-region
Development Corridor
Alongside of Izmit-Adapanazari-Duzce Highway connecting to Ankara (Bolu Tunnel)
Connection of Bozyuk-Bilecik-Adapazari for the south access and northern access to the Black Sea (decentralization of Izmit Bay and Yalova)
Source: Study Team prepared based on IMM information.

The Study on Integrated Urban Transportation Master Plan for Istanbul Metropolitan Area in the Republic of Turkey Final Report Chapter 9
9-4
In addition, development direction in each sub-region was also examined and proposed
shown in Table 1.x.2, and the envisioned transport network proposes the strengthening of
the east-west axis that crosses Istanbul, another east-west axis of Badirma – Bursa –
Bozuyuk on the opposite shore and the axis of Bilecik – Bozuyuk that connects the two
shown in following figure.
Figure 9.1.3 Development Diagram in Marmara Region
(3) Trakya Sub-Regional Development
The same IMM/IMP group formulated this plan with Silivri as the future urban growth
pole in Trakya regional development. The existing industrial agglomerations in Corlu
and Cerkezkoy found along the axis from Silivri toward Europe will be integrated into
the regional development. Major development policies are;
Functional and special Integration of Silivri-Gumusyaka (western part of Istanbul)
and adjacent area of Corlu-Cerkezkoy as a 2 million population area
Functional linkage of Silivri-Gumusyaka and Tekirdag- Marmara Sea Coast
Connecting Corlu-Cerkezkoy to Edirne Luleburgaz-Babaeski which leads to Europe
Ecological axis (water basin conservation) Istrancalar - Terkoz where is the Black Sea
side
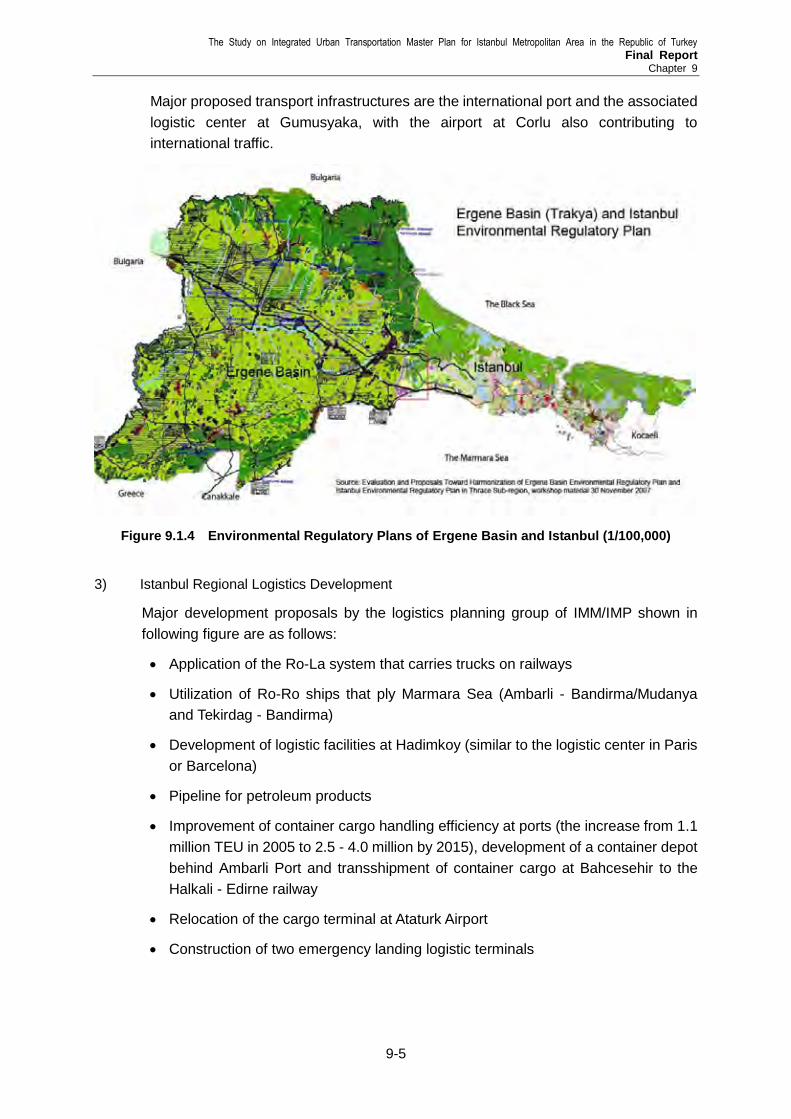
The Study on Integrated Urban Transportation Master Plan for Istanbul Metropolitan Area in the Republic of Turkey Final Report
Chapter 9
9-5
Major proposed transport infrastructures are the international port and the associated
logistic center at Gumusyaka, with the airport at Corlu also contributing to
international traffic.
Figure 9.1.4 Environmental Regulatory Plans of Ergene Basin and Istanbul (1/100,000)
3) Istanbul Regional Logistics Development
Major development proposals by the logistics planning group of IMM/IMP shown in
following figure are as follows:
Application of the Ro-La system that carries trucks on railways
Utilization of Ro-Ro ships that ply Marmara Sea (Ambarli - Bandirma/Mudanya
and Tekirdag - Bandirma)
Development of logistic facilities at Hadimkoy (similar to the logistic center in Paris
or Barcelona)
Pipeline for petroleum products
Improvement of container cargo handling efficiency at ports (the increase from 1.1
million TEU in 2005 to 2.5 - 4.0 million by 2015), development of a container depot
behind Ambarli Port and transshipment of container cargo at Bahcesehir to the
Halkali - Edirne railway
Relocation of the cargo terminal at Ataturk Airport
Construction of two emergency landing logistic terminals

The Study on Integrated Urban Transportation Master Plan for Istanbul Metropolitan Area in the Republic of Turkey Final Report Chapter 9
9-6
Source: IMM (2006), Consideration in Planning the Marmara Region and the Metropolitan Area of Istanbul
Figure 9.1.5 Logistic Development Plan in Marmara Region
9.2 Review of Istanbul Metropolitan Area Master Plan
9.2.1 Turkey’s Long-Term Development Strategy (2001-2023) and Five-Year Development
Plan
In 2001 Turkey’s Long-Term Development Strategy (2001-2023) set forth long term
strategies which, among others, declared the following goals: (1) Make Turkey an
influential global power in the 21st century, (2) Ensure transformation into an information
society, (3) Transform the country’s social and economic structure, (4) Shift to an
export-oriented, technology-intensive production structure with an emphasis on generating
a high value added, consistent with the international standards and likely to activate local
resources. Consequently, it is expected that Turkey’s society GDP is due to develop at
about 7% annually so to reach higher economic levels and per capita income for its
eventual converging with that of the level of the European Union countries by 2023.
In conjunction with the long-term strategy, the 8th Five-Year Development plan
(2001-2005) was laid down and executed, where a rapid economic growth was performed
as represented in its GDP growth rate from 2002 to 2005 shown in Chapter 1.
Subsequently, 9th Five-Year Development Plan (2007-2013) was prepared with the vision
of making “Turkey, a country of information society, growing in stability, sharing more
equitably competitive and fully completed her coherence with the European Union” within
the framework of the long term strategy. With its reform process and tight monetary/fiscal
policies, the past high growth performance is expected to continue with a GDP growth at
about 7% annually till 2013 lifting the per capita income to 10,100 dollars in 2013, which
would make Turkey the 17th biggest economy in the world (Chapter Targets and

The Study on Integrated Urban Transportation Master Plan for Istanbul Metropolitan Area in the Republic of Turkey Final Report
Chapter 9
9-7
Projections for the Plan Period)
The 9th Five-Year Development Plan changed the former planning concept of
accumulating district-wise detailed plans to a strategic approach that included institutional
and structural regulations, prioritization of problems, focusing on basic goals and priorities,
such as effective monitoring and establishment of evaluation mechanism.
More specifically, the strategic objectives have been determined as “development axes” to
realize the vision of the 9th Five-Year Development Plan, which : 1. Increasing
Competitiveness, 2. Increasing Employment, 3. Strengthening Human Development and
Social Solidarity, 4. Ensuring Regional Development, 5. Increasing Quality and
Effectiveness in Public Services, and 6. Ensuring Regional Development.
According to the new understanding of planning concept as mentioned above, the
development axes are detailed in the Medium-Term Program (2007-2009 and 2008-2010),
which is updated every year with due consideration of annual implementation results, and
internal and external changes. Finally, based on the Medium-Term Program, the Annual
Program is set forth for implementation. As such, the 2007 Annual Program is currently in
effect in the Republic of Turkey.
With regard to one of the development axes of “Ensuring Regional Development” started
in the 2007 Annual Program, the past and current performances were monitored and
evaluated. Then, the policies and measures were elaborated for execution as stated
below.
Increasing the effectiveness of regional development policies at the central level.
Enhancing development based on local dynamics and internal potentials.
Improving the institutional capacities at local level.
The main target of this development axis of regional development in Turkey is linked with
the alleviation of development disparities among regions and hence the reduction of
intense migration. Thus the proposed of policies and measures focus mainly on regional
development initiatives (regional growth centers) in the less- or under-developed regions
in the country, such as Aegean Foundation for Economic Development (EGEV), the
Foundation of Adana Gucbirligi and Adana Investment Research and Development Center
(AYAGEM), the Council of Mersin Development and Co-operation (MEKIK), the Council of
Samsun Regional Economic Development (SABEKAK), and the Foundation for the
Economic Development of Western Mediterranean (BAGEV). Correspondingly, the 2007
Annual Program started that the national regional development strategy studies have
commenced, and the national framework for regional development would be developed in
the plan period of 2007. This forthcoming national framework plan and its implementation
will definitively affect the future of Istanbul Metropolitan Region in terms of population
(scale of in-migration), employment size and its role and function as a potent social and
economic engine of Turkey.
9.2.2 Review of Istanbul Metropolitan Area Master Plan
In 2006, when the 9th Five-Year Development Plan (2007-2013) was established, the
Istanbul Metropolitan Area Master Plan was also formulated by IMM and was officially

The Study on Integrated Urban Transportation Master Plan for Istanbul Metropolitan Area in the Republic of Turkey Final Report Chapter 9
9-8
approved by the Istanbul Metropolitan Municipality Council. In this JICA transport study the
Master Plan was reviewed with a main focus on the socio-economic framework and its
distribution by 2023, which is essential for the transport network study, especially traffic
demand forecast.
1) Standpoints for Review
Reviewing the 2007 Master Plan study, the most important planning issue for future
sustainable growth of Istanbul is the proposed urban transformation including the impacts
or benefits of “Industrial structure” and “Urban Structure”. Industrial restructuring aims at
developing Istanbul into a global city in response to worldwide globalization (accelerated
market economy, free trade and capital investment associated with information technology
development) and integration/into EU (now in the negotiation process). This industrial
restructuring also necessitates change in the old and traditional existing urban structure of
the city, which can no longer accommodate its growing population and the industrial
innovation required for a global city.
Industrial Structure
The transformation of industrial structure of Istanbul will dictate the reform of the following
two sectors, taking into consideration the advantages such as geo political position,
cultural heritage, and economic and social developments:
Past and current manufacturing industry plagued with low productivity and
labor-intensive production must shift to export-oriented, technology-intensive
production with emphasis on generating high value added factors.
In order for Istanbul to be a global city, it must grow from an industrial city to city of
service in line with the national target of transformation into an information society.
This includes development of international and national financial, technological,
information, and service industries.
The former supports the latter, and vice versa. The former is related to industrial relocation
planning and the latter to trade and commercial center development in Istanbul mentioned
in the Master Plan.
Urban Structure
It is a common knowledge that the urban structure of a city must be changed or
transformed when the city reaches a certain level of urban growth, especially where the old
urban structure can no longer accommodate the increasing population and activities in
terms of quantity and quality. It is recognized that Istanbul has reached this turning point
where it has to change its urban structure into a mega city of more than 10 million people.
However, the serious barrier for urban expansion and restructuring in Istanbul is its natural
restriction on space for development, the narrow strip of land limited by sea and strait, its
hilly and steep land areas, its serious environmental vulnerability, and other factors
compared with other mega cities in the world that have mostly grown on alluvial plains. In
this respect it may be appropriate for the master planning to first prioritize environmental
sustainability within which urban restructuring concepts and plans should be devised.

The Study on Integrated Urban Transportation Master Plan for Istanbul Metropolitan Area in the Republic of Turkey Final Report
Chapter 9
9-9
2) Objectives and Policies
It is certain that the Master Plan was prepared in a period of radical economic and social
changes in the world, and Istanbul also planned to transform herself into a global city
integrated with the changing social and economic global networks. For this end the plan
employed a basic principle of sustainability on the urban transformation policies were
established for socio-economic and urban growth for the city. This is because the plan was
firstly formulated under the title: Istanbul Environment Plan which sought a way for urban
growth while keeping environmental sustainability.
More specifically the Master Plan was elaborated in such manner as integrating the sector
studies and planning. The plan included the following documents: 1)The Marmara Region,
2) Natural Resources of Istanbul Province, 3) Housing and Quality of Life in Residential
Areas, 4) Service Sector, 5) Industrial Sector, 6) Culture and Tourism, 7) Transportation
System, and 8) Urban Logistics Planning for Istanbul. Among others the analysis on the
city’s natural resources is most in directing future urbanization expansion over which the
new urban structure of Istanbul Metropolitan Area was proposed.
“1/100,000 Scale Master (which is now under revision) Plan” set forth the objectives and
policies as follow:
Objectives;
Improving the quality of life, including “sustainability of natural assets” and “improvement of
the standard of living”
Policies;
Sustainable development.
Economic structural changes, including shifts from predominantly industrial
economic structure to a competitive service economy that is based on information
and technology development.
Consolidating industries in Istanbul and directing industrial growth to the region.
Decentralization of centers.
Improvement of transportation and logistics infrastructure.
3) Urban Growth
It is apparent that the scale and magnitude for future urban growth of Istanbul will
significantly influence its urban structure. However the Istanbul Master Plan is silent about
the target socio-economic growth size (GDP, employment, and population) in 2023 or 2025
except its population size.
In this situation JICA Study Team reviewed the population projection of the Master Plan,
and re-estimated other socio-economic indicators, compliance with the planning
framework and the development concepts of the Master Plan. This was necessary for
traffic demand forecast.

The Study on Integrated Urban Transportation Master Plan for Istanbul Metropolitan Area in the Republic of Turkey Final Report Chapter 9
9-10
(1) Population
Urban growth in terms of population was projected in 2 cases in the Master Plan: 1)
Un-checked (uncontrolled), and 2) Checked (controlled) as listed in Table 9.2.1. The
Master Plan shows that if necessary measures are not taken, it is estimated that at the
current un-checked population growth rate (3.2%), will continue and the population of
Istanbul will increase to 22,037,990 in 2025, while it will be 17,396,595 in 2025 assuming a
population control that the population growth rate will decline and reach zero growth by
2045.
Table 9.2.1 Population Projection of Istanbul in Master Plan
2000 2005 2010 2020 2025 2045 2050
Case (1) Population (1000) 10,018 11,729 13,732 18,823 22,037 41,405 48,476
Unchecked Growth rate/year (%) 3.20 3.20 3.20 3.20 3.20 3.20
Case (2) Population (1000) 10,018 11,546 13,098 16,077 17,396 20,367 20,367
Checked Growth rate/year (%) 2.88 2.55 2.07 1.59 0.79 0.00
Case (1): Increase at un-checked population growth rate of 3.2%
Case (2): Population growth rate will decline and reach zero growth in 2045
Source: Istanbul Comprehensive Master Plan, 1996-2003 (under revison)
In addition to these population projections of the two cases, IMM calculated the
environmental capacity of Istanbul and pegged the figure at 16,000,000, which is deemed
to be the limit on urban growth for maintaining environmental sustainability. Based on
these discussions the IMM decided a population target for Istanbul at 16,000,000 to
17,000,000 in 2023.
It seems an overestimate if the population is assumed to increase at un-checked
population growth rate of 3.2 % up to the year 2025, taking into account the past trends
that show consistent decrease in annual population growth ratio as shown in Chapter 1.
Population was estimated based on the past trends of declining annual growth rates. This
leads to a 2025 population 18,547,000 (Figure 9.2.1).
Source : Elaborated by Study Team Based on census data
Figure 9.2.1 Trend Based Population Estimation
Table 9.2.2 summarizes the population estimates discussed above. The Master Plan
included land use plans and infrastructure plans, and established IMM’s target population
at 16,000,000. In this regard JICA Study Team’s remarks are as follow:
Needless to say, necessary measures and strong commitments of both the
Year Population (000)
2005 11,606
2010 13,310
2015 15,064
2020 16,826
2025 18,547
y = -134.26Ln(x) + 1023.9
R2 = 0.9664
0.000
0.500
1.000
1.500
2.000
2.500
3.000
3.500
4.000
4.500
5.000
1975 1980 1985 1990 1995 2000 2005 2010

The Study on Integrated Urban Transportation Master Plan for Istanbul Metropolitan Area in the Republic of Turkey Final Report
Chapter 9
9-11
Central and Local governments on population control are indispensable for
controlling and attaining the population target of 16,000,000 in Istanbul. Otherwise
the most likely population estimate will be trend based 18,500,000 (The gap is
more than 2,500,000). That the Master Plan is silent about this issue.
Environmental capacity is set at 16 million to maintain Istanbul’s environmental
sustainability. However, the Master Plan does not show how this was calculated
and what were the natural factors that constrain the population grow were.
Strict enforcement of regulations for containing the urban and housing
development (either legal or illegal) in limited areas and controlling population
density is needed to keep population volume under the environmental capacity.
The Master Plan does not explain now.
In a sense, planning is the provision of future favorable and unfavorable possibilities. Since
the planning direction of the Master Plan is considerably different from the likely trend, it is
recommended to prepare for the possible deviation from the target population.
Table 9.2.2 Population Projection of Istanbul
Cases 2025 Population (000) Growth Rate (%)
IMM Estimation (Zero balance 2045) 17,396 2.07
IMM Target (Environmental capacity) 16,000 1.64
Trend Estimation 18,547 2.40
Source : Study Team
(2) Employment
The general employment situation in Istanbul is shown in Table 9.2.3. Istanbul’s
employment rate of 42.6 % is quite low compared with the European averages and in the
OECD countries (Table 9.2.4). This is attributable to its lower share of women in
employment in Istanbul and Turkey.
Table 9.2.3 Labor Force and Employment of Istanbul in 2006
Population (000) 11,923 - -
Population with age <15 (000) 8,636 - -
Labor force (000) 4,143 Labor force participation 48.0%
Employment (000) 3,677 Employment rate 42.6%
Unemployment (000) 466 Unemployment rate 11.2%
Employment/Population 30.8%
Source: Turkey’ Statistical Yearbook 2006
To estimate the employment size of Istanbul in 2025 a target employment rate was set at
54.6%, which is equivalent to the middle between Istanbul and EU in 2005. This target
translates to employment per population ratio at 39.5%. Thus the total number of
employment of Istanbul was calculated at 6,400,000 in 2025 as shown in Table 9.2.5.

The Study on Integrated Urban Transportation Master Plan for Istanbul Metropolitan Area in the Republic of Turkey Final Report Chapter 9
9-12
Table 9.2.4 Comparison of Employment and Labor Force with EU in 2005 (%)
Istanbul Turkey EU OECD
Labor force participation 1)
48.0 1)
47.4 72.2 70.9 Labor force/Population with age>15
Employment rate 42.6 52.5 66.6 66.3 Employment/Population with age>15
Unemployment rate 11.2 9.8 7.8 5.9 Unemployment/Labor force
Employment/Population 30.8 Employment/Total Population
Note: 1)
Share of women of working age (15 to 64 years ) in employment: 27.3% in Turkey, 46.0% in EU(15
countries) 46.2% in Greece (OECD Fact book 2007)
Source: OECD Economic Outlook No. 81 - Statistical Annex Tables
Table 9.2.5 Employment Projection
Population (000) Employment (000) Employment/Population (%)
1996 1)
8,377 2,505 29.9
2005 2)
11,606 3,863 33.3
2006 3)
11,923 3,677 30.8
2025 16,000 6,400 40.0
Source: 1)
1996 Transport M/P Study, 2)
2005 Transport M/P Study, 3)
Turkey's Statistical Yearbook 2006
(3) GDP and Household Income
T.R. Prime Ministry State Planning Organization and several world organizations including
World Bank, OECD, IMF, and others have presented GDP forecasts for Turkey and
Istanbul as listed in Table 9.2.6.
Table 9.2.6 GDP Forecast of Turkey and Istanbul (% p.a.)
2004 2005 2006 2007 2008 07-09 07-13 08-10 05-20 01-23
Turkey
World Bank Real $ 8.9 7.4 6.0 5.0 5.0 - - - - -
OECD Real $ 8.9 7.4 6.0 5.7 6.2 - - - - -
IMF Real $ - 7.4 6.0 5.7 6.0 - - - - -
STO Medium Term
07-09 1)
Real $ - - - - - 7.0 - - - -
9th
Development Plan
07-13 2)
- - - - - - 7.0 - - -
STO Medium Term
08-10 3)
Real $ - - - - - - - 5.6 - -
STO Long Term
Strategy 4)
Real $ - - - - - - - - - 7.0
Istanbul PWH Coopers
(05-20) 5)
PPP $ - - - - - - - - 5.2 -
Note: PPP: Purchasing Power Parity
Source: 1)
and 3)
T.R. Prime Ministry State Planning Organization: Medium Term Program, 2)
9th Development Plan
07-13, 4)
Long–Term Strategy and Eighth Five–Year Development Plan 2001–2005, 5)
Pricewaterhouse
Coopers UK Economic Outlook March 2007
It seems rational that Istanbul’s GDP will grow parallel to the national GDP of Turkey taking
into consideration that the city’s share to Turkey in terms of GDP has been constant
around 21-22 % for the past 10 years, as shown before in Chapter 1. In this respect, it is
anticipated that Istanbul’s GDP growth will maintain the level of the national GDP as listed
in Table 9.2.6. The most updated forecast of GDP growth rate 5.2% of Istanbul, in
particular, was announced by Pricewaterhouse Coopers UK (see Table 9.2.7). Although
this figure falls short of the level of national forecast, this seems to be on the safer side.

The Study on Integrated Urban Transportation Master Plan for Istanbul Metropolitan Area in the Republic of Turkey Final Report
Chapter 9
9-13
Table 9.2.7 Estimated GDP of Urban Agglomeration of Istanbul
2005 2020 Growth(%/year)
Population Millions 9.70 11.84 1.3
PPP GDP $Bn at 2005 PPP 133 287 5.2
Source: PricewaterhouseCoopers UK Economic Outlook March 2007 (Turkey 2006
Total GDP: 402.71 million $, PPP GDP: 661.65 million $)
On this premise, growth rate of GDP for Istanbul was set at 5.2 % annually (2005-2025).
Accordingly growth rate of per capita GDP was calculated at 3.21% per year given a
population growth rate at 1.61%, which is IMM’s population growth target. And finally it was
assumed that average household income will increase at the same annual growth rate of
per capita GDP.
Table 9.2.8 Per Capita GDP and Household Income
2005 2025 2005-2025 (%/year)
Per Capita GDP per year (YTL) 5,482 12,078 3.21
Average Household income per month ( YTL) 1,144 2,521 3.21
Assumption: 1. Growth of GDP is set at 5.2 % (2005-2025) 2. Growth of GDP (5.2 %) = Population Growth rate (1.62%)x Growth rate of Per capita GDP =
3.21 %/year 3. Average Household income will increase at the same annual growth rate of Per capita GDP
Source : Study Team
(4) No. of Students
The student per population ratio was estimated at 0.22 as shown in Table 9.2.9. The
factors that change this ratio toward 2025 include 1) Population aging and 2) Schooling
ratio as show in Table 9.2.10. Firstly, the ratio of 6-25 year old population/total population
in 2005 and 2025 was estimated to obtain the aging ratio at 0.88 as seen in Table 9.2.10.
Table 9.2.9 Number of Student by Educational Institute
Istanbul Turkey 1996 2005 2005
Student Student/
population Student
Student/ population
Student Student/
population
Total Student 1,462,617 0.16 2,566,554 0.22 16,113,406 0.22
Primary education - - 2,309,031 - 10,673,935 0.15
Secondary education - - - - 3,258,254 0.04
Higher education - - 257,523 - 2,181,217 0.03
Population in1996 Study area 9,349,965 11,766,554 72,972,000
Source: Planning Dept., IMM/IMP
Table 9.2.10 Factors to Change Student/Population Ratio
Factors 2005 2025 2025/2005
Ratio of 6-25 year old Population/Total Population 0.359 0.317 0.88
Schooling Ratio 9.74 12.40 1.27
Change in Student/population Ratio 1.12
Source: Planning Dept., IMM/IMP and Study Team
Secondary, schooling ratio was estimated at 1.27 as shown in Table 9.2.11 assuming an
enrollment ratio in 2025 by educational institutions: Primary education – 100%, secondary
education – 100%, and higher education – 35 %. Thus the student/population ratio was

The Study on Integrated Urban Transportation Master Plan for Istanbul Metropolitan Area in the Republic of Turkey Final Report Chapter 9
9-14
calculated at 1.12, and the total number of students at 3,919,000 (0.22 x 1.12 x
16,000,000) for 2025.
Table 9.2.11 Schooling Ratio Change
Period (year) Schooling ratio
2005 2025 2005-2025
Primary education 8 0.90 1.00 Compulsory
Secondary education 3 0.58 1.00 Compulsory
Higher education 4 0.20 0.351)
Total number of students 9.74 12.40 1.27
Note: 1)
Basic Targets and Strategy for Long Term Development (2001-2023) set this target at 0.50.
Source : Study Team
4) Review of Master Plan Land Use and Urban Structure
Sector studies were incorporated into the Istanbul Master Plan under the framework of
environmental sustainability, and embodied in the 2006 Comprehensive Master Plan
(2007-2023) as shown in Source : 2006 Master Plan, IMM
Figure 9.2.3, which replaced the 1995 Master Plan Land Use Map (1995-2010)shown in
Source : 1995 Master Plan, IMM
Figure 9.2.2. The proposed urban structure in the Master Plan is discussed in the following
section.
Source : 1995 Master Plan, IMM
Figure 9.2.2 Land Use Map (1995-2010) of 1995 Master Plan

The Study on Integrated Urban Transportation Master Plan for Istanbul Metropolitan Area in the Republic of Turkey Final Report
Chapter 9
9-15
Source : 2006 Master Plan, IMM
Figure 9.2.3 Land Use Map (2007-2023) of 2006 Master Plan (Presently under revision)
(1) Urban Area Expansions
a) Natural Threshold Synthesis
Directing and designating the future urban area expansion of Istanbul is the first important
task of the present master planning since it is likely to determine the future
environmental/ecological system of the region as well as the spatial system of social and
economic lives.
Natural Threshold Synthesis, which was elaborated in the IMM Master Planning, through
the risk and potential analysis on natural resources including, agricultural land and soil,
and forest area and ecology. The result is shown in Figure 9.2.4. This works as an urban
development framework directing future urban expansion, land use plans, and most
importantly, the urban structure of Istanbul.
Figure 9.2.4 Natural Threshold Synthesis
Source: 2006 Istanbul Comprehensive Master Plan (under
revision)
60 km 80 km
30km
A: Terkos Basin B: Buyukcekmece Basin C: Kucukcekmece Basin D: Sazlidere Basin E: Alibeykoy Basin F: Historical Old Dam G: Elmali Basin H: Omerli Basin I: Darlik Basin
A
B
C
D
E
F
G
H
I
Absolutely protected natural resources area Natural resources area that have protected as a priority Limited natural resource areas Mining areas which must inevitably be preserved Mining areas which have the priority of preservation Surface water basin boundary Forest boundary Settlement area boundary

The Study on Integrated Urban Transportation Master Plan for Istanbul Metropolitan Area in the Republic of Turkey Final Report Chapter 9
9-16
Source: Urban sprawl in Europe, The ignored challenge, EUROPEAN COMMISSION Directorate-General
Joint Research Center, European Environment Agency, EEA Report No 10/2006,
MOLAND (JRC) and Kasanko et al., 2006
Figure 9.2.5 Urban Area in 2000 and 2020
Source: 2006 Istanbul Comprehensive Master Plan (under revision)
Figure 9.2.6 Extent of Urban Area in 2020 in the Master Plan
This synthesis map presented protected and limited natural areas and water basin areas
which are deemed important for maintaining ecological balance and hence the
environmental sustainability of Istanbul.
b) Forecast of Urban Expansion in 2020
It is undeniable that forecasts for future urban expansion, based on the existing
development trends is quite important in identifying development potentials and in
determining future land use in harmony with natural preservation in addition to depicting
the natural areas to be protected against urbanization, Fortunately, one of the reliable
forecasts of urban expansion of Istanbul in 2020 is available in European Environment
Agency Report, titled “Urban Sprawl in Europe, the Ignored Challenge”, by the European
Commission Directorate-General Joint Research Center, Report No 10/2006, as shown in
30km 30km
2000 Simulated 2020
60 km 80 km
30km
Existing Urban Area
New Urban Area

The Study on Integrated Urban Transportation Master Plan for Istanbul Metropolitan Area in the Republic of Turkey Final Report
Chapter 9
9-17
Figure 9.2.5. The forecast was made using the MOLAND model. The urbanization trends
and directions presented in the report are consistent with that of the JICA Study Team as
analyzed and observed in the site survey.
The EEA Report identified three clear development tendencies; 1) the filling in of available
land within previously built-up areas, 2) the growth along the coastlines both in westward
and eastward direction, which is particularly noticeable on the west side (large new
residential areas in Bukucekmece). And 3) the conservation of the forested areas north of
Istanbul which have relatively little new residential developments. Future development
paths were set forth presuming to follow those development trends.
The built-up areas extending from the center toward the east and west already reached a
30 km radius from the geographical center of Istanbul’s urban area in as early as 2000 as
shown in Figure 9.2.5. It is apparent that the expansion of built-up areas have already
encroached into the critical three water basins within the vicinity of the existing urban
settlements; that is C: Kucukcekmece Basin, G: Elmali Basin, and H: Omerli Basin. The
lakes there are all threatened with water pollution through housing and urban development
The simulation of 2020 in Figure 9.2.5 tells that while urbanization will expand further east
and west beyond the 30 km radius, urban areas within the 30 km radius will be
continuously filled up with built-up areas. In addition, the conspicuous feature of
urbanization up to 2020 is the 3 water basins where the encroached built-up areas will be
covering bigger areas of land. This implies that the 3 water basins are endowed with the
highest potential for urban and housing development in spite of the necessity and
importance of preservation for ecological sustainability as claimed in the Master Plan. The
highest potential of the three basins is evidenced by the highest population growth rates
(most recently 2000-2005) of the administrative districts including the three water basins,
either partially or totally as shown in Figure 9.2.7. Consequently, the impending planning
issue is whether to pursue preservation or development in the three water basins or, if
neither, to what extent should the balance be.
Source : Study Team
Figure 9.2.7 Population Growth in the Water Basins
H: Omerli Basin C: Kucukcekmece Basin
G: Elmali Basin
Annual Population Growth Rate by
District (2000-2005)
5-8 % / year 3-5 % / year 0-3 % / year Minus% / year

The Study on Integrated Urban Transportation Master Plan for Istanbul Metropolitan Area in the Republic of Turkey Final Report Chapter 9
9-18
c) Planned Urban Areas in 2020 in Master Plan
Restrictive Future Urban Expansion limited to Linear Patterns along the Coastline
As shown in Figure 9.2.6, the future urban area has no alternative but to stretch linearly as
long as 110 km (30 km + 80 km) along the coastline between the easternmost and
westernmost administrative boundaries. This is due to the IMM’s firmly hold environmental
policy of preventing urbanization from penetrating the water basins especially in the north
except in C: Kucukcekmece. Preventing urban and housing development in the water
basins is a solid principle of the Master Plan, which limits future urban expansion and
consequently determines urban structures and land use plans as described in the
following chapter.
Very little New Urban Area within 30 km and Massive Expansion beyond 30 km
The above-mentioned direction of future spatial urbanization created the uniqueness of
Istanbul Master Plan, where future urban areas are planned mainly in existing built-up
areas with new urban and housing areas being marginally developed at the fringes of the
30 km radius (see very few sites for new urban and housing development in the color of
yellow within the 30 km radius in Figure 9.2.5). In contrast, the massive new urban areas
are planned far beyond the 30 km radius especially the western part of Istanbul, i.e. the
district of Silivri. This is mainly due to the fact that most land areas, excluding the protected
water basins, have already been covered with built-up areas within the 30km radius.
However one exception is allowed, that is C: Kucukcekmece Basin where new urban and
housing areas are planned/designated on considerably larger open lands. As described
above, in the C: Kucukcekmece Basin rapid population increases are prominent currently
and are forecast to continue.
The extent of urban expansion of Istanbul as described above is attributed to the IMM’ idea
of concentrating on existing settlements rather than having new settlement due to the
difficulty in determining zones for new settlements, which was explicitly stated in the
Master Plan as follows:
The restrictions that the natural structure demonstrate that it is difficult to determine the
zones suitable for settlement in Istanbul and it is therefore prudent to concentrate or
focus on improving the quality of the present settlements while taking necessary technical
precautions and reducing the pressure on the natural areas.
(ISTANBUL MASTER PLAN Summary -English version)
As a result urban expansion was pushed off westward far beyond 30 km radius from the
center.
(2) Transformation of Urban Structure
a) Linear Development Model
The IMM’s environmental policy indicates the direction of the urbanization in the Master
Plan to the narrow lengthening of future urban areas (10 km x 110 km) along the coastline
(Figure 9.2.8). The Master Plan tells that the narrow and lengthy urban areas should be
structured into “Linear development model extending on an east-west oriented axis” or
The Study on Integrated Urban Transportation Master Plan for Istanbul Metropolitan Area in the Republic of Turkey Final Report
Chapter 9
9-19
“Linear axis with multi-centered structure or hierarchical urban center system”.
b) Diagram of Urban Structure Transformation in the 2023 Master Plan
The urban structure transformation of Istanbul that the 2023 Master Plan aims at can be
roughly put in a shape as shown in the diagram of Figure 9.2.9, considering and
interpreting the policies and strategies of urban and industrial spatial development as
proposed in the Master Plan. A consistent concept to the Istanbul Comprehensive Master
Plan is represented by the key word “decentralization,” meaning that the saturated urban
and industrial accumulation in the built-up areas will be decentralized or relocated into
suburban areas toward east and west along the “linear development model” so as to
relieve the saturated urban areas on one hand, and to develop new urban settlements in
the suburban areas to accommodate the relocated industries from the
saturated/congested urban areas and to promote new industries less dependent on the
existing built-up areas, on the other hand. It is expected that less dependency of the new
urban settlements (self-reliant town) on the existing urban centers will lessen the pressure
or burden on the congested urban centers.
In the diagram of urban structure, development areas are classified as shown in Table
9.2.12. Among others, the most important six (6) districts in spatial development are
specified: Kartal, Pendik, Tuzla, Kucukcekmece, Buyukcekmece and Silivri which
altogether will accommodate as much as 98.7% of population increase and 85.2% of
employment increase during the plan period between 2005 and 2023.
Source: ibid.
Figure 9.2.8 Expansion of Urban Areas: Narrow and Lengthy Urban Area
Source: ibid.
Figure 9.2.9 Transformation of Urban Structure: Decentralization and New Urban Clusters
Natural Environment
Protection Line
Marmara Sea Coastline
30 km 30 km 80 km
Natural Environment Protection Zone
Pushing back penetrating urbanization
30 km 80 km
Saturated
urban &
industrial
accumulation
Urban Cluster (West)
(Silivri)
30 km
Decentralization & Relocation
Continuous urban area from the traditional urban
centers
Cerkezkoy Industrial city Gebze Industrial city
Kocaeli Tekirdag
Urban Cluster (East)
(Kartal, Pendik, Tuzla)
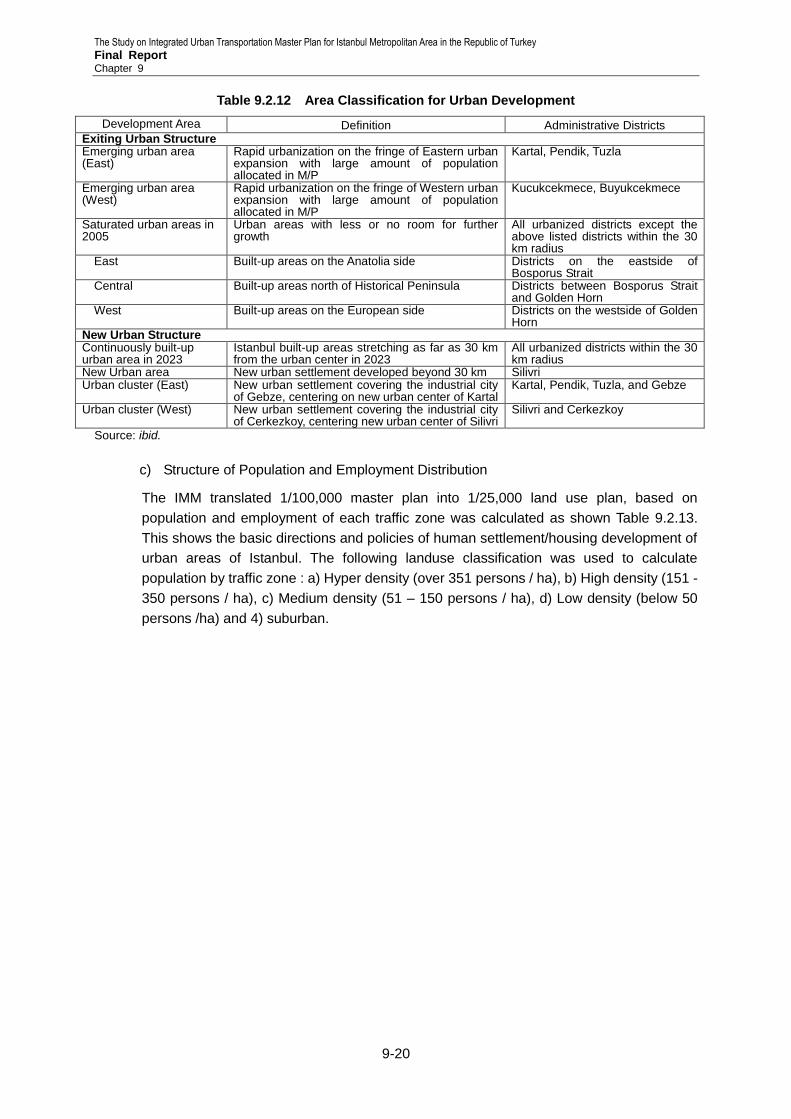
The Study on Integrated Urban Transportation Master Plan for Istanbul Metropolitan Area in the Republic of Turkey Final Report Chapter 9
9-20
Table 9.2.12 Area Classification for Urban Development
Development Area Definition Administrative Districts Exiting Urban Structure Emerging urban area (East)
Rapid urbanization on the fringe of Eastern urban expansion with large amount of population allocated in M/P
Kartal, Pendik, Tuzla
Emerging urban area (West)
Rapid urbanization on the fringe of Western urban expansion with large amount of population allocated in M/P
Kucukcekmece, Buyukcekmece
Saturated urban areas in 2005
Urban areas with less or no room for further growth
All urbanized districts except the above listed districts within the 30 km radius
East Built-up areas on the Anatolia side Districts on the eastside of Bosporus Strait
Central Built-up areas north of Historical Peninsula Districts between Bosporus Strait and Golden Horn
West Built-up areas on the European side Districts on the westside of Golden Horn
New Urban Structure Continuously built-up urban area in 2023
Istanbul built-up areas stretching as far as 30 km from the urban center in 2023
All urbanized districts within the 30 km radius
New Urban area New urban settlement developed beyond 30 km Silivri Urban cluster (East) New urban settlement covering the industrial city
of Gebze, centering on new urban center of Kartal Kartal, Pendik, Tuzla, and Gebze
Urban cluster (West) New urban settlement covering the industrial city of Cerkezkoy, centering new urban center of Silivri
Silivri and Cerkezkoy
Source: ibid.
c) Structure of Population and Employment Distribution
The IMM translated 1/100,000 master plan into 1/25,000 land use plan, based on
population and employment of each traffic zone was calculated as shown Table 9.2.13.
This shows the basic directions and policies of human settlement/housing development of
urban areas of Istanbul. The following landuse classification was used to calculate
population by traffic zone : a) Hyper density (over 351 persons / ha), b) High density (151 -
350 persons / ha), c) Medium density (51 – 150 persons / ha), d) Low density (below 50
persons /ha) and 4) suburban.
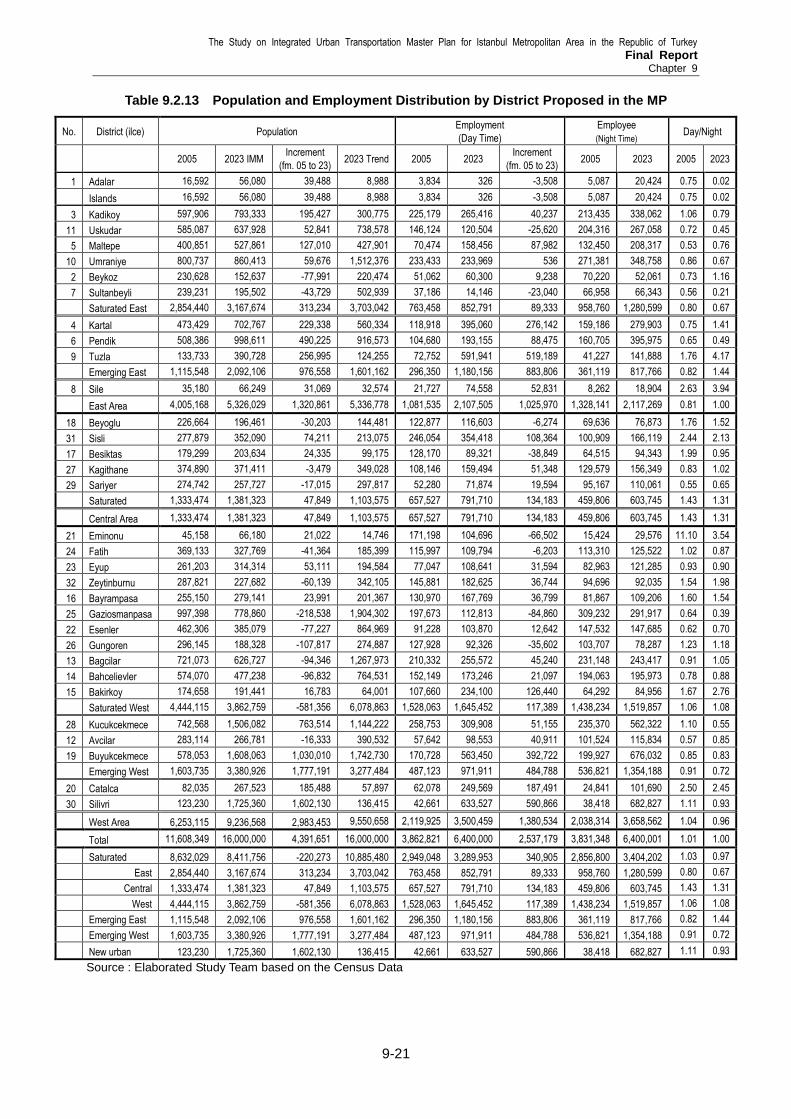
The Study on Integrated Urban Transportation Master Plan for Istanbul Metropolitan Area in the Republic of Turkey Final Report
Chapter 9
9-21
Table 9.2.13 Population and Employment Distribution by District Proposed in the MP
No. District (ilce) Population Employment
(Day Time)
Employee
(Night Time) Day/Night
2005 2023 IMM
Increment
(fm. 05 to 23) 2023 Trend 2005 2023
Increment
(fm. 05 to 23) 2005 2023 2005 2023
1 Adalar 16,592 56,080 39,488 8,988 3,834 326 -3,508 5,087 20,424 0.75 0.02
Islands 16,592 56,080 39,488 8,988 3,834 326 -3,508 5,087 20,424 0.75 0.02
3 Kadikoy 597,906 793,333 195,427 300,775 225,179 265,416 40,237 213,435 338,062 1.06 0.79
11 Uskudar 585,087 637,928 52,841 738,578 146,124 120,504 -25,620 204,316 267,058 0.72 0.45
5 Maltepe 400,851 527,861 127,010 427,901 70,474 158,456 87,982 132,450 208,317 0.53 0.76
10 Umraniye 800,737 860,413 59,676 1,512,376 233,433 233,969 536 271,381 348,758 0.86 0.67
2 Beykoz 230,628 152,637 -77,991 220,474 51,062 60,300 9,238 70,220 52,061 0.73 1.16
7 Sultanbeyli 239,231 195,502 -43,729 502,939 37,186 14,146 -23,040 66,958 66,343 0.56 0.21
Saturated East 2,854,440 3,167,674 313,234 3,703,042 763,458 852,791 89,333 958,760 1,280,599 0.80 0.67
4 Kartal 473,429 702,767 229,338 560,334 118,918 395,060 276,142 159,186 279,903 0.75 1.41
6 Pendik 508,386 998,611 490,225 916,573 104,680 193,155 88,475 160,705 395,975 0.65 0.49
9 Tuzla 133,733 390,728 256,995 124,255 72,752 591,941 519,189 41,227 141,888 1.76 4.17
Emerging East 1,115,548 2,092,106 976,558 1,601,162 296,350 1,180,156 883,806 361,119 817,766 0.82 1.44
8 Sile 35,180 66,249 31,069 32,574 21,727 74,558 52,831 8,262 18,904 2.63 3.94
East Area 4,005,168 5,326,029 1,320,861 5,336,778 1,081,535 2,107,505 1,025,970 1,328,141 2,117,269 0.81 1.00
18 Beyoglu 226,664 196,461 -30,203 144,481 122,877 116,603 -6,274 69,636 76,873 1.76 1.52
31 Sisli 277,879 352,090 74,211 213,075 246,054 354,418 108,364 100,909 166,119 2.44 2.13
17 Besiktas 179,299 203,634 24,335 99,175 128,170 89,321 -38,849 64,515 94,343 1.99 0.95
27 Kagithane 374,890 371,411 -3,479 349,028 108,146 159,494 51,348 129,579 156,349 0.83 1.02
29 Sariyer 274,742 257,727 -17,015 297,817 52,280 71,874 19,594 95,167 110,061 0.55 0.65
Saturated 1,333,474 1,381,323 47,849 1,103,575 657,527 791,710 134,183 459,806 603,745 1.43 1.31
Central Area 1,333,474 1,381,323 47,849 1,103,575 657,527 791,710 134,183 459,806 603,745 1.43 1.31
21 Eminonu 45,158 66,180 21,022 14,746 171,198 104,696 -66,502 15,424 29,576 11.10 3.54
24 Fatih 369,133 327,769 -41,364 185,399 115,997 109,794 -6,203 113,310 125,522 1.02 0.87
23 Eyup 261,203 314,314 53,111 194,584 77,047 108,641 31,594 82,963 121,285 0.93 0.90
32 Zeytinburnu 287,821 227,682 -60,139 342,105 145,881 182,625 36,744 94,696 92,035 1.54 1.98
16 Bayrampasa 255,150 279,141 23,991 201,367 130,970 167,769 36,799 81,867 109,206 1.60 1.54
25 Gaziosmanpasa 997,398 778,860 -218,538 1,904,302 197,673 112,813 -84,860 309,232 291,917 0.64 0.39
22 Esenler 462,306 385,079 -77,227 864,969 91,228 103,870 12,642 147,532 147,685 0.62 0.70
26 Gungoren 296,145 188,328 -107,817 274,887 127,928 92,326 -35,602 103,707 78,287 1.23 1.18
13 Bagcilar 721,073 626,727 -94,346 1,267,973 210,332 255,572 45,240 231,148 243,417 0.91 1.05
14 Bahcelievler 574,070 477,238 -96,832 764,531 152,149 173,246 21,097 194,063 195,973 0.78 0.88
15 Bakirkoy 174,658 191,441 16,783 64,001 107,660 234,100 126,440 64,292 84,956 1.67 2.76
Saturated West 4,444,115 3,862,759 -581,356 6,078,863 1,528,063 1,645,452 117,389 1,438,234 1,519,857 1.06 1.08
28 Kucukcekmece 742,568 1,506,082 763,514 1,144,222 258,753 309,908 51,155 235,370 562,322 1.10 0.55
12 Avcilar 283,114 266,781 -16,333 390,532 57,642 98,553 40,911 101,524 115,834 0.57 0.85
19 Buyukcekmece 578,053 1,608,063 1,030,010 1,742,730 170,728 563,450 392,722 199,927 676,032 0.85 0.83
Emerging West 1,603,735 3,380,926 1,777,191 3,277,484 487,123 971,911 484,788 536,821 1,354,188 0.91 0.72
20 Catalca 82,035 267,523 185,488 57,897 62,078 249,569 187,491 24,841 101,690 2.50 2.45
30 Silivri 123,230 1,725,360 1,602,130 136,415 42,661 633,527 590,866 38,418 682,827 1.11 0.93
West Area 6,253,115 9,236,568 2,983,453 9,550,658 2,119,925 3,500,459 1,380,534 2,038,314 3,658,562 1.04 0.96
Total 11,608,349 16,000,000 4,391,651 16,000,000 3,862,821 6,400,000 2,537,179 3,831,348 6,400,001 1.01 1.00
Saturated 8,632,029 8,411,756 -220,273 10,885,480 2,949,048 3,289,953 340,905 2,856,800 3,404,202 1.03 0.97
East 2,854,440 3,167,674 313,234 3,703,042 763,458 852,791 89,333 958,760 1,280,599 0.80 0.67
Central 1,333,474 1,381,323 47,849 1,103,575 657,527 791,710 134,183 459,806 603,745 1.43 1.31
West 4,444,115 3,862,759 -581,356 6,078,863 1,528,063 1,645,452 117,389 1,438,234 1,519,857 1.06 1.08
Emerging East 1,115,548 2,092,106 976,558 1,601,162 296,350 1,180,156 883,806 361,119 817,766 0.82 1.44
Emerging West 1,603,735 3,380,926 1,777,191 3,277,484 487,123 971,911 484,788 536,821 1,354,188 0.91 0.72
New urban 123,230 1,725,360 1,602,130 136,415 42,661 633,527 590,866 38,418 682,827 1.11 0.93
Source : Elaborated Study Team based on the Census Data

The Study on Integrated Urban Transportation Master Plan for Istanbul Metropolitan Area in the Republic of Turkey Final Report Chapter 9
9-22
i) Population Distribution
Nearly 94% of the population increase of 4.39 million up to 2023 is distributed in mainly 6
districts while population decreases are assumed throughout the saturated urban areas;
new urban area (Silivri): 1.60 million (38.8%), emerging urban area (West)
(Kucukcekmece, Buyukcekmece): 1.78 million (43.2%), emerging urban area (East)
(Kartal, Pendik, Tuzla): 0.98 million (23.3%) and saturated urban area: -0.22 million
(-5.3%) (Figure 9.2.10).
Source : Study Team
Figure 9.2.10 Population Distribution in 2005, 2023
However there are still some districts in the saturated urban areas that have persistently
increasing population (See Chapter 1). When this increasing trend continues as they are,
the population of the saturated areas, especially in the west will reach around 6 million
(Figure 9.2.10). This will create a gap of 2 million with the target of the Master Plan. Also,
in the previous Figure 9.2.5, the urban areas in 2000 and 2020 show the tendency of
population concentration within the 30 km radius from the urban center. Since population
change is likely to represent the current potential for housing development or people’s
preference on where to live, drastic measures in city planning and development are be
indispensable in order to realize the proposed population distribution.
Emerging Urban Area (East)
(Kartal, Pendik, Tuzla)
30 km 30 km 80 km
Saturated Urban Area
Emerging Urban Area (West)
(Kucukcekmece, Buyukcekmece)
+0.98 m (23.3%)
-0.22 m (-5.3%)
+1.78 m (43.2%)
+1.60 m (38.8%)
New Urban Area (Silivri)
Distribution of increasing population (4.39 million 2005-2023)
Saturated Urban Area
West Central East
1.0 m
2.0 m
3.0 m
4.0 m
5.0 m
2023-MP
2005-Existing
6.0 m
7.0 m
8.0 m
2023-Trend
Bosporus Strait Golden Horn
Kucukcekmece, Buyukcekmece
Kartal, Pendik, Tuzla
Emerging Urban Area (East)
Emerging Urban area (West)

The Study on Integrated Urban Transportation Master Plan for Istanbul Metropolitan Area in the Republic of Turkey Final Report
Chapter 9
9-23
ii) Employment Distribution
The 2023 Comprehensive Master Plan of Istanbul recognizes that Istanbul’s industrial
structure must be reformed in order to develop into a global city as it faces an intensifying
economic globalization in association with the development of information and
communication technology.
Industrial structural reform of Istanbul includes two innovative tasks, which are
complementary with each other:
Shift of the traditional manufacturing industry to high-value added industries such as
hi-tech industry and technology intensive production.
Conversion to, and development of service industry including “advanced
producers services” such as accountancy, advertising, management, finance and
legal service which are all necessary in a globalizing city.
The Master Plan advocates that the industrial structural reform should be
accomplished in the process of urban structure transformation as diagrammed in the
previous Figure 9.2.
In line with the proposed urban structure transformation, the industrial development
policies (decentralization and transformation) were set forth as shown in Figure 9.2.11 and
summarized as follows:
“Organized Industrial Zones” aim to realize their full potential by alleviating existing
problems (İkitelli, Tuzla, Dudullu, Beylikduzu, and Tekstilkent).
“Functional Transformation (Regeneration) of Industrial Areas” is determined for the
industrial activities located in the central zones, which have expansion limitations and
are in conflict with surrounding condition such as increasing land values. The
industrial areas in Zeytinburnu, İkitelli Axis, Bayrampasa, and Kartal should be
considered as potential transformation areas from industry to service activities.
“Rehabilitation of Industrial Areas within Existing Boundaries” envisages no new
investment but allows better actions in these areas. The neighboring regions of
Istanbul should also be taken into consideration from the perspective of the entire
metropolitan region. Gebze and Cerkezkoy are the neighboring districts of Istanbul in
the east and west. These districts not only enjoy the advantages of being close to the
IMA and its consumption markets, but also have OIZs which are yet to be fully utilized.
Provision of transportation and logistics facilities to these areas will accelerate the
agglomeration of economies for industrial establishments. Therefore, these regions
should be developed as industrial regions with problem solving intentions.
(Quoted from Key Intervention Areas of the Master Plan)
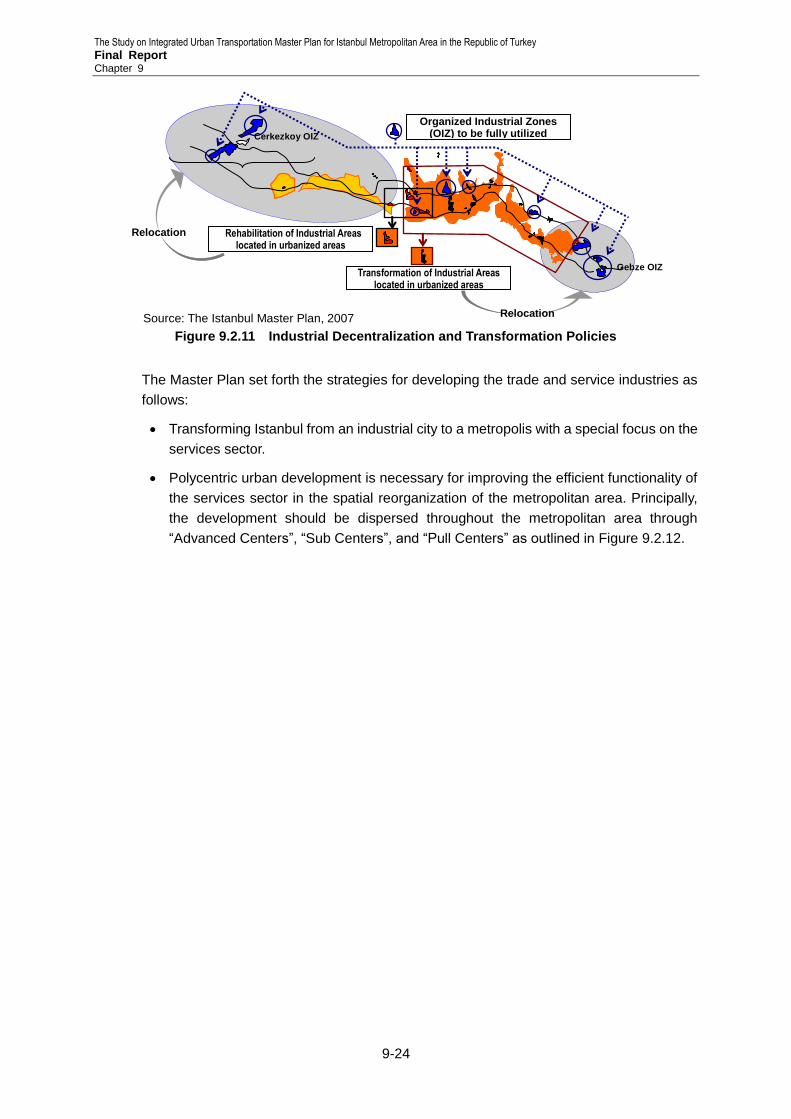
The Study on Integrated Urban Transportation Master Plan for Istanbul Metropolitan Area in the Republic of Turkey Final Report Chapter 9
9-24
Source: The Istanbul Master Plan, 2007
Figure 9.2.11 Industrial Decentralization and Transformation Policies
The Master Plan set forth the strategies for developing the trade and service industries as
follows:
Transforming Istanbul from an industrial city to a metropolis with a special focus on the
services sector.
Polycentric urban development is necessary for improving the efficient functionality of
the services sector in the spatial reorganization of the metropolitan area. Principally,
the development should be dispersed throughout the metropolitan area through
“Advanced Centers”, “Sub Centers”, and “Pull Centers” as outlined in Figure 9.2.12.
Gebze OIZ
Transformation of Industrial Areas located in urbanized areas
Organized Industrial Zones (OIZ) to be fully utilized
Cerkezkoy OIZ
Rehabilitation of Industrial Areas located in urbanized areas
Relocation
Relocation
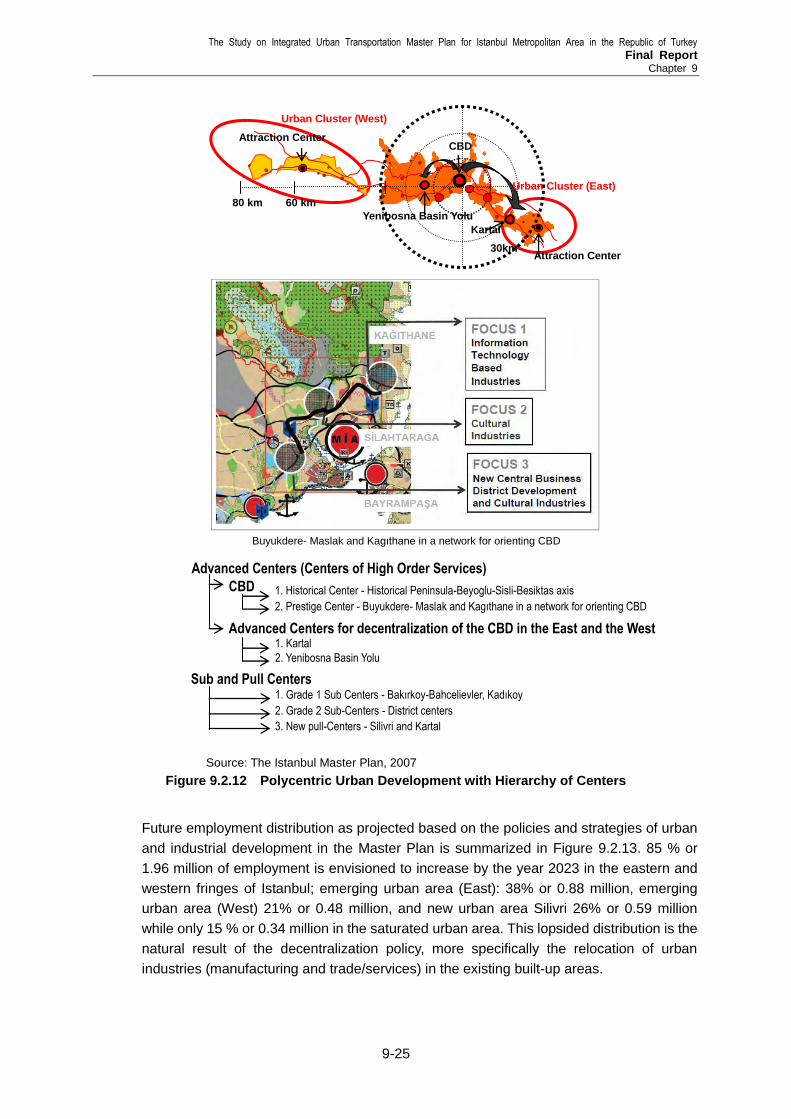
The Study on Integrated Urban Transportation Master Plan for Istanbul Metropolitan Area in the Republic of Turkey Final Report
Chapter 9
9-25
Source: The Istanbul Master Plan, 2007
Figure 9.2.12 Polycentric Urban Development with Hierarchy of Centers
Future employment distribution as projected based on the policies and strategies of urban
and industrial development in the Master Plan is summarized in Figure 9.2.13. 85 % or
1.96 million of employment is envisioned to increase by the year 2023 in the eastern and
western fringes of Istanbul; emerging urban area (East): 38% or 0.88 million, emerging
urban area (West) 21% or 0.48 million, and new urban area Silivri 26% or 0.59 million
while only 15 % or 0.34 million in the saturated urban area. This lopsided distribution is the
natural result of the decentralization policy, more specifically the relocation of urban
industries (manufacturing and trade/services) in the existing built-up areas.
60 km 80 km
30km 1. Kartal 2. Yenibosna Basin Yolu
2.
Kartal
Yenibosna Basin Yolu
CBD
Attraction Center
Attraction Center
Urban Cluster (East)
Urban Cluster (West)
Buyukdere- Maslak and Kagıthane in a network for orienting CBD
1. Historical Center - Historical Peninsula-Beyoglu-Sisli-Besiktas axis
2. Prestige Center - Buyukdere- Maslak and Kagıthane in a network for orienting CBD
CBD
Advanced Centers for decentralization of the CBD in the East and the West
Sub and Pull Centers
Advanced Centers (Centers of High Order Services)
1. Kartal
2. Yenibosna Basin Yolu
1. Grade 1 Sub Centers - Bakırkoy-Bahcelievler, Kadıkoy
2. Grade 2 Sub-Centers - District centers
3. New pull-Centers - Silivri and Kartal
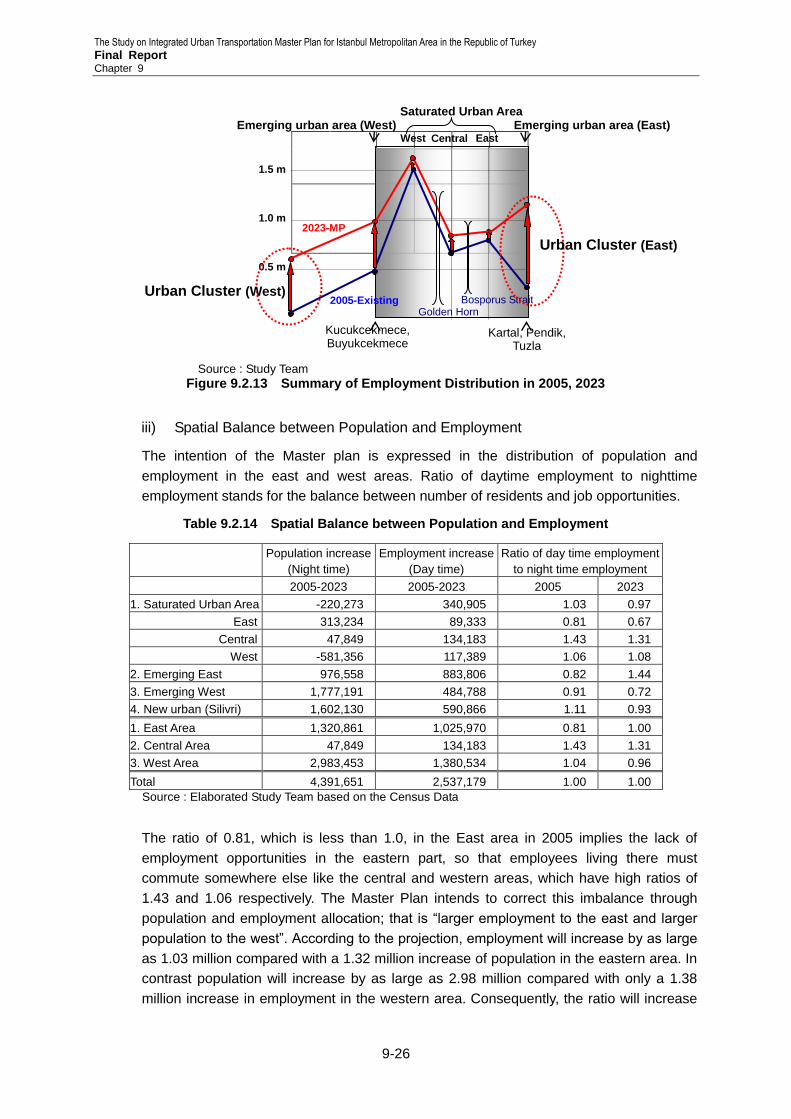
The Study on Integrated Urban Transportation Master Plan for Istanbul Metropolitan Area in the Republic of Turkey Final Report Chapter 9
9-26
Source : Study Team
Figure 9.2.13 Summary of Employment Distribution in 2005, 2023
iii) Spatial Balance between Population and Employment
The intention of the Master plan is expressed in the distribution of population and
employment in the east and west areas. Ratio of daytime employment to nighttime
employment stands for the balance between number of residents and job opportunities.
Table 9.2.14 Spatial Balance between Population and Employment
Population increase
(Night time)
Employment increase
(Day time)
Ratio of day time employment
to night time employment
2005-2023 2005-2023 2005 2023
1. Saturated Urban Area -220,273 340,905 1.03 0.97
East 313,234 89,333 0.81 0.67
Central 47,849 134,183 1.43 1.31
West -581,356 117,389 1.06 1.08
2. Emerging East 976,558 883,806 0.82 1.44
3. Emerging West 1,777,191 484,788 0.91 0.72
4. New urban (Silivri) 1,602,130 590,866 1.11 0.93
1. East Area 1,320,861 1,025,970 0.81 1.00
2. Central Area 47,849 134,183 1.43 1.31
3. West Area 2,983,453 1,380,534 1.04 0.96
Total 4,391,651 2,537,179 1.00 1.00
Source : Elaborated Study Team based on the Census Data
The ratio of 0.81, which is less than 1.0, in the East area in 2005 implies the lack of
employment opportunities in the eastern part, so that employees living there must
commute somewhere else like the central and western areas, which have high ratios of
1.43 and 1.06 respectively. The Master Plan intends to correct this imbalance through
population and employment allocation; that is “larger employment to the east and larger
population to the west”. According to the projection, employment will increase by as large
as 1.03 million compared with a 1.32 million increase of population in the eastern area. In
contrast population will increase by as large as 2.98 million compared with only a 1.38
million increase in employment in the western area. Consequently, the ratio will increase
Saturated Urban Area
West Central East
0.5 m
1.0 m 2023-MP
2005-Existing
1.5 m
8.0 m
Bosporus Strait Golden Horn
Kucukcekmece, Buyukcekmece
Kartal, Pendik, Tuzla
Emerging urban area (East)
Emerging urban area (West)
Urban Cluster (East)
Urban Cluster (West)

The Study on Integrated Urban Transportation Master Plan for Istanbul Metropolitan Area in the Republic of Turkey Final Report
Chapter 9
9-27
from 0.81 to 1.00 in 2023 in the eastern area, which shows a perfect balance between
population and employment. The engine which increases the employment in the east, as a
whole, is the district of Tuzla. Its ratio will increase from 1.76 in 2005 to 4.17 in 2023. It is
projected that in Tuzla employment grows by 519 thousand while population increase only
by 2567 thousand.
9.3 Special Project Areas of the Istanbul Master Plan, 2006 - 2023
The Special Project Area is determined in the entire city area in relation to the vision and
objectives of the Istanbul Master Plan’s (August 2007), and it plays an important role for
realizing the general vision comprising of three themes; 1) Environmental sustainability, 2)
Economic development and 3) Social sustainability strategically. The total number of
Special Project Areas is 48, of which 6 areas are for environmental sustainability, 22 areas
for economic development and 20 areas for social sustainability as shown in the following
table:
Table 9.3.1 Outline of Special Project Areas of Istanbul Comprehensive Master Plan, 2006 – 2023 (under revision)
The Master Plan’s Objectives
Special Areas’ Type Selected Project Areas
Environmental Sustainability (6 areas)
- Rehabilitation of river protection areas occupied by industries
- Rehabilitation of polluted lakes that have great ecological significance
- Rehabilitation of water catchment areas
1. Kucukcekmece Lake Rehabilitation and Environmental Management Special Project Area
2. Kamil Abdus Lake Rehabilitation Special Project Area
3. Dudullu Organized Industry Area Basin Rehabilitation Special Project Area
4. Kirac Esenyurt Bahcesehir High Technology Based Production Special Project Area
5. Cendere Valley Rehabilitation Special Project Area 6. Cebeci Valley Rehabilitation Special Project Area
Economic Development (22 areas)
- Transformation from industry to service (10 project areas)
7. Media Express Way High Level Center Special Project Area
8. Kagithane Center And Boulevard Connection Special Project Area
9. Bayrampasa – Topkapi – Maltepe CBD Expansion Special Project Area
10. Kartal High Level Center Special Project Area 11. Tuzla Specialized Center Special Project Area 12. Pendik Secondary Center Special Project Area 13. Maltepe Dragos Center Special Project Area 14. Gaziosmanpasa Center Special Project Area 15. Gurpinar Center Special Project Area 16. Selimpasa Center Special Project Area
- Transformation from port and train station to center (1)
17. Harem Haydarpasa Primary Center Special Project Area
- New center development areas (4) 18. Silivri High Level Center Special Project Area 19. Esenyurt Primary Center Special Project Area 20. Ispartakule Secondary Center Special Project Area 21. Basaksehir Secondary Center Special Project Area
- Existing center rehabilitation (1) 22. Buyukdere CBD Rehabilitation Special Project Area
- Port and logistic development (3) 23. Ambarli Port Special Project Area 24. Gumusyaka Logistic Center & Port Special Project
Area 25. Hadimkoy Logistics Center Special Project Area
- Techno parks and university development (3)
26. Degirmenkoy Technology Development Park Special Project Area
27. Canta University Special Project Area 28. Armutlu University Special Project Area
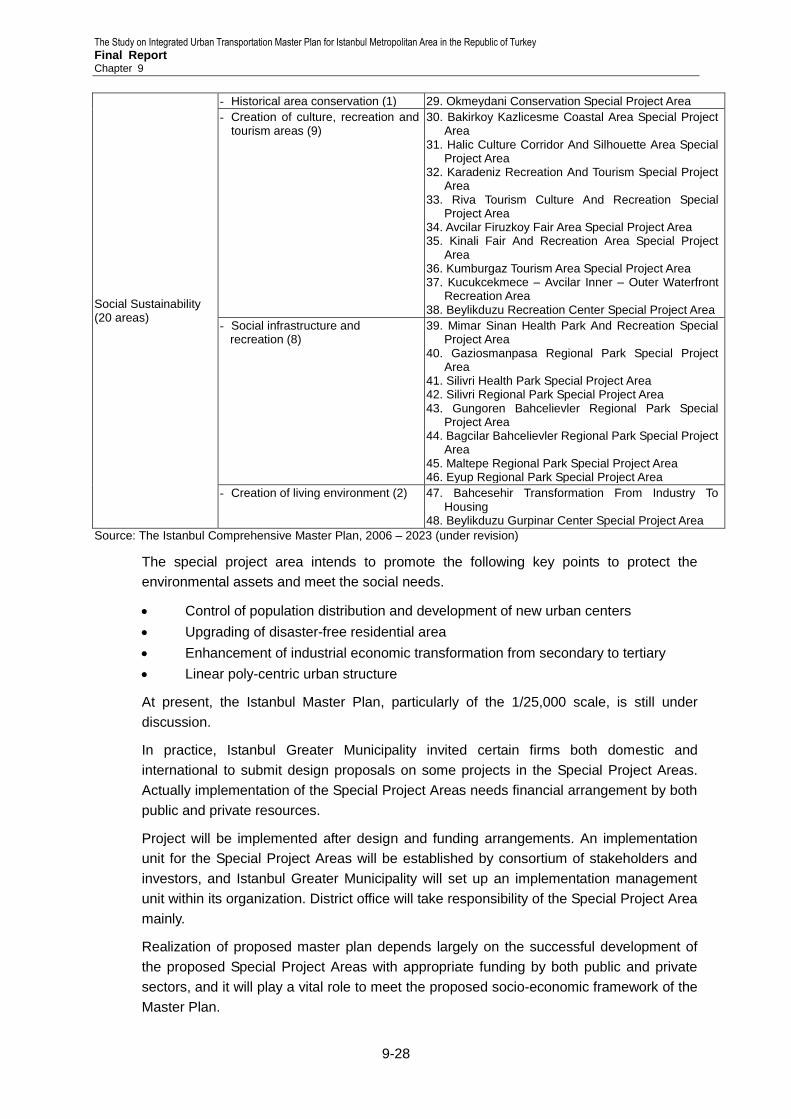
The Study on Integrated Urban Transportation Master Plan for Istanbul Metropolitan Area in the Republic of Turkey Final Report Chapter 9
9-28
Social Sustainability (20 areas)
- Historical area conservation (1) 29. Okmeydani Conservation Special Project Area
- Creation of culture, recreation and tourism areas (9)
30. Bakirkoy Kazlicesme Coastal Area Special Project Area
31. Halic Culture Corridor And Silhouette Area Special Project Area
32. Karadeniz Recreation And Tourism Special Project Area
33. Riva Tourism Culture And Recreation Special Project Area
34. Avcilar Firuzkoy Fair Area Special Project Area 35. Kinali Fair And Recreation Area Special Project
Area 36. Kumburgaz Tourism Area Special Project Area 37. Kucukcekmece – Avcilar Inner – Outer Waterfront
Recreation Area 38. Beylikduzu Recreation Center Special Project Area
- Social infrastructure and recreation (8)
39. Mimar Sinan Health Park And Recreation Special Project Area
40. Gaziosmanpasa Regional Park Special Project Area
41. Silivri Health Park Special Project Area 42. Silivri Regional Park Special Project Area 43. Gungoren Bahcelievler Regional Park Special
Project Area 44. Bagcilar Bahcelievler Regional Park Special Project
Area 45. Maltepe Regional Park Special Project Area 46. Eyup Regional Park Special Project Area
- Creation of living environment (2) 47. Bahcesehir Transformation From Industry To Housing
48. Beylikduzu Gurpinar Center Special Project Area
Source: The Istanbul Comprehensive Master Plan, 2006 – 2023 (under revision)
The special project area intends to promote the following key points to protect the
environmental assets and meet the social needs.
Control of population distribution and development of new urban centers
Upgrading of disaster-free residential area
Enhancement of industrial economic transformation from secondary to tertiary
Linear poly-centric urban structure
At present, the Istanbul Master Plan, particularly of the 1/25,000 scale, is still under
discussion.
In practice, Istanbul Greater Municipality invited certain firms both domestic and
international to submit design proposals on some projects in the Special Project Areas.
Actually implementation of the Special Project Areas needs financial arrangement by both
public and private resources.
Project will be implemented after design and funding arrangements. An implementation
unit for the Special Project Areas will be established by consortium of stakeholders and
investors, and Istanbul Greater Municipality will set up an implementation management
unit within its organization. District office will take responsibility of the Special Project Area
mainly.
Realization of proposed master plan depends largely on the successful development of
the proposed Special Project Areas with appropriate funding by both public and private
sectors, and it will play a vital role to meet the proposed socio-economic framework of the
Master Plan.
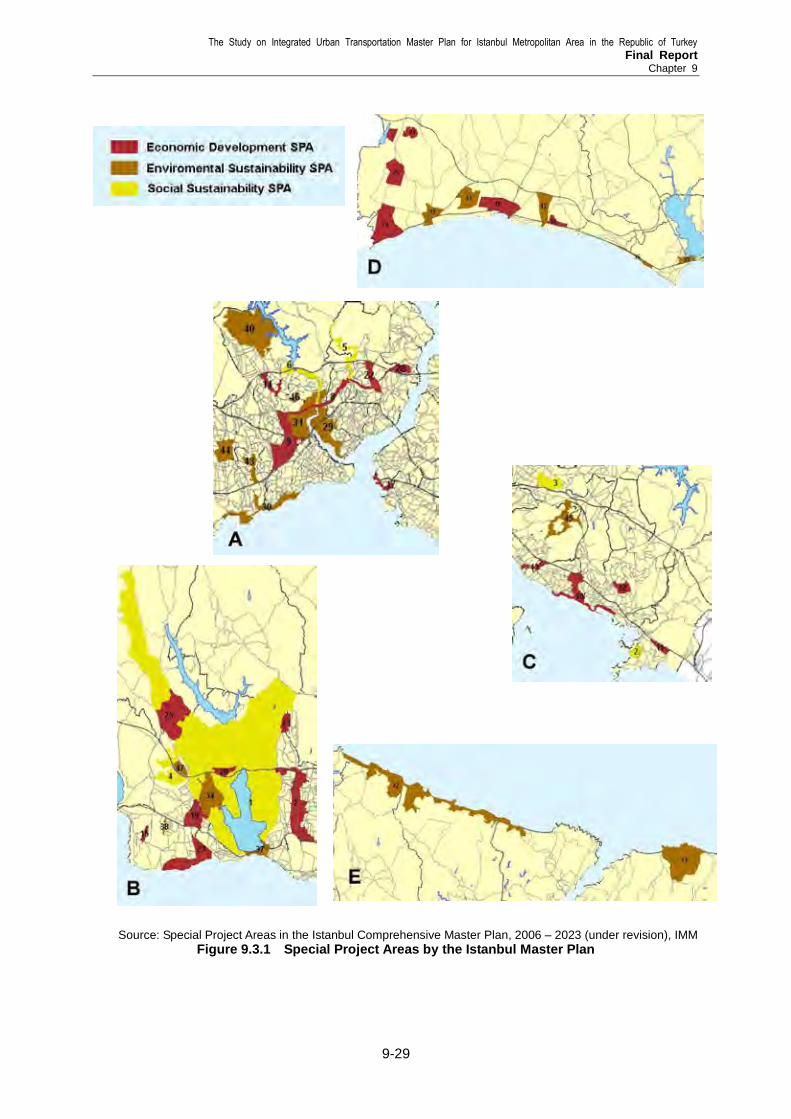
The Study on Integrated Urban Transportation Master Plan for Istanbul Metropolitan Area in the Republic of Turkey Final Report
Chapter 9
9-29
Source: Special Project Areas in the Istanbul Comprehensive Master Plan, 2006 – 2023 (under revision), IMM
Figure 9.3.1 Special Project Areas by the Istanbul Master Plan

The Study on Integrated Urban Transportation Master Plan for Istanbul Metropolitan Area in the Republic of Turkey Final Report
Chapter 10
10-1
Chapter 10 Transportation Demand Forecast
10.1 Travel Demand Model
10.1.1 Model Structure and Procedure
After completing the person trip survey and the analysis of the present traffic data, the
Study Team has developed a demand forecast model following commonly known
“Four-Step Method" using TransCAD and JICA STRADA. The four-steps are predictions
of (1) zone-wise trip production and attraction by purpose, (2) trips between origin zone to
destination zone by purpose, (3) zone-to-zone trips by transport mode and (4) traffic
volume on each link of a transport network.
The flowchart in Source: ibid.
Figure 10.1.1 shows the process taken for demand forecast. The model was prepared
separately by category such as motorized or non-motorized households, trip purposes
and transport modes corresponding to each step, as shown in Table 10.1.1. This is
because the number of daily trips for motorized household members is considerably
higher than the non-motorized households, and the analysis of travel demand structure by
person trip has revealed that trip conditions differ by trip purpose and by transport mode.
Trip purpose is classified into home-based work (HBW), home-based school (HBS),
home-based others (HBO) and non-home based (NHB). Note that the trips by zone
include trips from/to home in the zone and trips with non-home trip end in the zone. In
contrast, trips going back home are classified as “To home” purpose in Japan. For
example, “To work” purpose excludes “return to home” trips in Japan. In this Study,
however, the Study Team decided to follow the Turkish (or international) way of trip
classification.
The classifications of household car ownership, trip purpose and transport mode are
shown below.
1) Classification of Household Car Ownership
a) Motorized Household: Household owning at least one vehicle
b) Non-Motorized Household: Household owning no vehicle
2) Trip Purposes
a) Home Based Work (HBW)
b) Home Based School (HBS)
c) Home Based Others (HBO)
d) Non Home Based (NHB)
3) Transport Modes
a) Walking
b) Car: Car, taxi and motorcycle
c) Service: Company bus for employees and school bus
d) Public: Shared taxi (Dolmus), mini bus, public bus, metro, tramway, tunnel,
ferry boat, sea bus, and sub-urban railway

The Study on Integrated Urban Transportation Master Plan for Istanbul Metropolitan Area in the Republic of Turkey Final Report Chapter 10
10-2
Table 10.1.1 Model Structure
Step By Household car ownership
By Trip Purpose By Mode
1) Trip Generation and Attraction Model - v -
2) Trip Distribution Model - v -
3) Modal Split Model - v v
4) Traffic Assignment (including transit assignment)
- - v
Source: Study Team
Source: ibid.
Figure 10.1.1 Procedure for Transport Demand Forecast
Transport Project Data
(1) Survey and Analysis
Person Trip Survey
Characteristics of Existing Person Trips
Analysis of Travel Demand Structure
(3) Socioeconomic Framework
Future Land Use Plan and Socioeconomic Data in 2023
Trip Production Rate of Motorized and Non-Motorized Households
Zonal Socioeconomic Data
(2) Travel Demand Model
Trip Production and Attraction Model
Modal Split Model
Trip Distribution Model
Traffic and Transit Assignment Models
(4) Input and Output Data
Trip Production and Attraction by Zone
Number of Motorized and Non-Motorized Households
Person Trip Distribution by Purpose
Trip Distribution by Mode
Public Transport and Road Networks
Vehicle and Passenger Volumes on Transport Network
Number of Vehicles Owned in 2023
(Population, Employment and Number of Student
Future Road and Transport Plans
(5) Future Road and
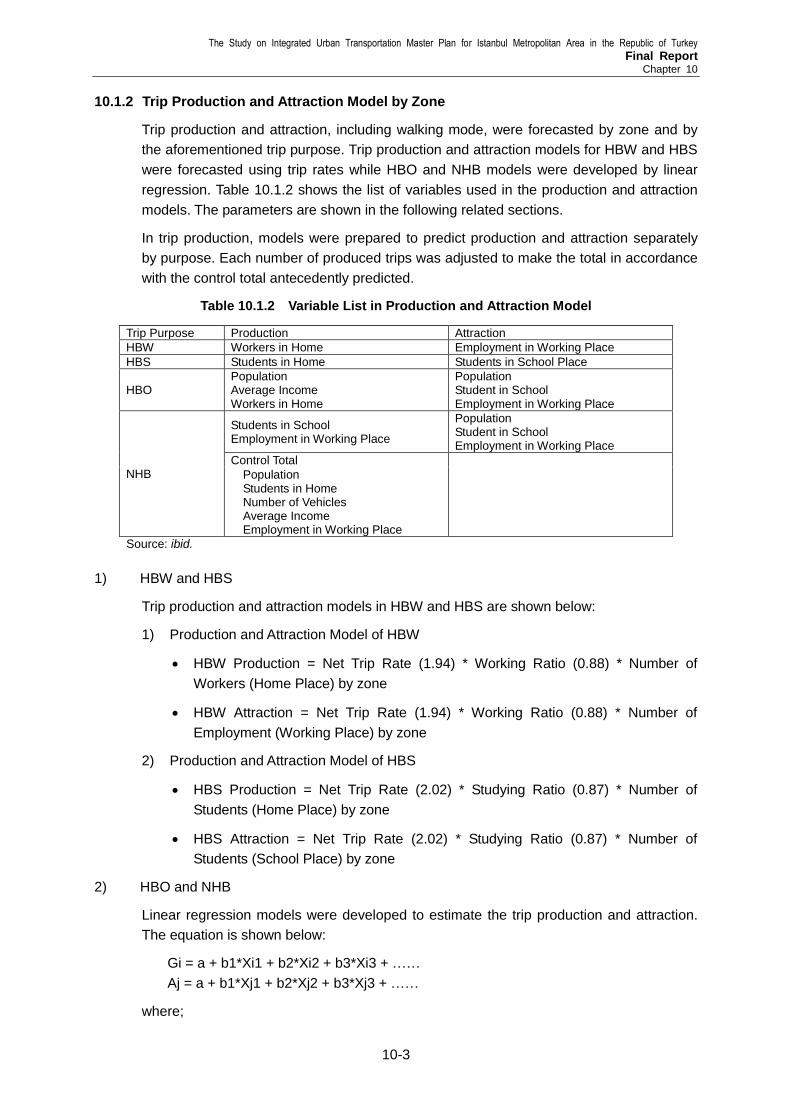
The Study on Integrated Urban Transportation Master Plan for Istanbul Metropolitan Area in the Republic of Turkey Final Report
Chapter 10
10-3
10.1.2 Trip Production and Attraction Model by Zone
Trip production and attraction, including walking mode, were forecasted by zone and by
the aforementioned trip purpose. Trip production and attraction models for HBW and HBS
were forecasted using trip rates while HBO and NHB models were developed by linear
regression. Table 10.1.2 shows the list of variables used in the production and attraction
models. The parameters are shown in the following related sections.
In trip production, models were prepared to predict production and attraction separately
by purpose. Each number of produced trips was adjusted to make the total in accordance
with the control total antecedently predicted.
Table 10.1.2 Variable List in Production and Attraction Model
Trip Purpose Production Attraction
HBW Workers in Home Employment in Working Place
HBS Students in Home Students in School Place
HBO Population Average Income Workers in Home
Population Student in School Employment in Working Place
NHB
Students in School Employment in Working Place
Population Student in School Employment in Working Place
Control Total
Population Students in Home Number of Vehicles Average Income Employment in Working Place
Source: ibid.
1) HBW and HBS
Trip production and attraction models in HBW and HBS are shown below:
1) Production and Attraction Model of HBW
HBW Production = Net Trip Rate (1.94) * Working Ratio (0.88) * Number of
Workers (Home Place) by zone
HBW Attraction = Net Trip Rate (1.94) * Working Ratio (0.88) * Number of
Employment (Working Place) by zone
2) Production and Attraction Model of HBS
HBS Production = Net Trip Rate (2.02) * Studying Ratio (0.87) * Number of
Students (Home Place) by zone
HBS Attraction = Net Trip Rate (2.02) * Studying Ratio (0.87) * Number of
Students (School Place) by zone
2) HBO and NHB
Linear regression models were developed to estimate the trip production and attraction.
The equation is shown below:
Gi = a + b1*Xi1 + b2*Xi2 + b3*Xi3 + ……
Aj = a + b1*Xj1 + b2*Xj2 + b3*Xj3 + ……
where;
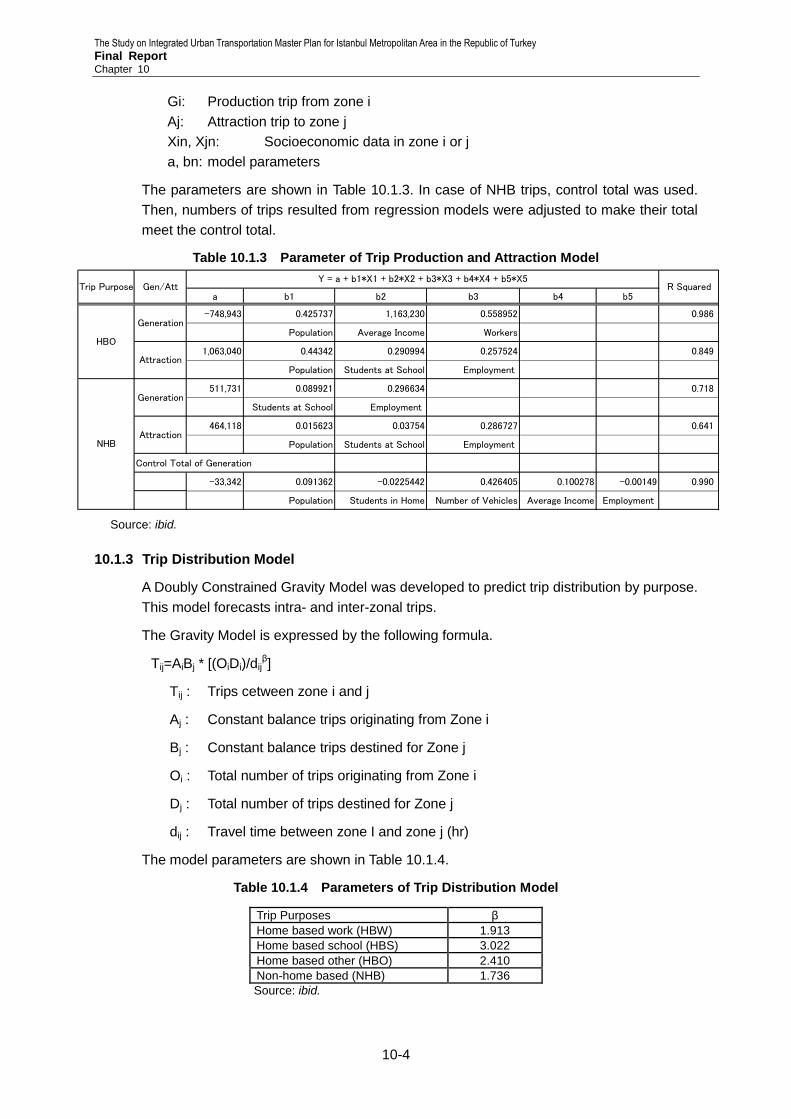
The Study on Integrated Urban Transportation Master Plan for Istanbul Metropolitan Area in the Republic of Turkey Final Report Chapter 10
10-4
Gi: Production trip from zone i
Aj: Attraction trip to zone j
Xin, Xjn: Socioeconomic data in zone i or j
a, bn: model parameters
The parameters are shown in Table 10.1.3. In case of NHB trips, control total was used.
Then, numbers of trips resulted from regression models were adjusted to make their total
meet the control total.
Table 10.1.3 Parameter of Trip Production and Attraction Model
Source: ibid.
10.1.3 Trip Distribution Model
A Doubly Constrained Gravity Model was developed to predict trip distribution by purpose.
This model forecasts intra- and inter-zonal trips.
The Gravity Model is expressed by the following formula.
Tij=AiBj * [(OiDi)/dijβ]
Tij : Trips cetween zone i and j
Aj : Constant balance trips originating from Zone i
Bj : Constant balance trips destined for Zone j
Oi : Total number of trips originating from Zone i
Dj : Total number of trips destined for Zone j
dij : Travel time between zone I and zone j (hr)
The model parameters are shown in Table 10.1.4.
Table 10.1.4 Parameters of Trip Distribution Model
Trip Purposes β
Home based work (HBW) 1.913
Home based school (HBS) 3.022
Home based other (HBO) 2.410
Non-home based (NHB) 1.736
Source: ibid.
a b1 b2 b3 b4 b5
-748,943 0.425737 1,163,230 0.558952 0.986
Population Average Income Workers
1,063,040 0.44342 0.290994 0.257524 0.849
Population Students at School Employment
511,731 0.089921 0.296634 0.718
Students at School Employment
464,118 0.015623 0.03754 0.286727 0.641
Population Students at School Employment
Control Total of Generation
-33,342 0.091362 -0.0225442 0.426405 0.100278 -0.00149 0.990
Population Students in Home Number of Vehicles Average Income Employment
Trip PurposeY = a + b1*X1 + b2*X2 + b3*X3 + b4*X4 + b5*X5
Gen/Att R Squared
Generation
Attraction
Generation
Attraction
HBO
NHB

The Study on Integrated Urban Transportation Master Plan for Istanbul Metropolitan Area in the Republic of Turkey Final Report
Chapter 10
10-5
Modal Share (HBS Input Data)
92.4%
39.1% 24.0% 30.9%
0% 20% 40% 60% 80% 100%
Intra-Zone Trip
Inter-Zone Trip
Modal Share
walk car service transit
Modal Share (HBO Input Data)
92.7%
28.9% 27.4% 43.7%
0% 20% 40% 60% 80% 100%
Intra-Zone Trip
Inter-Zone Trip
Modai Share
walk car transit
10.1.4 Modal Split Model
1) Present Characteristics of Modal Choice
The modal choice between walking, car, service and public transport was forecasted after
estimating the P-A matrix by trip purpose using a multi-nominal logit model. In the modal
split model, transport modes were aggregated into 4 modes: walking, car, service, and
public transport which includes all kinds of buses, rail transit and ferry/sea-bus.
Before developing the modal split model, present characteristics in modal choices were
analyzed. Figure 10.1.3 and Figure 10.1.4 show observed modal shares for inter-zonal
and intra-zonal trips. In both figures, share of walking trips is predominant in intra-zone
trips exceeding 90%, while in the inter-zone trips shares are more evenly distributed
among modes. This suggests that the model should be built for inter- and intra-zone trip
individually.
Source: ibid.
Figure 10.1.2 Observed Modal Share for Inter- and Intra-Zone Trips in HBS and HBO
Source: ibid.
Figure 10.1.3 Observed Modal Share for Inter- and Intra-Zone Trips in HBW and NHB
2) Multi-nominal Logit Model
Table 10.1.5 shows the mode coefficient of utility function. The following is a utility
function in the logit model:
Uwalk = β4×ln(distance) +β7×ln(time)
Ucar = β1 +β5×(#car in zone) +β6×(income) +β7×ln(time) +β8×ln(cost)

The Study on Integrated Urban Transportation Master Plan for Istanbul Metropolitan Area in the Republic of Turkey Final Report Chapter 10
10-6
Uservice = β2 +β7×ln(time) +β8×ln(cost)
Utransit = β3 +β7×ln(time) +β8×ln(cost)
Where:
Ui: Utility of mode i: mode option (walking, car, service, public transport)
β1, β2, β3, β4, β5, β6, β7, β8: coefficient of mode
exp (Ui) Pi = Σexp (Uj)
Where:
Pi: probability to choose the mode i
Table 10.1.5 Coefficient of Utility Function
Variables Mode HWB HBS HBO NHB
Parameter t-value Parameter t-value Parameter t-value Parameter t-value
Constant
Walk - - 3.0727 71.1576 2.5849 65.8393 - -
Car -2.3238 -73.7083 - - - - -0.4231 -9.0435
Service -0.792 -47.6597 0.8892 15.6461 - - -2.3242 -41.7576
Public -0.514 -26.5976 2.0237 49.1897 2.0058 55.7112 -0.8527 -14.7288
Distance(km) Walk -0.1447 -35.5083 - - - - -0.1739 -13.744
No. of Car Car 0.0148 7.4743 0.0582 11.3493 0.0362 14.1175 - -
in Zone(000)
Income Car 1.3005 55.658 0.8559 22.9582 1.0137 35.7756 - -
(000YTL/month) Service - - 0.8559 22.9582 - - - -
Time (min.) -0.001 -3.6152 -0.0128 -49.0195 -0.0149 -63.8115 -0.0063 -7.6158
Cost (YTL) -0.0329 -11.7483 -0.0249 -3.2841 -0.0304 -6.5124 -0.0349 -4.5157
Dummy
Bosporus Car -0.1886 -8.0685 -1.5672 -17.8023 -0.0499 -1.154 0.1242 1.9358
Service -0.1886 -8.0685 - - - - - -
Rail at origin
Public 0.2792 18.6877 0.2382 8.4628 0.2201 11.0071 0.2503 6.6521
Rail at destin.
Public 0.2651 17.5781 0.1934 6.8762 0.1275 6.3068 0.2682 6.9991
Port at origin
Public 0.4911 18.858 0.7259 15.9726 0.5461 18.2421 0.4909 9.1017
Port at destin.
Public 0.4467 17.2155 0.6906 15.2328 0.504 16.4824 0.4038 7.6754
Source: ibid.
Note: HBS and HBO are only applied to inter-zonal trip while HBW and NHB are applied to all trips such as intra- and inter-zonal trips.
10.1.5 Peak OD Table
Road and railways are planned based on the travel demand in peak hours. Transit
operational and physical parameters such as service frequency, fleet size and bus stops/
railway station facilities are also determined based on the peak hour demand. On the
other hand, daily demand will be used for economic evaluation.
By the modal split model, the daily Production and Attraction (P-A) matrix by mode was
predicted. In the P-A matrix, trip production in a zone includes the home-end of home
based trips and the origin end of non-home-based trips. Since the assignment algorithms
require origins and destinations as inputs, production and attraction were converted into
OD matrices. The conversion of P-A matrix to OD table and time of day transformation
were done in following steps. These steps were processed through TransCAD.
Convert productions and attractions to origins and destinations.
Decompose 24-hour trip matrix into peak hour trip table using peak hour ratio.

The Study on Integrated Urban Transportation Master Plan for Istanbul Metropolitan Area in the Republic of Turkey Final Report
Chapter 10
10-7
Convert person trips to vehicle trips
Translating productions and attractions into origins and destinations is based on the
information when trips depart and return. Then, decomposition to the peak hour trip table
from 24-hour trip table is done based on the information about the percentage of flow that
occurs in each hour throughout the day. The peak hour is 7:00 a.m. to 8:00 a.m. in the
morning. Then finally, the peak hour trip table is converted from person trips to vehicle
trips using the PCU values and average occupancy by vehicle type.
In the conversion to hourly trip table, since these percentages typically vary by trip
purpose, the study team prepared the flow percentage data for each trip purpose. Figure
10.1.4. shows the flow percentage data of HBW trips.
Source: ibid.
Figure 10.1.4 Departure and Return Trip Ratio of HBW Trips
10.1.6 Traffic Assignment Model
1) Average Occupancy and Passenger Car Unit (PCU)
The person base trip OD tables (trips/person) by mode have to be modified into vehicle
base in terms of passenger car unit (trip/PCU). These OD tables were firstly modified into
vehicle base by dividing by the average number of passengers (occupancy) and then,
multiplied by PCU factor determined by vehicle type. The average occupancy and PCU
factor used for the conversion are shown in Table 10.1.6. The average occupancy of bus
was estimated from the counting data on the screen lines. For car and “service” the
occupancy data was obtained from IMM.
Table 10.1.6 Average Occupancy and PCU
Vehicle Type Average Occupancy PCU Factor
Car 1.57 1.0 Service 10.00 2.0 Bus 30.40 3.0
Source: ibid. Note: Public Transport occupancy was estimated from counting
data on the screen lines. That of car and service was from IMM.
0
2
4
6
8
10
12
14
16
18
20
0 1 2 3 4 5 6 7 8 9 10 11 12 13 14 15 16 17 18 19 20 21 22 23 Time
Com
posi
tion R
atio
(%)
Departure Trip Ratio Reture Trip Ratio
The Study on Integrated Urban Transportation Master Plan for Istanbul Metropolitan Area in the Republic of Turkey Final Report Chapter 10
10-8
2) Traffic Assignment Model
The last step in the four-step method is the assignment of the predicted modal flows of
each origin-destination pair to actual routes on the transport network. In this study, the
traffic assignment model has two systems. For the private mode such as cars and service
vehicles on roads, traffic assignment was done by loading traffic volume on roads
composing minimum impedance routes. The travel speed of vehicles is controlled by the
speed-flow relationship. Hence, speed of vehicle is determined according to the
speed-flow curves which are determined by road section according to road characteristics
such as number of lanes, and land-use conditions.
On the other hand, Minimum-impedance route for public mode was searched on public
transport network taking into account the waiting and transfer time at stops and stations,
and public transport passengers are assigned on the network along the selected route.
The minimum-impedance route is determined in terms of generalized cost including travel
time, waiting time, transfer time, and fare. The transport capacity of each route is also
taken into account.
For a long-term demand forecast, the same way as for private mode was adopted also to
assignment of bus mode because bus routes were flexibly changed according to demand
change.
10.2 Estimate of Future Vehicle Ownership
10.2.1 Zonal Vehicle Ownership
There is a close relationship between vehicle ownership and household income by traffic
zone as shown by the analysis of the Person Trip Survey data. This relationship was used
for the estimate of the number of motorized households, i.e., vehicle-owning households
by zone. Future distribution of household income in Istanbul is presented in Figure 10.2.1.
The number of multi-vehicle owning households was estimated together with that of
one-vehicle owning household by using the relationship between car ownership and
household income.
Since household income is assumed to grow in parallel to GDP per capita, the future
number of vehicles was estimated based on the relationship between vehicle ownership
and GDP per capita as follows:
To estimate zonal vehicle ownership (vehicles/1000 person)
To estimate number of vehicles by zone by multiplying population by vehicle
ownership.
Table 10.2.2 shows vehicle ownership and number of vehicles in 2023. The estimated
number of vehicles in 2023 is approximately 4.19 million, thus, vehicle ownership will be
245 vehicles per 1000 persons. The number of vehicles will increase approximately by
3.14 times for 18 years from 2005.

The Study on Integrated Urban Transportation Master Plan for Istanbul Metropolitan Area in the Republic of Turkey Final Report
Chapter 10
10-9
10.2.2 Motorized and Non-motorized Households
The number of motorized and non-motorized households was estimated in the following
process:
To estimate future income distribution based on future GDP/capita see (Figure
10.2.1).
To estimate percentage of motorized and non-motorized household based on the
future income distribution.
To estimate the number of motorized households adjusting to the estimated
number of vehicles.
The projected number of motorized and non-motorized households is shown in Table
10.2.3. The ratio of motorized households (vehicle base) is 0.67 in 2023, This ratio was
0.33 in 2005. This is a 1.9 times increase. Non-motorized households will be half of the
present. As for private car ownership, the ratio of motorized households is 0.61 in 2003,
while that of non-motorized households is 0.39.
The number of multi-vehicle owing family will remarkably rise by 4.4 times of the present.
Table 10.2.1 Future Framework in Istanbul
Items 2005 2023 2023/2005 Growth Ratio
/annum
Population in Istanbul 11,608,349 16,000,000 1.378 0.0180
GDP 2.490 0.0520
GDP/capita (YTL) 5,482 9,681 1.766 0.0321
Household Income/month (YTL) 1,144 2,020 1.766 0.0321
Source: Transportation of Planning Dept., IMM
Source: ibid.
Figure 10.2.1 Distribution of Households by Income Rank in 2005 and 2023
0.000
0.050
0.100
0.150
0.200
0.250
0.300
250 500 750 1000 1250 1500 1750 2000 2250 2500 3500 4999 7499 9999
Income Ranks
Com
posi
tion
2023, 5.2% GDP/capita
2005

The Study on Integrated Urban Transportation Master Plan for Istanbul Metropolitan Area in the Republic of Turkey Final Report Chapter 10
10-10
Table 10.2.2 Estimated Vehicle Ownership and Number of Vehicles in 2023 in Study Area
2005 2023 2023/2005
No. of Vehciles/1000 persons 111.1 244.9 2.20
No. of Vehicles 1,334,630 4,194,569 3.14
Source : ibid.
Table 10.2.3 Motorization of the Study Area in 2005 and 2023
2005 2023 2023/2005
vehicle vehicle Private car vehicle
Non-Motorized 64.8% 33% 39.4% 0.51
Motorized (1-car) 31.1% 49% 46.8% 1.57
Motorized (2-cars or more)
4.1% 18% 13.9% 4.44
Motorized Households
35.2% 67% 60.6% 1.91
Source : ibid.
10.3 Projection of Travel Demand
10.3.1 Total Number of Trips
Table 10.3.1 shows the future travel demand in 2023. The total number of trips per day in
the study area in 2023 is approximately 30.82 million. The trip increase ratio from 2005 to
2023 is approximately 1.47, higher than the population growth ratio 0f 1.43. The trip
production rate in terms of number of trips per person per day rises from 1.74 to 1.80.
This indicates that by 2023, the increased share of motorized household contributes to
the increase of the production rate. Summary of socio-economic framework and travel
demand is shown in Table 10.3.2.
Table 10.3.1 Travel Demand in 2023 in Study Area
Year Total Non-Motorized Motorized Household Note
2005
Population *) 12,007,045 7,624,222 4,382,823
Composition Ratio 1.00 0.63 0.37
Trips 20,924,052 13,182,153 7,741,899
Trips/person 1.74 1.68 1.86
2023
Population *) 17,130,000 5,652,900 11,477,100
Composition Ratio 1.00 0.33 0.67 Vehicle Owned
Households
Trips 30,699,116 11,120,708 22,578,408
Trips/person 1.80 1.68 1.86
2023/2005 Trips 1.47 0.74 2.62
Note: *) Population in Gebze is included Source : ibid.
Table 10.3.2 Summary of Socioeconomic Indices and Travel Demand in Study Area
Items 2005 2023 2023/2005
Population in Study Area 12,007,045 17,130,000 1.43
GRDP/capita 5,482 9,681 1.77
Number of Trips by All Modes (Numbers) 20,924,052 30,699,116 1.47
Number of Vehicles Owned by Households (Vehicle) 1,334,630 4,194,569 3.14
Vehicle Ownership (/1000) 111.1 244.9 2.20
Trip Production Rate / pop (trip/day)(All Mode) 1.74 1.80 1.03
Source : ibid.

The Study on Integrated Urban Transportation Master Plan for Istanbul Metropolitan Area in the Republic of Turkey Final Report
Chapter 10
10-11
10.3.2 Trip Production and Attraction
1) Socio-economic Framework by Zone
Source : ibid.
Figure 10.3.1 through Source : ibid.
Figure 10.3.3 show the population, employment and number of students in 2005 and
2023 by the integrated zone system. The employment and number of students were
projected in both daytime and nighttime basis. Population growth ratio is high for zone
nos. 19 (Buyukcekmece), 28 (Kucukcekmece) and 30 (Silivri) in the suburban areas in the
European side, and no. 33 (Gebze) in the Asian sides. The growth of employment and
number of students show similar tendencies to that for population.
On the other hand, existing urban areas show low growth. These socioeconomic indices
by zone are in accordance with the future land use plan. The growth ratio in the central
urban area is controlled, while suburban areas in the Asian and European sides are
prepared for receiving new residents.
Source : ibid.
Figure 10.3.1 Population by Zone in 2005 and 2023

The Study on Integrated Urban Transportation Master Plan for Istanbul Metropolitan Area in the Republic of Turkey Final Report Chapter 10
10-12
Source : ibid.
Figure 10.3.2 Night and Daytime Employment by Zone in 2005 and 2023
Source : ibid.
Figure 10.3.3 Number of Night and Daytime Students by Zone in 2005 and 2023
The Study on Integrated Urban Transportation Master Plan for Istanbul Metropolitan Area in the Republic of Turkey Final Report
Chapter 10
10-13
2) Trip Production and Attraction
The trip production and attraction in the years 2005 and 2023, according to the integrated
zone system are shown in Table 10.3.3. and Figure 10.3.4 are for all purposes. Trip
production and attraction in zone no. 19 (Buyukcekmece), no. 28 (Kucukcekmece) and no.
30 (Silivri) have larger volume of trips. The increase ratios in these zones are higher than
the others. Their ratios are 2.88, 2.01 and 14.2 times, respectively. In 2023, transport
demand will concentrate in these zones.
Trip production and attraction by purpose in the years 2005 and 2023 according to the
integrated zone system are shown in Figure 10.3.5 through Figure 10.3.8. The tendencies
of the volume and growth ratio by 2023 are similar to those for all purposes, exclusive of
NHB.

The Study on Integrated Urban Transportation Master Plan for Istanbul Metropolitan Area in the Republic of Turkey Final Report Chapter 10
10-14
Table 10.3.3 Daily Trip Production and Attraction by Integrated Zone in 2005 and 2023
SqProduction Attraction Production Attraction Production Attraction Production Attraction Production Attraction
1 8,705 9,495 6,076 2,324 22,699 19,639 3,811 1,260 41,319 32,7582 120,099 84,982 89,776 72,954 182,625 168,638 37,296 40,360 430,979 368,1983 365,378 407,268 213,152 216,566 518,886 600,700 164,231 194,450 1,262,248 1,419,6304 272,528 211,201 179,448 176,123 279,795 264,154 50,673 52,166 783,395 704,6255 226,713 131,774 153,115 138,027 286,259 270,847 57,981 68,906 724,358 610,0506 275,061 191,691 193,456 168,401 276,242 276,515 44,007 52,229 789,988 689,9917 114,624 55,054 104,230 96,068 149,636 142,766 15,088 18,950 383,793 313,1468 13,857 17,733 13,675 9,947 26,368 27,410 7,480 7,850 62,510 63,6649 70,519 135,737 51,979 64,719 69,997 61,889 21,412 17,732 214,358 280,509
10 464,614 377,514 313,463 267,683 451,255 414,844 85,308 99,507 1,315,517 1,160,51111 349,665 248,005 235,237 230,337 453,037 440,804 109,695 122,825 1,149,370 1,043,61412 173,810 121,031 104,105 113,617 181,200 164,304 30,455 32,480 489,719 431,67713 395,667 336,738 276,823 239,750 357,081 332,143 59,389 69,649 1,089,254 978,72314 332,185 256,195 220,450 220,195 254,780 222,014 46,973 53,532 854,590 752,17615 109,920 187,907 62,406 85,099 187,733 302,730 73,066 74,534 433,688 650,66816 140,108 203,060 93,424 95,784 199,298 215,833 45,536 48,933 478,516 563,76517 110,181 246,269 56,216 128,629 147,008 177,578 82,521 72,124 397,015 625,56018 118,803 218,497 86,241 80,276 204,553 215,081 96,494 70,820 507,450 585,88619 342,093 361,145 209,456 204,182 278,660 261,300 61,480 67,272 892,608 895,02220 42,238 90,676 31,465 24,225 42,998 45,256 15,038 14,332 133,034 175,45621 26,225 295,830 13,089 73,183 126,938 153,642 168,493 64,883 335,118 587,90822 252,504 133,621 171,671 150,942 241,177 192,810 26,232 33,360 691,939 511,07523 141,990 124,654 95,927 100,661 212,065 207,666 34,253 40,018 484,655 473,56924 193,429 197,398 133,753 142,403 267,399 337,465 84,773 65,901 681,267 745,16925 529,364 326,238 352,422 303,807 674,507 623,619 71,946 87,337 1,628,537 1,341,47626 177,493 196,911 111,129 86,975 149,609 128,275 34,788 37,122 473,240 449,48127 221,777 186,626 136,305 121,056 217,424 175,468 33,358 38,622 609,425 522,48528 402,914 396,403 256,815 250,528 368,358 321,078 64,796 70,626 1,093,168 1,039,00729 162,840 92,677 104,566 113,500 203,179 173,038 31,832 35,803 503,613 416,66130 65,496 66,923 42,910 37,669 69,303 70,568 14,494 15,083 193,435 191,32131 172,343 445,206 98,777 164,593 218,062 331,583 125,212 117,351 615,547 1,059,47232 162,064 236,257 93,955 89,415 216,911 192,838 48,907 53,365 522,059 571,97133 197,348 161,839 159,440 195,314 258,530 261,077 42,815 50,451 658,339 668,827
Total 6,752,555 6,752,555 4,464,952 4,464,952 7,793,572 7,793,572 1,889,833 1,889,833 20,924,051 20,924,051
SqProduction Attraction Production Attraction Production Attraction Production Attraction Production Attraction
1 34,860 532 24,128 3,597 40,719 28,438 832 1,625 100,565 34,2522 88,658 104,090 65,418 16,942 115,110 114,469 30,652 31,541 300,785 267,9363 577,100 458,821 341,320 321,695 564,445 524,477 110,220 111,887 1,593,477 1,417,4304 477,703 683,090 302,345 256,130 478,802 505,782 147,611 148,810 1,407,164 1,594,4885 355,602 273,917 227,108 213,324 354,996 342,342 66,851 68,072 1,004,816 898,0476 675,839 333,822 429,747 342,438 665,496 605,523 88,394 93,230 1,860,249 1,375,8407 113,214 24,382 84,103 99,940 123,867 119,650 12,445 12,493 333,888 256,7398 32,003 128,872 28,327 7,108 43,803 65,574 29,788 29,743 134,715 231,6439 242,180 1,023,556 168,112 122,536 253,973 377,635 197,307 196,577 861,910 1,720,546
10 595,299 404,241 370,177 373,692 586,798 562,230 105,585 106,801 1,658,518 1,448,01411 455,753 207,939 274,238 203,644 477,169 402,479 63,613 66,674 1,272,149 882,23512 197,745 170,262 114,810 183,082 185,028 190,930 43,650 41,893 541,284 586,18913 415,536 441,518 269,737 541,900 416,775 472,708 115,177 107,678 1,217,388 1,563,88714 334,542 299,226 205,401 441,728 325,668 358,446 82,198 75,758 947,875 1,175,26815 144,873 404,390 82,336 55,924 160,419 177,265 82,819 82,491 470,986 720,49916 186,394 289,895 120,056 109,448 193,791 206,526 63,242 63,330 563,617 669,20517 160,933 154,149 87,336 37,348 212,039 149,937 40,959 41,691 501,944 384,36318 130,908 201,298 84,284 22,775 159,369 156,125 50,700 51,589 426,608 432,84519 1,154,028 973,359 692,116 606,399 1,094,768 1,042,554 220,255 225,226 3,161,536 2,847,96420 173,368 431,132 115,025 21,430 180,012 216,097 87,930 89,674 557,231 758,92221 50,318 180,863 28,373 8,570 51,252 71,873 38,395 38,246 168,825 299,84222 252,112 179,361 165,692 208,379 261,731 258,597 49,349 48,581 729,088 695,08823 207,023 187,615 135,135 70,718 221,403 205,878 45,189 47,099 608,952 511,78724 213,820 189,356 140,791 52,224 240,970 228,353 53,105 55,114 650,847 526,90825 498,357 194,811 335,165 582,557 511,712 517,182 74,415 69,007 1,419,758 1,363,71026 133,600 159,489 81,014 110,791 134,952 140,692 38,381 37,447 388,093 448,45727 266,827 275,565 159,634 93,754 272,381 253,195 63,554 65,366 762,773 688,41728 959,968 535,407 648,266 1,327,937 974,014 1,043,041 175,407 159,143 2,757,848 3,065,64529 187,707 123,850 110,596 79,983 217,582 180,380 38,689 39,180 555,495 424,85230 1,165,604 1,094,239 742,565 319,856 1,131,390 1,063,983 225,242 240,403 3,265,513 2,719,19831 283,343 612,346 151,240 87,230 290,483 303,331 127,964 128,276 853,961 1,131,84232 157,077 315,493 97,954 88,755 160,002 181,485 66,204 66,052 481,431 651,94133 618,424 483,832 774,379 645,094 617,844 651,586 125,074 120,499 2,135,826 1,901,116
Total 11,540,718 11,540,718 7,656,928 7,656,928 11,718,763 11,718,763 2,761,196 2,761,196 33,695,115 33,695,115
NHB TotalPresent (2006)
2023HBW HBS HBO NHB Total
HBW HBS HBO
Source : ibid.

The Study on Integrated Urban Transportation Master Plan for Istanbul Metropolitan Area in the Republic of Turkey Final Report
Chapter 10
10-15
Source : ibid.
Figure 10.3.4 Daily Trip Production and Attraction in 2005 and 2023 (All Purposes)
Source : ibid.
Figure 10.3.5 Trip Production and Attraction in 2005 and 2023 (HBW)

The Study on Integrated Urban Transportation Master Plan for Istanbul Metropolitan Area in the Republic of Turkey Final Report Chapter 10
10-16
Source : ibid.
Figure 10.3.6 Trip Production and Attraction in 2005 and 2023 (HBS)
Source : ibid.
Figure 10.3.7 Trip Production and Attraction in 2005 and 2023 (HBO)

The Study on Integrated Urban Transportation Master Plan for Istanbul Metropolitan Area in the Republic of Turkey Final Report
Chapter 10
10-17
Source : ibid.
Figure 10.3.8 Trip Production and Attraction in 2005 and 2023 (NHB)
10.3.3 Trip Distribution
Figure 10.3.9 illustrates the desire lines of trips of all purposes for inter-zonal trips in 2005
and 2023, and the difference between both years. Trip distribution is projected in a
“Do-nothing” case assuming no future projects. Heavy trip flows in 2023 will occur
between the central urban areas and new suburban areas. Compared to the strong desire
lines, seen within the central area in European and Asian sides in 2005, OD trips in 2023
between the central and suburban areas in the fringe of the study area will increase
considerably. The characteristics of these large movements in 2023 are remarkably
different from that of 2005 caused by the planned change of land use pattern.
As to the difference of the desire lines between 2005 and 2023, the high increase area is
located in suburban areas in the fringe of the study area. Figure 10.3.10 also shows the
difference for the HBW trip desire line between 2005 and 2023 as well as the major trip
directions shown with the red arrow. The major movements in the new suburban areas
show both inbound and outbound directions.
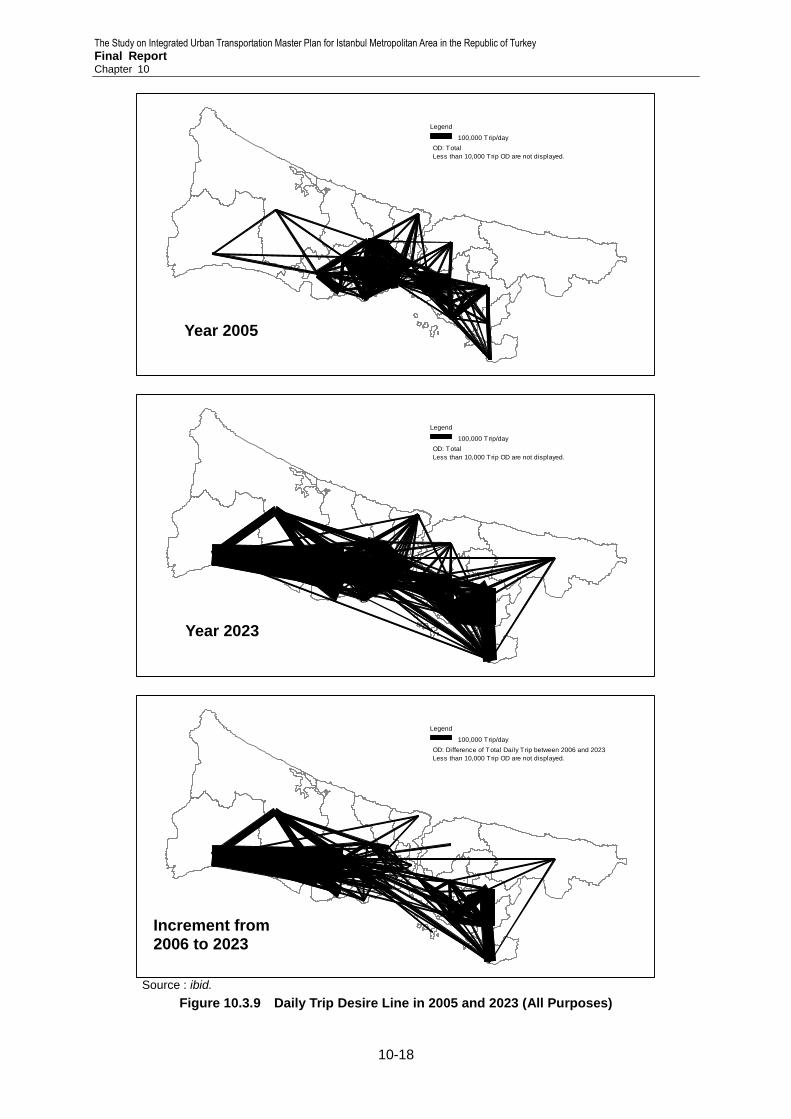
The Study on Integrated Urban Transportation Master Plan for Istanbul Metropolitan Area in the Republic of Turkey Final Report Chapter 10
10-18
100,000 Trip/day100,000 Trip/day100,000 Trip/day100,000 Trip/day100,000 Trip/day100,000 Trip/day100,000 Trip/day100,000 Trip/day100,000 Trip/day
LegendLegendLegendLegendLegendLegendLegendLegendLegend
OD: TotalOD: TotalOD: TotalOD: TotalOD: TotalOD: TotalOD: TotalOD: TotalOD: TotalLess than 10,000 Trip OD are not displayed.Less than 10,000 Trip OD are not displayed.Less than 10,000 Trip OD are not displayed.Less than 10,000 Trip OD are not displayed.Less than 10,000 Trip OD are not displayed.Less than 10,000 Trip OD are not displayed.Less than 10,000 Trip OD are not displayed.Less than 10,000 Trip OD are not displayed.Less than 10,000 Trip OD are not displayed.
200620062006200620062006200620062006
100,000 Trip/day100,000 Trip/day100,000 Trip/day100,000 Trip/day100,000 Trip/day100,000 Trip/day100,000 Trip/day100,000 Trip/day100,000 Trip/day
LegendLegendLegendLegendLegendLegendLegendLegendLegend
OD: TotalOD: TotalOD: TotalOD: TotalOD: TotalOD: TotalOD: TotalOD: TotalOD: TotalLess than 10,000 Trip OD are not displayed.Less than 10,000 Trip OD are not displayed.Less than 10,000 Trip OD are not displayed.Less than 10,000 Trip OD are not displayed.Less than 10,000 Trip OD are not displayed.Less than 10,000 Trip OD are not displayed.Less than 10,000 Trip OD are not displayed.Less than 10,000 Trip OD are not displayed.Less than 10,000 Trip OD are not displayed.
202320232023202320232023202320232023
100,000 Trip/day100,000 Trip/day100,000 Trip/day100,000 Trip/day100,000 Trip/day100,000 Trip/day100,000 Trip/day100,000 Trip/day100,000 Trip/day
LegendLegendLegendLegendLegendLegendLegendLegendLegend
OD: Difference of Total Daily Trip between 2006 and 2023OD: Difference of Total Daily Trip between 2006 and 2023OD: Difference of Total Daily Trip between 2006 and 2023OD: Difference of Total Daily Trip between 2006 and 2023OD: Difference of Total Daily Trip between 2006 and 2023OD: Difference of Total Daily Trip between 2006 and 2023OD: Difference of Total Daily Trip between 2006 and 2023OD: Difference of Total Daily Trip between 2006 and 2023OD: Difference of Total Daily Trip between 2006 and 2023Less than 10,000 Trip OD are not displayed.Less than 10,000 Trip OD are not displayed.Less than 10,000 Trip OD are not displayed.Less than 10,000 Trip OD are not displayed.Less than 10,000 Trip OD are not displayed.Less than 10,000 Trip OD are not displayed.Less than 10,000 Trip OD are not displayed.Less than 10,000 Trip OD are not displayed.Less than 10,000 Trip OD are not displayed.
Source : ibid.
Figure 10.3.9 Daily Trip Desire Line in 2005 and 2023 (All Purposes)
Year 2005
Year 2023
Increment from 2006 to 2023

The Study on Integrated Urban Transportation Master Plan for Istanbul Metropolitan Area in the Republic of Turkey Final Report
Chapter 10
10-19
LegendLegendLegendLegendLegendLegendLegendLegendLegend
30,000 Trip/day 30,000 Trip/day 30,000 Trip/day 30,000 Trip/day 30,000 Trip/day 30,000 Trip/day 30,000 Trip/day 30,000 Trip/day 30,000 Trip/day
OD: Difference of HBW Daily Trip between 2006 and 2023OD: Difference of HBW Daily Trip between 2006 and 2023OD: Difference of HBW Daily Trip between 2006 and 2023OD: Difference of HBW Daily Trip between 2006 and 2023OD: Difference of HBW Daily Trip between 2006 and 2023OD: Difference of HBW Daily Trip between 2006 and 2023OD: Difference of HBW Daily Trip between 2006 and 2023OD: Difference of HBW Daily Trip between 2006 and 2023OD: Difference of HBW Daily Trip between 2006 and 2023Less than 10,000 Trip OD are not displayed.Less than 10,000 Trip OD are not displayed.Less than 10,000 Trip OD are not displayed.Less than 10,000 Trip OD are not displayed.Less than 10,000 Trip OD are not displayed.Less than 10,000 Trip OD are not displayed.Less than 10,000 Trip OD are not displayed.Less than 10,000 Trip OD are not displayed.Less than 10,000 Trip OD are not displayed.
Black Band: Dif f erence = 2023 - 2006Black Band: Dif f erence = 2023 - 2006Black Band: Dif f erence = 2023 - 2006Black Band: Dif f erence = 2023 - 2006Black Band: Dif f erence = 2023 - 2006Black Band: Dif f erence = 2023 - 2006Black Band: Dif f erence = 2023 - 2006Black Band: Dif f erence = 2023 - 2006Black Band: Dif f erence = 2023 - 2006
Red Arrow: Direction of major mov ementRed Arrow: Direction of major mov ementRed Arrow: Direction of major mov ementRed Arrow: Direction of major mov ementRed Arrow: Direction of major mov ementRed Arrow: Direction of major mov ementRed Arrow: Direction of major mov ementRed Arrow: Direction of major mov ementRed Arrow: Direction of major mov ement
Note: Not show desire line (trip v olume in 2006Note: Not show desire line (trip v olume in 2006Note: Not show desire line (trip v olume in 2006Note: Not show desire line (trip v olume in 2006Note: Not show desire line (trip v olume in 2006Note: Not show desire line (trip v olume in 2006Note: Not show desire line (trip v olume in 2006Note: Not show desire line (trip v olume in 2006Note: Not show desire line (trip v olume in 2006
is higher than 2023)is higher than 2023)is higher than 2023)is higher than 2023)is higher than 2023)is higher than 2023)is higher than 2023)is higher than 2023)is higher than 2023)
Source : ibid.
Figure 10.3.10 Trip Difference of HBW Desire Line between 2005 and 2023 with Major Trip Direction