chapter 6 transport air pollution in são paulo, brazil ...– the construction of rodoanel (fig....
TRANSCRIPT

CHAPTER 6
Transport air pollution in São Paulo, Brazil: advances in control programs in the last 15 years
H. Ribeiro & J.V. de Assunção Department of Environmental Health, School of Public Health, University of São Paulo, Brazil.
Abstract
São Paulo is one of the largest cities in the world, with 10 million inhabitants in the municipality and 17 million in the metropolitan area. Population growth rate has decreased in the last decades and economic activities are being decentralized to its surrounding areas. Nevertheless the number of vehicles registered in the city has been growing at a much higher rate (4% per year) than population and road network. Total vehicle fleet is 5,497,633. Besides causing increasing problems of traffic safety and flow, transport is responsible for most of the air pollution emissions in the area, nowadays. This chapter describes the main programs implemented in the last years in order to improve traffic and public transport problems, by local government, and to solve air pollution problems, by state government. City programs concentrated mainly in increasing mobility and improving the quality of the buses and vans used in the public transportation system, in order to prevent growth in the use of private cars for daily activities. State action concentrated in air pollution control programs: setting emissions standards, air quality standards and control measures. Investment is also being done in construction of a ring road around the metropolitan area (Rodoanel) and in expansion of the subway lines network. Air emission trends are discussed in view of recent pollution data and air quality trends are analysed for different pollutants: particles, SO2, CO, ozone, VOC and toxic pollutants. Finally, prospects for the future are discussed in view of the conclusion that control measures, technology, cooperation, negotiation and education achieved positive results and are important tools to minimize health hazards and promote good quality of life. Nonetheless, a lot remains to be done in order to attain stricter standards like the European regulations.
www.witpress.com, ISSN 1755-8336 (on-line) WIT Transactions on State of the Art in Science and Engineering, Vol 22, © 2005 WIT Press
doi:10.2495/978-1-85312-799-1/06

108 Advances in City Transport: Case Studies 1 Introduction
São Paulo is one of the largest cities in the world. According to the National Census of 2000, the municipality of São Paulo had 10.4 million and the metropolitan area, which comprises 39 municipalities in a continuous urban sprawl of 1051km2, 17 million. Population growth rate has decreased in the last decades from 3.77%/year in the 1970s to 1.66%/year in the metropolitan area and 0.3% in the municipality in the 1990s.
The economic activity is being decentralized to its surrounding areas up to 100km distance. Nevertheless, the metropolitan area concentrates 6 million jobs, 10% of Brazilian population and 21% of national vehicle fleet.
The number of vehicles on the streets has been growing at a higher rate (4%/year) than population growth due to many factors: aggressive merchandise of the strong car industry located in the area, increase of average family income (925 US dollars in 1967 and 1520 US dollars in 1967) [1], urban sprawl, lack of investment in the public transport infrastructure, the low quality of the rolling stock (buses) and the increase in the queues and congestion on the main transport routes in town. Average time spent daily in commuting traffic is 2.5h.
The extension of the road network of the municipality of São Paulo is 15.6 thousand km and the vehicle fleet 5,497,633, representing one vehicle for each two inhabitants. There has been an unequal growth of the road network and of the fleet [2] and, as a consequence, increasing problems of traffic safety and flow. Average traffic speed in the city is 19km/h and extension of congested traffic amounts to 130km [3]. Another serious consequence is air contamination by mobile sources, which represent the main contribution to air pollution emissions in the area.
The city is also a congested intersection due to through traffic alone: it receives 10 of the main State highways and an intense external flow of goods vehicles between the State’s countryside and the port of Santos, the largest in Latin America [2]. Close to 1 million vehicles drive into the city every day, of those, 350,000 are trucks.
According to research on origin and destination of population, undertaken in 1997, by the Metro Company, the trips undertaken within the city of São Paulo, daily, in different transportation modes are shown in table 2.
The same study indicated that, in the last 10 years, urban sprawl has been decreasing, but empty spaces within the urban area are being occupied. Economic activities continue to be located along the main traffic corridors, while vast areas do not offer jobs to the population. This, together with the vertiginous growth of the car fleet, decreased mobility of population within the city and increased transportation costs, especially for low-income people that live in peripheral areas poorly served by jobs and by transportation systems [1]. An important consequence has been the tremendous growth of transportation by vans from 20,000 in 1987 to 200,000 daily trips in 1997. In 2002, there was an estimated 15,000 vans carrying over 1 million passengers in the metropolitan region of São Paulo [4].
www.witpress.com, ISSN 1755-8336 (on-line) WIT Transactions on State of the Art in Science and Engineering, Vol 22, © 2005 WIT Press

Advances in City Transport: Case Studies 109
Table 1: Vehicle fleet registered at the municipality of São Paulo in 2003.
Type of vehicle NumberCars 4,294,272Utility Vans 476,597Motorcycles 439,599Trucks 168,792Buses 37,905Others 6,422Total 5,423,587
Source of Data: Governo do Estado de São Paulo, Departamento Estadual de Trânsito. Estatística da Frota de Veículos - por frota Ref. 2003/02 Consulta: 7/3/2003.
Table 2: Transportation modes and purpose of trips (1000).
Purpose Mode Work School Shop/Health Recreation Other Total
Subway 1,046 193 178 93 186 1,696 Train 488 40 42 22 56 648 Bus 4,182 1,708 763 466 809 7,928 Van 69 57 31 11 32 200 Total Collective 5,785 1,998 1,014 592 1,083 10,472 Car 4,094 2,245 1,021 1,055 1,222 9,637 Taxi 34 8 39 9 14 104 Motorcycle 112 10 7 9 9 147 Other 182 21 15 16 26 260 Total Individual 4,422 2,284 1,082 1,089 1,271 10,148 Walking 2,655 6,359 497 492 809 10,812 Total Trips 12,862 10,641 2,593 2,173 3,163 31,432
Source: Pesquisa OD/97 apud Governo do Estado de São Paulo. Plano Integrado de Transportes Urbanos para 2020. Secretaria dos Negócios Metropolitanos [1].
The majority of the vans do public transportation in an illegal way.
Concomitantly, the bus transport system in the city has been going through a systematic revenue loss owing to the migration of its customary users to other transport modes. It is important to mention that the subway/train network in the city is very restricted (50km of subway lines with 46 stations and 183km of urban train lines and 83 stations) and expansion has been delayed by economic constraints.
www.witpress.com, ISSN 1755-8336 (on-line) WIT Transactions on State of the Art in Science and Engineering, Vol 22, © 2005 WIT Press

110 Advances in City Transport: Case Studies This complex traffic and transport situation contributed to deterioration of air quality above the city and has been, in great part, neutralizing air pollution control programs put in practice in the last decades by the state agency.
2 City traffic and transport programs
A State Agency is responsible for air pollution control in São Paulo, but the municipality is responsible for traffic and for the majority of the public transport. Already in 1976, a Traffic Engineering Company was created, aimed at planning and implementing the road network that would guarantee better traffic safety and flow.
In 2001, the City Secretariat of Transport developed a Master Plan that changed concepts: instead of working exclusively with flow, the target was to work with mobility. Mobility is a broader concept related to the needs that lead people to move themselves. In this context, public transport which serves the majority of the population, particularly those who live on the farthest outskirts and the users’ safety are given priority in the operational plans ([2] p. 14).
The focus of the plan is on the following topics:
– Improvement in the public transport quality – Increase in the operating speed of buses on the road network – Implementation of bus lanes
Out of many programs implemented, three particularly benefit air quality management in the city:
– Free Way Operation that consists of operational improvements and minor physical and traffic signage adaptations along the main bus transport routes in town. Among the implemented actions are: tidal lanes for public transport; adjustment of traffic-lights cycle; re-organization of bus routes, relocation, painting, signage and visual communication of bus stops, pedestrian crossing guidance, in addition to enforcement and monitoring of the traffic and transport system. In the 92km of bus lanes that were implemented, there was increase in the operating speed from 11 to 21km/h and reduction in travel time.
– New bus lanes. – Peak Hour Operation implemented already in 1997, given the impossibility
to reverse the scenario of congestion and queues beyond the so-called expanded city center. It consists of restricting the movement of vehicles from 7 to 10 am and from 5 to 8 pm, according to a schedule determined by the registration number final digit and by day of the week. The objective was to improve the distribution of trips along daytime, and, consequently, improve the performance of the vehicle traffic on the network [2]. The results achieved were: 23% improvement in the average speed in the morning peak and 24% in the afternoon peak, derived benefit estimated at US$ 3.36 million/weekday, congestion reduction of 37% in the morning peak and 26% in the afternoon peak as shown in fig. 1 ([2] p. 24).
www.witpress.com, ISSN 1755-8336 (on-line) WIT Transactions on State of the Art in Science and Engineering, Vol 22, © 2005 WIT Press

Advances in City Transport: Case Studies 111
Figure 1: Reduction of congestion as a result of Municipal Peak Hour Operation.
The State government is also investing to improve traffic and transport conditions in the city of São Paulo. Its two most ambitious programs are:
– The construction of Rodoanel (fig. 2), an outer ring road around the metropolitan São Paulo. In initial conception it was aimed to reduce through traffic in the city. Nowadays, it is considered as capable of absorbing also urban functions of directing, putting in hierarchy and structuring transport of goods in the area, according to local interests. Simulation studies have shown that it may improve substantially traffic conditions in the Marginal routes of the capital that operate in critical traffic conditions 70% of the time. As consequence, air quality will be improved in the area. Up to now, only the western part is in operation. Northern, eastern and southern tracts are under environmental licensing.
– New lines and enlargement of the existing lines of subway and urban trains. The Integrated Plan of Urban Transport for the Year 2020 indicates the construction of 284km of metro in the city until that year and its integration to the train network.
3 Air pollution control programs
Greatly influenced by the automotive industry air pollution, control in Brazil began in 1960 with the creation of the Inter-municipal Commission for Air and Water Control (CICPAA) in the highly industrialized area of São Paulo’s Metropolitan Region, known as the ABC (four municipalities of the 39 comprising the metropolitan region), that does not include the city of São Paulo. By the mid-1960s a network to monitor particulate matter (particulates and smoke) and sulfur dioxide (sulfating rate and hydrogen peroxide methods) began to operate with technical and financial support from the Pan American Health Organization / World Health Organization.
www.witpress.com, ISSN 1755-8336 (on-line) WIT Transactions on State of the Art in Science and Engineering, Vol 22, © 2005 WIT Press

112 Advances in City Transport: Case Studies
Figure 2: Metropolitan outer ring road ‘Rodoanel’ present (left) and planned (right). Source: Mobilidade Urbana [4]
In 1971 the air pollution control program was extended to the entire state of São
Paulo. In 1981 an automatic and telemetering monitoring network began to operate covering the metropolitan region and the town of Cubatão. Routine measurements cover PM10, CO, SO2, NOx, O3, and meteorological parameters. There is no routine monitoring of hazardous pollutants. Also by the same date started to operate the Light Duty Vehicle Test Laboratory running on USEPA FTP 75 driving cycle.
The industrial pollution control program started in 1976 is based on the State Environmental Law 997 of May 31, 1976. Forceful pollution control actions began with the inventory of sources in the metropolitan region; the establishment of air quality standards for four major pollutants (suspended particulates, carbon monoxide, sulfur dioxide and photochemical oxidants) at levels similar to the primary standards of the US Environmental Protection Agency (USEPA).
In 1990 air quality standards were revised. The new standards included the concept of primary standards for the protection of public health and secondary standards for the protection of the environment and human well-being in regard to suspended particulates, inhalable particulates (PM10), smoke, carbon mon-oxide, sulfur dioxide, nitrogen dioxide and ozone.
Emission standards for particulate matter from stationary sources and a smoke inspection program for mobile sources were also adopted. In 1982 a plan to reduce sulfur dioxide emissions in stationary sources was developed and its implementation begun. Within a few years sulfur dioxide concentrations were greatly reduced, by using fuel oil with less sulfur content, changing from fuel oil to electricity or natural gas or by using alkaline absorbers. Both particulate matter and sulfur dioxide control plans were based on the rollback approach with a mandatory emission reduction of approximately 65% for stationary sources, but most of the important sources were asked to control emissions based on the best practical control technology as they were also the source of complaints from the population (obtaining, in general, a 95% abatement efficiency or more for particulate matter and 80% for sulfur dioxide). A permit system was also established by Law 997 to control the deployment of new stationary sources.
The most important landmark in relation to motor vehicle pollution control
www.witpress.com, ISSN 1755-8336 (on-line) WIT Transactions on State of the Art in Science and Engineering, Vol 22, © 2005 WIT Press

Advances in City Transport: Case Studies 113
happened in 1986 with the enactment of the Federal Automobile Pollution Control Law (PROCONVE) that set emission standards for carbon monoxide, hydrocarbons and nitrogen oxides in regard to new Otto and Diesel vehicles, and smoke for new Diesel vehicles. For Otto vehicles the most stringent emission standards were set for the year 1997 and they are similar to those of developed countries (2g/km for CO; 0.3g/km for HC and 0.6g/km for NOx). The reduction schedule for heavy-duty vehicle emissions is less stringent and is based on European regulations. For diesel vehicles the most stringent regulation was enforced in January 2002 (4g/kwh for CO; 1.1g/kwh for HC; 7.0g/kwh for NOx and 0.15g/kwh for particles). Details of the reduction schedule are shown in tables 3 and 4 [5].
Table 3: Emission limits for new light duty Otto vehicles (CONAMA
Resolutions nº 18 of 05/06/1986 and nº 3 of 6/15/1989).
Source
Date of enforcement
CO
HC
NOx
CHO
CO in idle (%)
Evaporative (g/test)
January 1989
-
6.0
-
-
-
Crankase January 1989
-
Zero
-
-
-
January 1989
24
2.1
2.0
-
3.0
January 1992
12
1.2
1.4
0.15
2.5
Exhaust (g/km)
January 1997
2.0
0.3
0.6
0.03
0.5
Table 4: Emission limits for new heavy-duty vehicles (trucks and buses) (CONAMA Resolutions 18/86 e 8/93).
Phase Date of enforcement
CO (g/kwh)
HC (g/kwh)
NOx (g/kwh)
PM(1) (g/kwh)
Smoke (k) (3)
I October 1987
- - - - 2.5
II March 1994 11.2 2.45 14.4 - 2.5
III January 1996
4.9 1.23 9.0 0.7 / 0.4(2)
-
IV January 2000
4.0 1.1 7.0 0.15 -
(1) Particulate matter. Only applied to diesel vehicles. (2) 0.7g/kwh for 85kw engines and 0.4g/kwh for engines above 85kw. (3) k = smoke concentration/exhaust gases flow rate.
www.witpress.com, ISSN 1755-8336 (on-line) WIT Transactions on State of the Art in Science and Engineering, Vol 22, © 2005 WIT Press
114 Advances in City Transport: Case Studies
At present restriction to emissions of nitrogen oxides (NOx) and volatile organic compounds (VOCs) is applied to new vehicles, according to the federal resolution of 1986 (CONAMA resolution 18/1986), and for new power plants. VOC Pollution control system is mandatory for stationary sources that can cause nuisance problems.
Industrialization, land occupation process, increase in vehicle fleet, insufficient public transport, together with meteorological conditions unfavourable to the dispersion of pollutants (frequent low altitude thermal inversions in wintertime, and strong solar radiation during other seasons) and a topography formed by floodplain surrounded by mountains in the north and northwest, receiving predominant winds from the ocean at southeast (approximately 60km away), result in conditions that favour deterioration of air quality [6].
A few studies have been conducted [7–10], and some studies concerning ozone formation in the region are being planned. The number of studies on ozone formation process and the participation of their precursors are likely to increase in view of the present status of ozone levels in the region, and because of the fact that ozone is becoming a problem in several other areas in the state of São Paulo.
Restriction to vehicle circulation operation (Rodizio) was implemented by the State Environmental Agency (CETESB) from 1996 to 1998, in the Metropolitan Region, including São Paulo city, for preventing high air pollution levels from motor vehicle emissions in the period of stagnant conditions, basically from May to September. The State Agency estimated that 449 metric tons/day of carbon monoxide emission were prevented due to this operation in 1998 [11]. As shown in figs 3 and 4, levels of inhalable particles (PM10) and carbon monoxide showed a tendency to decrease in relation to previous years. Gouveia [12] made a statistical analysis of the influence of this operation in relation to hospital admissions during selected periods when the operation was enforced, and concluded that there was no statistical difference (p<0.05) of number of hospital admissions, in the three previous years although comparison of levels of PM10 and CO in 1996–1998 were statistically different and lower (p<0.05) in relation to 1993–1995 levels.
4 Air emissions
During the 1960s and 1970s air quality had important influence from industrial sources (table 5). Nowadays emissions come mainly from vehicles, as shown by table 6. Light-duty vehicles are powered by gasohol, a gasoline/ethanol blend (mixture of 78% gasoline and 22% ethanol) and by plain ethanol. About 40% of the total fuel volume is ethanol [13]. Heavy-duty vehicles are fueled by diesel oil.
www.witpress.com, ISSN 1755-8336 (on-line) WIT Transactions on State of the Art in Science and Engineering, Vol 22, © 2005 WIT Press

Advances in City Transport: Case Studies 115
Figure 3: Daily PM10 concentrations (µg/m3) trend for selected months, 1993–1998. Source: Gouveia [12]
Figure 4: Hourly CO concentrations (ppm) trend for selected months in the period 1993–1998. Source: Gouveia [12]
www.witpress.com, ISSN 1755-8336 (on-line) WIT Transactions on State of the Art in Science and Engineering, Vol 22, © 2005 WIT Press

116 Advances in City Transport: Case Studies Table 5: Inventory of emissions in the metropolitan region of São Paulo, 1977
(1000 metric tons).
Source CO HC NOx SOx PM* Gasohol vehicles 1,557.0 183.8 51.7 11.2 8.5 Diesel Vehicles 58.3 9.8 40.4 20.9 3.5 Other 42.9 23.9 2.6 0.32 30.8 Industrial 56.6 39.3 29.1 288.6 111.2 Total 1,715.0 257.0 124.0 321.0 154.0 % from vehicle 94.2 75.3 74.3 10.0 7.8
*Particulate matter. Source: CETESB apud De Assunção & Galvão Filho [14] Table 6: Inventory of emissions in the metropolitan region of São Paulo, 2001
(1000 metric tons).
Source CO HC NOx SOx PM* Gasohol-fueled vehicles 780.8 214.1 44.4 10.2 5.1 Ethanol-fueled vehicles 207.5 40.4 12.7 - - Diesel-fueled vehicles 433.3 70.6 316.5 10.9 19.7 Taxis 3.5 0.7 0.7 0.4 0.2 Motorcycles 217.5 44.2 1.1 0.8 0.6 Other transport and related sources - 13.0 - - 8.1
Industrial sources ** 38.6 12.0 14.0 17.1 31.6 Total 1,681.2 395.0 389.4 39.4 65.3 % from mobile sources 97.7 97.0 96.4 56.6 51.6
* Particulate matter. **Emissions from most important sources, representing approximately 90% of total emissions; 1990 data for CO, HC and NOx and 1998 data for SOx and particulates. Source: CETESB [15]
Table 7 presents a comparison between emissions at the beginning of the air pollution control program developed by CETESB – the São Paulo State Environmental Protection Agency – in the mid-1970s and in 2001. Sulfur oxide emissions decreased 88% and particulate matter emissions decreased 58.4%. Carbon monoxide emissions, however, decreased only 3.1% and hydrocarbon emissions increased 46.6%. The worst case is nitrogen oxide emissions, which increased 208.1%. Mobile sources substantially increased their contribution to the air emissions in the region in terms of HC, NOx, SOx and particulate matter. Most carbon monoxide emissions come from mobile sources.
www.witpress.com, ISSN 1755-8336 (on-line) WIT Transactions on State of the Art in Science and Engineering, Vol 22, © 2005 WIT Press

Advances in City Transport: Case Studies 117
Table 7: Comparison of emissions in 1977 and 2001 in the metropolitan region
of São Paulo.
Parameter CO HC NOx SOx PM* Total emissions in 1977 (metric tons)
1715 257 124 321 154
Total emissions in 2001 (metric tons)
1681.2 395.0 389.4 39.4 65.3
Alteration in the period (%) –2.0 +53.7 +214.0 –87.7 –57.6 From vehicles in 1977 (%) 94.2 75.3 74.3 10.0 7.8 From vehicles in 2001 (%) 97.7 97.0 96.4 56.6 51.6
* Particulate matter.
Table 8 shows the contribution of each type. It can be seen that gasohol vehicles, contribution for carbon monoxide is almost 50% of total CO emissions in 2001, seconded by diesel vehicles. In relation to HC gasohol vehicles present contribution of 68.6% also seconded by diesel vehicles. For NOx the most important contribution comes from diesel vehicles (81.3%), seconded by gasohol vehicles. In relation to SOx, contribution from gasohol vehicles is almost the same as diesel vehicles, around 27%. As expected diesel vehicles are the most important contributor for PM10 emission, around 31% of total emission. Table 8: Relative contribution (%) of emissions in São Paulo Metropolitan
Region in 2001.
Source Type CO HC NOx SOx PM10 Gasohol 46.4 29.9 11.4 25.9 8.0 Alcohol 12.4 5.8 3.3 - - Diesel 25.8 17.9 81.3 27.7 30.8 Taxi 0.2 0.2 0.2 1.0 0.3
Exhaust
Motorcycle 12.9 7.3 0.3 2.0 0.9 Gasohol 33.3 Alcohol 4.4
Crankase and evaporative
Motocycle 3.9 Gasohol 3.2 Commercialization Alcohol 0.1
Industrial - 2.3 3.0 3.5 43.4 10.0 Re-suspended - 25.0
Secondary aerosol - 25.0 Source: CETESB [15]
5 Air quality
Although there was a great increase in vehicle fleet in the city of São Paulo during the last fifteen years, air quality in the region did not worsen in the same proportion. In fact, for some pollutants, it improved. At present major air pollution problems are related to fine particulates (PM10), carbon monoxide and
www.witpress.com, ISSN 1755-8336 (on-line) WIT Transactions on State of the Art in Science and Engineering, Vol 22, © 2005 WIT Press

118 Advances in City Transport: Case Studies ozone. It must be noted that in regard to the situation in the 1980s air pollution now covers a much broader area both in the city of São Paulo and in the metropolitan region.
5.1 Particulates
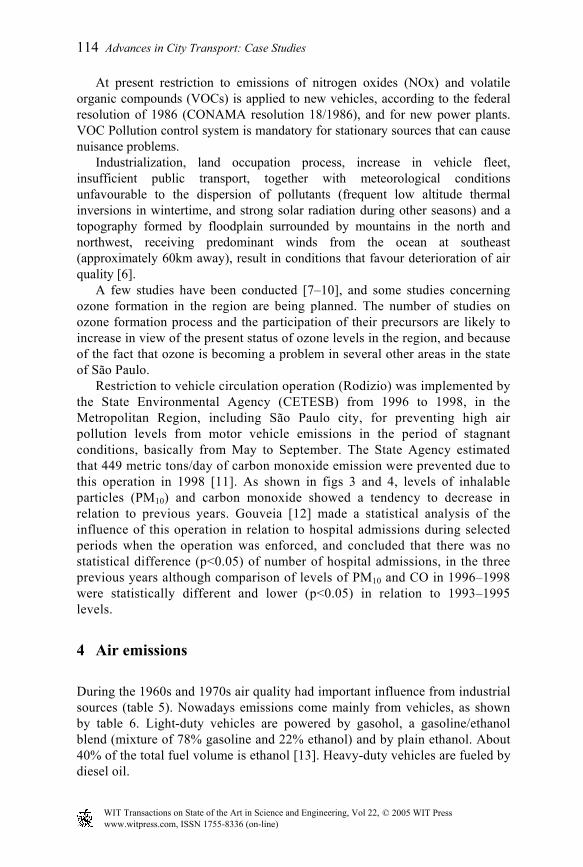
Total suspended particulate levels, measured by high volume samplers, still exceed air quality standards, and in some periods of poor dispersion conditions reach attention levels. In regard to smoke, measured by the WHO reflectance method, there is a clear tendency for air quality conditions to improve, shown in fig. 5. Although air quality standards are exceeded on some days, attention levels are not attained. Levels of inhalable particulates still violate air quality standard, but attention levels were not exceeded in 2000 and 2001.
Studies applying receptor model technique for source apportionment were performed in the region to subsidy control actions. Alonso et al [16] concluded that chemical mass balance (CMB) receptor modelling indicated that carbonaceous material plays an important role in the aerosol composition; that the three major source categories contributing to the fine particles are vehicles, secondary carbon, and sulphates; and that the main contributors to coarse particles and total suspended particulate are road dust and vehicles. All sampling sites presented the same general pattern in terms of source contribution, although this contribution varied from site to site.
In a study conducted by CETESB in 1986–1987 it was found that levels of carbonaceous material in the particulate matter of São Paulo city are very high compared with some US cities; total carbon was responsible for 40% of the total mass of suspended particulate and the contribution of organic carbon was 32% on average [17].
5.2 Sulfur dioxide
In regard to sulfur dioxide, the present situation is promising due to a successful control program implemented during the first half of the 1980s and to the fact that primary air quality standards were not exceeded since 1986, except a few times. Even the more stringent air quality standard proposed by the World Health Organization (120µg/m3 – 24h average) has been met in the last four years. Figure 5 shows the trend of average sulfur dioxide levels in the region since 1975.
5.3 Carbon monoxide
Air quality levels of CO are influenced basically by gasohol and ethanol-fueled vehicle emissions The vehicle fleet – 520,000 vehicles in the city in and 659,000 vehicles in the Metropolitan Region in 1970 – grew approximately ten-fold from 1970 to 2001 and currently comprises approximately 5 million cars in the city and 6 million cars in the Metropolitan Region, but emissions decreased by about 2%. This decrease was due to the carbon monoxide emission limits imposed on new vehicles since 1989, to the use of plain ethanol and a mixture of 22% of
www.witpress.com, ISSN 1755-8336 (on-line) WIT Transactions on State of the Art in Science and Engineering, Vol 22, © 2005 WIT Press
Advances in City Transport: Case Studies 119
Figure 5: Annual mean concentration trend in the Metropolitan Region of São
Paulo 1975–2000, for smoke and sulfur dioxide. Source of data: CETESB
ethanol in gasoline and to the restriction on vehicle use, in the city of São Paulo. An inspection and maintenance program is already part of federal legislation and should be enforced soon.
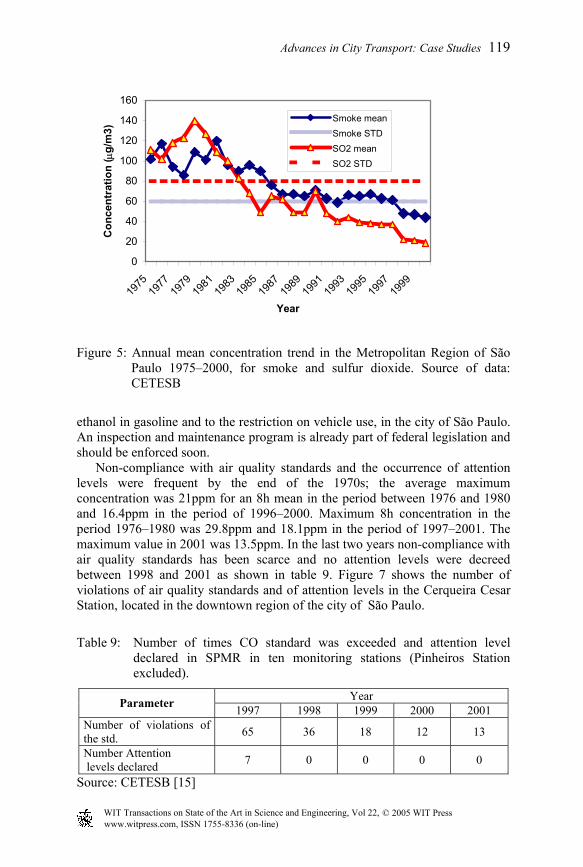
Non-compliance with air quality standards and the occurrence of attention levels were frequent by the end of the 1970s; the average maximum concentration was 21ppm for an 8h mean in the period between 1976 and 1980 and 16.4ppm in the period of 1996–2000. Maximum 8h concentration in the period 1976–1980 was 29.8ppm and 18.1ppm in the period of 1997–2001. The maximum value in 2001 was 13.5ppm. In the last two years non-compliance with air quality standards has been scarce and no attention levels were decreed between 1998 and 2001 as shown in table 9. Figure 7 shows the number of violations of air quality standards and of attention levels in the Cerqueira Cesar Station, located in the downtown region of the city of São Paulo.
Table 9: Number of times CO standard was exceeded and attention level declared in SPMR in ten monitoring stations (Pinheiros Station excluded).
Year Parameter 1997 1998 1999 2000 2001 Number of violations of the std. 65 36 18 12 13
Number Attention levels declared 7 0 0 0 0
Source: CETESB [15]
0
20
40
60
80
100
120
140
160
1975
1977
1979
1981
1983
1985
1987
1989
1991
1993
1995
1997
1999
Year
Con
cent
ratio
n ( µ
g/m
3)Smoke meanSmoke STDSO2 meanSO2 STD
www.witpress.com, ISSN 1755-8336 (on-line) WIT Transactions on State of the Art in Science and Engineering, Vol 22, © 2005 WIT Press

120 Advances in City Transport: Case Studies 5.4 Ozone
Ozone is the main component of photochemical smog in urban areas. Its main precursors are nitrogen oxides and hydrocarbons (including other volatile organic compounds). In relation to ozone the situation in the city of São Paulo is of great concern, since the emissions of its precursors increased between 1976 and 2000, shown in table 11. This increase will lead to high ozone levels in a broader area. Although maximum concentrations declined in relation to the 1980s, violation of the air quality standard and attainment of attention level are frequent. As described by the Environmental Agency of the state of São Paulo (CETESB) in the air quality report for 2001, in the case of ozone the air quality standard (160µg/m3 for 1h period) and the attention level (200µg/m3, for 1h period) are frequently exceeded [15]. Figure 6 shows the number of violations of the 1h primary air quality standard (160µg/m3) and in fig. 7 is shown the number of times the São Paulo state attention level (200µg/m3 for 1h period) was declared.
5.5 VOC and toxic air pollutants
A recent survey of volatile organic compounds associated with automotive emission in the urban air shed of São Paulo city, made by Colón et al [13]) showed that overall results demonstrate that mean concentrations of single-ring aromatics are 2 to 3 times higher, volatile aldehydes 10 to 100 times higher, and single alcohols 10 to 100 times higher as compared to results of another recent study done by US EPA in the Los Angeles basin. C4-C11 n-alkanes were only slightly elevated in São Paulo.
Levels of benzene in São Paulo city reported by Gee and Sollars [18] are much higher than in several cities in the United States of America and higher than levels observed in several other cities in the world (Quito in Ecuador, Caracas in Venezuela, Santiago in Chile, Manila in the Philippines); only Bangkok in Thailand had levels higher than São Paulo, but Colón et al [13], observed levels of benzene that in São Paulo are lower than half of the levels reported by Gee and Sollars.
Oliveira [19] reported levels of dioxins and furans in São Paulo city in the range of 86–187fg I-TEQ/m3. De Assuncao et al [20] in a study performed from November 2000 to August 2001 reported levels in the range of 39 to 751fg I-TEQ/m3 with measurements done according to EPA Method T09A, using PUF (polyurethane foam) samplers in 24h sampling time simultaneously in three different sites in the city.
Lead was of concern until the early 1980s. The situation changed due to the use of ethanol in gasoline in Brazil since the early 1980s in place of tetraethyl lead and also because of the use of plain ethanol. Concentration of lead in the air in the metropolitan region was reduced from the maximum quarterly average concentration of about 1.6µg/m3 in 1978 to a maximum of about 0.4µg/m3 in 1983 [21].
www.witpress.com, ISSN 1755-8336 (on-line) WIT Transactions on State of the Art in Science and Engineering, Vol 22, © 2005 WIT Press

Advances in City Transport: Case Studies 121
Figure 6: Number of times the 1h Primary Ozone Standard was exceeded in São Paulo city, and in other cities in its neighbourhood, by station, in the period of 1997–2001. (Source of data CETESB [15])
Figure 7: Number of times the Ozone Attention Level was declared in São Paulo city, and in other cities in its neighbourhood, by station, in the period of 1997–2001. (Source of data: CETESB [15])
0
10
20
30
40
50
60
1997 1998 1999 2000 2001
D. Pedro II M ooca Ibirapuera Sao C do Sul Osasco S. M . Paulista M aua
0
5
10
15
20
25
1997 1998 1999 2000 2001D. Pedro II Mooca Ibirapuera Sao C do Sul Osasco S. M. Paulista Maua
www.witpress.com, ISSN 1755-8336 (on-line) WIT Transactions on State of the Art in Science and Engineering, Vol 22, © 2005 WIT Press

122 Advances in City Transport: Case Studies 6 Air quality trend in the central area
The location of Cerqueira Cesar monitoring station is appropriate to evaluate the efficacy of vehicular emission control programs since there are no other important sources of pollutants in the area. Levels of pollutants in this station are shown in table 10. The majority of the pollutants presents decrease trend in their levels in the five-year period except PM10 which shows concentrations almost constant in the period. In relation to carbon monoxide, its trend can be verified by fig. 8. This figure shows the number of violations of the 8h standard and number of the attention levels declared.
7 The future
This historical overview of air pollution in the metropolitan region of São Paulo indicates that control measures like legislation and enforcement, technology, cooperation, negotiation and education achieved very positive results in terms of pollution control and are important tools to minimize health risks and to promote a good quality of life. However, results might be neutralized by the increase in the number of vehicles and of uncontrolled urban and economic activities. A lot remains to be done in terms of transforming São Paulo into a healthy city.
The São Paulo Metropolitan Region will reach 20.4 million inhabitants by 2015, a 15% population increase in relation to the situation in year 2000 (17.8 million inhabitants), but São Paulo City itself is slowing down in terms of population growth and it will maintain close to 11 million inhabitants. The number of cars is still increasing in the region with an addition of 200,000 cars per year in the metropolitan area. Total number of cars will reach about 9 million by 2015, that is, approximately 2.3 inhabitants per car, about the same ratio of São Paulo city nowadays.
The region’s economic activities will continue to change from industrial sector to service sector and transportation sources will increase participation in the overall air pollution levels. Levels of carbon monoxide will continue to decrease, as car inspection and maintenance programs are expected to be established soon, and old cars are being replaced by new ones, with more stringent emission levels. NOx and VOC control actions are slower than for other pollutants then we can expect maintenance or increased levels of ozone in the area.
Table 10: Levels of selected pollutants in Cerqueira César Monitoring Station –
Annual mean (µg/m3) – in the period of 1996–2000.
Year SO2 Smoke TSP NO2 NO PM10(**)
1996 21 83 87 83 117 46 1997 15 72 88 79 114 43 1998 12 61 85 67 86 40 1999 15 55 72 64 68 44 2000 16 49 78 70 79 48
(*) Faculdade de Saúde Pública da Universidade de São Paulo. (**) Arithmetic mean. Source: CETESB [22]
www.witpress.com, ISSN 1755-8336 (on-line) WIT Transactions on State of the Art in Science and Engineering, Vol 22, © 2005 WIT Press

Advances in City Transport: Case Studies 123
Figure 8: Number of violations of the carbon monoxide air quality standards and of violation of the attention levels in the downtown region of the city of São Paulo. (Source of data: CETESB)
Photochemical pollution is a complex issue and many studies must be carried
out before we can fully understand it, especially in an area with a very unique combination of fuels in the world (diesel, gasohol, ethanol, and some natural gas), as the São Paulo Metropolitan Region. Inhalable particulate is another problem that must be faced. Also highly toxic pollutants need a special inventory and monitoring program followed by a well-planned control program, and benefits, especially on health, should be addressed.
As better public transportation is a concern of most of the SPMR municipalities and also of the state government, it can lead to an increase in public transportation use by people and consequently less use of private cars. Also the circulation in the City of São Paulo of trucks and buses, and some light-duty cars, coming from other states, will be rearranged in the near future with the construction of the ring road around São Paulo City. These measures will influence positively the air quality in the city. Nonetheless, a lot remains to be done in order to attain stricter standards according to European regulations.
References
[1] Governo do Estado de São Paulo. PITU 2020. Plano Integrado de Transportes Urbanos - Síntese. Secretaria dos Negócios Metropolitanos. São Paulo, 1999.
[2] CET- Companhia de Engenharia de Tráfego. Relatório Anual 2001. Prefeitura do Município de São Paulo. São Paulo, 2001.
[3] DERSA- Desenvolvimento Rodoviário S.A. Projeto do Rodoanel Metropolitano de São Paulo. Estudos Ambientais. Termo de Referência. São Paulo, 1998.
0
20
40
60
80
100
120
1983 1984 1985 1986 1987 1988 1989 1990 1991 1992 1993 1994 1995 1996 1997 1998 1999 2000year
num
ber o
f exc
eeda
nces
> STD > ATT Level
www.witpress.com, ISSN 1755-8336 (on-line) WIT Transactions on State of the Art in Science and Engineering, Vol 22, © 2005 WIT Press

124 Advances in City Transport: Case Studies [4] Mobilidade Urbana. Ano I, n. 1. Companhia de Engenharia de Tráfego de
São Paulo. Prefeitura Municipal de São Paulo, 2002. [5] Brasil. Resolução CONAMA 03 de 28 de junho de 1990. Diário Oficial da
Republica Federativa do Brasil, Brasília, 16 ago 1990. p. 15518. [6] Ribeiro, H. & Assunção, J.V. de Historical overview of air pollution in São
Paulo metropolitan area, Brazil: influence of mobile sources and related health effects. Urban transport VII – Urban transport and the environment in the 21st century, L.J. Sucharov & C.A. Brebbia, Southampton: WIT Press, 2001.
[7] Ulke, A.G. & Andrade, M.F., Modelling photochemical air pollution in São Paulo, Brazil. Proceedings of the Millenium NATO/CCMS International Technical Meeting on Air Pollution and its Application. American Meteorological Society, Boston, USA, pp. 188–189, 2000.
[8] Andrade, M.F., Miguel, A.H. & Ulke, A.G. Ozone modelling in an ethanol, gasoline-, and diesel-fuel environment: the Metropolitan Area of São Paulo, Brazil. Proceedings of the 6th Conference on Southern Hemisphere Meteorology and Oceanography, pp. 17–18, 2000.
[9] Massambani, O. & Andrade, M.F., Seasonal behavior of tropospheric ozone in the São Paulo (Brazil) metropolitan area. Atmospheric Environment 28(19), pp. 3165–3169, 1994.
[10] Guardani, M.L.G., Nascimento, C.A.O., Guardani, M.L.G., Martins, M.H.R.B. & Romano, J., Study of atmospheric ozone formation by means of a neural network – based model. Journal of the Air and Waste Management Association, 49, pp. 316–323, 1999.
[11] CETESB- Companhia de Tecnologia de Saneamento Ambiental. Relatório de qualidade do ar no Estado de São Paulo 1998 (Air quality report for the State of São Paulo, 1998). São Paulo: CETESB, 1999.
[12] Gouveia, N., Avaliação dos impactos na saúde de políticas ambientais para o controle da poluição do ar. Global Conference: Building a Sustainable World - International Union of Air Pollution Prevention Associations (IUAPPA) /Associação Brasileira de Ecologia e Prevenção da Poluição do Ar (ABEPPOLAR), São Paulo, Brazil, 23-25 de Outubro de 2002.
[13] Colón, M, Pleil, J.D., Hartlage, T.A., Guardani, M.L & Martins, M.H., Survey of volatile compounds associated with automotive emissions in the urban airshed of São Paulo, Brazil. Atmospheric Environment 35, pp. 4017–4031, 2001.
[14] Assunção, J.V. de & Galvão Filho, J.B., Discussing the Air Pollution of São Paulo City - Brazil. Proceedings of the 92nd Annual Meeting and Exhibition of the Air and Waste Management Association (AWMA); 1999 June 18-24; Saint Louis (USA). Pittsburgh: AWMA; 1999.
[15] CETESB- Companhia de Tecnologia de Saneamento Ambiental. Relatório de qualidade do ar no Estado de São Paulo 2001 (Air quality report for the State of São Paulo, 2001). São Paulo: CETESB, 2002.
[16] Alonso, C.D., Martins, M.H.R.B., Romano, J. & Godinho, R., São Paulo aerosol characterization study. Journal of the Air and Waste Management Association, 49, pp. 642–645, 1997.
www.witpress.com, ISSN 1755-8336 (on-line) WIT Transactions on State of the Art in Science and Engineering, Vol 22, © 2005 WIT Press

Advances in City Transport: Case Studies 125
[17] CETESB- Companhia de Tecnologia de Saneamento Ambiental. Relatório
de qualidade do ar no Estado de São Paulo 1994 (Air quality report for the State of São Paulo, 1994). São Paulo: CETESB, 1995.
[18] Gee, I.L. & Sollars, C.J., Ambient air levels of volatile organic compounds in Latin America and Asian cities. Chemosphere, 36(11), pp. 2497–2506, 1998.
[19] Oliveira, M.C.N., Avaliação de compostos orgânicos provenientes da queima de palha de cana-de-açucar em Araraquara e comparação com medicões efetuadas em São Paulo e Cubatao. Resultados Parciais (Evaluation of organic compounds from sugar cane burning in Araraquara and comparison with measurements in São Paulo and Cubatao. Partial results). São Paulo, CETESB, November, 1996.
[20] Assunção, J.V., Pesquero, R.C., Carvalho, L.R.F., Nóbrega, R.P. & Dioxinas e Furanos: vias de exposição da população [Dioxins and Furans: population exposure ways]. São Paulo: Faculdade de Saúde Pública da USP, 2001. (Relatório Científico de Projeto de Pesquisa – Processo Fapesp 98/11655.6)
[21] CETESB- Companhia de Tecnologia de Saneamento Ambiental. Relatório de qualidade do ar no Estado de São Paulo 1986 (Air quality report for the State of São Paulo, 1986). São Paulo: CETESB, 1987.
[22] CETESB- Companhia de Tecnologia de Saneamento Ambiental. Relatório de qualidade do ar no Estado de São Paulo 2000 (Air quality report for the State of São Paulo, 2000). São Paulo: CETESB, 2001.
www.witpress.com, ISSN 1755-8336 (on-line) WIT Transactions on State of the Art in Science and Engineering, Vol 22, © 2005 WIT Press