chapter 6: wind power markets
TRANSCRIPT


Foreword January 2009
i
FOREWORD New technologies will be a critical component—perhaps the critical component—of our efforts to tackle the related challenges of energy security, climate change, and air pollution, all the while maintaining a strong economy. But just developing new technologies is not enough. Our ability to accelerate the market penetration of clean energy, enabling, and other climate-related technologies will have a determining impact on our ability to slow, stop, and reverse the growth in greenhouse gas (GHG) emissions.
Title XVI, Subtitle A, of the Energy Policy Act of 2005 (EPAct 2005) directs the Administration to report on its strategy to promote the commercialization and deployment (C&D) of GHG intensity-reducing technologies and practices. The Act also requests the Administration to prepare an inventory of climate-friendly technologies suitable for deployment and to identify the barriers and commercial risks facing advanced technologies. Because these issues are related, they are integrated here within a single report that we, representing the Committee on Climate Change Science and Technology Integration (CCCSTI),1 are pleased to provide the President, the Congress, and the public.
Over the past eight years, the Administration of President George W. Bush has pursued a series of policies and measures aimed at encouraging the development and deployment of advanced technologies to reduce GHG emissions. This report highlights these policies and measures, discusses the barriers to each, 2 and integrates them within a larger body of other extant policy. Taken together, more than 300 policies and measures described in this document may be viewed in conjunction with the U.S. Climate Change Technology Program’s (CCTP’s) Strategic Plan, published in September 2006, which focuses primarily on the role of advanced technology and associated research and development (R&D) for mitigating GHG emissions. The CCTP, a multi-agency technology planning and coordination program, initiated by President Bush, and subsequently authorized in EPAct2005, is responsible for preparing this report on behalf CCCSTI.
This report systematically examines the market readiness of key technologies important to meeting climate change mitigation goals. It assesses the barriers and business risks impeding their progress and greater market application. Importantly, by documenting the hundreds of Federal policies, programs, regulations, incentives, and other activities that are in effect and operating today to address these barriers, it provides a broad context for evaluating the adequacy of current policy and the potential need, if any, for additional measures that might be undertaken by government or industry. Finally, it draws conclusions about the current situation, identifies gaps and opportunities, and suggests analytical principles that should be applied to assess and formulate policies and measures to accelerate the commercialization and deployment of these technologies.
Energy security and climate change are two of the great challenges of our time and they share a common solution -- technology. The breadth of policies and measures detailed in this report reveal a robust array of Federal activities designed to address barriers, mitigate risks, and promote the commercialization and deployment of GHG intensity-reducing technologies. It also points the way to areas for further improvement. In conjunction with the CCTP Strategic Plan, the two reports – one guiding R&D, the other promoting C&D – constitute an inspired vision for realizing the potential of innovation and technology in addressing energy security and climate change concerns.
Samuel W. Bodman Carlos M. Gutierrez John H. Marburger III, Ph.D. Secretary of Energy Secretary of Commerce Director, Office of Science and
Technology Policy Chair, Committee on Vice-Chair, Committee on Executive Director, Committee on Climate Change Science and Climate Change Science and Climate Change Science and Technology Integration Technology Integration Technology Integration
1 In correspondence to Congressional leaders, dated May 11, 2006, the Secretaries of Energy and Commerce jointly designated CCCSTI as the Cabinet-level committee responsible for addressing the requirements of EPAct Title XVI. 2 The existence of barriers and their identification in this report in no way implies it is the responsibility of the Federal government to address every (or any) barrier, in whole or in part.

Strategies for Commercialization and Deployment
ii

Table of Contents January 2009
iii
Table of Contents
Foreword .................................................................................................................... i List of Figures .......................................................................................................... iv List of Tables............................................................................................................. v Executive Summary ................................................................................................ vii
Chapter 1. Strategies to Promote the Commercialization and Deployment of Greenhouse Gas Intensity-Reducing Technologies and Practices.......... 1
1.1 Elements of the C&D Strategies .............................................................................................3 1.2 Strategies for Technology Sectors ........................................................................................14
Chapter 2. Energy End Use..................................................................................... 17 2.1 Transportation .......................................................................................................................18 2.2 Buildings ...............................................................................................................................24 2.3 Industry .................................................................................................................................30 2.4 Electric Grid and Infrastructure ............................................................................................36 2.5 Summary ...............................................................................................................................41
Chapter 3. Energy Supply....................................................................................... 43 3.1 Low-Emission, Fossil-Based Fuels and Power.....................................................................44 3.2 Hydrogen...............................................................................................................................49 3.3 Renewable Energy and Fuels................................................................................................55 3.4 Nuclear Fission .....................................................................................................................62 3.5 Summary ...............................................................................................................................69
Chapter 4. Carbon Capture, Storage, and Sequestration ........................................ 71 4.1 Carbon Capture .....................................................................................................................71 4.2 Geologic Storage...................................................................................................................77 4.3 Terrestrial Sequestration .......................................................................................................83 4.4 Summary ...............................................................................................................................88
Chapter 5. Non-CO2 Greenhouse Gases ................................................................. 89 5.1 Methane from Energy and Waste .........................................................................................89 5.2 Methane and Nitrous Oxide Emissions from Agriculture ....................................................94 5.3 Emissions of High Global-Warming Potential Gases...........................................................99 5.4 Nitrous Oxide Emissions from Combustion and Industrial Sources ..................................103 5.5 Summary .............................................................................................................................107

Strategies for Commercialization and Deployment
iv
Chapter 6. Conclusion........................................................................................... 109
References ............................................................................................................. 117
Glossary ............................................................................................................. 123
Annex A. Outline of the Inventory of Greenhouse Gas-Reducing Technologies.................................................................................. A-1
Annex B. Inventory of Federal Activities that Promote Commercialization and Deployment of GHG-Reducing Technologies and Practices......................................................................................... B-1
Annex C. Deployment-Related Activities of States and the District of Columbia ....................................................................................... C-1
Annex D. Energy Policy Act of 2005, Title XVI ............................................. D-1
List of Figures Figure ES 1. Key Goals and Technology Strategies ................................................................................. vii Figure ES-2. Deployment Activities Address the Use of Near-Term Technologies....................................x Figure 1-1. 15 Technology Strategies...........................................................................................................2 Figure 1-2. Federal Policies to Reduce GHGs, by Type of Policy and Measure .......................................11 Figure 2-1. Federal Policies to Reduce GHGs in Energy End Use, by Type of Policy and
Measure .............................................................................................................................17 Figure 2-2. U.S. Petroleum Production and Consumption 1970–2030 ......................................................18 Figure 2-3. Federal Policies to Reduce GHGs in Transportation, by Type of Policy and Measure...........21 Figure 2-4. The Building America Pathway to Net Zero Energy Homes...................................................24 Figure 2-5. Federal Policies to Reduce GHGs in Buildings, by Type of Policy and Measure...................28 Figure 2-6. Pathways for Reducing Industrial GHGs.................................................................................31 Figure 2-7. Federal Policies to Reduce GHGs in Industry, by Type of Policy and Measure .....................34 Figure 2-8. Distributed Grid of the Future .................................................................................................36 Figure 2-9. Federal Policies to Reduce GHGs in Electric Grid and Infrastructure, by Type of
Policy and Measure ...........................................................................................................39 Figure 3-1. Federal Policies to Reduce GHGs in Energy Supply, by Type of Policy and Measure ..........43 Figure 3-2. Coal-Based Energy Complex...................................................................................................44 Figure 3-3. Federal Policies to Reduce GHGs through Low-Emission, Fossil-Based Fuels and
Power, by Type of Policy and Measure.............................................................................46 Figure 3-4. Domestic Hydrogen Production Options .................................................................................49 Figure 3-5. Federal Policies to Reduce GHGs through Hydrogen by Type of Policy and Measure ..........53 Figure 3-6. Renewable Energy and Fuels Production, 2001-2005............................................................55 Figure 3-7. Federal Policies to Reduce GHGs through Renewable Power and Fuels, by Type of
Policy and Measure ...........................................................................................................60 Figure 3-8. The Evolution of Nuclear Power .............................................................................................63

Table of Contents January 2009
v
Figure 3-9. Federal Activities to Reduce GHGs through Nuclear Fission, by Type of Policy and Measure .............................................................................................................................67
Figure 4-1. Federal Policies to Reduce GHGs in Carbon Capture, Storage, and Sequestration, by Type of Policy and Measure..............................................................................................72
Figure 4-2. Overview of CO2 Capture........................................................................................................73 Figure 4-3. Federal Policies to Reduce GHGs through Carbon Capture, by Type of Policy and
Measure .............................................................................................................................76 Figure 4-4. Graphical Representation of Geologic Storage........................................................................77 Figure 4-5. Federal Policies to Reduce GHGs through Geologic Storage, by Type of Policy and
Measure .............................................................................................................................80 Figure 4-6. Terrestrial Carbon Cycle..........................................................................................................83 Figure 4-7. Federal Policies to Reduce GHGs through Terrestrial Sequestration, by Type of
Policy and Measure ...........................................................................................................86 Figure 5-1. Federal Policies to Reduce Non-CO2 GHGs, by Type of Policy and Measure .......................90 Figure 5-2. Federal Policies to Reduce GHGs of Methane Emissions from Energy and Waste, by
Type of Policy and Measure..............................................................................................93 Figure 5-3. Components of Non-CO2 U.S. GHG Emissions from Agriculture, 2005................................95 Figure 5-4. Federal Policies to Reduce GHGs of Methane and Nitrous Oxide Emissions from
Agriculture, by Type of Policy and Measure ....................................................................98 Figure 5-5. High-GWP Gas Emissions in the U.S. by Source (Tg CO2 Equivalents)..............................100 Figure 5-6. Federal Policies to Reduce GHG Emissions of High-GWP Gases, by Type of Policy
and Measure ....................................................................................................................103 Figure 5-7. U.S. N2O Emissions from Combustion and Industrial Sources, 2005 ...................................104 Figure 5-8. Federal Policies to Reduce GHGs of N2O Emissions from Combustion and Industrial
Sources, by Type of Policy and Measure ........................................................................106 Figure 6-1. Critical and Important Barriers by CCTP Goal Area.............................................................110
List of Tables Table ES 1. Barrier Categorization .......................................................................................................... viii Table ES-2. Summary of Major Barriers Inhibiting Deployment by Goal .................................................ix Table 1-1. GHG-Reducing Technology Inventory.......................................................................................4 Table 1-2. Typology of Barriers to Commercialization and Deployment of GHG-Reducing
Technologies .......................................................................................................................7 Table 1-3. Barriers........................................................................................................................................9 Table 1-4. Major Federal Deployment Activity Components ....................................................................12 Table 1-5. Major Deployment Activities by Selected CCTP Sectors* ......................................................13 Table 2-1. Select Federal Activities Addressing Key Technology Deployment Barriers:
Transportation ...................................................................................................................22 Table 2-2. Select Federal Activities Addressing Key Technology Deployment Barriers:
Buildings ...........................................................................................................................29 Table 2-3. Select Federal Activities Addressing Key Technology Deployment Barriers: Industry..........35 Table 2-4. Select Federal Activities Addressing Key Technology Deployment Barriers: Electric
Grid and Infrastructure ......................................................................................................40

Strategies for Commercialization and Deployment
vi
Table 3-1. Select Federal Activities Addressing Key Technology Deployment Barriers: Low-Emission, Fossil-Based Fuels and Power..........................................................................48
Table 3-2. Select Federal Activities Addressing Key Technology Deployment Barriers: Hydrogen...........................................................................................................................54
Table 3-3. Select Federal Activities Addressing Key Technology Deployment Barriers: Renewable Power and Fuels..............................................................................................61
Table 3-4. Select Federal Activities Addressing Key Technology Deployment Barriers: Nuclear Fission ...............................................................................................................................68
Table 4-1. Select Federal Activities Addressing Key Technology Deployment Barriers: Carbon Capture ..............................................................................................................................76
Table 4-2. Select Federal Activities Addressing Key Technology Deployment Barriers: Geologic Storage ...............................................................................................................82
Table 4-3. Select Federal Activities Addressing Key Technology Deployment Barriers: Terrestrial Sequestration....................................................................................................87
Table 5-1. Change in U.S. Methane Emissions from Energy and Waste (Tg CO2 equivalent) .................90 Table 5-2. Select Federal Activities Addressing Key Technology Deployment Barriers: Methane
Emissions from Energy and Waste....................................................................................94 Table 5-3. Select Federal Activities Addressing Key Technology Deployment Barriers: Methane
and Nitrous Oxide Emissions from Agriculture ................................................................99 Table 5-4. Select Federal Activities Addressing Key Technology Deployment Barriers:
Emissions of High-GWP Gases.......................................................................................104 Table 5-5. Select Federal Activities Addressing Key Technology Deployment Barriers: N2O
Emissions from Combustion and Industrial Sources.......................................................107 Table 6-1. Major Barriers Inhibiting Deployment of GHG-Reducing Technologies...............................111 Table 6-2. Summary of Major Barriers Inhibiting Deployment by Goal* ...............................................112 Table 6-3. Types of Deployment Activities by Technology Strategy* ....................................................113 Table 6-4. Types of Deployment Activities by CCTP Barrier* ...............................................................114

Executive Summary January 2009
vii
Executive Summary
This report examines Federal programs, policies, and measures that encourage the commercialization and deployment of technologies that reduce, avoid, or capture and store emissions of greenhouse gases (GHGs). Prepared in fulfillment of certain requirements of the Energy Policy Act, as amended in 2005, it inventories prospective technologies, assesses their current development status, identifies barriers, risks and other obstacles to their greater deployment, describes strategies to address these obstacles as a means for accelerating deployment, and outlines opportunities for the future. It is organized around four of goals of the U.S. Climate Change Technology Program’s (CCTP’s) Strategic Plan and considers 15 corresponding technology strategies individually, as shown in Figure ES-1.
Prospective Technologies. In accordance with the Act, nearly 400 technologies that have the potential to reduce GHG emissions are identified (Annex A). CCTP narrowed this larger set of GHG-reducing technologies to some 300 that were determined to be suitable for near-term commercialization and deployment by assessing their individual technological (though not necessarily economical) readiness.
Barriers. Significant challenges inhibit the greater deployment of many of these technologies. In this
report, six categories of barriers are defined and organized, with 20 sub-barriers providing further particularization (Table ES-1). Using this taxonomy, barriers specific to each of the 15 technology strategies are identified. These are further characterized as either critical or important, based on the degree to which the barriers are inhibiting deployment. The most prominent critical barriers are high costs, technical risks, market risks, and external costs and benefits. Other important barriers include lack of specialized knowledge, incomplete and imperfect information, infrastructure limitations, industry structure, and policy uncertainty. Table ES-2 summarizes the barriers analysis by goal.3 Barriers common to all GHG-reducing technologies include environmental externalities associated with GHGs
3 Table 6-1 in Chapter 6 summarizes the results of the barriers analysis by 15 technology strategies.
Figure ES-1. Key Goals and Technology Strategies
CCTP Goal 15 Technology Strategies
Reducing Emissions from Energy End-Use and Infrastructure
1. Transportation 2. Buildings 3. Industry 4. Electric grid and infrastructure
Reducing Emissions from Energy Supply
5. Low-emission, fossil-based fuels and power 6. Hydrogen 7. Renewable energy & fuels 8. Nuclear fission
Capturing and Sequestering Carbon Dioxide
9. Carbon capture 10. Geologic storage 11. Terrestrial sequestration
Reducing Emissions of Non-CO2 Greenhouse gases
12. Methane emissions from energy and waste 13. Methane and nitrous oxide emissions from agriculture 14. Emissions of high global-warming potential gases 15. Nitrous oxide emissions from combustion and
industrial sources

Strategies for Commercialization and Deployment
viii
and risks of adopting new technologies. Addressing the most common barriers in a broad fashion could significantly expand and accelerate uptake of GHG- reducing technologies.4
Deployment Activities. More than 300 Federal programs, policies, and measures are in force today or recently enacted whose objectives, in part, include the accelerated commercialization and deployment of technologies and practices that reduce GHGs (Annex B). These include a wide range of policy mechanisms, such as: information dissemination; voluntary standards-setting; tax and other financial incentives; mandates, rules, and regulations; demonstrations; and government procurement policies.
4 In an efficiently functioning market, absent significant market failures or other imperfections, high cost is usually not a barrier, per se, but a useful market signal indicating a technology is not economically viable due to poor performance or the existence of less costly competitors or substitutes. In the case of GHG emissions, the absence of a scheme to internalize external costs and benefits of rising atmospheric GHG concentrations suggests a market failure, but the extent to which high cost may be so attributed remains unclear (see also Box 1-1 in Chapter 1).
Some of these activities are crosscutting in nature, broadly affecting many if not all the identified GHG-reducing technologies, while others are tailored to address specific barriers or risks of particular technologies. There also are many coalitions, partnerships, and other collaborations that support the similar objectives. Federal activities are also complemented by programs undertaken at the State level (Annex C).
In Chapters 2 through 5 of this report, a discussion of each technology strategy is set within a context of taking stock of this existing policy context. To the extent that the deployment activities can be tied to the identified technologies, Figure ES-2 illustrates the breadth and diversity of such activities, match to the technologies determined to be suitable for deployment. The higher concentration of activities under the energy end use and energy supply goals reflects the high potential impacts to be gained by targeting these areas, as well as the state of technology development
(e.g., more of these technologies are closer to the commercialization and deployment stages). Although technology deployment strategies are illuminated by Chapters 2 through 5 and Annex B, an evaluation of the efficacy, cost and cost-effectiveness of each deployment activity is beyond the scope of this report.
Technology Assessments by Goal Energy End-Use and Infrastructure (energy efficiency) technologies tend to be more ready and cost-effective for large-scale near-term GHG mitigation. As described in Chapter 2, many of these are already displacing GHG emissions, thanks in large part to market forces (e.g., energy cost savings), but also to government programs, such as efficiency standards and other programs designed to overcome existing barriers, such as relatively high initial investment cost, perceived technical risk, and lack of specialized knowledge. All tend to impede the adoption of best practices, underscoring the value of workforce development. More broadly, there are fiscal, regulatory, and statutory barriers that appear to discourage implementation of innovative grid technologies, which could transform power systems
Table ES-1. Barrier Categorization
Barrier Category Sub-barriers
Cost Effectiveness
• High Costs • Technical Risks • Market Risks • External Benefits and Costs • Lack of Specialized Knowledge
Fiscal Barriers • Competing Fiscal Priorities • Fiscal Uncertainty
Regulatory Barriers • Competing Regulatory Priorities • Regulatory Uncertainty
Statutory Barriers • Competing Statutory Priorities • Statutory Uncertainty
Intellectual Property Barriers
• IP Transaction Costs • Anti-competitive Patent Practices • Weak International Patent Protection • University, Industry, Government
Perceptions
Other Barriers
• Incomplete and Imperfect Information • Infrastructure Limitations • Industry Structure • Misplaced Incentives • Policy Uncertainty

Executive Summary January 2009
ix
and electricity consumer markets. Further opportunities include reducing vehicle miles traveled, employing and enforcing well developed building codes for new construction and renovations, and facilitating and/or incentivizing further energy efficiency improvements in existing buildings and industries.
Energy Supply. In the long-term, transforming energy supply – fuels, heat and power that currently rely on fossil-fuels – toward a low GHG-emitting future is a crucial component of any strategy aimed at achieving U.S. climate change goals. Making timely progress toward this end requires accelerated deployment of innovative GHG-reducing technologies. Chapter 3 outlines the current situation for an array of GHG-reducing supply technologies and discusses barriers and risks that have been addressed, in part, and others that remain. Many Federal programs exist that encourage and support the commercialization and deployment of a diverse portfolio of energy supply technologies. These include financial incentives (tax credits, grants, low-cost loans, tax waivers) that help to offset high costs; technology demonstrations and loan guarantees that address technical and business risks; and information and labeling programs that facilitate market functioning and overcome knowledge shortfalls. Advances in complementary areas outside of energy supply (e.g., the electric grid, Chapter 2), are noted. Education, workforce development, and technology demonstration programs present additional
opportunities to address technical risks and lack of specialized knowledge.
Carbon Capture and Sequestration (CCS) technologies, if successfully developed and proven to be safe and environmentally acceptable, could emerge as a crucial element of U.S. and international strategies to reduce GHG emissions, especially in view of the dominance of fossil-fuels as the primary energy source in the near- to mid-term. Apart from technical barriers, currently addressed by research and development, Chapter 4 identifies many ongoing Federal activities that address other barriers to accelerated CCS deployment. These include technology demonstrations, grants and financial assistance to overcome technical risks and establish regional partnerships aimed at exploring institutional, regulatory, and other non-technical issues. CCS technologies still face a number of scientific and technical uncertainty as well as cost hurdles and policy uncertainty that can be addressed by clear market signals of the value of reducing GHG emissions, identification of liable parties and beneficiaries, proof of principle in scale-up of first of a kind facilities, and development of critical infrastructure.
Non-CO2 Greenhouse Gases. Although less heralded than carbon-dioxide, reducing emissions of non-CO2 GHGs afford significant near-term opportunities for reducing radiative forcing from accumulating GHGs in the atmosphere. Many of these GHGs have global warming potential much higher than that of CO2. Others (e.g., methane) have
Table ES-2. Summary of Major Barriers Inhibiting Deployment by Goal*
CCTP Goal Area
Hig
h C
osts
Tech
nica
l R
isks
Mar
ket R
isks
Exte
rnal
B
enef
its a
nd
Cos
ts
Lack
of
Spec
ializ
ed
Kno
wle
dge
Inco
mpl
ete
and
Impe
rfec
t In
form
atio
n
Infr
astr
uctu
re
Lim
itatio
ns
Indu
stry
St
ruct
ure
Polic
y
Unc
erta
inty
Energy End-Use and Infrastructure
Energy Supply
Carbon Capture and Sequestration
Non-CO2 Greenhouse Gases
*Checks indicate that a barrier is judged to be a critical or important obstacle to the deployment of two or more technology strategies within a particular CCTP goal area.

Strategies for Commercialization and Deployment
x
valued prices in the marketplace today, encouraging their capture and use. Because they arise from a wide variety of sources and are often process-specific, there is a diverse array of technologies to reduce such emissions. As discussed in Chapter 5, much progress has been made since 1990 through industrial awareness programs, development of cost-effective technical substitutes, and voluntary action. Current Federal activities include voluntary programs; tax policies and other financial incentives; education, outreach, and information dissemination; and public-private alliances and coalitions, including international partnerships. Some of more important barriers to the greater adoption of these technologies include the lack of internalizing external benefits and costs of emissions, the relatively high costs of deploying the technologies, technical risks, and lack of specialized knowledge. Codes, standards, technology demonstrations, and legislation also play a role. Further opportunities to address barriers exist, including improving workforce expertise to implement substitutes for high global warming potential (GWP) gases.
Continuing Stewardship, Analysis and Evaluation With hundreds of Federal programs, policies and measures in place today, augmented by additional
activities at the State and regional levels, and with annual investments of more than $4 billion in associated Federal R&D, GHG-reducing technologies are being deployed and barriers to their greater adoption are being addressed. Accelerated diffusion of these GHG-reducing technologies is expected as the existing and new Federal activities are implemented more broadly and take effect. However, realizing the full potential of these technologies, as documented in this report, is impeded in some important areas by significant barriers. Successful implementation of commercialization and deployment strategies for the key technologies identified in this report requires effective stewardship, including changes and updates, as may be appropriate. This report establishes a framework for moving forward, taking stock of existing efforts, and establishing a continuing process of analysis and evaluation. This includes examining future opportunities, as outlined in this report. It also includes evaluations of the efficacy, cost, and cost- effectiveness of existing activities, monitoring the implementation of newly enacted authorities, investigating key barriers, identifying gaps and opportunities, executing a process for providing recommendations, and weighing options for new policies and measures.
Figure ES-2. Deployment Activities Address the Use of Near-Term Technologies

Chapter 1 January 2009
1
Chapter 1. Strategies to Promote the Commercialization and Deployment of Greenhouse Gas Intensity-Reducing Technologies and Practices
This report on Strategies to Promote the Commercialization and Deployment of Greenhouse Gas Intensity-Reducing Technologies and Practices (C&D Strategies Report) presents a discussion and analysis of the Federal government’s policies and measures (PAMs) that help address barriers to and promote adoption of near-term and emerging greenhouse gas (GHG)-reducing technologies. These technologies can reduce, avoid, or capture and store GHG emissions, and are in place today or are nearly ready to be deployed.
The C&D Strategies Report is submitted to the President and Congress in fulfillment of the requirements of the 2005 amendments to Sections 1610(c)(1), 1610(e), 1610(g)(1) and 1610(g)(4)(A) of the Energy Policy Act of 1992.5 Recognizing that the
5 The Energy Policy Act of 2005 (EPAct 2005) Title XVI Subtitle A amends Sections 1610(c)(1), 1610(e), 1610(g)(1) and 1610(g)(4)(A) of the Energy Policy Act of 1992. The amendments direct a Cabinet-level committee to develop, submit to the President, and make public, a national strategy to promote the commercialization and deployment of GHG intensity-reducing technologies and practices. This report was prepared by CCTP on behalf of the Cabinet-level Committee on Climate Change Science and Technology Integration (CCCSTI) in fulfillment of these requirements.
multitude of technologies in the Federal research and development portfolio each raises unique issues and challenges, this document considers 15 separate technology strategies individually (Figure 1-1). This report covers current policies and programs that help promote deployment of GHG-reducing technologies within each of the 15 key technology strategies, identifies barriers, risks, and other obstacles to greater deployment, and characterizes them in ways that consider the varied circumstances of each area. While barriers may exist, their mention in this report in no way implies it is the responsibility of the Federal government to address every (or any) of them, in whole or in part. Other entities, such as industry, states, local and municipal governments or

Strategies for Commercialization and Deployment
2
international bodies often have jurisdiction over these matters. It may be inappropriate or even unconstitutional for the Federal government to undertake certain activities designed to combat barriers to C&D. The comprehensive and multifaceted U.S. strategy to addressing global climate change is science-based, fosters breakthroughs in clean energy technologies, and encourages coordinated global action in support of the United Nations Framework Convention on Climate Change (UNFCCC). The U.S. strategy includes policies and measures to reduce GHG emissions in the near-term; funding of climate science to inform policy and investment; financial support for new and improved GHG-reducing technology; international technology cooperation for global progress; and multilateral dialogues and collaboration on research, goals, finance and trade to help accelerate the broader adoption of clean and secure energy technologies and practices. The U.S. approach to climate change is described in a recent report to the United Nations, the U.S. Climate Action Report.6 Science and technology elements are
6 The U.S. Climate Action Report is the formal national communication under the United Nations Framework Convention on Climate Change (UNFCCC). It is submitted quadrennially (U.S. Department of State 2006).
further discussed in the strategic plans of the U.S. Climate Change Science Program (CCSP 2003) and the U.S. Climate Change Technology Program (CCTP 2006).7 The C&D Strategies Report presents links between Federal policies and programs to accelerate deployment8 and the technology R&D captured under CCTP to reduce GHG emissions. While the CCTP Strategic Plan focuses on the entire technology continuum – from fundamental research to commercial development – this report focuses solely on strategies to encourage near-term technology C&D. It provides a focus on what can and is being done to mitigate GHG emissions now and in the near future. The information presented in this C&D Strategies Report has been aligned with four of the CCTP Strategic Plan’s six strategic goals
focusing on reducing GHG emissions:9 1) Energy End-use and Infrastructure; 2) Energy Supply; 3) Carbon Sequestration; and 4) Non-CO2 Greenhouse Gases.
This approach provides for consistency for reporting on GHG-reducing technology activities across the Federal agencies. CCTP Working Groups for the four
7 U.S. Climate Change Technology Program Strategic Plan, U.S. Department of Energy (CCTP 2006), and associated analysis, as illuminated in Chapter 3. 8 To reduce the complexity of text, this report often uses “deployment” alone to imply “commercialization and deployment.” “Commercialization” refers to the sequence of actions necessary to achieve market entry and general market competitiveness of new innovative technologies, process and products. “Deployment” is the adoption of that commercial technology by users across the economy until the technology reaches market saturation. 9 In accord with the provisions of Title XVI, the Strategy is aimed at policies and measures promoting the commercialization and deployment (C&D) of GHG-reducing technologies. In this way, the C&D Strategy is differentiated from the R&D Strategy, the focus of which is on research to accelerate the development of a portfolio of advanced technologies, near- and long-term, by improving their performance and reducing their cost. Since cost and performance are often barriers to C&D, the two strategies are related. Where relevant, such complementarities are noted and discussed.
Figure 1-1. 15 Technology Strategies
End-Use Efficiency and Infrastructure Energy Supply
1. Transportation 2. Buildings 3. Industry 4. Electric Grid and Infrastructure
5. Low-Emission, Fossil-Based Fuels and Power
6. Hydrogen 7. Renewable Energy and Fuels 8. Nuclear Fission
Carbon Capture and Sequestration
Non-CO2 Greenhouse Gases
9. Capture 10. Geologic Storage 11. Terrestrial Sequestration
12. Methane from Energy and Waste
13. Methane and Nitrous Oxide Emissions from Agriculture
14. Emissions of High Global-Warming Potential Gases
15. N2O Emissions from Combustion and Industrial Sources

Elements of the C&D Strategies January 2009
3
GHG-reducing strategic goals, as well as key program offices for relevant sub-sectors, participated in the C&D Strategies Report’s development and review.
1.1 ELEMENTS OF THE C&D STRATEGIES
The Federal policies, activities, and measures described in this report address barriers to the widespread commercial deployment of clean energy and other GHG-reducing technologies such as wind, solar photovoltaics, high-performance buildings, combined heat and power in industry, and nuclear power. Additionally, these PAMs are designed to work effectively within the framework of our market economy. The key elements comprising the C&D Strategies include:
Technologies suitable for commercialization and deployment: Over 300 GHG-reducing technologies have been identified that are already available commercially or can be deployed in the near-term (see Annex A).
Barriers to commercialization and deployment: For certain technologies that are available today, economic, technological, regulatory and other barriers impede their commercial deployment.
Deployment activities: This report identifies approximately 300 Federal policies, activities, and measures in place today or recently enacted that help address many of the more significant barriers to the deployment of GHG-reducing technologies and practices (Annex B).
Process of continuous improvement: The U.S. approach incorporates continuous improvement of Federal programs. This helps ensure that Federal efforts keep pace with emerging technology and lessons learned. The constant learning process involves identifying gaps in activities, as well as new opportunities for accelerating technology use and understanding the effectiveness of existing policies and programs.
The following sections describe each of these elements in more detail and why they are critical to the strategic approach outlined in this report.
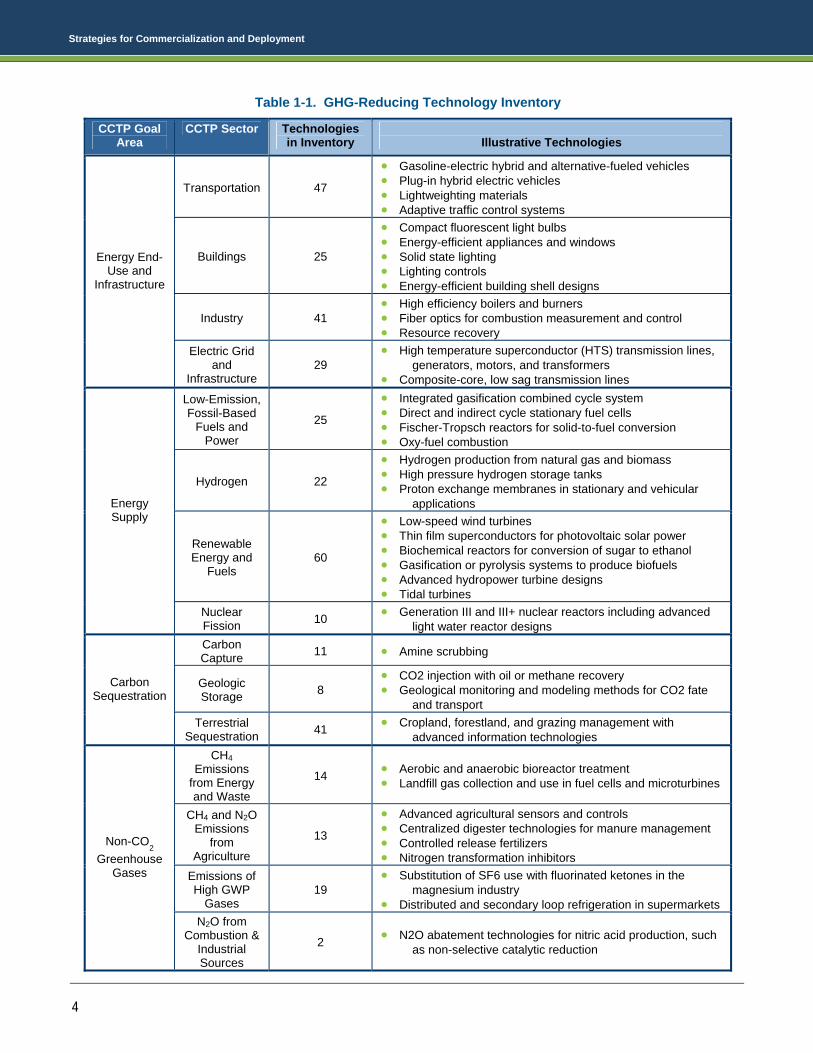
Technologies Suitable for Commercialization or Deployment To meet the required reductions will require a significant expansion of GHG-reducing technologies.10 Given the diversity of activities and processes that emit GHGs, achieving emission reductions on a large scale will likely require a combination of existing, improved, transitional, and advanced technologies. While some technologies can be deployed today, others will emerge over the next century. In some cases, transforming and modernizing the nation’s energy system – both supply and demand – in fundamental ways may be required. Scientific evidence is accumulating that suggests emission reductions need to begin immediately to offset dangerous anthropogenic interference with the climate system (Holdren 2006). The foundation of the C&D Strategies presented here is a solid understanding of the available GHG-reducing technologies, as well as the barriers to their deployment. This foundation will help guide the development, design, and implementation of effective Federally-supported deployment activities that have the potential to successfully overcome impediments to the widespread use of these technologies. Numerous technologies that can reduce GHG emissions already exist, but within a wide spectrum of technical readiness. Many are mature enough now to be used commercially, such as compact fluorescent light bulbs and hybrid vehicles. Others are in earlier stages of development, such as production of hydrogen from photobiological processes or Generation IV nuclear plants. For these C&D Strategies, “suitability for commercialization and deployment” is interpreted as a level of technical maturity such that the technology can be readied for commercial use now or imminently through product development (e.g., size, operational standards, production engineering, etc.), even if the technology faces economic, regulatory, or policy challenges that could inhibit its wider deployment. Table 1-1 illustrates the diversity and breadth of technologies included under the four CCTP strategic goal areas and sub-sectors included in the inventory 10 For example, one gigaton of emission reductions could be delivered by 1,000 zero-emission 500 MW coal-fired power plants with carbon capture and storage or by energy crops grown in an area 15 times the size of Iowa (Pacala and Socolow 2004).
Strategies for Commercialization and Deployment
4
Table 1-1. GHG-Reducing Technology Inventory
CCTP Goal Area
CCTP Sector Technologies in Inventory
Illustrative Technologies
Transportation 47
• Gasoline-electric hybrid and alternative-fueled vehicles • Plug-in hybrid electric vehicles • Lightweighting materials • Adaptive traffic control systems
Buildings 25
• Compact fluorescent light bulbs • Energy-efficient appliances and windows • Solid state lighting • Lighting controls • Energy-efficient building shell designs
Industry 41 • High efficiency boilers and burners • Fiber optics for combustion measurement and control • Resource recovery
Energy End-Use and
Infrastructure
Electric Grid and
Infrastructure 29
• High temperature superconductor (HTS) transmission lines, generators, motors, and transformers
• Composite-core, low sag transmission lines Low-Emission, Fossil-Based
Fuels and Power
25
• Integrated gasification combined cycle system • Direct and indirect cycle stationary fuel cells • Fischer-Tropsch reactors for solid-to-fuel conversion • Oxy-fuel combustion
Hydrogen 22
• Hydrogen production from natural gas and biomass • High pressure hydrogen storage tanks • Proton exchange membranes in stationary and vehicular
applications
Renewable Energy and
Fuels 60
• Low-speed wind turbines • Thin film superconductors for photovoltaic solar power • Biochemical reactors for conversion of sugar to ethanol • Gasification or pyrolysis systems to produce biofuels • Advanced hydropower turbine designs • Tidal turbines
Energy Supply
Nuclear Fission 10 • Generation III and III+ nuclear reactors including advanced
light water reactor designs Carbon Capture 11 • Amine scrubbing
Geologic Storage 8
• CO2 injection with oil or methane recovery • Geological monitoring and modeling methods for CO2 fate
and transport
Carbon Sequestration
Terrestrial Sequestration 41 • Cropland, forestland, and grazing management with
advanced information technologies CH4
Emissions from Energy and Waste
14 • Aerobic and anaerobic bioreactor treatment • Landfill gas collection and use in fuel cells and microturbines
CH4 and N2O Emissions
from Agriculture
13
• Advanced agricultural sensors and controls • Centralized digester technologies for manure management • Controlled release fertilizers • Nitrogen transformation inhibitors
Emissions of High GWP
Gases 19
• Substitution of SF6 use with fluorinated ketones in the magnesium industry
• Distributed and secondary loop refrigeration in supermarkets
Non-CO2
Greenhouse Gases
N2O from Combustion &
Industrial Sources
2 • N2O abatement technologies for nitric acid production, such as non-selective catalytic reduction

Elements of the C&D Strategies January 2009
5
of GHG-reducing technologies. The renewable energy and fuels category contains the greatest number of technologies, followed by transportation. This outcome reflects the many efforts to develop a variety of renewable energy sources to address GHG emissions from energy supply, as well as efforts to develop alternative transportation fuels and technologies to address energy end-use sectors. An outline of the complete inventory of technologies conducted for this report is provided in Annex A. Barriers to Commercialization and Deployment A firm understanding of existing barriers provides a basis for developing effective strategies to accelerate technology commercialization and deployment. It is important to keep in mind, however, the distinctions between barriers that result from market failures and government failures, and other types of barriers. The clearest role of government is to address the first two types of barriers. The situation is less clear for other types of barriers, such as high cost. There are many goods and services that markets provide in limited quantities because they cost too much for mass consumption. High cost is usually a market signal that a technology is not economically viable, and in the absence of other barriers, not ready to be deployed (Box 1-1).
With an environment characterized by relatively free trade, highly mobile capital, property rights protections, a high rate of invention and innovation, and limited government-ownership of energy industries, the United States boasts a remarkably well-functioning energy marketplace. Nevertheless, as this report shows, numerous barriers to the commercialization and deployment of GHG-reducing technologies do exist. New technologies and practices must overcome a range of technical, regulatory, policy, and market obstacles to gain widespread commercial use. These barriers can arise at every stage of the commercialization and deployment process. Many promising inventions fail to achieve widespread commercialization. In some cases, this failure can result from a lack of commitment or ability among investors to manage market, regulatory, or other risks (Berg 1988, Murphy and Edwards 2003). The entire process, from inception of research and development to commercialization and market entry, typically takes years. Widespread market penetration takes even longer as markets are conditioned, economies of scale ramp up, and learning curves advance. Consistent with the EPAct Title XVI language requesting a report on deployment barriers, six categories of barriers were examined: cost-effectiveness of the technology; fiscal, regulatory, and statutory barriers; intellectual property barriers; and
Box 1-1. Government Intervention in Addressing Barriers
This report identifies a number of barriers to the development and/or widespread penetration of various technologies. These barriers vary greatly in terms of both their nature and magnitude. As a result, best approaches for overcoming them will also vary. In many cases Federal intervention may not be necessary or even advisable. As a general matter, government remedies are most suited to overcoming genuine market failures or government failures. Market failure can for example include cases where a barrier results from underinvestment in basic research. Overcoming such a barrier may require the expenditure of public funds to produce that research. Another example of a market failure is the inability of the producer of a technology to capture the full benefits of that technology. This might occur with respect to the benefits of reduced greenhouse gas emissions in a world where such emissions are not appropriately priced through a tax or a cap-and-trade program. Government failure might include cases where a technology that crosses state or local boundaries faces a barrier due to incompatible state or local government regulatory schemes. Another instance of government failure may be antiquated Federal regulation that unintentionally inhibits technological advance. Other types of barriers may be best addressed and resolved by allowing market forces to work. For example, in the absence of a clear market or government failure as described above, high cost in and of itself is not a barrier that requires government intervention. Normally, market competition combined with the incentive to earn a profit is sufficient to identify and overcome barriers that warrant such an effort and to do so at the lowest possible cost. Government intervention in these instances runs a substantial risk of unintended consequences that fail to achieve the desired ends at the lowest cost.

Strategies for Commercialization and Deployment
6
“other” barriers. The categorization and applicability of barriers was further informed by an Oak Ridge National Laboratory study that identified and defined common barriers across sectors, as well as those unique to individual sectors and technologies (Brown 2007). Additional studies and expert opinion by contributors to this report from government, academia, and the private sector offered insights into the most important obstacles to each of the 15 technology strategies. Based on this input, CCTP defined a typology of 20 sub-barriers (“genres”) within the Act’s six barrier categories that offers greater articulation into the nature of the impediments (Table 1-2 and Table 1-3) and determined which barriers genres are significantly inhibiting deployment in each of the technology strategies (Chapters 2 – 5). Some of these were judged to be “critical” barriers, such that widespread C&D would likely be significantly impeded without a satisfactory remedy. Others were regarded as “important” barriers, meaning that widespread C&D would likely be slowed, but not stopped, without one or more remedies. Barriers were considered too complex and case-specific to prioritize their importance beyond the two categories of “critical” and “important”. The deployment of GHG-reducing technologies is affected by a diversity of issues ranging from high costs to barriers such as competing fiscal priorities, misplaced incentives, and the lack of accurate information (Table 1.2). Some of these barriers result from “market failures,” which are flaws in the way markets operate. Market failures prevent markets from operating efficiently; they cause prices to give false signals and thereby confound the communication between consumers and producers (Jaffe and Stavins 1994, Brown 2004, Taylor and Van Doren 2007). Examples of market failures pertinent to GHG-reducing technologies include monopolistic industry structures, misplaced incentives, incomplete and imperfect information, high transaction costs for patent filing and enforcement, and external benefits and costs. Government failures can inhibit greater deployment when fiscal policies, regulations, and statutes that may be beneficial in a broad context of public policy, compete with or conflict with the narrow objective of promoting C&D of certain GHG-reducing technologies. As a result, while providing overall benefits to society these policies may be found to hinder investment in clean energy technologies.
Regulation that unintentionally impedes technology advancement is an example of government failure (Box 1-2). Even in well-functioning markets, other obstacles can emerge that are not the result of market or government failures but nevertheless are real impediments to rapid deployment and market adoption of GHG-reducing technologies. For example, innovations may take time to benefit from cost-reducing learning curves before they can be competitive with pre-existing products that have already benefited from long-term technology development. The diffusion of innovations may require shifts in strongly entrenched consumer preferences, organizational structures, and activity patterns. In addition, major supply chain and infrastructure developments may be required, such as the training of specialized work forces and the creation of service and repair networks, warranties, insurance programs, and intellectual property portfolios. Many of the 20 sub-barriers described in Table 1-2 are interrelated and mutually reinforcing. While they are grouped into the six categories given in EPAct Title XVI, even these categories are not mutually exclusive. Consistent with the framework described earlier, four of the 20 sub-barriers have especially broad applicability and are particularly crosscutting. These are described below in more detail.
Externalities occur when important societal benefits and costs are “external” to the marketplace. Indeed, technologies may be difficult to deploy (without public intervention) if their principal benefits are entirely societal and external to the marketplace. For GHG-reducing technologies in the U.S., a key issue is that the “value” of reducing carbon (cost of carbon per unit reduction) is not currently governed by explicit carbon regulatory legislation. The value of carbon emissions reductions is often not considered when companies make capital investment decisions or when consumers make personal choices. When the owner/developer of a GHG-reducing technology cannot capture all of the benefits that might accrue to society, the result is under-investment in its development and a suboptimal supply of the technology. For example, internalizing climate

Elements of the C&D Strategies January 2009
7
Table 1-2. Typology of Barriers to Commercialization and Deployment of GHG-Reducing Technologies
Barrier Description
Cost-effectiveness of the Technology: These are barriers that prevent technologies from market entry and widespread penetration, such as high costs and technical and market risks. The requirement of specialized knowledge and unpriced externalities can also make it difficult for GHG-reducing technologies to compete in today’s market given current circumstances.
High Costs
High up-front costs associated with the production and purchase of many low-carbon technologies; high operations and maintenance costs typical of first-of-a-kind technologies; high cost of financing and limited access to credit especially by low-income households and small businesses.
Technical Risks
Risks associated with unproven technology when there is insufficient validation of technology performance. Confounded by high capital cost, high labor/operating cost, excessive downtime, lack of standardization, and lack of engineering, procurement and construction capacity, all of which create an environment of uncertainty.
Market Risks
Low demand typical of emerging technologies including lack of long-term product purchase agreements; uncertainties associated with the cost of a new product vis-à-vis its competitors and the possibility that a superior product could emerge; rising prices for product inputs including energy feedstocks; lack of indemnification.
External Benefits and Costs
External benefits of GHG-reducing technologies that the owners of the technologies are unable to appropriate (e.g., GHG emission reductions from substitutes for high GWP gases and carbon storage and sequestration). External costs associated with technologies using fossil fuels (e.g., GHG emissions and health effects from small particles) making it difficult for higher priced, GHG-reducing technologies to compete.
Lack of Specialized Knowledge
Inadequate workforce competence; cost of developing a knowledgebase for available workforce; inadequate reference knowledge for decision-makers.
Fiscal Barriers: These barriers relate to tax policies promulgated by governments that unequally impact markets in which a technology is expected to compete. Taxes and public subsidies are imposed in pursuit of the public good, but can become impediments to innovation and competition. Fiscal barriers that arise in the market are caused by uncertain, missing, and/or inadequate tax policies that distort or impede efficient market functioning. These barriers include fluctuating and variable tax incentives and tax advantages for GHG-intensive technologies.
Competing Fiscal Priorities
Distortionary tax subsidies that favor conventional energy sources and high levels of energy consumption; tax treatment favoring operating versus capital expenses that slow the pace of capital stock turnover; outdated tax depreciation schedules; standby charges, buyback rates and uplift fees for distributed generation; lack of marginal cost pricing and time-of-use rates.
Fiscal Uncertainty Short-duration tax policies that lead to uncertain fiscal incentives such as production tax credits; state and local variability in fiscal policies such as tax incentives and property tax policies; possible future fiscal penalties for GHG emissions.
Regulatory Barriers: These barriers are rules promulgated by governments that regulate or unequally impact markets in which a technology is expected to compete. Regulations are imposed in pursuit of the public good, but can become impediments to innovation and competition. Regulatory barriers that arise in the market are caused by uncertain, missing and/or inadequate rules that distort or impede efficient market functioning. These barriers include fluctuating, variable, and uncertain regulations.
Competing Regulatory Priorities
Distortionary regulations favor conventional energy sources and discourage technological innovation, including certain power plant regulations, rules impacting the use of combined heat and power, parts of the federal fuel economy standards for cars and trucks, and certain codes and standards regulating the buildings industry; burdensome and underdeveloped regulations and permitting processes can also inhibit GHG-reducing technologies.
Regulatory Uncertainty Uncertainty about future regulations of greenhouse gases; uncertainty about the disposal of spent nuclear fuels; uncertain siting regulations for off-shore wind; lack of codes and standards.

Strategies for Commercialization and Deployment
8
Table 1 2. Typology of Barriers to Commercialization and Deployment of GHG-Reducing Technologies (Continued)
Statutory Barriers: These are barriers related to statutes, which are the formal, written laws of a country or state. Typically, statutes command, prohibit, or declare policy in pursuit of the public good, but can become impediments to markets for GHG-reducing technologies. Municipalities may pass ordinances and regulations that have the force of law, but they are subordinate to statutes passed by the nation or a state. These barriers include fluctuating, variable, and uncertain statutory laws.
Competing Statutory Priorities Environmental permitting and building codes; lack of rate-based recovery mechanisms for energy-efficiency investments; ban on private wires crossing public streets; state laws that prevent energy saving performance contracting.
Statutory Uncertainty Uncertainty about future statutory laws, especially regarding the legal status of GHGs and property rights relative to surface injection of CO2, and sub-surface ownership of CO2 and methane.
Intellectual Property Barriers: U.S. intellectual property law, including patent law, is intended to stimulate innovation, entrepreneurship, and technology commercialization. However, the misuse of patent rights can impede same. In addition, transaction costs associated with obtaining patent protection and enforcing patent rights, as well as the anti-trust challenges related to technological collaboration and patent manipulation can be a barrier to the development of technology.
IP Transaction Costs Transaction costs for patent filing and enforcement, cognitive biases, systemic problems at the USPTO, and fear of anti-trust liability.
Anti-competitive Patent Practices
Practices that constitute patent misuse such as patent warehousing, submarining, suppression, and blocking.
Weak International Patent Protection
Inconsistent or nonexistent patent protection in developing countries and emerging markets.
University, Industry, Government Perceptions
Changing relationships among universities, national laboratories, and industry leaders concerning CRADAs.
Other Barriers: These are barriers that do not fall within the categories defined above. They include obstacles resulting from imperfect and costly information as well as infrastructure limitations such as inadequate electricity transmission to support wind development and shortage of key complementary technologies. This category also includes barriers associated with misplaced incentives, along with those inherent in industry structures such as natural monopolies and fragmentation. Policy uncertainty is another component of this category.
Incomplete and Imperfect Information
Lack of information about technology performance, especially trusted information; bundled benefits and decision-making complexities; high cost of gathering and processing information; misinformation and myths and lack of socio-technical learning.
Infrastructure Limitations
Inadequate transmission lines, liquid natural gas terminals, waste storage repositories, and other enabling infrastructures; shortage of key complementary technologies such as large-scale electric storage that encourage investment or broaden the market for GHG-reducing technologies; insufficient supply and distribution channels; lack of O&M facilities and other supply chain shortfalls.
Industry Structure Natural monopoly in utilities disenabling small-scale competition; industry fragmentation slowing technological change, coordination, and limiting investment capital.
Misplaced Incentives Misplaced incentives when the buyer/owner is not the consumer/user (e.g., landlords and tenants in the rental market and speculative construction in the buildings industry).
Policy Uncertainty Uncertainty about future environmental and other policies.
*Experts have identified these barriers to the commercialization and deployment of GHG intensity-reducing technologies and practices. However, recognizing their existence in no way implies it is the responsibility of the Federal government to address every (or any) barrier, in whole or in part.

Elements of the C&D Strategies January 2009
9
change mitigation benefits from capturing and storing carbon would encourage investments in carbon capture, storage and sequestration technologies. From another aspect, social costs associated with technologies using fossil fuels (e.g., impacts of climate change) are not internalized by the market, making it difficult for higher priced, GHG-reducing technologies to compete.
High costs mean that some combination of the capital cost of the technology, its cost of operations, or other aspects of a project that employs the technology yield a product that costs too much relative to other options that perform essentially the same function. High costs of a technology deter investments making it difficult to justify providing capital to the high-cost technology or financing the use of its outputs in the absence of deployment assistance.
Technical risks are those associated with unproven technology, which occur in the early stages of innovation diffusion when there is insufficient
validation of technology performance. It also can result from excessive downtime, lack of standardization, and lack of engineering, procurement and construction capacity, all of which create an environment of uncertainty that the innovation will be able to perform to specifications.
Market risks refer to uncertainties associated with the cost of a new product vis-à-vis its competitors, and the new product’s likely acceptance in the marketplace. It includes the risk of long-term demand that falls short of expectations, lower-than-expected prices for competing products, the possibility that a superior product could emerge, rising prices for inputs including energy feedstocks, lack of long-term purchase agreements for outputs, and transportation constraints for inputs and outputs.
In general, the cost of technology declines as risks are addressed (Kammen and Nemet 2007). Actions such as operating experience gained by first adopters, increased scale of production by manufacturers, greater confidence in technology by regulators and insurers, and experience gained by project engineers and construction companies can all impact risk and lower cost. Technological improvements drive costs down as well, and early commercial deployments can stimulate these improvements. As Table 1-2 illustrates, the barriers and challenges to commercialization and deployment of new technology can be daunting and highly complex, given the nature of our economy and the technologies that support it. With this broad spectrum of barriers, it is not surprising that over 300 Federal activities are in place or recently enacted to help address these impediments and effect market transformations.
Table 1-3. Barriers
Barrier Category Sub-barriers
Cost Effectiveness
• High Costs • Technical Risks • Market Risks • External Benefits and Costs • Lack of Specialized Knowledge
Fiscal Barriers • Competing Fiscal Priorities • Fiscal Uncertainty
Regulatory Barriers • Competing Regulatory Priorities • Regulatory Uncertainty
Statutory Barriers • Competing Statutory Priorities • Statutory Uncertainty
Intellectual Property Barriers
• IP Transaction Costs • Anti-competitive Patent Practices • Weak International Patent Protection • University, Industry, Government
Perceptions
Other Barriers
• Incomplete and Imperfect Information • Infrastructure Limitations • Industry Structure • Misplaced Incentives • Policy Uncertainty

Strategies for Commercialization and Deployment
10
Deployment Activities More than a dozen Federal agencies are engaged in efforts that promote deployment of cleaner, more energy-efficient technologies for energy end-use and supply, carbon capture, storage and sequestration, and the reduction of non-CO2 GHGs such as methane, nitrous oxides, and others. Today’s Federal deployment activities reflect a broad climate change strategy that emphasizes more widespread adoption of technology innovation through Federal incentives and policies that promote or ease the path to market adoption.
The diversity of policies and programs now ongoing is as wide-ranging as the technologies they are intended to deploy. Major activities are categorized by policy type in Figure 1-2, and example activities are illustrated in Table 1-4. While many promote market transformation or conditioning in some form, others seek to reduce the technical and market or business risks associated with technology deployment. Others attempt to leverage the resources and expertise that can be tapped through strategic partnerships with the public and private sectors, both here and abroad.
Box 1-2. Competing Fiscal, Regulatory, and/or Statutory Priorities
Fiscal policies, regulations, and statutes provide broad societal benefits that increase overall economic welfare, but they can inadvertently disfavor certain segments of the economy, including, in some cases, inhibiting the commercialization and deployment of GHG-reducing technologies. When applied to the context of this report, these policies are referred to as “competing fiscal, regulatory, and/or statutory priorities” and considered a barrier to deployment. Many competing priorities result from policies established years ago for a public purpose that could be better addressed in other ways today. As one example, consider the universal ban on private electric wires crossing public streets, which was established originally to maintain safety on roadways by preventing the introduction of low-hanging wires. By forcing would-be power entrepreneurs to use their competitors’ wires – often at a high cost – this ban penalizes local generation, which offers the potential for high-efficiency power delivery (Casten and Ayres, 2007). In today’s mature electric marketplace, specifications could be designed to permit private wires while also addressing safety and visual concerns. Competing priorities also arise as a result of legal inertia. For example, building codes and standards take a long time to adopt and modify; as a result, they can be slow to adapt to technology advances and therefore inhibit innovation. Similarly, environmental standards that propelled the large-scale reduction of acid rain in the 1980s grandfathered the oldest fleet of coal plants, thereby enabling the continued operation of some of the most polluting power generators in the country far beyond their normal life and disincentivizing investments in plant upgrades. Competing policies caused by outdated fiscal rules include the IRS business deductions for the purchase of large light trucks (> 6,000 lbs). Originally promulgated to assist small businesses, today this subsidy encourages the purchase of SUVs even when there is no business justification for the larger vehicle and a smaller passenger vehicle would be sufficient. Similarly, tax depreciation schedules put into place more than two decades ago as part of the IRS Tax Reform Act of 1986 have not kept up with technology breakthroughs and inhibit the advance of some modern low-carbon technologies. For example, back-up generators (which provide reliability at the expense of energy efficiency and clean air) are depreciated over three years, while a new combined heat and power system (would provide both reliability and energy efficiency) is depreciated over 20 years. The use of traditional rules-of-thumb for allocating tax dollars and regulated revenues can also create conflicting priorities that impede GHG-reducing technologies. Allocation based on levels of activity is a traditional public finance principle, but it can promote the inefficient use of resources. For example, the apportionment of resources from the Federal Highway Trust Fund based on vehicle miles traveled rewards the growth of transportation energy use. Similarly, utility company profits in traditionally regulated electricity markets, are a function of electricity sales to customers. As a result, energy efficiency and distributed generation including rooftop solar photovoltaics can reduce utility profits, thereby discouraging this important set of stakeholders from promoting these clean energy options. Under current rate designs, companies that own transmission lines also benefit from electricity throughput, and find their profits reduced by energy efficiency programs. Similarly, it is common for state constitutions to limit the obligation of public revenues to the current fiscal year and prohibit multi-year contracts that would obligate funds in advance of their annual appropriation cycle. In many states, these administrative rules effectively prohibit financing by energy services companies to upgrade the energy efficiency of government-owned buildings (Brown and Chandler 2008).

Elements of the C&D Strategies January 2009
11
Deployment activities are designed to promote GHG-reducing technologies and practices through far-reaching policies that cross numerous sectors of the economy, as well as purposefully targeted actions that address unique barriers in specific market and technology segments. The diversity and potential cross-fertilization of some of the major activities (those undertaken most often) are illustrated in Table 1-5. A more complete description of Federal deployment activities now underway or recently enacted is provided in Annex B. While not intended to be exhaustive, Annex B provides a good perspective of the breadth of program, policies, and measures and highlights the major focus of these efforts. Non-Federal Greenhouse Gas Technology Deployment Activities
While the Federal portfolio provides a wide mix of deployment activities, emphasizing industry cooperation and market forces, state and local governments and NGOs are currently leading a myriad of additional activities that support, enhance, and build upon the Federal strategy. Annex C summarizes some of the activities that are currently being undertaken at the state level.
Many state and local governments have also initiated standards, mandates, and financial incentives to encourage deployment of low- or zero-GHG and low- or zero-fossil energy technologies. According to the U.S. General Accountability Office (GAO 2006), 22 states require or encourage electricity generation from renewable energy sources through renewable portfolio standards, 39 states have required electric utilities to connect renewable energy sources to the electric grid, and 45 states offer financial incentives to promote additional deployment of renewable energy.11 In addition to various state and local level activities, activities of private entities, such as the Leadership in Energy and Environmental Design (LEED) Green Building Rating System™ from the U.S. Green Building Council have been influential in establishing nationally accepted benchmarks for the design, construction, and operation of more “sustainable” homes and businesses, which includes reduced energy use and greenhouse gas emissions. In addition, the Business Roundtable, an association of chief
11 As a complement to the information in Annex C, detailed information on state activities can be found at DSIRE, a comprehensive source of information on state, local, utility, and federal incentives that promote renewable energy and energy efficiency.
Figure 1-2. Federal Policies to Reduce GHGs, by Type of Policy and Measure
96
77
75
74
36
36
33
32
23
12
5
0 20 40 60 80 100 120
Labeling & Information Dissemination
Coalitions & Partnerships
Education, Training, and S&T Workforce Development
Tax Policy and Other Financial Incentives
Technology Demonstration
Market Conditioning including Government Procurement
International Cooperation
Codes and Standards
Legislative Act of Regulation
IP and Tech Transfer Policies
Risk Mitigation
Number of Activities
96
77
75
74
36
36
33
32
23
12
5
0 20 40 60 80 100 120
Labeling & Information Dissemination
Coalitions & Partnerships
Education, Training, and S&T Workforce Development
Tax Policy and Other Financial Incentives
Technology Demonstration
Market Conditioning including Government Procurement
International Cooperation
Codes and Standards
Legislative Act of Regulation
IP and Tech Transfer Policies
Risk Mitigation
Number of Activities Source: CCTP/Energetics Deployment Inventory Database dated January 2009 Note: Some activities fit into more than one category, so the total count exceeds the total number of identified activities (306). The figure does not include activities that are authorized but not implemented. See Annex B for details.

Strategies for Commercialization and Deployment
12
executive officers of leading U.S. companies, operates a program called Climate RESOLVE that provides education and support to companies developing GHG management programs.
Process of Continuous Improvement With enactment of EPAct 2005, the Energy Independence and Security Act of 2007 (EISA), and the Omnibus Appropriations Act for Fiscal Year 2008, a number of significant new policy developments occur pertinent to the purposes of Title XVI. These laws strengthen aspects of existing
Table 1-4. Major Federal Deployment Activity Components
Labeling and information dissemination
Effective dissemination of information raises awareness of both consumers and private industry involved in technology end-use. For example, the DOE-EPA ENERGY STAR® Program rates products based on energy and fuel efficiency and provides labels that help consumers make informed choices. Other programs focus on widely disseminating information on how to implement technologies or practices that can potentially reduce GHG emissions.
Financial incentives, including tax policies and loan guarantees
Financial incentives provide economic support for technology deployment. For instance, the USDA is utilizing its conservation programs to provide incentives to increase carbon sequestration in soils and trees, and reduce methane and nitrous oxide emissions from crop and animal agricultural systems. The Energy Policy Act of 2005 provides for approximately $1.6 billion in tax credits and incentives in fiscal year 2007 to accelerate the market penetration of GHG-reducing technologies. The Act also authorized a new DOE program that will guarantee up to $4 billion of loans in 2007 to early commercial projects that employ advanced GHG- or air pollution-reducing technologies (Title XVII).
International cooperation
A number of programs are responding to the need for a global commitment. For example, the Asia-Pacific Partnership on Clean Development and Climate, comprised of six countries representing 50 percent of the world’s economy, includes nearly 100 programs and actions that are currently underway in eight public-private task forces: aluminum, buildings and appliances, cement, cleaner fossil energy, coal mining, power generation and transmission, renewable energy and distributed generation, and steel.
Voluntary partnerships with private industry
Voluntary public-private coalitions and partnerships engage a broad spectrum of stakeholders to share information, ideas, expertise, and resources. For example, the EPA’s Climate Leaders and SmartWay Transport Partnership work with industry and transportation sectors on specific commitments to reduce emissions. Cooperation with the private sector has led to GHG commitments from 14 industrial sectors and more than 100 corporations (CEQ 2007).
Technology demonstrations
Technology demonstration and validation at commercial or near-commercial scale reduces technical and business risk by proving performance and enhancing commercial acceptability. This paves the way for private investment in new technologies and accelerates their movement into the commercialization pipeline. DOE’s Wind Energy Program, for example, works with stakeholders and officials to determine how wind energy can be integrated into their energy systems. DOE’s FreedomCAR program provides demonstration activities critical to accelerating the deployment of advanced vehicle technologies.
Codes and standards
Standardization can enable market advancement of cost-effective GHG-reducing technologies by ensuring consistency in the efficiency and performance of products and services. For example, DOE's Building Energy Codes Program works with state and local jurisdictions, national code organizations, and industry to promote stronger, but cost-effective, building energy codes and help states adopt, implement, and enforce those codes. The DOT has recently implemented a new fuel economy standard for light trucks, and 15 new appliance efficiency mandates have been established by EPAct 2005 (DOE 2006a).

Elements of the C&D Strategies January 2009
13
policy, establish new mandates, and expand authorities in areas related to C&D objectives. EISA 2007, for example, provides new mandates for energy efficient improvements in buildings, industry, lighting and appliances. In addition, it provides new mandates for Administration proposals for significant increases in fuel economy for automobiles and light trucks, and expanded use of alternative fuels with its biofuels mandate. The Omnibus Appropriations Act provides expanded authority for loan guarantees in several technology areas. As a result, there are more than 70
new or expanded authorities or mandates arising from recently enacted legislation. The C&D Strategies integrate new developments into a large array of existing policies and measures. This portfolio of policies and measures help address many of the critical challenges to greater C&D. Accelerated diffusion of GHG intensity-reducing technologies is expected as the existing and new PAMs work their effects and markets respond. For example, the EIA Annual Energy Outlook for 2008
Table 1-5. Major Deployment Activities by Selected CCTP Sectors*
CCTP Goal Area CCTP Sector
Educ
atio
n,
labe
ling
and
info
rmat
ion
diss
emin
atio
n
Tax
polic
y an
d ot
her f
inan
cial
in
cent
ives
Inte
rnat
iona
l
Oth
er
coal
ition
s/
part
ners
hips
Tech
nolo
gy
dem
onst
ratio
n
Mar
ket
cond
ition
ing
incl
udin
g go
vern
men
t pr
ocur
emen
t
Transportation 54 29 15 24 12 16
Buildings 58 21 15 22 5 20
Industry 45 14 13 28 6 4
Energy End-Use and
Infrastructure
Electric Grid and Infrastructure 19 7 12 11 6 4
Low-Emission, Fossil-Based Fuels and Power 23 15 14 8 6 5
Hydrogen 11 6 5 2 4 3
Renewable Energy 48 30 19 19 11 18
Energy Supply
Nuclear Fission 7 4 7 3 2 2
Carbon Capture 5 5 6 4 4 2
Geologic Storage 4 4 7 4 3 2 Carbon Sequestration
Terrestrial Sequestration 18 12 8 7 2 5
Methane Emissions from Energy and Waste 14 3 9 7 1 1
Methane and Nitrous Oxide Emissions from
Agriculture 8 7 6 1 0 1
Emissions of High Global-Warming Potential Gases
17 3 6 15 0 1
Non-CO2 Greenhouse
Gases
Nitrous Oxide Emissions from Combustion and
Industrial Sources
14 9 7 10 3 2
* Activities in columns are not additive; some apply to multiple sectors. Only selected policy measure categories are shown in this table. The count does not include activities that are authorized but not implemented. See Annex B for details.

Strategies for Commercialization and Deployment
14
(EIA 2008) estimates CO2 emission reductions due to the implementation of EISA in its projection to 2030. The realization of the full technical potential of the GHG intensity-reducing technologies may still be impeded in some areas by significant barriers. The C&D Strategies framework for continuing analysis and evaluation, involving continuous improvement of program management, includes the following: (a) evaluate existing activities with respect to their cost and effectiveness; (b) monitor implementation of new or expanded authorities; (c) explore the nature and circumstances of barriers, including behavioral research that can potentially illuminate more effective strategies; (d) identify high-priority gaps and opportunities against the suite of existing or newly authorized PAMs and minimize duplication; (e) carry out a process for proposing and effecting administrative reforms to existing PAMs, where found costly or ineffective, or their elimination; and (f) weigh options for new policies and measures, such as development of carbon weighted incentives that are technology neutral, development of incentives that are long lasting that provide regulatory certainty and clear market signals for investment in technology. Continued implementation of successful programs that support GHG-reducing technologies requires effective stewardship by all involved parties in both the public and private sector. It also requires a continuing process of evaluation of progress toward strategic goals, periodic reviews of strategy as new technologies or barriers emerge, assessments of the adequacy of existing policy to promote technology C&D, identification of remaining gaps and opportunities, and follow-up with corrective action, as appropriate. Diligent stewardship along these lines will move the United States forward toward attainment of its climate change goals.
1.2 STRATEGIES FOR TECHNOLOGY SECTORS
In developing programs that promote deployment of GHG-reducing technologies, an important step is identifying the critical, persistent, and unique challenges. Inherently, technologies that reduce GHGs from energy end uses, such as transportation and buildings, will face different impediments to deployment than renewable resources and other energy supply options. Technologies to capture, store,
and sequester carbon dioxide face barriers that are different from those that mitigate high Global Warming Potential (GWP) gases from industry and nitrous oxide from agriculture. While cost challenges, market risks, information gaps, and other issues may be common across many technologies and sectors, others (such as infrastructure limitations or regulatory barriers) may be quite distinct, necessitating tailored approaches to fostering commercialization and deployment. Chapter 2 through Chapter 5 describe how each of the key elements – technologies, barriers, and deployment activities – are woven together to help address sector-specific challenges to commercialization and deployment of new technology. The effective integration of these elements is at the heart of the C&D Strategies and essential to achieving goals. For each of the 15 key technology strategies, the following topics are covered:
Introduction – Discusses the potential GHG mitigation effects that successful deployment may achieve and summarizes the long-term strategy and short-term actions to facilitate progress.
Technologies Suitable for Deployment – describes selected near-term technologies and their level of technology maturity and market penetration.
Barriers to Deployment – identifies and describes barriers that inhibit rapid and widespread utilization, including a short list of the most important obstacles unique to the sector.
Commercialization and Deployment Strategy – outlines the breadth and nature of Federal deployment activities currently in place to address existing deployment barriers.
Potential Opportunities and Gaps – highlights a few areas where gaps exist specific to each technology sector.
Chapter 6 concludes the report with a crosscutting synthesis of the findings and implications of the sector strategies presented in Chapters 2-5. It summarizes the commonalities through the different technology strategies such as reoccurring barriers. The most common and critical barriers to the commercialization and deployment of GHG mitigation technologies are identified and aligned with Federal deployment activities. This “global”

Strategies for Technology Sectors January 2009
15
perspective gives an indication of where the most prevalent barriers exist and how they are being addressed under today’s Federal policies and programs. It is important to note that while the inventory of deployment activities presented in this report is extensive, the Federal programs listed do not represent every activity currently underway; only relatively major efforts are listed. Precise numbers of relevant deployment activities are frequently provided in this report and are illustrative of the general order of magnitude of active Federal programs, policies, and measures (see Annex B). Additionally, this report does not address or attempt to evaluate the effectiveness of today’s deployment activities, does not imply that additional Federal action is necessary or warranted, and does not identify whether specific barriers could be removed through non-Federal actions such as those of state governments, local governments, or private groups (see Box 1-3). The overviews in Chapters 2-5 illustrate that the Federal government is in fact implementing actions today that may help to reduce barriers to deployment of technologies to mitigate GHG emissions. Collectively these deployment activities represent the
current C&D Strategies for deploying GHG-reducing technologies.
Box 1-3. Scope and Limitations of the Report
The report examines the market readiness of new technologies critical to meeting climate change goals, characterizes barriers, risks, and other obstacles to greater deployment of greenhouse gas-reducing technologies now and in the near future, and documents what the Federal government is doing to encourage deployment of these technologies. It draws conclusions about the current situation, identifies gaps and opportunities, and suggests analytical principles to assess and formulate policies and measures to accelerate the commercialization and deployment of these technologies. However, the report does not delve into associated topics or analyses that would inform a more complete treatment of climate change technology and policy issues. Outside of the focus of this report and not included are issues such as the following: • Evaluation of the market limitations and technical potential of new technologies. • Assessment of natural resource requirements, such as the potential availability and quality of raw
materials, and about tradeoffs among competing natural resource interests associated with specific technology options.
• Representation of every new technology under development and every deployment activity currently underway. Activities are limited to a portrayal of relatively major technologies and efforts.
• Evaluation of the effectiveness of existing policy and C&D activities. • Implication of responsibility from the Federal government, or other entities, such as industry, states, local
and municipal governments or international bodies, to undertake activities to encourage C&D. • Assessment, recommendation, or prioritization regarding the most important future policy actions. • Explanation of why a barrier is not considered critical or important to furthering deployment of a
technology. • Consideration of how the barriers analysis would change under possible future policy scenarios, such as
the addition of a value for carbon emissions.

Strategies for Commercialization and Deployment
16

Chapter 2 January 2009
17
Chapter 2. Energy End Use
End-use energy efficiency offers some of the greatest near-term opportunities for large-scale GHG mitigation. Numerous energy-efficiency improvements are currently available and cost-effective, and are already displacing carbon emissions. To accelerate the market penetration of these technologies, the Federal government’s deployment activities are focused on disseminating information to consumers, developing public-private partnerships, and establishing codes and standards. The latter is often accomplished in coordination with state and local governments (Figure 2-1). Corporate Average Fuel Economy (CAFE) standards, ENERGY STAR product specifications, and efforts to help diminish GHG emissions in the most energy-intensive
industrial facilities are just three of the more than 200 programs, policies, and initiatives identified in Annex B operating in this area today. The Energy Independence and Security Act of 2007 (EISA 2007) is particularly notable in the emphasis it places on strengthening the nation’s strategy for improving energy efficiency. In addition to promulgating stricter federal CAFE standards for the first time in over 20 years, the Act authorizes numerous additional energy efficiency deployment measures, such as new lighting and appliance standards and tighter energy efficiency goals for federal facilities. As a package, the Act’s energy efficiency deployment activities are forecast by the
Figure 2-1. Federal Policies to Reduce GHGs in Energy End Use, by Type of Policy and Measure
76
61
58
48
29
25
23
19
12
4
2
0 10 20 30 40 50 60 70 80
Labeling & Information Dissemination
Coalitions & Partnerships
Education, Training, and S&T Workforce Development
Tax Policy and Other Financial Incentives
Market Conditioning including Government Procurement
Codes and Standards
Technology Demonstration
International Cooperation
Legislative Act of Regulation
Risk Mitigation
IP and Tech Transfer Policies
Number of Activities
76
61
58
48
29
25
23
19
12
4
2
0 10 20 30 40 50 60 70 80
Labeling & Information Dissemination
Coalitions & Partnerships
Education, Training, and S&T Workforce Development
Tax Policy and Other Financial Incentives
Market Conditioning including Government Procurement
Codes and Standards
Technology Demonstration
International Cooperation
Legislative Act of Regulation
Risk Mitigation
IP and Tech Transfer Policies
Number of Activities Source: CCTP/Energetics Deployment Inventory Database dated January 2009 Note: Some activities fit into more than one category, so the total count exceeds the total number of identified activities (214) listed in this area. The figure does not include activities that are authorized but not implemented. See Annex B for details.

Strategies for Commercialization and Deployment
18
Suitable Transportation Technologies: Vehicle Examples
Hybrid Electric Vehicles (HEVs) – HEVs use a combination of electric and mechanical power to reduce greenhouse gas (GHG) emissions by nearly one-half compared to conventional gasoline vehicles.
Alternative Fuel Vehicles (AFVs) – AFVs can run on non-petroleum fuels (e.g., ethanol, propane, natural gas) and enable higher combustion efficiencies that reduce GHG emissions. More than 890,000 HEVs and AFVs were sold in the United States in 2005 (EIA 2005).
Transit Buses – In addition to providing significantly more mileage per passenger than cars and trucks with single passengers, transit buses also use GHG emission-reducing technologies such as compressed natural gas spark-ignited engines and diesel hybrid electric systems.
American Council for an Energy Efficient Economy to reduce carbon dioxide emission in the United States by nine percent in 2030 relative to a “business as usual” future (ACEEE 2007). The hundreds of Federal energy efficiency deployment activities are described in the following four sections, focusing on transportation, buildings, industry, and the electric grid. Each section describes the deployment strategies constructed for each end-use energy sector and how major deployment barriers are being addressed.
2.1 TRANSPORTATION The transport of people, goods, and services accounts for a significant share of global energy demand, mostly in the form of petroleum. On a global scale, combustion of transportation fuels accounts for 20.3 percent of CO2 emissions (IEA 2006); over the next few decades the transportation sector is expected to be one of the fastest growing sources worldwide of GHG emissions, mainly CO2. Figure 2-2 illustrates U.S. petroleum production and consumption projected to the year 2030. Much of the projected growth is attributed to the rapidly growing demand for petroleum-based transportation fuels in non-OECD economies, which are forecast to increase at 2.3 percent per year as compared with the OECD countries, which are forecast to increase at only 0.8 percent per year (EIA 2006b).
In the United States, the transportation sector accounted for 33 percent of total CO2 emissions in 2006, with highway vehicles accounting for approximately 84 percent (EPA 2008). Over the last 10 years, vehicle miles traveled – a telling measure of highway transportation demand – increased at an average rate of 2.5 percent per year, outpacing population growth. Without focused actions to address transportation related emissions, growth in U.S. transportation energy use and GHG emissions through 2025 is projected to be strongly impacted by the growth in light-duty trucks.12 U.S. freight tonnage is also expected to grow by 70 percent during the first two decades of the 21st century (DOT 2002). The C&D strategies for advancing energy efficiency in the transportation sector focus on transportation technologies and practices that can be deployed today or in the near future whose broader application in the marketplace could contribute significantly to reduced GHG emissions. Most of these technologies provide other benefits as well, such as improving urban and regional air quality and enhancing energy security by reducing oil import dependence. Advanced technologies can make significant contributions to reducing CO2 emissions from transportation-related activities. In the long term, technologies such as cars and trucks powered principally by advanced internal combustion engines,
12 Light duty trucks are defined primarily as pickup trucks, vans, and sport utility vehicles, under 8,500 lb gross vehicle weight rating.
Figure 2-2. U.S. Petroleum Production and Consumption 1970–2030
Sources: Transportation Energy Data Book: Edition 25 (Davis and Diegel 2006) and projections from the Annual Energy Outlook 2006 (EIA 2006a)

Transportation January 2009
19
hybrid power trains, hydrogen, bio-based fuels, and electricity show promise for achieving a transportation system with much lower highway CO2 emissions, or perhaps even zero net CO2 emissions. Such a future will require a combination of advances in vehicle technology, fuels, and transportation systems. Many public and private sector R&D programs are contributing to progress in this area.13 Technologies Suitable for Deployment The CCTP Strategic Plan (CCTP 2006) outlines some of the most promising GHG intensity-reducing concepts associated with transportation energy use. These include lightweight materials, improved vehicle efficiency, electric-fuel engine hybrids (“hybrid-electric” vehicles and “plug-in hybrids”), clean diesel engines, and the use of hydrogenated low-sulfur gasoline. Other options include alternative fuels such as ethanol, natural gas, electricity with storage, and biodiesel. In aviation, the next largest category of transportation energy demand after highway use, GHG emissions could be lowered through new technologies including improved engine designs, fuel blends, and air traffic management systems. Finally, reductions could result from modal shifts (e.g., from highway modes to rail, facilitated by improved intermodal connections), higher load factors, improved overall transportation system-level efficiency, better freight hauling efficiencies, and reduced idling by heavy-duty vehicles. Intelligent transportation systems can reduce congestion, resulting in decreases in fuel use. Several vehicle designs have either already begun to sell into mass markets or have near-term potential to penetrate the market. The sale of gasoline-electric hybrids, for example, has grown significantly in recent years while plug-in hybrids are capable of even greater fuel economy and gasoline displacement with electricity. While much effort is still going into the development of plug-in hybrids, a few prototypes have been successfully tested, and plans are underway to have production scale models marketed in a few years. Lithium-ion batteries provide electric power for existing and next generation hybrids that continue to be developed. Alternative fuel vehicles are also capable of being commercialized in the near term. Many flex-fuel vehicles, which can utilize either ethanol or gasoline, are commercially available today.
13 See Chapter 4, Strategic Plan (CCTP 2006)
The technology for other alternative fuel vehicles, such as biodiesel, natural gas, and propane, currently exists for commercial use as well. In addition, prototype hydrogen fuel cell and hydrogen internal combustion engine vehicles, as well as hydrogen-refueling infrastructure, have been developed and demonstrated. Regardless of the powertrain or vehicle, lightweight technologies can profoundly affect fuel efficiency. A reduction of as much as 50 percent of a vehicle's weight can increase efficiency by more than 30 percent in automobiles. These lightweight technologies include the use of alternative materials, such as increased use of aluminum, carbon fiber, or polymer composites. Many of these are in use today in light duty and heavy duty vehicles, aviation, and marine transportation. Lastly, many technologies are either in use or in development to provide more intelligent transportation systems that can reduce traffic and increase fuel efficiency, such as high-speed toll collection, adaptive signal controls, incident management systems, and travel information systems. Advanced screening technologies can make inspection of commercial vehicles more efficient and save fuel. Transit-oriented development and mixed land use urban designs also hold significant potential for reducing the miles traveled by vehicles. Barriers to Deployment14 Although new transportation technologies are currently available in the marketplace, their broader application appears to be impeded by barriers such as the high cost of clean transportation technology options, lack of information about the availability and benefits of these technologies, and distortionary regulations that make it difficult for innovative technologies to enter the marketplace.
14 The existence of barriers and their identification in this report in no way implies it is the responsibility of the Federal government to address every (or any) barrier, in whole or in part.

Strategies for Commercialization and Deployment
20
The high costs15 of many clean transportation options are an obstacle to rapid market penetration. For example, the current cost differential of hybrid electric vehicles is about $3,000 per vehicle over an internal combustion engine counterpart. Even if current tax incentives shield the consumer from high added costs, incentives would be too costly in the high volume market needed to significantly reduce GHG emissions. While prices of carbon composites and other lightweight materials have fallen, they cannot yet compete on a cost basis with steel. In addition, deployment of carbon fiber in vehicles may be limited due to competing demands by the aerospace and defense sectors.
Incomplete and imperfect information about the performance of energy-saving transportation technologies is a significant barrier as fuel economy features are often bundled into a single sales price and are difficult for consumers to disaggregate. For example, the price paid for different levels of vehicle fuel economy is buried in base prices or in the price of complete subsystems such as engines. In addition, levels of efficiency are coupled with differences in other consumer needs such as acceleration performance, level of luxury, and vehicle handling. Reliable information on the marginal cost of fuel economy may be available, but not readily accessible to individual consumers.
Technical risks associated with the unproven performance of novel transportation technologies hinder their deployment, such as the new battery systems used in hybrid electric vehicles. Reliability, durability, and uncertain performance under particular operating conditions all take time to establish and therefore hinder the market uptake of new transportation technologies.
Volatile petroleum prices contribute to market risks and unclear market acceptance creates
15 In an efficiently functioning market, absent significant market failures or other imperfections, “high cost” is usually a market signal indicating a technology is not economically viable, due to the existence of low demand or less costly competitors or substitutes. The existence of high cost, identified here as a barrier to greater C&D, does not by itself suggest government intervention is necessary or advisable. In the case of GHG emissions, there currently exists no regulatory scheme to internalize external costs and benefits of rising atmospheric GHG concentrations and, hence, a market failure is known to exist and government intervention may be warranted. In the absence of an internalized market-valuing mechanism, however, the extent of that intervention remains unclear (see Box 1-1 in Chapter 1).
uncertain returns on investment in advanced fuel economy technologies. The recent volatility in oil prices initially focused consumers on the possibility of “peak oil” and the “sustained pain” of high fuel costs, but as prices fall back again, fuel economy options may continue to be difficult to deploy.
Lack of pipelines, refueling stations, and other distribution channels for alternative fuels in many regions and urban markets is an infrastructure limitation that inhibits the market penetration of low-carbon transportation fuels. For example, ethanol currently cannot be transported through the pipelines that carry petroleum products; as a result, ethanol must be distributed by tanker truck or rail, thereby limiting the number of gallons that can be transported and increasing marginal costs. Limited electric grid capacity during peak hours may also hinder the introduction rate of plug-in hybrids that have limited range and require recharging during the day.
External benefits and costs make it difficult for low-carbon transportation fuels to compete. Without a market value placed on reduced or avoided GHG emissions, fuel economy may not rise to a high priority in new vehicle purchase decisions.
Competing regulatory priorities16 hinder the deployment of low-carbon technologies in the transportation sector. For example, Corporate Average Fuel Economy (CAFE) legislation gives automakers credits for flex-fuel cars that can run on E-85 (a blend of 85 percent ethanol and 15 percent gasoline), whether or not they actually operate on E-85. With these credits, automakers can sell E-85 flex-fuel cars, and receive credits, even if there are no flex-fuel derived GHG benefits. The Energy Independence and Security Act of 2007 (EISA 2007) calls for increasing CAFE levels to 35 mpg overall by 2020 (and maximum feasible levels thereafter). When implemented, this policy is estimated to save 0.9M barrels of oil per day by 2020, and 2M barrels per day by 2030. Greater savings might be possible if states were to impose a variety of higher standards, but this would be
16 Existing fiscal policies, regulations, and statutes may be beneficial in a broad context of public policy, but often they compete with or conflict with the narrow objective of promoting C&D of certain GHG-reducing technologies. As a result, while providing overall benefits to society these policies may be found to hinder investment in clean energy technologies (see Box 1-2 in Chapter 1).

Transportation January 2009
21
Federal Programs at Work in Transportation Clean Cities – supports deployment of alternative fuel vehicles and infrastructure across the U.S. through a network of more than 80 community-based coalitions.
Alternative Motor Vehicle Credit – provides a tax credit to buyers of new alternative fuel vehicles.
Next Generation Air Transportation System – fosters highly automated and efficient passenger, cargo, and aircraft operations, with many benefits including reduced GHG emissions.
contrary to the interests of a common national standard and perhaps other competing considerations that should be taken into account, including certain aspects of international trade.
Other barriers include the difficulty of attracting investments when GHG benefits are not rewarded, and lack of specialized knowledge in the auto and truck repair and service labor force required to support advanced powertrain designs and alternative fuels. Further, the transportation sector is greatly influenced by statutes promulgated by local planning authorities. Advanced technologies may need to be matched with equally advanced policies that discourage suburban sprawl, single-occupancy vehicles, empty heavy-truck backhauling, and heavy-truck idling. Commercialization and Deployment Strategy The U.S. strategy to accelerate the deployment of energy-efficient transportation technologies and practices recognizes the importance of deploying advanced technologies that improve fuel economy rather than increasing the horsepower, acceleration, and size of vehicles, as has occurred over the past two decades.
Today, there are more than 100 Federal programs, policies and initiatives identified in this report that encourage deployment of more efficient transportation technologies in the marketplace (Figure 2-3 and Annex B). Most of these activities are designed specifically to address market barriers in the transportation industry, while additional activities impact this sector in conjunction with a broad range of market areas. The most common type of Federal deployment action in this sector involves tax policies or other financial incentives, labeling and information dissemination, and education, training and workforce development. Coalitions and public/private partnerships are
Figure 2-3. Federal Policies to Reduce GHGs in Transportation, by Type of Policy and Measure
29
29
29
24
16
15
12
10
7
2
1
0 5 10 15 20 25 30 35
Labeling & Information Dissemination
Education, Training, and S&T Workforce Development
Tax Policy and Other Financial Incentives
Coalitions & Partnerships
Market Conditioning including Government Procurement
International Cooperation
Technology Demonstration
Codes and Standards
Legislative Act of Regulation
IP and Tech Transfer Policies
Risk Mitigation
Number of Activities
29
29
29
24
16
15
12
10
7
2
1
0 5 10 15 20 25 30 35
Labeling & Information Dissemination
Education, Training, and S&T Workforce Development
Tax Policy and Other Financial Incentives
Coalitions & Partnerships
Market Conditioning including Government Procurement
International Cooperation
Technology Demonstration
Codes and Standards
Legislative Act of Regulation
IP and Tech Transfer Policies
Risk Mitigation
Number of Activities Source: CCTP/Energetics Deployment Inventory Database dated January 2009 Note: Some activities fit into more than one category, so the total count exceeds the total number of identified activities (109) listed in this area. The figure does not include activities that are authorized but not implemented. See Annex B for details.

Strategies for Commercialization and Deployment
22
elements of many individual Federal activities, as illustrated by the DOE’s 21st Century Truck Partnership and the EPA’s Mobile Air Conditioning Climate Protection Partnership. Recognizing the importance of global cooperation, 15 of the activities identified have an international scope. Market conditioning includes Federal mandates that encourage rapid deployment in this sector, such as the Presidential Directive on Energy and Fuel Conservation, and technology demonstration
programs such as the cellulosic biofuels demonstration projects jointly funded by DOE and industry participants. As a whole, these programs provide a portfolio of solutions addressing key transportation sector barriers, as shown in Table 2-1 (see also Annex B). The Clean Cities activity, among others, addresses the barrier of incomplete and imperfect information through a variety of information-sharing mechanisms
Table 2-1. Select Federal Activities Addressing Key Technology Deployment Barriers: Transportation
Solutions
Key Technology Deployment Barriers
Major Programs, Policies, or Initiatives*
Illustrative Deployment Activities
Most Critical Barriers:
Incomplete and Imperfect Information 43
• Clean Cities (DOE) • Green Vehicle Guide (EPA) • Climate Friendly Parks (DOI) • Commuter Choice (DOT, EPA)
High Costs 23
• Alternative Motor Vehicle Credit • Voluntary Airport Low Emission Program (DOT) • Clean Fuels Grant Program (DOE) • Clean School Bus USA (DOE)
Market Risks 17 • Fuel Use Requirement for Federal Vehicles • Hybrid Truck Users Forum (DoD) • SmartWay Transport Partnership (EPA)
Technical Risks 16 • FreedomCAR and Fuel Partnership (DOE) • Advanced Vehicle Testing Activity (DOE) • 21st Century Truck Partnership (DOE)
External Benefits and Costs 15 • Federal Workforce Transportation Benefit • Gas Guzzler Tax
Infrastructure Limitations 13 • Transit Capital Investment Grant Program (DOT) • Alternative Fuel Infrastructure Tax Credit
Competing Regulatory Priorities 7 • Alternative Fuel Infrastructure Tax Credit
Other Important Barriers:
Lack of Specialized Knowledge 12 • Arterial Management Program (DOT)
Competing Statutory Priorities 1 • Hydrogen Codes & Standards Program (DOE)
*Does not include activities that are authorized but not implemented. See Annex B for details.

Transportation January 2009
23
including a fuel economy website17 and databases on E-85 (ethanol) and biodiesel refueling stations. EISA 2007 authorized DOE to conduct a 10-year National Media Campaign to Save Energy by educating customers about the benefits of energy efficiency and decreased oil consumption. EISA 2007 also authorized a nationwide electric drive transportation technology education program as part of DOE’s Plug-in Electric Drive Vehicle Program. The high cost of clean transportation technologies is addressed by various programs including Federal tax credits for new advanced clean burn and hybrid cars and trucks (ranging from $400 to $3,400) and DOT’s Voluntary Airport Low Emission Program. Similarly, the Alternative Motor Vehicle Credit and other tax policies reduce the cost to consumers and thereby stimulate investment in low-carbon transportation technologies. DOE’s newly authorized Grants for Production of Advanced Biofuels will, once funded, enable the production of biofuels with an 80 percent or greater reduction in life-cycle GHG emissions compared with motor vehicle fuels in 2005. Market risks are mitigated by initiatives such as the Federal Fuel Use Requirements, strengthened in 2007 by Executive Order 13423, which calls for Federal fleets to reduce petroleum use by two percent annually and increase alternative fuel use by 10 percent annually through 2015. Such mandates reduce market risk by creating demand for producers of alternative fuels. Technical risks associated with uncertain technology performance are being targeted by demonstration and validation activities such as DOE’s Advanced Vehicle Testing Activity. The Federal Workforce Transportation program18 helps compensate for the external benefits of some commuting alternatives by offering employees tax-free accounts for mass transportation and vanpools. Conversely, the Gas Guzzler Tax internalizes external costs by levying a financial penalty for purchasing cars with fuel economy ratings less than 22.5 miles per gallon. A 30 percent Federal income tax credit (worth up to $30,000 per E-85 pump) was created by EPAct 2005 to address refueling infrastructure limitations. By enabling flex-fuel vehicles to run on E-85, this same
17 www.fueleconomy.gov (accessed January 2009) 18 Initiated by Executive Order 13150 of April 21, 2000.
credit also helps overcome regulatory barriers imposed by CAFE’s credit system. Potential Opportunities and Gaps Transportation energy use is a major and growing contributor to GHG emissions in the United States and globally. A number of GHG mitigation technologies and practices are deployable today to curb this growth, and many of these are already having an impact on carbon emissions. The Federal government is supporting a robust portfolio of programs, policies, and incentives to encourage the use of cleaner transportation vehicles. Nearly one-half of the identified programs tackle information gaps and numerous other PAMs address the cost premium of new GHG mitigating technologies. For the first time in more than 20 years, Federal CAFE standards have been significantly tightened which will make a real contribution to improving fuel economy, as was the case following the creation of CAFE standards following the Arab oil embargo of 1973-74. Much greater fuel economy improvements will be needed, however, to successfully address the nation’s oil dependence and climate change challenges. As a result, the remaining barriers to deployment of advanced energy efficiency in transportation must be tackled. Key remaining barriers include the high cost of low-GHG transportation technologies, such as hybrid electric vehicles and lightweight materials, and the absence of a market value for GHG reductions, making it difficult for GHG-mitigating technologies to compete. For these and other reasons, fuel economy remains a low priority in new vehicle purchase decisions, although high oil prices have been shown to change this (CNW 2004). In addition, the inadequate infrastructure for large-scale distribution of lower GHG fuels and limited electric grid capacity for recharging plug-in hybrids during peak hours remain largely unaddressed. A thorough evaluation of existing Federal policies and their impacts in these areas is recommended. Finally, deployment activities that encourage more efficient fleets and lower carbon fuels should be accompanied by policies encouraging more efficient travel patterns. This will allow the transportation sector to become part of the climate change solution rather than contributing to GHG emissions growth. In the future, as new and more advanced technologies become

Strategies for Commercialization and Deployment
24
ready for deployment (e.g., all-electric and fuel cell vehicles), C&D policies will need to evolve to address forthcoming obstacles hindering their market penetration.
2.2 BUILDINGS The built environment – consisting of residential, commercial, and institutional buildings – accounts for about one-third of primary global energy demand and is a major source of energy-related GHG emissions, mainly CO2. Over the long term, buildings are expected to continue to be a significant component of increasing global energy demand and a large source of CO2 emissions, driven in large part by the continuing trends of urbanization, population and GDP growth, and the longevity of building stocks. In the United States, the energy services required by residential and commercial buildings contribute approximately 38 percent of CO2 emission (EIA 2008). EIA expects energy use and CO2 emissions in this sector to continue to expand as GDP grows and demand increases for building services (especially electric appliances, electronic equipment, and the amount of conditioned space per person). Even if the nation takes serious action to address this growing demand, the long duration of the building stock slows the potential pace of change in CO2 emissions from this sector. However, because lighting, office equipment, residential appliances, and even components of the building structure such as windows, doors, and insulation are typically replaced and upgraded on a more frequent basis, the short term potential for improving the energy integrity of the existing building stock is high. Capitalizing on this potential requires addressing the institutional inertia and fragmented decision-making that hinders the choice of energy efficiency in building designs and equipment. The incomplete market penetration of ENERGY STAR homes and appliances punctuates this point; even though cost-effective improved building designs and equipment are widely available, their market share is variable.19 The C&D strategies for accelerating the deployment of energy-efficient building technologies and
19Examination of sales data for 2006 reveals a range of ENERGY STAR shares: for refrigerators 31 percent, room air conditioners 36 percent, clothes washers 38 percent, and dishwashers 92 percent (DOE 2007a, Table 5.10).
practices have several dimensions. First, it targets the numerous barriers that inhibit cost-effective options from being utilized. Second, it combines market-based policies with regulatory mandates to maximize the market uptake of best practice technologies. Finally, the C&D strategies reflect the recognition of the involvement of numerous stakeholders and the need to understand behavioral issues such as misinformation and misplaced incentives that can thwart the diffusion of cost-competitive, low-carbon building technologies. Advanced technologies and building designs can make significant contributions to reducing CO2 emissions from buildings. By 2020, DOE expects that cost-effective zero net energy homes will be available and, more generally, it may be possible to achieve up to a 70 percent reduction in a home’s energy use, compared to the average energy use in an equivalent home today (Figure 2-4). On-site energy technologies may permit many buildings to become net-zero GHG emitters and net energy producers. Technical success requires scientific breakthroughs in numerous technologies such as photovoltaic systems, high R-value envelopes and window systems, advanced HVAC and water heating systems, high-efficacy solid state lighting, and an array of highly efficient appliances from clothes dryers to A/V equipment. Similarly, climate-friendly designs for large commercial buildings and industrial facilities would benefit from electrochromic windows featuring the dynamic control of infrared energy and allowing optimization of daylighting, advanced lighting systems including solid state lighting, abundant sensors dispersed throughout buildings, novel HVAC systems, continuously optimizing control systems, and numerous other advances. Large-scale market
Figure 2-4. The Building America Pathway to Net Zero Energy Homes
(Source: DOE 2005)

Buildings January 2009
25
Suitable Building Technologies: Lighting Examples
Solid State Lighting – This transformational technology uses semi-conducting materials to convert electricity into light. The luminous efficiency of light-emitting diodes (LEDs) is expected to rival the most efficient white light sources by 2010, and to achieve 160 lm/W in cost-effective, market-ready systems by 2025. White LEDs are now approaching performance levels that make them attractive in automobiles, aircraft, elevators, and some task light applications.
Fluorescent Lighting – Compact fluorescent lamps (CFLs) for homes and T-5 fluorescent systems for offices are cost-effective today and can use 75 percent less energy than incandescent bulbs. Some applications of light emitting diode (LED) lighting, which is even more efficient, are also cost-competitive. http://www.energystar.gov/index.cfm?c=lighting.pr_lighting
Hybrid Solar Lighting – This design application is currently being demonstrated in a variety of settings, providing natural sunlight in interior spaces supplemented only as needed by electric lighting.
deployment of these R&D successes, however, will require improvements in state and local energy codes, better national appliance standards, training for the construction industry, mortgage instruments that recognize energy performance, and many other expanded components of the policy/education infrastructure. Technologies Suitable for Commercialization and Deployment While the built environment is a complex mix of heterogeneous building types and functional uses, all have common features, each of which may benefit from energy-saving technological advances. By combining these technologies with principles of smart growth, communities can achieve even greater GHG reductions. Technologies suitable for deployment to reduce GHG emissions fall into three categories (CCTP 2006):
advanced appliances, lighting, and heating and cooling equipment;
advanced building envelope components including roofs, walls, windows, and foundations; and
integrated building design, construction, and operation, including the optimal integration and control of components.
Energy-efficient building technologies currently suitable for deployment include a number of ENERGY STAR appliances that have not yet fully penetrated markets. For example, demand is growing for energy-efficient horizontal-axis washing machines (40 percent energy savings) and advanced refrigerator freezers (15 percent energy savings). Solar water heating, instantaneous water heaters, and drop-in heat pump water heaters are commercially available but not widely used. ENERGY STAR-labeled compact fluorescent lamps are gaining market penetration, while light emitting diodes (LEDs) serve niche applications. Various electronic lighting controls, including dimmers, motion sensors, occupancy sensors, photosensors, and timers, are also commercially available. Suitable heating and cooling technologies include air and ground source electric heat pumps, gas-fired absorption heat pumps, centrifugal chillers, desiccant air pre-conditioners, and combined cooling, heating and power systems. GHG emissions from combined heat and power systems depend on the technology
(gas or steam turbine, microturbine, compression engine, or fuel cell), but regardless of the technology, the integrated recovery and use of heat from the power generation is highly efficient and less polluting compared to non-integrated systems. Numerous building envelope technologies and integrated designs are ready for use. Improved shell designs and insulating systems can have a significant impact in energy use, along with improved training of construction professionals enables builders to achieve the promise of these gains. ENERGY STAR windows, including low-e windows, have not yet fully penetrated the market. Electrochromic glazed windows and other advanced windows have more recently become commercially available. Recent efforts to gain a more thorough understanding of the complex interactions of glazing, shading, lighting, controls, and occupants should contribute to wider deployment of windows and skylights for daylighting and energy management purposes. Other technologies available today to improve the energy integrity of building envelopes include radiant barriers, ENERGY STAR doors, skylights, and reflective roofing materials. Integrated building design tools and control technologies have proven effective at optimizing

Strategies for Commercialization and Deployment
26
building equipment and envelopes systems, but they remain under-utilized. Tackling climate change at the community scale unleashes additional opportunities. Transit-oriented development with mixed land uses, sidewalks, and bike paths can reduce automobile use while also improving air quality and reducing congestion. Community-scale planning can also promote passive solar design, combined heat and power, and other features that increase energy performance at the community level. These opportunities provide tangible examples of the interconnectedness of different GHG mitigation technologies and policies. Barriers to Deployment20 While many cost-competitive technologies could reduce GHG emissions in the buildings sector, numerous barriers impede their full deployment.
The most important barrier to the deployment of energy-efficient building designs and technologies is institutional: the decision-making process is complex and fragmented by numerous players whose interests often do not align. These decision makers include investors, owners, occupants, builders, tradesmen, architects, equipment manufacturers, suppliers, lenders, insurers, codes and standards setters, realtors, and so forth. Each of these participants in the decision-making process has distinct interests and impacts the process at different points in design, construction and use. In sum, the fragmented industry structure impedes the uptake of new technologies in this sector; it also contributes to the low level of buildings R&D investment.
Incomplete and imperfect information about the cost-effectiveness and availability of energy-efficient building technologies is a key obstacle to their widespread market penetration. Information about energy-efficient building technologies is often incomplete, unavailable, expensive, and difficult to obtain. For example, households receive a monthly electricity bill that provides no breakdown of individual end uses, making it difficult to assess the benefits of efficient appliances and other products. The complexity of design, construction, and operation of buildings
20 The existence of barriers and their identification in this report in no way implies it is the responsibility of the Federal government to address every (or any) barrier, in whole or in part.
makes it difficult to characterize the extent that any particular building is energy efficient.
The high (first) costs21 of many advanced technologies and building designs present a barrier to adoption because consumers are often reluctant to pay more upfront to purchase products with lower life cycle costs, especially when lenders do not credit them for lower utility bills later.
Misplaced incentives are a key barrier to energy-efficient buildings. Landlords and builders often do not invest in energy efficiency in new construction, in building renovations and upgrades, because tenants and homebuyers receive the benefits of lower energy bills. About 90 percent of all households in multifamily buildings, for example, are renters, which makes misplaced incentives a major obstacle to energy efficiency in urban housing markets.
Insufficient validation of the performance of energy-efficient building technologies leads to the perception of technical risks. The cost-effectiveness of advanced building technologies can be highly situation-specific and difficult to predict.
Market risks include a lack of financing and access to credit on the part of low-income households, small businesses, and government landlords. Investments in energy-efficient building technologies are also hindered by uncertainties associated with future energy prices and by risks related to irreversible investments.
21 In an efficiently functioning market, absent significant market failures or other imperfections, “high cost” is usually a market signal indicating a technology is not economically viable, due to the existence of low demand or less costly competitors or substitutes. The existence of high cost, identified here as a barrier to greater C&D, does not by itself suggest government intervention is necessary or advisable. In the case of GHG emissions, there currently exists no regulatory scheme to internalize external costs and benefits of rising atmospheric GHG concentrations and, hence, a market failure is known to exist and government intervention may be warranted. In the absence of an internalized market-valuing mechanism, however, the extent of that intervention remains unclear (see Box 1-1 in Chapter 1).

Buildings January 2009
27
Federal Programs at Work in Buildings Building America – Building America utilizes private/public partnerships to provide information on energy-efficient homes developed through research.
Weatherization Assistance Program (WAP) – WAP increases the energy efficiency of homes for low-income households and allows DOE to test new advances in home energy science, sometimes with additional state and utility funds.
Partnership for Home Energy Efficiency (PHEE) – PHEE is a collaborative effort among DOE, EPA, and HUD to promote energy efficiency in existing homes by coordinating federal efforts, building on each agency’s strengths, and eliminating redundant activities.
Change a Light, Change the World Program – This market transformation program promotes the purchase of compact fluorescent bulbs.
Competing fiscal priorities22 can also inhibit deployment. Lack of cost-recovery mechanisms for energy-efficiency investments hinder electric utilities from promoting such technologies. Fixing the problem of utility revenue erosion from improved energy efficiency and the de-coupling of profits from sales is critical to removing a dis-incentive to energy efficiency.
Competing statutory priorities can also prevent greater technology deployment. For example, laws that do not allow the government to borrow from the private sector and incur long-term obligations, while favorable in some regards, prevent energy efficiency improvements in state-owned buildings.
Other barriers include lack of specialized knowledge about building system operations and optimization, external benefits and costs associated with CO2 emissions, and policy uncertainty related to the future legal treatment of GHG emissions that result in relatively slow uptake of new technologies. In addition, variable, outdated and insufficiently enforced state and local building codes represent a type of insufficient market conditioning that inhibits the development of national markets for energy-efficient building design and construction. For example, nine states have residential energy codes that are more than a decade old or follow no residential energy code at all (Brown, Southworth, and Stovall 2005). Outdated codes preclude the application of recent advances in building science. Finally, an overarching influence on the buildings sector is the long duration of the building stock, which “locks in” obsolete technologies for decades. Commercialization and Deployment Strategy The U.S. strategy to accelerate the deployment of energy-efficient buildings recognizes the importance of using new and improved technologies so that consumers can benefit from the same or better services while using less fuel or electric power. Trimming the energy intensity of the built environment could be a win-win strategy if all of the competing policy and market forces can be aligned.
22 Existing fiscal policies, regulations, and statutes may be beneficial in a broad context of public policy, but often they compete with or conflict with the narrow objective of promoting C&D of certain GHG-reducing technologies. As a result, while providing overall benefits to society these policies may be found to hinder investment in clean energy technologies (see Box 1-2 in Chapter 1).
More than 100 Federal programs, policies, and initiatives identified in Annex B currently help foster the rapid deployment of energy-efficient building technologies (Figure 2-5). These policies and measures are operated by numeral Federal agencies, they include voluntary as well as regulatory approaches, and they focus on commercialization and deployment in both the government and the private sector. More than one-third of these policies and measures involve labeling or the dissemination of information about new and improved building technologies to consumers, builders, engineers and architects, code officials, and others through mechanisms such as ENERGY STAR labels, simulation tools and collaborative working groups. The next most common type of policy measures are tax policies and other financial incentives such as DOE’s Weatherization Assistance Program, Utility Energy Service Contracts, EPA’s Pollution Prevention, and Smart Growth grants. These are complemented by 22 education, training, and science and technology workforce development policies and programs identified in Annex B. There are also numerous international collaboration policies and measures, including the Renewable Energy and Energy Efficiency Partnership, the Global Village Energy Partnership, and the Healthy Homes and Communities Partnership. As a whole, the portfolio of Federal activities offers a diverse range of solutions

Strategies for Commercialization and Deployment
28
addressing key buildings sector barriers, as shown in Table 2-2. A diverse collection of 48 programs identified in Annex B helps address barriers caused by incomplete and imperfect information by disseminating useful information to consumers and other key stakeholders. These programs include ENERGY STAR and the Change a Light, Change the World Initiative that provides data on energy efficient technologies and practices that are easily accessible to consumers, EISA 2007 also calls for the creation of a 10-year National Media Campaign to Save Energy by educating customers about the benefits of energy efficiency. DOE’s recently established Builders Challenge addresses information shortfalls in the builder community by making available “builder option packages,” which provide guidance for building high-performance homes specific to different climate zones. Meeting particular criteria outlined in theses packages can also allow homeowners to qualify for the $2,000 Federal tax credit enacted in section 1332 of the Energy Policy Act of 2005. A total of 26 identified Federal deployment activities address market risks including energy-efficient mortgages and Federal Purchasing of Energy-Efficient Products, administered by the Federal Energy Management Program. Another eight
deployment activities in Annex B help to mitigate technical risks including research, development, and demonstration (RD&D) programs such as Building America and the Partnership for Advanced Technology in Housing. Some deployment initiatives are broad in scope, addressing a range of deployment obstacles. As an example, EISA 2007 established “Bright Tomorrow” lighting prizes to be awarded by DOE for solid state lighting development that achieve targeted levels of energy efficiency, output, and color quality. A specific prize category is a solid state replacement for a 60-watt incandescent light. After the awards are made, DOE is required to develop guidelines for Federal agency purchases of the new device, with the goal of complete replacement within five years. Tax credits for the purchase and manufacture of energy-efficient building technologies serve to mitigate the high cost barrier, which often prevents consumers from purchasing alternatives that take several years to pay back in utility bill savings. The DOE’s Weatherization Assistance Program and several programs of the Department of Housing and Urban Development help to address the lack of resources available to low-income households to improve the energy integrity of their homes.
Figure 2-5. Federal Policies to Reduce GHGs in Buildings, by Type of Policy and Measure
41
22
22
21
20
15
14
5
5
3
0 5 10 15 20 25 30 35 40 45
Labeling & Information Dissemination
Coalitions & Partnerships
Education, Training, and S&T Workforce Development
Tax Policy and Other Financial Incentives
Market Conditioning including Government Procurement
International Cooperation
Codes and Standards
Legislative Act of Regulation
Technology Demonstration
Risk Mitigation
Number of Activities
41
22
22
21
20
15
14
5
5
3
0 5 10 15 20 25 30 35 40 45
Labeling & Information Dissemination
Coalitions & Partnerships
Education, Training, and S&T Workforce Development
Tax Policy and Other Financial Incentives
Market Conditioning including Government Procurement
International Cooperation
Codes and Standards
Legislative Act of Regulation
Technology Demonstration
Risk Mitigation
Number of Activities Source: CCTP/Energetics Deployment Inventory Database dated January 2009 Note: Some activities fit into more than one category, so the total count exceeds the total number of identified activities (103) listed in this area. The figure does not include activities that are authorized but not implemented. See Annex B for details.

Buildings January 2009
29
Problems associated with the fragmented building industry structure are being addressed by regulations establishing energy efficiency codes and standards and activities that promote information sharing and product labeling. Extending this successful approach, EISA 2007 includes new standards for ten products. The biggest energy-saver among the standards in the bill are those for common light bulbs, requiring them to use about 25-30 percent less energy than today’s
most common incandescent bulbs by 2012-2014 and at least 60 percent less energy by 2020. Another important new standard promulgated in EISA 2007 regulates external power supplies such as battery chargers. DOE is also given the ability to establish regional variations in standards for heating and air conditioning equipment. Partnership programs also help to address problems of industry fragmentation.
Table 2-2. Select Federal Activities Addressing Key Technology Deployment Barriers: Buildings
Solutions
Key Technology Deployment Barriers
Major Programs, Policies, or Initiatives*
Illustrative Deployment Activities
Most Critical Barriers:
Incomplete and Imperfect Information 48 • Change a Light, Change the World (DOE, EPA) • ENERGY STAR Program (EPA, DOE) • Builders Challenge (DOE)
Market Risks 26 • Energy Efficient Mortgages • Federal Purchasing of Energy-Efficient Products (DOE) • Emerging Buildings Technologies (DOE)
High Costs 18 • Residential Energy Efficiency Tax Credit • State Energy Program (DOE)
Industry Structure 15
• Building energy codes and appliance energy efficiency standards (DOE)
• Partnership for Home Energy Efficiency (DOE, EPA, HUD)
Misplaced Incentives 11
• Tax Credit for Construction of New Energy Efficient Homes
• Appliances and Commercial Equipment Standards Program (DOE)
Technical Risks 8 • Building America (DOE) • Partnership for Advancing Technology in Housing (HUD)
Competing Fiscal Priorities 6 • Credit for manufacture of energy efficient appliances
Competing Statutory Priorities 4 • Building Energy Codes Program (DOE)
Other Important Barriers:
External Benefits and Costs 22 • Responsible Appliance Disposal Program (EPA)
Policy Uncertainty 20 • Presidential Directive on Energy and Fuel Conservation
Lack of Specialized Knowledge 12 • Technical Assistance Program (DOE)
*Does not include activities that are authorized but not implemented. See Annex B for details.

Strategies for Commercialization and Deployment
30
Misplaced incentives are addressed by tax incentives, such as the Tax Credit for Construction of New Energy Efficient Homes, and by regulatory activities, such as building energy codes and appliance standards. By enforcing minimum efficiency standards and building codes, these programs mitigate the landlord-tenant type situations in which principal-agent conflicts impede the purchase of efficient technologies. Competing fiscal priorities hindering utility involvement in the deployment of energy-efficient products are being addressed by providing tax credit for the manufacture of energy-efficient appliances. Finally, competing statutory priorities that hinder the energy performance contracting market are being addressed by the Building Energy Codes Program helps develop and promote consistent building energy codes for adoption and enforcement by states and local governments. Other programs specifically attempt to compensate for the lack of a market value (i.e., external benefits) for GHG reductions through subsidies and assistance such as EPA’s New Alternatives Policy Program and Responsible Appliance Disposal Program. Policy uncertainty regarding the future legal treatment of GHG emissions is addressed by the establishment of Federal clean energy goals and directives such as the Presidential Directive on Energy and Fuel Conservation. Finally, as is true in so many energy fields, the building trades, energy managers, sales force, and operation and maintenance staff generally lack the specialized knowledge necessary to install and operate the latest generation of building technologies. To address this problem, the Federal government runs several workforce training programs. Potential Opportunities and Gaps Accounting for more than 38 percent of U.S. CO2 emissions and growing rapidly here and abroad, the building sector represents a significant opportunity for GHG reductions. Numerous cost-effective technologies and integrated designs are available for deployment today, and many buildings equipped with these enhancements are already displacing carbon emissions. A growing body of evidence suggests that improving the energy integrity of the existing building stock and new construction is a low-cost approach to mitigating GHG emissions.
With over one hundred Federal programs, policies, and initiatives promoting the deployment of these technologies and designs, many barriers are being successfully tackled – especially information barriers, and the high up-front costs of many emerging technologies, which are being offset by numerous programs and financial incentives. Remaining barriers, however, prevent the full energy efficiency potential of this sector from being realized. For instance, the building industry’s fragmented and heterogeneous structure leads to competing drivers and misplaced incentives. Technical and market risks, utility ratemaking practices, lack of specialized knowledge, and outdated state and local building codes also deter technology deployment. Existing C&D activities provide only weak solutions to the lack of utility incentives for investment in energy efficiency (which is a problem across the full range of building operations and users). Similarly, the Building Energy Codes Program addresses new construction added each year, but it does not cover the energy upgrading of existing buildings. Unless deployment policies and programs are able to effectively tackle these obstacles in partnership with the private sector, energy-efficient building technologies and designs will continue to be underutilized. Further evaluation of existing Federal policies and their impacts in these areas is recommended, and novel approaches to advancing the efficiency of the nation’s existing building stock should be considered. Finally, with so many distinct Federal programs, there is the potential for enhanced communication and coordination between agencies to improve efficiencies, leverage investments and expertise, and minimize duplication of efforts.
2.3 INDUSTRY The industrial sector is the largest of the end-use sectors, consuming more than 50 percent of the delivered energy worldwide in 2004 and producing a commensurate share of CO2 emissions. Global energy consumption in this sector is projected to increase by an average of 1.8 percent per year from 2004 through 2030 (EIA 2007b). Certain activities are particularly energy-intensive, including metals industries, such as iron, steel, and aluminum; petroleum refining; basic chemicals and

Industry January 2009
31
intermediate products; fertilizers; glass; pulp and paper; and mineral products, including cement, lime, limestone, and soda ash. Less energy-intensive industries include the manufacture or assembly of automobiles, appliances, electronics, textiles, food and beverages, and other products. The industrial sector worldwide is expected to expand in the future and will likely continue to account for a substantial portion of future CO2 emissions. In the United States in 2005, industry accounted for about 28 percent of total energy-related CO2 emissions (EIA 2008). These are attributed to combustion of fossil fuels (61 percent) and use of electricity derived from CO2-emitting sources (39 percent) (EIA 2008). The average annual rate of growth of CO2 emissions from U.S. industry is projected to be 0.2 percent out to 2030, compared to 0.6 percent for the entire economy. This is due primarily to the restructuring of the economy away from energy-intensive manufacturing and toward a service and information-based economy (EIA 2008). In addition to combustion-related emissions, industry is responsible for several process-related greenhouse gas emissions from sources such as aluminum production, cement manufacture, ammonia manufacture, and lime manufacture. Process-related emissions (including both CO2 and other gases) account for approximately five percent of GHG emissions from all sources in the United States (EPA 2008). CO2 accounted for about 47 percent of these; the remainder was other gases such as methane and nitrous oxide, as discussed later in Chapter 5.3: Emissions of High Global-Warming Potential Gases. Advanced industrial technologies could make significant contributions to reducing CO2 emissions. In the long term, fundamental changes in energy infrastructure could effect significant CO2 emissions reductions (Figure 2-6). Revolutionary changes in energy conversion and utilization may include novel heat and power sources and systems, such as bio-based chemical feedstocks, hydrogen, and fuel cells. There are also industrial process efficiency improvements that can be deployed more widely today such as the introduction of heat exchangers within distillation columns in the chemical and petroleum refining industries. Innovative enabling technologies for energy-efficient and low CO2 emission products and processes may take advantage of developments in sensors and controls, catalysis, nanotechnology, and micro-manufacturing. In
addition, advances in resource recovery and utilization can cut GHG emissions while also reducing waste streams. Many of these approaches provide multiple ancillary benefits such as improved productivity, product enhancements, and lower production costs. The strategies for accelerating the deployment of energy-efficient industrial technologies and practices are multi-dimensional. They work with key stakeholder groups and leverage the resources of multiple government agencies; focus on critical barriers that hinder the advancement of efficiency improvements; and emphasize the multiple benefits of installing advanced energy technologies in manufacturing and industrial processes. Technologies Suitable for Deployment The CCTP Strategic Plan (CCTP 2006) outlines some of the most promising GHG intensity-reducing concepts for industry. These include technologies that increase the efficiency of process heating, or process and design enhancements that can improve quality, reduce waste, reduce the intensity of material use, and increase in-process material recycling. Industrial facilities can implement direct manufacturing processes, which can eliminate some energy-intensive steps, thus both avoiding emissions and enhancing productivity. On the supply side, industry can self-generate clean, high-efficiency power and steam; and create products and byproducts that can serve as clean-burning fuels. The sector can
Figure 2-6. Pathways for Reducing Industrial GHGs
(Source: CCTP 2006)

Strategies for Commercialization and Deployment
32
Suitable Industrial Technologies: Process Improvement Examples
Pressure Swing Adsorption for Hydrocarbon and Nitrogen Recovery in the Chemical Industry – Pressure swing adsorption enables the recovery of nitrogen and other chemicals in polyolefin plants, providing for 100 percent recovery of nitrogen and hydrocarbons and an annual savings of 81.5 billion BTU (DOE 2007b).
Super Boiler – Gas-fired package boiler capable of 94 percent or greater efficiency.
Cokeless Ironmaking: Mesabi Nugget Technology - A single process cokeless oven/blast furnace for iron making resulting in a savings of 10-30 percent in steel production.
Oxy Fuel Firing for Glass Melting – Employs oxygen instead of air in high temperature combustion furnace for glass manufacturing reducing fuel use 15-45 percent.
Isothermal Melting – A revolutionary aluminum melting technology with a continuous flow system using immersion heating that converts electricity to melting energy with 98 percent efficiency.
also make greater use of coordinated systems that more efficiently use distributed energy generation, combined heat and power, and cascaded heat. Of these GHG intensity-reducing concepts, a number have been identified as suitable for near-term commercialization and deployment. Improvements are possible in steam boilers, direct-fired process heaters, and motor-driven systems, such as pumping and compressed air systems. For example, high efficiency, low-NOx emission burners such as radiation stabilized burners and forced internal recirculation burners have improved efficiency over conventional equipment. Real time, continuous emissions monitors are available to measure common compounds as well as ones that are not typically measured, such as formaldehyde or ammonia, to better control overall operations. There have also been developments in industry-specific process technologies for more efficient production in aluminum, glass, steel, chemicals, forest products, and other energy intensive industries. Many of these newer technologies have shown success in a limited number of commercial applications. Other promising opportunities for reducing emissions exist via the adoption of best energy-management practices such as wireless motor management; adoption of more modern and efficient power and steam generating
systems; integrated approaches that combine cooling, heating, and power needs; and nano-structured materials and nanomanufacturing. Barriers to Deployment23 The broader application of industrial technologies that are available for deployment is impeded by barriers such as the relative high risk and costs associated with new industrial technology, external benefits, a lack of specialized knowledge relating to energy-efficient improvements, and inadequate information flow.
Companies must consider the technical risks of adopting a new industrial technology. Uncertainties about the benefits and impacts of new technology on existing product lines can be very significant. Small technology changes particularly in large integrated process plants can lead to major changes in process and product performance. In today’s manufacturing environment with 24/7 operations, reliability and operational risks represent major concerns for industry when adopting new technologies. These perceived technical risks result in longer and larger scale field testing of new technologies, more stringent investment criteria, and a slower pace of technology diffusion.
Relatively high costs24 for industrial energy-efficiency improvements can be an impediment to investments. Energy-saving technologies have to compete for financial and technical resources against projects that achieve other company goals such as increased production, safety improvements, and improved quality. In addition to this overall capital rationing constraint, new energy-efficient technologies many times have longer payback periods than traditional equipment and represent a greater financial risk, which can slow technological
23 The existence of barriers and their identification in this report in no way implies it is the responsibility of the Federal government to address every (or any) barrier, in whole or in part. 24 In an efficiently functioning market, absent significant market failures or other imperfections, “high cost” is usually a market signal indicating a technology is not economically viable, due to the existence of low demand or less costly competitors or substitutes. The existence of high cost, identified here as a barrier to greater C&D, does not by itself suggest government intervention is necessary or advisable. In the case of GHG emissions, there currently exists no regulatory scheme to internalize external costs and benefits of rising atmospheric GHG concentrations and, hence, a market failure is known to exist and government intervention may be warranted. In the absence of an internalized market-valuing mechanism, however, the extent of that intervention remains unclear (see Box 1-1 in Chapter 1).
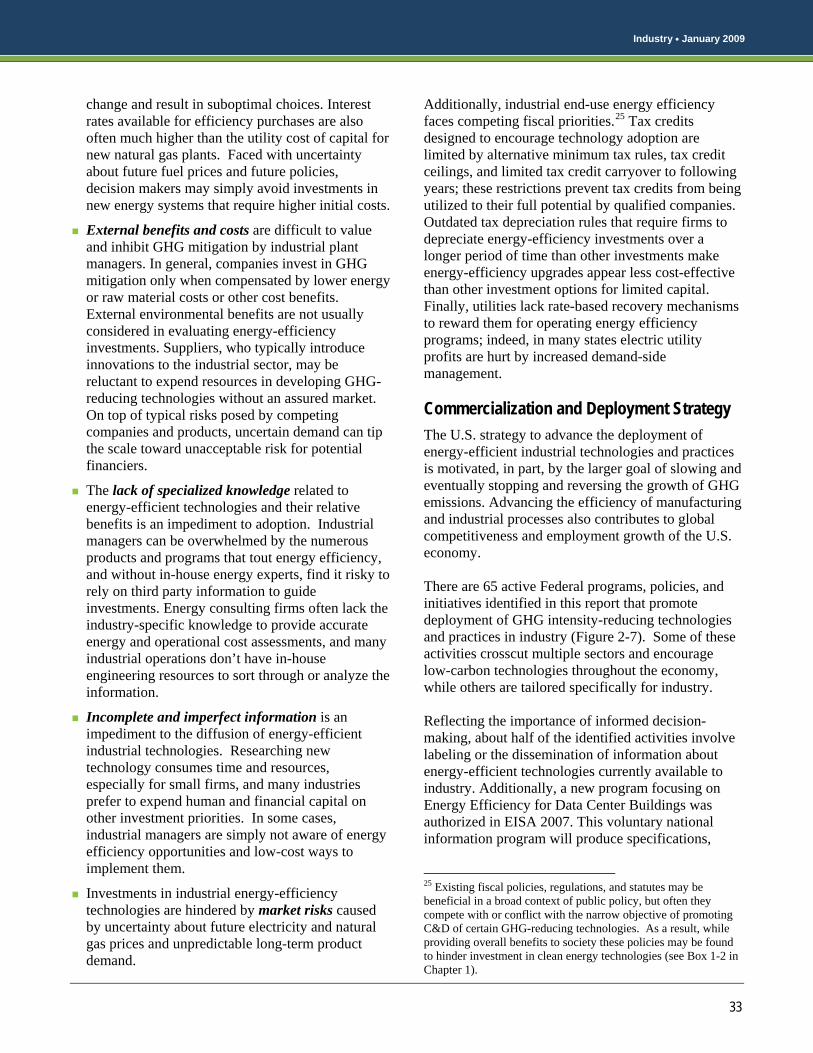
Industry January 2009
33
change and result in suboptimal choices. Interest rates available for efficiency purchases are also often much higher than the utility cost of capital for new natural gas plants. Faced with uncertainty about future fuel prices and future policies, decision makers may simply avoid investments in new energy systems that require higher initial costs.
External benefits and costs are difficult to value and inhibit GHG mitigation by industrial plant managers. In general, companies invest in GHG mitigation only when compensated by lower energy or raw material costs or other cost benefits. External environmental benefits are not usually considered in evaluating energy-efficiency investments. Suppliers, who typically introduce innovations to the industrial sector, may be reluctant to expend resources in developing GHG-reducing technologies without an assured market. On top of typical risks posed by competing companies and products, uncertain demand can tip the scale toward unacceptable risk for potential financiers.
The lack of specialized knowledge related to energy-efficient technologies and their relative benefits is an impediment to adoption. Industrial managers can be overwhelmed by the numerous products and programs that tout energy efficiency, and without in-house energy experts, find it risky to rely on third party information to guide investments. Energy consulting firms often lack the industry-specific knowledge to provide accurate energy and operational cost assessments, and many industrial operations don’t have in-house engineering resources to sort through or analyze the information.
Incomplete and imperfect information is an impediment to the diffusion of energy-efficient industrial technologies. Researching new technology consumes time and resources, especially for small firms, and many industries prefer to expend human and financial capital on other investment priorities. In some cases, industrial managers are simply not aware of energy efficiency opportunities and low-cost ways to implement them.
Investments in industrial energy-efficiency technologies are hindered by market risks caused by uncertainty about future electricity and natural gas prices and unpredictable long-term product demand.
Additionally, industrial end-use energy efficiency faces competing fiscal priorities.25 Tax credits designed to encourage technology adoption are limited by alternative minimum tax rules, tax credit ceilings, and limited tax credit carryover to following years; these restrictions prevent tax credits from being utilized to their full potential by qualified companies. Outdated tax depreciation rules that require firms to depreciate energy-efficiency investments over a longer period of time than other investments make energy-efficiency upgrades appear less cost-effective than other investment options for limited capital. Finally, utilities lack rate-based recovery mechanisms to reward them for operating energy efficiency programs; indeed, in many states electric utility profits are hurt by increased demand-side management. Commercialization and Deployment Strategy The U.S. strategy to advance the deployment of energy-efficient industrial technologies and practices is motivated, in part, by the larger goal of slowing and eventually stopping and reversing the growth of GHG emissions. Advancing the efficiency of manufacturing and industrial processes also contributes to global competitiveness and employment growth of the U.S. economy. There are 65 active Federal programs, policies, and initiatives identified in this report that promote deployment of GHG intensity-reducing technologies and practices in industry (Figure 2-7). Some of these activities crosscut multiple sectors and encourage low-carbon technologies throughout the economy, while others are tailored specifically for industry. Reflecting the importance of informed decision-making, about half of the identified activities involve labeling or the dissemination of information about energy-efficient technologies currently available to industry. Additionally, a new program focusing on Energy Efficiency for Data Center Buildings was authorized in EISA 2007. This voluntary national information program will produce specifications,
25 Existing fiscal policies, regulations, and statutes may be beneficial in a broad context of public policy, but often they compete with or conflict with the narrow objective of promoting C&D of certain GHG-reducing technologies. As a result, while providing overall benefits to society these policies may be found to hinder investment in clean energy technologies (see Box 1-2 in Chapter 1).
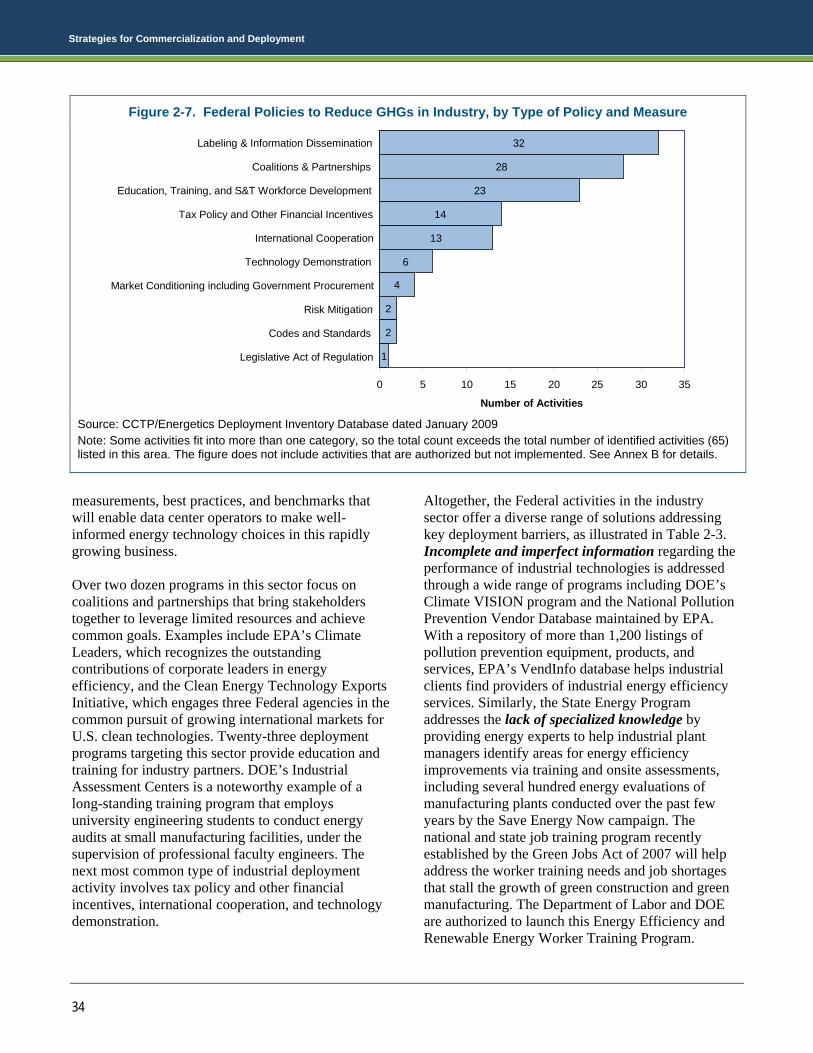
Strategies for Commercialization and Deployment
34
measurements, best practices, and benchmarks that will enable data center operators to make well-informed energy technology choices in this rapidly growing business. Over two dozen programs in this sector focus on coalitions and partnerships that bring stakeholders together to leverage limited resources and achieve common goals. Examples include EPA’s Climate Leaders, which recognizes the outstanding contributions of corporate leaders in energy efficiency, and the Clean Energy Technology Exports Initiative, which engages three Federal agencies in the common pursuit of growing international markets for U.S. clean technologies. Twenty-three deployment programs targeting this sector provide education and training for industry partners. DOE’s Industrial Assessment Centers is a noteworthy example of a long-standing training program that employs university engineering students to conduct energy audits at small manufacturing facilities, under the supervision of professional faculty engineers. The next most common type of industrial deployment activity involves tax policy and other financial incentives, international cooperation, and technology demonstration.
Altogether, the Federal activities in the industry sector offer a diverse range of solutions addressing key deployment barriers, as illustrated in Table 2-3. Incomplete and imperfect information regarding the performance of industrial technologies is addressed through a wide range of programs including DOE’s Climate VISION program and the National Pollution Prevention Vendor Database maintained by EPA. With a repository of more than 1,200 listings of pollution prevention equipment, products, and services, EPA’s VendInfo database helps industrial clients find providers of industrial energy efficiency services. Similarly, the State Energy Program addresses the lack of specialized knowledge by providing energy experts to help industrial plant managers identify areas for energy efficiency improvements via training and onsite assessments, including several hundred energy evaluations of manufacturing plants conducted over the past few years by the Save Energy Now campaign. The national and state job training program recently established by the Green Jobs Act of 2007 will help address the worker training needs and job shortages that stall the growth of green construction and green manufacturing. The Department of Labor and DOE are authorized to launch this Energy Efficiency and Renewable Energy Worker Training Program.
Figure 2-7. Federal Policies to Reduce GHGs in Industry, by Type of Policy and Measure
32
28
23
14
13
6
4
2
2
1
0 5 10 15 20 25 30 35
Labeling & Information Dissemination
Coalitions & Partnerships
Education, Training, and S&T Workforce Development
Tax Policy and Other Financial Incentives
International Cooperation
Technology Demonstration
Market Conditioning including Government Procurement
Risk Mitigation
Codes and Standards
Legislative Act of Regulation
Number of Activities
32
28
23
14
13
6
4
2
2
1
0 5 10 15 20 25 30 35
Labeling & Information Dissemination
Coalitions & Partnerships
Education, Training, and S&T Workforce Development
Tax Policy and Other Financial Incentives
International Cooperation
Technology Demonstration
Market Conditioning including Government Procurement
Risk Mitigation
Codes and Standards
Legislative Act of Regulation
Number of Activities Source: CCTP/Energetics Deployment Inventory Database dated January 2009 Note: Some activities fit into more than one category, so the total count exceeds the total number of identified activities (65) listed in this area. The figure does not include activities that are authorized but not implemented. See Annex B for details.
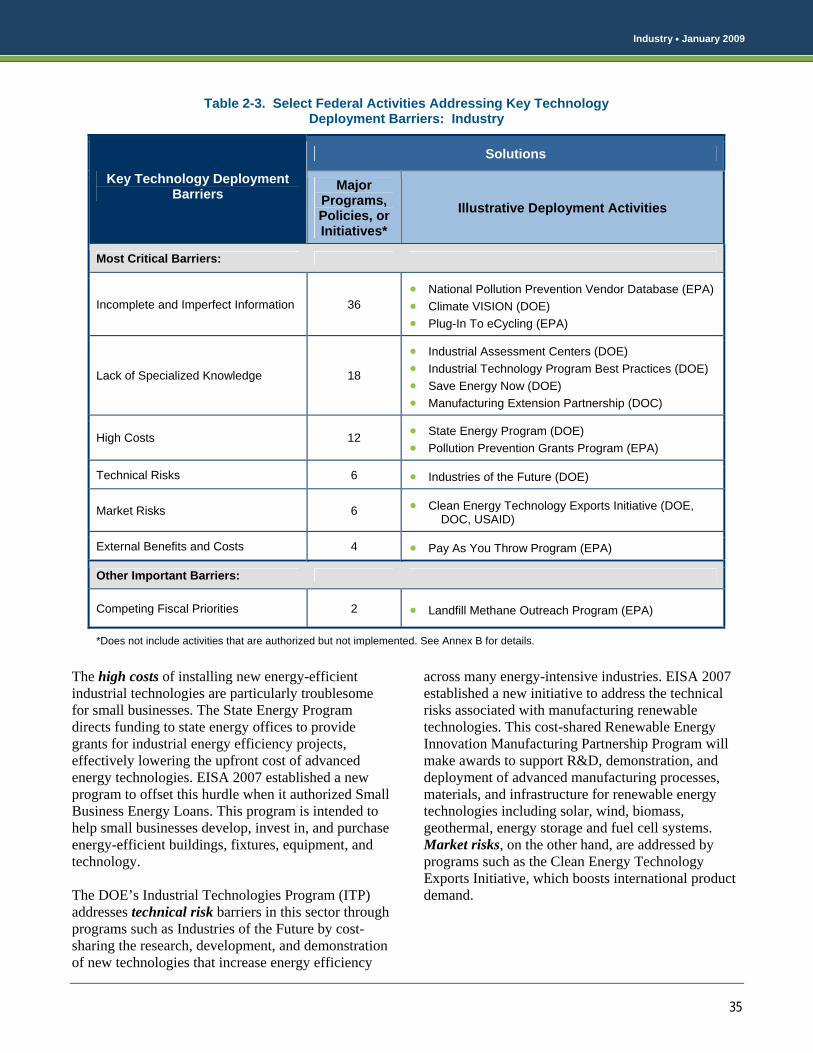
Industry January 2009
35
The high costs of installing new energy-efficient industrial technologies are particularly troublesome for small businesses. The State Energy Program directs funding to state energy offices to provide grants for industrial energy efficiency projects, effectively lowering the upfront cost of advanced energy technologies. EISA 2007 established a new program to offset this hurdle when it authorized Small Business Energy Loans. This program is intended to help small businesses develop, invest in, and purchase energy-efficient buildings, fixtures, equipment, and technology. The DOE’s Industrial Technologies Program (ITP) addresses technical risk barriers in this sector through programs such as Industries of the Future by cost-sharing the research, development, and demonstration of new technologies that increase energy efficiency
across many energy-intensive industries. EISA 2007 established a new initiative to address the technical risks associated with manufacturing renewable technologies. This cost-shared Renewable Energy Innovation Manufacturing Partnership Program will make awards to support R&D, demonstration, and deployment of advanced manufacturing processes, materials, and infrastructure for renewable energy technologies including solar, wind, biomass, geothermal, energy storage and fuel cell systems. Market risks, on the other hand, are addressed by programs such as the Clean Energy Technology Exports Initiative, which boosts international product demand.
Table 2-3. Select Federal Activities Addressing Key Technology Deployment Barriers: Industry
Solutions
Key Technology Deployment Barriers Major
Programs, Policies, or Initiatives*
Illustrative Deployment Activities
Most Critical Barriers:
Incomplete and Imperfect Information 36 • National Pollution Prevention Vendor Database (EPA) • Climate VISION (DOE) • Plug-In To eCycling (EPA)
Lack of Specialized Knowledge 18
• Industrial Assessment Centers (DOE) • Industrial Technology Program Best Practices (DOE) • Save Energy Now (DOE) • Manufacturing Extension Partnership (DOC)
High Costs 12 • State Energy Program (DOE) • Pollution Prevention Grants Program (EPA)
Technical Risks 6 • Industries of the Future (DOE)
Market Risks 6 • Clean Energy Technology Exports Initiative (DOE, DOC, USAID)
External Benefits and Costs 4 • Pay As You Throw Program (EPA)
Other Important Barriers:
Competing Fiscal Priorities 2 • Landfill Methane Outreach Program (EPA)
*Does not include activities that are authorized but not implemented. See Annex B for details.

Strategies for Commercialization and Deployment
36
Potential Gaps and Opportunities Developing and deploying more efficient and productive technology is the key to reducing carbon intensity in industry. Advanced industrial technologies and best practices in energy management are already working to improve energy efficiency and lower GHG emissions. The Federal government is supporting approximately 65 programs and policies to facilitate deployment of energy-efficient technologies and practices; about half of these programs, in particular, address information gaps and others tackle the lack of industry-specific specialized knowledge. These efforts have helped the industrial sector diminish GHG emissions in some of the nation’s most energy-intensive industrial facilities. Still, barriers to broader application of technologies suitable for commercialization in this sector remain. Technical and market risks, for instance, continue to impede best energy practices in industry. Strengthening the technology workforce of the future could improve energy efficiency and productivity, ultimately enhancing U.S. competitiveness. Despite numerous information dissemination efforts, imperfect information remains a strong impediment to the diffusion of advanced industrial technologies, as does the lack of a common value on avoided GHG emissions. Existing deployment activities provide only weak solutions to the lack of utility incentives for investing in energy efficiency. As in the buildings sector, decoupling profits from sales would enable electric utilities to remain revenue neutral between expanding electricity sales and encouraging energy efficiency. As innovative and revolutionary technologies enter the marketplace in the future, particularly in nano-manufacturing, bioprocessing, and fabrication of membranes, catalysts, organic photovoltaics and solid state lighting, Federal programs and policies may need to evolve to address the unique needs of the industrial sector and the potential implications for climate change.
2.4 ELECTRIC GRID AND INFRASTRUCTURE
As world population grows and standards of living rise, the global demand for electricity is projected to
continue its rapid expansion in both developing and industrialized economies. A rapid expansion of electricity demand will require an increase in transmission and distribution (T&D) system investments, expanded use of distributed generation, increased end-use efficiency and other demand-side measures, or some combination thereof. New T&D investments may include advanced technologies to reduce carbon emissions through lower line losses and access to carbon-free electricity generation. In the United States, the demand for electricity has increased at a rate such that it could eventually exceed current transmission capacity. Demand is projected to increase by 19 percent from 2003-2012 (EIA 2005), while only a six to nine percent increase in transmission is planned for 2002-2012 (DOE 2002).26 In addition, large reductions in future CO2 emissions may require that a significant amount of electricity be generated from carbon-free sources such as wind and geothermal energy, which are concentrated in regions of the country that are distant from large urban markets. At the same time that the nation’s demand for electric power is growing rapidly, the high-tech economy is placing greater requirements on increasing levels of power quality and power conditioning. To accommodate these trends, the future electricity transmission infrastructure needs to extend its capacity and evolve into an intelligent and flexible system that enables the use of a wide and varied set of baseload, peaking, and intermittent generation technologies (Figure 2-8). Enhancements for grid reliability will likely go hand in hand with improved efficiency of the electricity system.
26 NERC’s 2007 Long-Term Reliabilty Assessment estimates an increase of 8.8 percent in transmission infrastructure – see page 18 of report (NERC 2007).
Figure 2-8. Distributed Grid of the Future
Energy Management,Future CHP andSell to Grid Base-load, and
Industrial Cooling, Heat and Power
Power Qualityand CHP
Grid Ancillary Services
Remote Power andCHP
e-e-
e-
e-
e -
e -
Bulk Power
e-
Back-up Generation For Critical Services
(Source: CCTP 2006)

Electric Grid and Infrastructure January 2009
37
Suitable Infrastructure Technologies: Electric Grid Examples
High Temperature Superconducting (HTS) cables – can transmit electricity with near 100 percent efficiency and with half the energy loss of conventional cables. (CCTP 2005)
Advanced Sensors, Controls, and Communications – By enabling the diagnosis of local faults and coordination with power electronics and other existing protection schemes, these technologies provide autonomous control and enable isolation and mitigation of faults before they cascade through the system. As the grid incorporates more low-GHG distributed generators, such controls will be increasingly important.
Flywheels – By coupling a motor generator with a rotating mass, energy can be stored for short durations. Conventional flywheels are "charged" via an integral motor/generator, which draws power provided by the grid to spin the rotor of the flywheel. The kinetic energy stored in the rotor is later transformed to DC electric energy by the generator. Flywheels are in use in selected applications, but are not widespread.
The strategies for modernizing the nation’s grid infrastructure are designed to tackle the numerous barriers that have hindered progress. Federal actions focus on programs that seek to improve grid capacity, efficiency, and reliability while concurrently reducing GHG emissions. Improved grid technologies and architectures have much to gain: energy losses in the U.S. T&D system were 5.5 percent in 2003, accounting for 201 billion kilowatt hours of electricity generation and 133 million metric tons of CO2 emissions (EIA 2005, EPA 2007a). Advanced technologies have the potential to significantly improve the efficiency of electricity transmission by reducing energy losses and enabling access to carbon neutral generation in remote locations. Advanced storage concepts and particularly high temperature superconducting (HTS) wires and equipment represent long-term solutions with great promise. Digital sensors, information technologies, and controls may eventually enable real-time responses to system loads. HTS electrical wires might be able to carry 150 times the amount of electricity compared to the same-size conventional copper wires. Such possibilities may create totally new ways to operate and configure the grid. Power electronics will be able to provide significant advantages in processing power from distributed energy sources using fast response and autonomous control. Technologies Suitable for Commercialization and Deployment There are many T&D technologies that can improve efficiency and reduce GHG emissions, and some of the most promising of these are outlined in the CCTP Strategic Plan.27 In the near term, these include high-voltage DC (HVDC) transmission, high-strength composite overhead conductors, solid-state transmission controls such as Flexible AC Transmission System (FACTS) devices that include fault current limiters, switches and converters, and information technologies coupled with automated controls (i.e., a “Smart Grid”). High efficiency conventional transformers – commercially available although not widely used – could also affect distribution system losses. Advanced conductors integrate new materials with existing materials and other components and subsystems to achieve better technical, environmental, and financial performance –
27 See Chapter 4, Strategic Plan (CCTP 2006)
e.g., higher current carrying capacity, more lightweight, greater durability, lower line losses, and lower installation and operations and maintenance costs. Additionally, distributed generation (DG), utilizing photovoltaics, natural gas engines and turbines, energy-storage devices, and price-responsive loads, can improve system efficiencies while meeting a variety of consumer energy needs, including continuous power, backup power, remote power, and peak shaving. Such systems can be installed directly on the consumer’s premises or located nearby in district energy systems, power parks, and mini-grids. Improved sensors and controls, as part of the next-generation distributed electricity T&D system, could significantly increase the efficiency of electricity generation and delivery, thereby reducing the GHG emissions intensity associated with the electric grid. Outfitting the system with digital sensors, information technologies, and controls could further increase system efficiency, and allow greater use of more efficient distributed power technologies and end-uses. Energy storage allows intermittent renewable resources, such as photovoltaics and wind, to better meet power company needs for electricity that can be made available on demand (i.e., “dispatchable” power). Realizing these opportunities requires a

Strategies for Commercialization and Deployment
38
strong research portfolio and effective deployment activities targeted at the barriers to deployment that hinder market penetration. Barriers to Deployment28 While many advanced electric grid technologies are currently available and suitable for deployment, their market penetration appears to be impeded by many barriers including high costs, competing regulatory priorities, external benefits, competing statutory priorities, and tariffs. These obstacles make it difficult for innovative grid technologies to enter the marketplace, as summarized below.
High costs29 are associated with expanding the grid to provide transmission from remote areas with carbon-free generating systems to load centers. Establishing new electric system corridors is expensive, as is re-conductoring existing lines with higher capacity cables. These high costs are exacerbated by uncertainties about return on investment, technology performance, and future environmental regulations.
Competing regulatory priorities30 impede improvements to electric grid efficiencies. The ability to legally connect DG equipment to the grid depends on Federal, state, and local rules and regulations. Distributed energy resources located near final consumers typically do not receive credit for not requiring T&D lines. Utilities often pay only wholesale rates for the power, as if the
28 The existence of barriers and their identification in this report in no way implies it is the responsibility of the Federal government to address every (or any) barrier, in whole or in part. 29 In an efficiently functioning market, absent significant market failures or other imperfections, “high cost” is usually a market signal indicating a technology is not economically viable, due to the existence of low demand or less costly competitors or substitutes. The existence of high cost, identified here as a barrier to greater C&D, does not by itself suggest government intervention is necessary or advisable. In the case of GHG emissions, there currently exists no regulatory scheme to internalize external costs and benefits of rising atmospheric GHG concentrations and, hence, a market failure is known to exist and government intervention may be warranted. In the absence of an internalized market-valuing mechanism, however, the extent of that intervention remains unclear (see Box 1-1 in Chapter 1). 30 Existing fiscal policies, regulations, and statutes may be beneficial in a broad context of public policy, but often they compete with or conflict with the narrow objective of promoting C&D of certain GHG-reducing technologies. As a result, while providing overall benefits to society these policies may be found to hinder investment in clean energy technologies (see Box 1-2 in Chapter 1).
generating resource was located far from final consumers and required T&D. Thus, the value of having power located close to the end-use is not captured. The nation’s current approach to environmental regulation using “input-based emission standards” also fails to reward efficient production and hence hinders the growth of clean generation. Few states use output-based standards, which reward innovations such as combined heat and power (CHP) systems that productively use much of the waste heat from power production. In addition, new standards and protocols are needed to allow interoperability and inter-communication among smart-grid capable devices.
External costs inhibit displacement of greenhouse gases by electric utilities and optimization of the grid to enable low-carbon generation resources. For example, the absence of marketplace incentives for utilities to reduce their greenhouse gas emissions makes technologies that reduce line losses less cost effective, and encourages continued use of high GWP gases such as SF6. In general, electric utilities and wires companies in most states have little incentive to consider their GHG emissions profiles.
Making better use of the existing grid is impeded by current contracting and pricing practices that represent competing statutory priorities. In many areas, the system operators might fully load lines only a few hundred hours a year (usually during a weather event). Much more loading can often be squeezed out, but it requires innovative pricing strategies such as “flexible firm pricing.” Similarly, the under-utilization of time-of-use (TOU) rates is a barrier to photovoltaics and other DG resources that provide power disproportionately during on-peak periods.
Competing fiscal priorities impeding the growth of DG include excessive standby charges as well as utility buyback rates that do not provide credit for on-peak electricity production. Utilities also set high uplift charges (a fee that taxes the amount of revenue gained from selling electricity) and demand fees (a charge that penalizes customers for displacing demand from utilities), all of which discourage the use of distributed power systems. The variation in utility rate structures makes the financial viability of a CHP installation highly dependent on its location, hindering the development of national markets.

Electric Grid and Infrastructure January 2009
39
Many of these critical barriers are related to the industry structure, which, in many places, reflects regulated monopoly operation of electric generation and transmission; even in deregulated areas, market entry can be difficult and innovation muted by a persistent monopoly structure. Policy uncertainty related to the future legal treatment of GHG is also a barrier to investment in low-carbon grid technologies. Commercialization and Deployment Strategy The U.S. strategy to promote America’s energy security through reliable, clean, and affordable energy recognizes the importance of deploying the “next generation” of GHG intensity-reducing technologies throughout the nation’s electricity infrastructure. To be successful, the strategy is designed to tackle the numerous deployment barriers that hinder technological transformations in this sector. Thrity-nine Federal programs, policies, and initiatives are identified in Annex B as promoting the deployment of new technologies in the electricity transmission infrastructure (Figure 2-9). Most of these activities are broad programs that help address specific market barriers in this sector and in other sectors. Included are programs for improving
electricity transmission that also encourage remote or DG sources, such as the DOE’s Distributed Energy Program. A dozen activities concentrate on international cooperation – such as the Global Village Energy Partnership – to help open markets and provide energy solutions throughout the world. A number of key barriers specific to the electric grid and infrastructure sector are addressed by the Federal portfolio of solutions, as shown in Table 2-4. The DOE’s Office of Electricity Delivery and Energy Reliability (OE) operates several programs that address multiple barriers to the deployment of efficient electric grid technologies. For example, the Superconductivity Program is partnering with industry to reduce high cost barriers to transmission solutions, including advanced composite conductors, high temperature superconductors, and wide area measurement systems. Recognizing that successful deployment often requires tackling a range of barriers, EISA 2007 authorized the Waste Energy Recovery Incentive Grant Program to promote the recovery, use, and prevention of waste energy using multiple policy instruments. In addition to providing grants for projects that successfully produce electricity or incremental useful thermal energy from waste energy recovery, the program also allows for
Figure 2-9. Federal Policies to Reduce GHGs in Electric Grid and Infrastructure, by Type of Policy and Measure
12
12
11
10
7
6
4
3
1
1
0 2 4 6 8 10 12 14
International Cooperation
Labeling & Information Dissemination
Coalitions & Partnerships
Education, Training, and S&T Workforce Development
Tax Policy and Other Financial Incentives
Technology Demonstration
Market Conditioning including Government Procurement
Legislative Act of Regulation
Risk Mitigation
Codes and Standards
Number of Activities
12
12
11
10
7
6
4
3
1
1
0 2 4 6 8 10 12 14
International Cooperation
Labeling & Information Dissemination
Coalitions & Partnerships
Education, Training, and S&T Workforce Development
Tax Policy and Other Financial Incentives
Technology Demonstration
Market Conditioning including Government Procurement
Legislative Act of Regulation
Risk Mitigation
Codes and Standards
Number of Activities Source: CCTP/Energetics Deployment Inventory Database dated January 2009 Note: Some activities fit into more than one category, so the total count exceeds the total number of identified activities (39) listed in this area. The figure does not include activities that are authorized but not implemented. See Annex B for details.

Strategies for Commercialization and Deployment
40
Federal Programs at Work in Electric Grid and Infrastructure
Electricity Delivery and Energy Reliability program – provides support to states and regions for policies, market mechanisms, and activities that facilitate competitive, reliable, environmentally sensitive, and customer friendly electric markets.
Asia-Pacific Partnership on Clean Development and Climate –accelerate the deployment of clean energy technologies, such as electricity transmission.
Global Village Energy Partnership – provides forums to share best practices and new approaches for meeting rural energy needs that are sustainable and engage the private sector.
the consideration of a standard so that a waste energy recovery project may benefit from options involving the sale of net excess power to utilities, the transport of excess power by the utility for direct sale to a third party, the transport of electricity over private transmission lines, and other agreed upon alternatives between a utility and energy recovery project owner or operator. The Office of Electricity’s Permitting, Siting and Analysis Program helps overcome competing statutory and fiscal priorities such as utility tariffs and fees. It does this by supporting analysis and technical assistance to public utility commissions, state legislatures, and others. This deployment assistance is offered in partnership with national, regional, and state-based government and electric market groups. The Renewable and Distributed Systems Integration Program addresses competing regulatory priorities by supporting technologies and policies that enable the integration of DG, storage, demand/load
management, energy efficiency, and advanced power electronics into electric systems. Having bulk and distributed storage placed strategically in the electric network has the potential to transform the system, significantly improving reliability and operational efficiency. EISA 2007 calls for DOE’s utility energy
Table 2-4. Select Federal Activities Addressing Key Technology Deployment Barriers: Electric Grid and Infrastructure
Solutions Key Technology Deployment
Barriers Major
Programs, Policies, or Initiatives*
Illustrative Deployment Activities
Most Critical Barriers:
High Costs 6 • Superconductivity Program (DOE) • Advanced Energy Storage Program (DOE)
Competing Fiscal Priorities 4 • Electric Permitting, Siting, and Analysis (DOE)
Competing Regulatory Priorities 4 • Renewable and Distributed Systems Integration Program (DOE)
External Benefits and Costs 2 • State Energy Program (DOE)
Competing Statutory Priorities 1 • Electric Permitting, Siting, and Analysis (DOE)
Other Important Barriers:
Policy Uncertainty 12 • Nat’l Action Plan for Energy Eff (EPA, DOE) • Mandatory Reporting of Greenhouse Gas
Emissions (EPA)
Industry Structure 3 • Public Utility Regulatory Policies Act
*Does not include activities that are authorized but not implemented. See Annex B for details.

Summary January 2009
41
Efficiency Programs to promote energy efficiency as a priority for electric and natural gas utilities by having utilities integrate energy efficiency into resource plans and their planning processes. Utilities are also encouraged to modify their rates to align their incentives with the delivery of cost-effective energy efficiency. By tackling utility rate structures and incentive payments, these Federal deployment activities are also addressing statutes that can impede the deployment of advanced technologies. EISA 2007 also authorized DOE to establish new Federal policies under the Modernization of Electric Grid program, focused on establishing standards and protocols to allow interoperability and inter-communication of devices that contribute to maintaining grid reliability and infrastructure protection. In the absence of a market for mitigating SF6 and other greenhouse gases, DOE’s State Energy Program and its R&D assistance help address these external benefits and costs. The Smart Grid R&D and Demonstration program authorized by EISA in 2007 addresses the issue of external benefits by providing assistance for up to five demonstration projects focused on advanced technologies for use in power grid sensing, communications, analysis and power flow control. DOC/NIST is directed to establish standards to increase the interoperability of Smart Grid equipment and systems so that all electric resources, including demand-side resources, can contribute to an efficient, reliable electricity network. The Office of Electricity’s Energy Storage Program has been demonstrating the performance of existing advanced storage technologies (pre-commercial) and developing the next generation storage systems. The Office is also developing a real-time visualization, monitoring, and control system for the electric grid through the Visualization and Controls Program. It is critical for the United States to have a wide-area understanding of the grid network; this can be accomplished through GPS time-synchronized measurements of voltage, current, and frequency. Potential Opportunities and Gaps The improved deployment of carbon-neutral power generation provides a unique opportunity to transform and modernize the nation’s electric grid, consistent with meeting carbon stabilization goals. Numerous technologies to upgrade today’s electricity generation and delivery system (and reduce GHG emissions) are
already beginning to penetrate the market. Altogether, numerous Federal programs, policies, and initiatives are currently in place to address high-impact barriers and high-priority opportunities through an array of programs that improve grid capacity, efficiency, and reliability. Six of these PAMs identified in Annex B are addressing the high cost of deploying new grid technologies and another four are addressing competing regulatory priorities (Figure 2-9). However, because of substantial market barriers that still remain, electricity generators, wire companies, and consumers do not have an accurate picture of the economic and environmental benefits of improved efficiency and DG. For similar reasons, it is difficult to access wind resources and other carbon-neutral generation alternatives located in regions remote from urban centers. Better price signals and supporting regulations and statutes may be needed before innovative grid technologies can transform power systems and consumer markets. Further, uncertainty surrounding future policies and external costs and benefits related to GHG may need to be reduced to capitalize on the benefits offered by improving the electric grid. Finally, with the promulgation of several new grid initiatives in EISA 2007, it will be important to evaluate their progress and adapt the C&D strategies accordingly if progress is not being made.
2.5 SUMMARY While energy-efficiency improvements have provided important contributions to the nation’s energy sustainability over the past several decades, much greater advancement is needed to successfully address the nation’s climate change challenges and oil dependence. Each of the four end-use technology areas described above highlights the existence of barriers that continue to impede the progress of energy-efficient technologies and practices. Principal among these is the large upfront cost of low-GHG technologies. These energy saving measures do pay off as a result of utility bill savings, but nonetheless face resistance because of the initial “sticker shock.” There is also the important absence of a market value for GHG reductions, making it difficult for some energy-efficiency investments to be cost-competitive. However, many efficiency improvements are economically viable even without an added premium for reduced carbon emissions.

Strategies for Commercialization and Deployment
42
In the transportation sector, fuel economy remains a low priority in new vehicle purchase decisions (CNW 2004). The building industry’s fragmented and heterogeneous structure leads to competing drivers and misplaced incentives. The lack of workforce education and information are strong impediments to the diffusion of advanced industrial technologies. Electricity generators, wire companies, and consumers do not have an accurate picture of the economic and environmental benefits of improved efficiency and distributed generation. The Federal government has responded to reported information limits by creating numerous information and training programs, although additional efforts by industry or by various levels of government may further encourage technology deployment. Existing fiscal policies, regulations, and statutes may be beneficial in a broad context of public policy, but may compete with or conflict with the narrow objective of promoting C&D of certain GHG-reducing technologies. As a result, while providing overall benefits to society these policies may be found to hinder, or not support, investment in energy end-use and infrastructure technologies. For example, policies that seek to ensure the societal good of plentiful and reliable supply of power can discourage investments in low-carbon alternatives. The lack of utility incentives for investment in energy efficiency is a barrier across the full range of industry and building operations and users. Other regulations and price reforms may be needed before innovative grid technologies can transform power systems and consumer markets. Opportunities also exist in land-use planning to reduce vehicular miles traveled to combat the offset of GHG mitigation from advanced technologies. Many states need tougher energy building codes to upgrade construction practices, as well as stronger efforts to motivate energy improvements in existing buildings. Technical risks and lack of specialized knowledge continue to impede best energy practices, underscoring the value of a strong, knowledgeable workforce. This will not only fortify U.S. competitiveness, but also improve energy productivity. In the future, as new and more advanced technologies become ready for deployment (e.g., fuel cell vehicles, nano-fabricated membranes and catalysts, solid state lighting, and superconducting cables), Federal programs and policies may need to evolve to promote their GHG mitigation potential.

Chapter 3 January 2009
43
Chapter 3. Energy Supply
Transforming the energy supply sector to reduce GHG emissions will require deployment of innovative GHG-reducing technologies. For example, low-emission fossil fuel technologies, such as integrated gasification combined cycle plants can improve the efficiency of coal combustion by a few percentage points and have a significant impact on aggregate GHG emissions. Hydrogen has the potential to supplant hydrocarbon fuels and deliver net GHG reductions, though this is dependent on the source of hydrogen. Renewable power and fuels constitute a class of technologies that vary widely in terms of market readiness and penetration, but have great GHG mitigation potential as a whole. In
addition, nuclear fission substantially contributes to low-carbon power production and has significant potential to supply more in the future. Federal efforts are already at work removing barriers to deployment of GHG-reducing energy supply technologies. These programs include financial incentives, technology demonstrations, and information dissemination (Figure 3-1). Financial incentives – such as tax credits and loan guarantees – can reduce the incremental costs of GHG-reducing technologies compared with similar non-GHG-reducing technologies. Each of the following four sections describes the deployment strategies with
Figure 3-1. Federal Policies to Reduce GHGs in Energy Supply, by Type of Policy and Measure
35
32
31
23
22
22
19
10
7
3
0 5 10 15 20 25 30 35 40
Tax Policy and Other Financial Incentives
Education, Training, and S&T Workforce Development
Labeling & Information Dissemination
International Cooperation
Market Conditioning including Government Procurement
Coalitions & Partnerships
Technology Demonstration
Codes and Standards
Legislative Act of Regulation
Risk Mitigation
Number of Activities
35
32
31
23
22
22
19
10
7
3
0 5 10 15 20 25 30 35 40
Tax Policy and Other Financial Incentives
Education, Training, and S&T Workforce Development
Labeling & Information Dissemination
International Cooperation
Market Conditioning including Government Procurement
Coalitions & Partnerships
Technology Demonstration
Codes and Standards
Legislative Act of Regulation
Risk Mitigation
Number of Activities Source: CCTP/Energetics Deployment Inventory Database dated January 2009 Note: Some activities fit into more than one category, so the total count exceeds the total number of identified activities (124) listed in this area. The figure does not include activities that are authorized but not implemented. See Annex B for details.

Strategies for Commercialization and Deployment
44
respect to four major low-carbon energy supply options: low-emission fossil fuels, hydrogen, renewables, and nuclear fission.
3.1 LOW-EMISSION, FOSSIL-BASED FUELS AND POWER
Fossil fuels are expected to maintain a large share of the energy market because they are plentiful and easily converted into usable mechanical energy. The International Energy Agency (IEA 2006) projects that fossil-based sources will continue to comprise more than 80 percent of the primary energy market through 2030. Low-emission technologies, especially high-efficiency coal power plants like integrated gasification combined-cycle (IGCC) and supercritical pulverized coal (SCPC) plants can dampen the associated growth in GHG emissions as this market expands. Similarly, in the United States, it is unlikely that fossil fuels will be replaced by non-emitting sources in the near future. “Despite the rapid growth projected for biofuels and other non-hydroelectric renewable energy sources and the expectation that orders will be placed for new nuclear power plants for the first time in more than 25 years, oil, coal, and natural gas still are projected to provide roughly the same 86 percent share of the total U.S. primary energy supply in 2030 that they did in 2005” (EIA 2007a). The C&D strategies to improve fossil-fuel use thus focuses on clean and efficient coal technologies, such as gasification and combined-cycle plants, co-production efforts, and high efficiency improvements (Figure 3-2). In the long-term, being able to continue to use fossil resources for fuel and power could help allow for continued economic prosperity. The C&D Strategies Report recognizes that fossil-based power systems in conjunction with carbon capture and storage (CCS) efforts can be effective in mitigating GHG emissions and that the United States is working, in
collaboration with other nations, to demonstrate successful technologies and reduce risks and costs. The two main thrusts of the strategies to reduce GHG emissions through accelerated deployment of low-emissions fossil energy address the high relative costs of low-emissions technology and seek to reduce the technical risks of adopting these technologies. Reducing costs and risks can make commercialization and deployment easier, especially with ongoing research and development to improve the available technologies. For example, advanced ion membranes are under development, which could replace conventional technologies for both oxygen separation and hydrogen recovery with greater efficiencies in the process. Continuing research in improving solid-oxide fuel cells and heat exchanger technologies could also offer additional efficiency improvements (CCTP 2006). Technologies Suitable for Deployment Several deployable technologies enable use of fossil resources with reduced emissions:
Advanced Power Systems that allow for greater efficiencies in power generation from fossil resources are expected to be significant emissions reducers for both GHG and criteria pollutants. IGCC systems, for example, could achieve environmental benefits of gas-fired generation with the thermal performance of a combined-cycle plant, yet with the low fuel cost associated with coal. IGCC is considered suitable for commercialization as the technology has
Figure 3-2. Coal-Based Energy Complex
(Source: DOE 2004)

Low-Emission, Fossil-Based Fuels and Power January 2009
45
Suitable Low Emission Technologies: Power Systems Examples
Advanced Combustion Systems – Oxygen-enhanced combustion can reduce NOx emissions and facilitate carbon sequestration (CCTP 2005). Integrated Gasification Combined Cycle (IGCC) – IGCC is a clean coal technology that combines coal gasification and combined cycle technologies to potentially achieve the environmental benefits of gas-fired generation with the thermal performance of a combined-cycle plant, yet with the low fuel cost associated with coal. Compare d to pulverized coal power plants, IGCC has been able to not only demonstrate a 20% reduction in CO2, but also enable easier carbon capture and sequestration (Ratafia-Brown et al 2002).
demonstrated technical readiness via several successful full-scale demonstration projects. By operating at higher temperatures, SCPC plants also offer efficiency improvements and emission reductions; however, significant emissions reductions from SCPC will require post-combustion capture of carbon dioxide.
Distributed Generation and Stationary Fuel Cells provide point-of-use and on-demand power that can reduce transmission losses along with waste and emissions. Stationary fuel cells up to the MW scale are considered suitable for commercialization in niche applications.
Co-production of Hydrogen with electricity offers additional flexibility in use of coal resources and improves overall plant efficiency to around 50 percent. While not commercially viable now, DOE is conducting R&D on power and hydrogen production technology using coal. Co-production plants have demonstrated commercial suitability in that traditional fossil-fuel plants can be configured to produce hydrogen and other marketable products such as chemicals or fuels.
Barriers to Deployment31 Fossil-based power sources are widely used; indeed, they are the most-used resource for energy
31 The existence of barriers and their identification in this report in no way implies it is the responsibility of the Federal government to address every (or any) barrier, in whole or in part.
worldwide. However, in a future where GHG emissions are to be avoided, significant expansion of methods to reduce emissions of fossil-fuel combustion products must occur. Barriers to significant expansion of efficient co-production technologies include the high incremental costs of low-emissions technologies, technical risks associated with first-of-a-kind facilities, no return on external benefits of reduced emissions, and current regulations that provide a disincentive to retiring older fossil plants.
More efficient power plants such as IGCC systems and SCPC plants require higher capital costs than conventional fossil plants. The incremental increase to the cost of electricity from adding CCS has been estimated at 81 percent for new SCPC plants and 36 percent for new IGCC plants (NETL 2007). These estimates are well over the targets of 20 percent and 10 percent for capture technologies. The projected high costs32 represent major barriers to potential investors.
Operating experience with these newer designs is also limited. Reliability concerns and perceived technical risks deter investors from the newer designs and toward building proven, familiar plants.
Because investors cannot capture the benefit of lower carbon dioxide emissions from these power plants (that is, because these emission reductions are external benefits), it is difficult to recover the higher cost of these plants over conventional fossil plants. Research, development, and demonstration (RD&D) can take these new systems to the point of commercial readiness, but rapid deployment will not occur unless there is a reasonable value associated with carbon capture and storage (e.g., through tax credits).
32 In an efficiently functioning market, absent significant market failures or other imperfections, “high cost” is usually a market signal indicating a technology is not economically viable, due to the existence of low demand or less costly competitors or substitutes. The existence of high cost, identified here as a barrier to greater C&D, does not by itself suggest government intervention is necessary or advisable. In the case of GHG emissions, there currently exists no regulatory scheme to internalize external costs and benefits of rising atmospheric GHG concentrations and, hence, a market failure is known to exist and government intervention may be warranted. In the absence of an internalized market-valuing mechanism, however, the extent of that intervention remains unclear (see Box 1-1 in Chapter 1).

Strategies for Commercialization and Deployment
46
Competing regulatory priorities33 created grandfather exemptions for existing units from Clean Air Act requirements that allow plants to operate in the regulatory environment that they were originally designed, but discourage new plant construction of more technologically advanced and efficient designs. Such policies encourage continued operation of older power plants that emit more greenhouse gases per kilowatt-hour of electricity generated.
Other barriers affect this sector, including current industry structure, infrastructure limitations in the supply chain (including the absence of a carbon capture equipment industry for fossil-fired units), and policy uncertainty related to possible future GHG markets and regulations. (Figure 3-3)
The structure of the power industry is such that newer, smaller types of power production are
33 Existing fiscal policies, regulations, and statutes may be beneficial in a broad context of public policy, but often they compete with or conflict with the narrow objective of promoting C&D of certain GHG-reducing technologies. As a result, while providing overall benefits to society these policies may be found to hinder investment in clean energy technologies (see Box 1-2 in Chapter 1).
often overlooked in favor of large, familiar power sources. This industry structure makes entry difficult for low-emissions fossil sources like distributed generation. Due to fragmented markets and lack of uniformity in codes and standards, distributed generation and stationary fuel cells face a market with challenges for deployment success.
Additionally, there are broad supply chain issues including the lack of one-stop vendors of IGCC or SCPC plants which may present an infrastructure limitation in the United States.
Policy uncertainty regarding long term emissions reduction goals and future legal treatment of GHGs hinders investment in low-emission fossil systems.
Commercialization and Deployment Strategy To address the barriers facing low-emission, fossil-based fuels and power, the C&D strategies include over 40 programs, policies, and measures listed in Annex B. Many of these activities crosscut multiple sectors with only two identified as specifically designed for low-emission, fossil-based fuels and power. The broad focus of the strategies encourages
Figure 3-3. Federal Policies to Reduce GHGs through Low-Emission, Fossil-Based Fuels and Power, by Type of Policy and Measure
15
14
14
11
8
6
5
2
1
1
0 2 4 6 8 10 12 14 16
Tax Policy and Other Financial Incentives
International Cooperation
Labeling & Information Dissemination
Education, Training, and S&T Workforce Development
Coalitions & Partnerships
Technology Demonstration
Market Conditioning including Government Procurement
Codes and Standards
Risk Mitigation
Legislative Act of Regulation
Number of Activities
15
14
14
11
8
6
5
2
1
1
0 2 4 6 8 10 12 14 16
Tax Policy and Other Financial Incentives
International Cooperation
Labeling & Information Dissemination
Education, Training, and S&T Workforce Development
Coalitions & Partnerships
Technology Demonstration
Market Conditioning including Government Procurement
Codes and Standards
Risk Mitigation
Legislative Act of Regulation
Number of Activities Source: CCTP/Energetics Deployment Inventory Database dated January 2009 Note: Some activities fit into more than one category, so the total count exceeds the total number of identified activities (44) listed in this area. The figure does not include activities that are authorized but not implemented. See Annex B for details.

Low-Emission, Fossil-Based Fuels and Power January 2009
47
Federal Programs at Work in Low-Emission, Fossil-Based Fuels and Power
Clean Coal Power Initiative – support investments in low-emission fossil clean coal by providing government financial assistance for clean coal projects.
Combined Heat and Power (CHP) Partnership – seeks to reduce the environmental impact of power generation by promoting the use of CHP through public/private partnerships.
Fuel Cell Test and Evaluation Center – focuses on accelerating the development and commercialization of stationary fuel cell systems through tests, evaluations, and demonstrations.
commercialization and deployment across many areas to reduce GHG emissions. These activities help address specific technical and market barriers in the low-emission, fossil-based fuels and power sector. Federal actions designed to overcome barriers in this sector focus on encouraging deployment of advanced power systems, fuel cells, and co-production facilities. Federal deployment activities in this area mostly concentrate on international cooperation, financial assistance, and education and information. International collaborations, like those funded through the International Clean Energy Foundation, which is authorized to received additional U.S. funding through EISA 2007, allow for research and demonstrations to take place across the globe and the findings to be shared to advance technologies in member countries. EISA also authorized to establish Assistance to Promote Clean and Energy Efficient Technologies in Foreign Countries, which should improve the capacity of targeted foreign governments to use energy technologies developed in the United States. More than a dozen Federal measures identified in Annex B offer financial incentives or tax credits, both of which help to alleviate high costs associated with advanced technologies. Education, training, and information programs are necessary to provide for a knowledgeable workforce and public, and there are numerous such programs included in the C&D strategies relevant to this sector. In total, these measures make up a diverse portfolio of Federal solutions that address key barriers specific to this sector, as shown in Table 3-1.
The high cost of advanced coal-based power generation is partially offset by tax credits and potential loan guarantees. The Energy Policy Act of 2005 authorizes tax credit programs applicable for this sector; additional programs offer financial incentives for low-emission fossil fuels and power, such as the Clean Coal Power Initiative. EPAct 2005 also includes a provision authorizing loan guarantees for certain low-emissions fossil plants under Section 1703. The Super Energy Savings Performance Contracts established by the Department of Energy allow for government agencies to take advantage of the energy savings performance contract financing mechanism without needing to spend the time to develop a standalone contract; performance contracts allow for the capital costs to be paid back through energy savings over a set period of time. Technical risks associated with uncertain technical performance are reduced by demonstration and validation projects such as those that are cost-shared by DOE’s Distributed Energy Program. By requiring utilities to pay independent power producers at the avoided cost of new generation, the Public Utility Regulatory Policies Act (PURPA) allows many low-emission fossil power producers such as cogeneration facilities and small-scale, gas-fired power plants to enter the electricity market by counteracting competing regulatory priorities that may limit entry. The Global Gas Flaring Reduction Partnership helps to develop markets for gas and bring international gas markets together to provide a disincentive to flaring; reducing flaring of fossil fuels through markets can overcome the lack of regulations to not flare. The Business Energy Tax Credit exemplifies the C&D strategies effort to help internalize external benefits by offering a credit of up to 30 percent for installation of certain technologies, including fuel cells. Potential Opportunities and Gaps Improvements in the efficiency of fossil fueled power plants by a few percentage points can have a significant impact on aggregate GHG emissions. Two power plants in the U.S. utilizing IGCC technology instead of traditional pulverized coal are already demonstrating emissions reductions. The

Strategies for Commercialization and Deployment
48
C&D strategies include more than 40 Federal activities identified in Annex B that are acting with the common goal to address barriers to deployment of low-emission fossil power. Federal policies such as tax credits and other financial incentives that reduce the incremental costs to the utility for investing in more efficient technologies are already having an impact on this industry by addressing high costs of early deployment and external benefits. Additionally, the C&D strategies include measures that address competing regulatory priorities, technical risks, industry structure, and infrastructure limitations. However, the choices decision makers face when building new power plants and selecting fuel sources strongly depend on expected return on investment and technical confidence, leading to preference for
proven, incumbent plant technology. Further development of the supply chain for low-emissions fossil- based fuel and power may encourage technology innovation through simplified integrated designs. Nevertheless, as long as carbon and other GHG emissions have negligible effect on the bottom line, it is difficult for investors to take on the additional risks and expenses that lead to efficiency improvements even when incremental cost associated with the power plant are largely offset. Cost-shared government programs demonstrating the effectiveness of low-emission fossil-based fuel and power are useful instruments for reducing technical risks. The C&D strategies should continue to evaluate policies and programs to provide investors with confidence in newer technologies and greater policy certainty that may continue to aid commercialization and deployment of this sector.
Table 3-1. Select Federal Activities Addressing Key Technology Deployment Barriers: Low-Emission, Fossil-Based Fuels and Power
Solutions
Key Technology Deployment Barriers
Major Programs, Policies, or Initiatives*
Illustrative Deployment Activities
Most Critical Barriers:
High Costs 14
• Clean Coal Facility Tax Credit • Clean Coal Power Initiative (DOE) • Combined Heat and Power Partnership (EPA) • Loan Guarantee Program (DOE) • Super Energy Savings Performance Contracts
(DOE)
Technical Risks 6 • Distributed Energy Program (DOE) • Fuel Cell Test and Evaluation Center (DOD) • Clean Coal Power Initiative (DOE)
Competing Regulatory Priorities 5 • Global Gas Flaring Reduction Partnership • Public Utility Regulatory Policies Act
External Benefits and Costs 5 • Business Energy Tax Credit
Other Important Barriers:
Policy Uncertainty 13 • Global Climate Change Initiative
Infrastructure Limitations 5 • Electric Permitting, Siting, and Analysis (DOE)
Industry Structure 2 • Public Utility Regulatory Policies Act
*Does not include activities that are authorized but not implemented. See Annex B for details.

Hydrogen January 2009
49
3.2 HYDROGEN Restrictions on GHG emissions or a constrained global primary energy supply will increase the need for low-carbon, non-fossil energy sources. Hydrogen could play important part of the portfolio of low- or non-carbon energy choices for both the transportation sector and stationary applications, and there is widespread international interest in advancing hydrogen technology to address the growing emissions, supply, and energy security concerns associated with conventional fuels. Governments and industry around the world are engaged in research, development, and demonstration (RD&D) programs to enable hydrogen technology to be a viable and cost-effective alternative. The U.S. approach includes RD&D of hydrogen production, delivery, storage, and end-use technologies; illustrative hydrogen production options are shown in Figure 3-4. In the United States, the strategy for deploying hydrogen-based technologies primarily focuses on the transportation sector while also working to advance stationary applications. In some other countries (e.g., Japan), there is greater focus and potential for hydrogen used in stationary fuel cells for residential heating/cooling. The widespread use of hydrogen and fuel cell technologies depends not only on successfully meeting consumer expectations
and overcoming technology barriers, but also on developing a substantial hydrogen delivery infrastructure. Infrastructure development is envisioned to occur in two stages. In order to cost-effectively produce hydrogen at the point of use, in the first stage, hydrogen production would rely primarily on natural gas, using the existing natural gas delivery infrastructure; in the second stage, hydrogen production would rely on central and distributed production using energy resources not associated with carbon emissions. A long-term vision for widespread hydrogen and fuel cell use includes fuel cell vehicles with performance similar to today’s cars, as well as local hydrogen refueling stations looking and operating much like today’s gasoline-fueling stations. Hydrogen would be produced on site or delivered to the station either as compressed gas or in the form of a hydrogen-rich material from which the hydrogen could be separated easily. Stationary fuel cells powered by hydrogen could also provide electricity and heating needs for homes and businesses, and even potentially feed electricity into the regional electrical grid. Hydrogen may be delivered through a pipeline system modeled after the current natural gas distribution system—more than 1,200 miles of hydrogen pipeline are in operation today. The hydrogen would be produced in a variety of ways that do not emit CO2, including: renewable energy-
based electrolysis; various biological and chemical processes; water shift reactions with coal and natural gas, accompanied by CO2 capture and storage; thermal and electrolytic processes using nuclear energy; and direct photo conversion. To achieve this vision, technical, economic, and institutional challenges must be overcome. Progress is required on
Figure 3-4. Domestic Hydrogen Production Options
(Source: DOE 2009a)

Strategies for Commercialization and Deployment
50
Suitable Hydrogen Technologies: Fuel Cell Early Markets
Forklifts – Fuel cell powered forklifts (lift trucks) are replacing lead-acid battery powered trucks with notable advantages of reduced charging time, longer operable times, and greater stability in performance that provide life-cycle cost savings to the user (Teresko 2007).
Backup Power – Fuel cells can provide backup power to remote applications such as radio and cell towers. In this application, fuel cells replace generators and batteries with reliable and cost-effective performance (DOE 2008b).
Primary Power – Fuel cells can provide high-quality, reliable, grid-independent, and on-site power for critical loads such as data centers.
numerous technical fronts, including reducing the costs of producing and storing hydrogen and making the associated fuel cell technologies more reliable, cost-effective, and able to meet consumer expectations for performance. Significantly, the most cost-effective means of producing hydrogen today is from natural gas, which results in CO2 emissions during conversion. Well-to-wheels analysis shows, however, that fuel cell vehicles operating on hydrogen from natural gas emit about 10 percent less CO2 than gasoline hybrid vehicles and 45 percent less than gasoline internal combustion engines (ICE) vehicles (ANL 2008). The existing natural gas infrastructure also provides a means to scale up hydrogen infrastructure at reduced cost while performing the R&D necessary to enable long-term, cost-effective, non-carbon-emitting hydrogen production. Though much work is still needed, hydrogen could play a valuable enabling and synergistic role in transportation as well as heat and power generation (CCTP 2006). Technologies Suitable for Commercialization and Deployment Hydrogen can be produced using diverse, domestic resources, including fossil fuels such as natural gas and coal; nuclear power; and biomass and other renewable energy technologies, such as wind, solar, geothermal, and hydroelectric power (DOE 2008a). Hydrogen production from natural gas steam reforming has already been commercialized, and a large infrastructure for the distribution and extraction of natural gas already exists. U.S. industry currently produces approximately nine million tons of hydrogen annually. More than 90 percent of the hydrogen produced in the United States is derived from steam reforming of natural gas (Ogden 1999). With reformer technology commercially available and with greater economies of scale, it is likely that increased use will make this technology more widespread. Distributed hydrogen production from natural gas that uses small-scale steam methane reforming technology offers several advantages over centralized hydrogen production technologies to meet near-term hydrogen infrastructure needs. It can be located at a consumer-fueling site, requires less capital investment for the small hydrogen volumes needed initially, and reduces the immediate need for an extensive hydrogen infrastructure (Ogden 2002).
Fuel Cells. Fuel cells are an important enabling technology and offer cleaner, more efficient alternatives to the combustion of gasoline and other fossil fuels. Fuel cells have the potential to replace the internal combustion engine in vehicles, provide power and heat for stationary applications, and power portable applications because they are energy-efficient, clean, and fuel-flexible (DOE 2008c). In stationary applications, fuel cells are being supplied as commercial products in specialty markets. Hospitals, credit-card-processing facilities, data centers, and others are using fuel cells for primary power, often in combined heat and power applications. Telecommunications firms are using hydrogen fuel cells for back up power, and both government and industry are using fuel cells for material handling equipment in high-volume distribution centers and warehouses. In vehicular applications, fuel cells are being demonstrated in automobile and bus fleets around the world. A significant number of companies are manufacturing fuel cells, and numerous other firms are conducting R&D with a five- to 10-year period for deployment of these technologies (CCTP 2005). Storage and Transport Technologies. Unlike electricity, hydrogen can be stored for long periods without significant losses. Today, hydrogen is stored as a cryogenic liquid or compressed gas; it is transported as a cryogenic liquid or in high-pressure trucks, and to a limited extent, by gaseous pipelines. Other newer technologies are beginning to be commercialized to improve hydrogen storage and transport. For example, metal hydrides have been

Hydrogen January 2009
51
used to store hydrogen for use in prototype demonstration vehicles (Northeast Advanced Vehicle Consortium). High-pressure composite tanks that can store hydrogen up to 10,000 psi have been certified and have seen limited commercial application. For hydrogen transport, although pipelines are in moderate use today to transport hydrogen where refineries and chemical plants are concentrated, advances in pipeline materials will enable greater capacity and less maintenance (DOE 2008d).34 Barriers to Deployment35 Introducing hydrogen into the mix of competitive fuel options will require a balanced technical approach that not only envisions a plausible large-scale commercialization path, but also considers long-run uncertainties. In the transportation sector, this means there must not only be plants to make hydrogen fuel cell vehicles, dealerships to sell them, and stations to fuel them, but also materials and people to service them, sites to produce the hydrogen, and a system to deliver the hydrogen. Although some stationary fuel cells are commercially available today, stationary applications have similar needs. The following are key deployment barriers that must be overcome for widespread deployment of hydrogen technologies; over the mid to long term, cost and risks are expected to decline while infrastructure limitations may become more pressing.
As an energy carrier, hydrogen offers the potential of a non-carbon fuel if it is produced from carbon-free primary energy sources. Because of the current superiority of carbon fuels in energy density, infrastructure, and public knowledge, a non-carbon fuel may not be adopted unless its carbon mitigation (i.e. external benefits) and other attributes are given a market value. Using hydrogen could not only provide non-emitting transportation and stationary power but (if produced without hydrocarbons) could also reduce environmental damage from oil and coal retrieval as well as improve energy security. Like electricity, the life-cycle GHG emissions
34 Currently, there are about 1,200 miles of hydrogen pipeline. Hydrogen is also carried on trucks, rail, and barges. 35 The existence of barriers and their identification in this report in no way implies it is the responsibility of the Federal government to address every (or any) barrier, in whole or in part.
associated with hydrogen use would vary depending on the method to produce, store, and distribute it.
Hydrogen fuel production and key complementary technologies (i.e. those that use hydrogen as fuel or make use of hydrogen fuel possible) face high costs.36 The economic viability of different production pathways will likely be affected by regional factors, such as feedstock availability and cost, delivery approaches, and regulatory environment. Because fuel cells currently require platinum for optimal performance, they are also inherently costly. As a result of these high upfront costs, some publicly owned fuel cell manufacturers are selling at a loss to try to increase the market base; this is not a sustainable effort. R&D has reduced the projected, high-volume cost of fuel cells from $275/kilowatt in 2002 to $73/kilowatt in 2008 (Garland 2008). Manufacturing economies of scale, as well as materials advances and substitutions will lower costs even further.
Large-scale ubiquitous production of hydrogen from clean energy pathways requires scientific advances, and widespread deployment faces several technical challenges. Hydrogen must be produced efficiently and cost-effectively so that it is competitive with conventional fuels ($2 - $3/gallon gasoline equivalent hydrogen). R&D has reduced the cost of hydrogen produced using distributed natural gas to $3/gge (DOE 2006d). Renewable production technologies include bio-derived liquid reforming, electrolysis, biomass gasification/pyrolysis, high temperature thermochemical cycles, photoelectrochemical, and biological processes. In addition to production from natural gas and renewable sources, producing hydrogen at IGCC plants with carbon
36 In an efficiently functioning market, absent significant market failures or other imperfections, “high cost” is usually a market signal indicating a technology is not economically viable, due to the existence of low demand or less costly competitors or substitutes. The existence of high cost, identified here as a barrier to greater C&D, does not by itself suggest government intervention is necessary or advisable. In the case of GHG emissions, there currently exists no regulatory scheme to internalize external costs and benefits of rising atmospheric GHG concentrations and, hence, a market failure is known to exist and government intervention may be warranted. In the absence of an internalized market-valuing mechanism, however, the extent of that intervention remains unclear (see Box 1-1 in Chapter 1).

Strategies for Commercialization and Deployment
52
Federal Programs at Work in Hydrogen Hydrogen Program – at DOE seeks to develop hydrogen, fuel cell, and infrastructure technologies needed to achieve cost-effectiveness. At other Federal agencies, including the Departments of Agriculture, Commerce, Defense, and Transportation, as well as Environmental Protection Agency, NASA, National Science Foundation, and U.S. Postal Service support activities that advance the development and use of hydrogen technologies. Their efforts are coordinated through an interagency working group and task force.
International Partnership for the Hydrogen Economy – provides an international forum for advancing policies, and common technical codes and standards to accelerate the development and use of hydrogen technologies.
sequestration and high-temperature nuclear reactors is also of interest. Each of these options faces its own set of deployment challenges. An additional technical challenge to the use of hydrogen as a transportation fuel is finding safe, low-cost, lightweight, and low-volume hydrogen storage technologies. Existing high pressure gaseous hydrogen storage systems in prototype hydrogen-powered vehicles offer a shorter driving range or less cargo space than conventional gasoline-powered vehicles. Alternative technologies based on hydrogen-rich materials have the potential to store more hydrogen than a traditional tank of similar size filled with hydrogen gas or liquid, but substantial R&D is required to develop these concepts further.
The infrastructure requirements associated with large-scale storage and delivery of hydrogen in both the power and transportation sectors are more challenging than for most fuels. Because of these infrastructure limitations, most hydrogen today is produced on a small-scale at sites located at or near points-of-use. As demand for hydrogen increases, greater attention to infrastructure will be required to ensure a reliable hydrogen supply.
Hydrogen technologies also face other barriers to widespread deployment, such as statutory uncertainty and inadequate workforce knowledge. These barriers could be alleviated in the short term to enable further development.
Development and promulgation of uniform codes and standards is necessary to overcome statutory uncertainty and critical to establishing a market-receptive environment for commercializing hydrogen-based products and systems (NREL 2002).
A lack of specialized knowledge in the current workforce requires that training and certification systems are developed to facilitate the development and widespread use of hydrogen technologies (NAE 2004).
Commercialization and Deployment Strategy U.S. efforts to commercialize and deploy hydrogen technologies are motivated by environmental, resource supply, and national security objectives. In the long term, hydrogen displacement of conventional transportation fuels presents an opportunity for the United States to reduce its
reliance on foreign oil and reduce GHG and criteria pollutant emissions while also shrinking its trade deficit. The C&D strategies to promote hydrogen technologies include broad efforts to reduce risk, stimulate demand, and improve technology. While not included in the scope of this document, the United States is also supporting basic and applied research in hydrogen production, storage, conversion, and application to continue to push the technological frontier. With the background and leadership of the U.S. Department of Energy, collaboration with industry and international colleagues, and recent domestic energy legislation, the U.S. is moving towards overcoming the barriers facing hydrogen technologies. Currently there are over 20 Federal programs, policies, and initiatives identified in Annex B that are part of the strategies to encourage deployment of technologies in the hydrogen industry (Figure 3-5). International efforts can achieve technology adoptions and advancements by sharing resources. The International Partnership for the Hydrogen Economy (IPHE), created in 2003, represents just one prominent example where 17 nations, including the United States, are working together to accelerate hydrogen technology deployment. These policies, programs and measures systematically address the key barriers believed to

Hydrogen January 2009
53
be impeding greater application of hydrogen technologies. A comprehensive list of the activities is provided in Annex B. A representative selection of some of the more important of these activities, aligned with their respective barriers, is summarized in Table 3-2. Infrastructure limitations are being addressed through efforts in DOE’s Hydrogen Program and the Department of Transportation to facilitate long term planning and encourage development of alternative fuel infrastructure. Considering the higher relative first cost of hydrogen technologies, tax and financial incentives are also common types of measures. An example is the Investment Tax Credit (ITC), which provides a tax credit of 30% of the cost of qualified fuel cell property, up to $3,000/kilowatt. This tax credit, included in the Emergency Economic Stabilization Act of 2008, is available through 2016. Loan guarantees can also help address high costs; DOE has loan guarantee authority for clean technologies such as hydrogen that can "avoid, reduce, or sequester air pollutants or anthropogenic emissions of greenhouse gases.”
Federal programs are, in many cases, designed to reduce technical risks across the industry segments, including production, delivery, storage, conversion, and application. An illustrative example of this is the DOE Hydrogen Program, which seeks to develop hydrogen, fuel cell, and infrastructure technologies through partnerships with the private sector. Technology demonstration is especially important and is addressed in several of the Federal activities. DOE’s National Hydrogen Learning Demonstration brings together teams of automobile and energy company partners as well as their suppliers to validate fuel cell vehicle and hydrogen infrastructure technologies in integrated systems and real-world operation. The demonstration provides critical data on performance and operations that help to inform R&D efforts, while also providing valuable lessons learned on the implementation of codes and standards and community outreach activities. These and other demonstration programs, including the Department of Transportation’s National Fuel Cell Bus Program, play a significant role in evaluating technology readiness. To address external benefits, tax credits and other mechanisms support hydrogen technology deployment. DOE has been working with states via
Figure 3-5. Federal Policies to Reduce GHGs through Hydrogen by Type of Policy and Measure
7
6
5
5
4
3
3
2
1
0 1 2 3 4 5 6 7 8
Education, Training, and S&T Workforce Development
Tax Policy and Other Financial Incentives
International Cooperation
Labeling & Information Dissemination
Technology Demonstration
Codes and Standards
Market Conditioning including Government Procurement
Coalitions & Partnerships
Risk Mitigation
Number of Activities
7
6
5
5
4
3
3
2
1
0 1 2 3 4 5 6 7 8
Education, Training, and S&T Workforce Development
Tax Policy and Other Financial Incentives
International Cooperation
Labeling & Information Dissemination
Technology Demonstration
Codes and Standards
Market Conditioning including Government Procurement
Coalitions & Partnerships
Risk Mitigation
Number of Activities Source: CCTP/Energetics Deployment Inventory Database dated January 2009 Note: Some activities fit into more than one category, so the total count exceeds the total number of identified activities (21) listed in this area. The figure does not include activities that are authorized but not implemented. See Annex B for details.

Strategies for Commercialization and Deployment
54
the State Energy Programs for decades to such ends; EISA 2007 authorized increases in annual funding for these state programs to broaden the array of support available to states. EPAct 2005 tax credits, such as the Alternative Motor Vehicle Credit and the Alternative Fuel Infrastructure Tax Credit, have been enacted to help consumers and investors capture the external benefits of reducing carbon emissions while also addressing high cost barriers. Due to the recognized need to have trained personnel to develop, maintain, and operate hydrogen technologies, education and training measures are also important. For example, the DOE Hydrogen Program helps address the lack of specialized knowledge by providing educational materials from curricula for school age children to detailed information for first responders and code officials. In addition, the U.S. Department of Transportation is operating the Research and Innovative Technology Administration which has an education and training
thrust to improve transportation related education and innovative transportation solutions. Potential Opportunities and Gaps Hydrogen has the potential to supplant hydrocarbon fuels in the transportation industry; as long as the hydrogen is produced with fewer GHG emissions per unit of energy output, this fuel shift will result in net GHG emissions reductions. While hydrogen is a commodity fuel already serving various niche markets, widespread deployment is inhibited by numerous technical and market challenges. To address these barriers, the Federal government has established robust RD&D programs and also pursuing strategies to support early adoption of hydrogen technologies. Some challenges may require further consideration to ensure that they do not significantly impede progress. For example, as policies and market conditions change, it will be useful to monitor the
Table 3-2. Select Federal Activities Addressing Key Technology Deployment Barriers: Hydrogen
Solutions
Key Technology Deployment Barriers
Major Programs, Policies, or Initiatives*
Illustrative Deployment Activities
Most Critical Barriers:
Infrastructure Limitations 7 • Hydrogen Program (DOE) • Research and Innovative Technology
Administration (DOT)
High Costs 5 • Alternative Fuel Infrastructure Tax Credit • Alternative Motor Vehicle Credit • Loan Guarantee Program (DOE)
Technical Risks 5 • Hydrogen Program (DOE) • Nat’l Fuel Cell Bus Tech Dev Program (DOT) • National H2 Learning Demonstration (DOE)
External Benefits and Costs 3 • Alternative Fuel Infrastructure Tax Credit • Alternative Motor Vehicle Credit • State Energy Program (DOE)
Other Important Barriers:
Lack of Specialized Knowledge 6 • Hydrogen Education (DOE) • Research and Innovative Technology
Administration (DOT)
*Does not include activities that are authorized but not implemented. See Annex B for details.

Renewable Energy and Fuels January 2009
55
incremental cost of hydrogen technologies over conventional technologies to measure the effectiveness of the market and policies for internalizing some of the external benefits of hydrogen. Federal programs that encourage greater market adoption, safe companion storage, and transport technologies in the C&D Strategies Report are expected to significantly aid deployment of hydrogen technologies and associated infrastructures.
3.3 RENEWABLE ENERGY AND FUELS
Renewable energy production continues to expand at double-digit rates worldwide (REN21 2008). In the United States, renewable energy has been growing sharply, with wind and ethanol leading the increase (Figure 3-6). Decreased costs and policy incentives are leading to the growth in renewable power production, but renewable power is still a small fraction of the market. Improved technology, higher fossil fuel prices, and extended tax credits in EPAct 2005 are projected to stimulate growth in the use of renewable technologies for U.S. electricity generation. Total renewable generation in the Annual Energy Outlook (EIA 2008) reference case, including CHP and end-use generation, is projected to grow by 2.2 percent per year, from 2006 to 2030. Worldwide, biofuels production – principally bioethanol and biodiesel, exceeded 37 billion liters in 2005, yet represented less than two percent of global fuel consumption (EIA 2007b). In the United States, ethanol consumption has grown markedly over the past several years, from near zero in 1980 to the equivalent of 130 million barrels of gasoline in 2006; however, ethanol represents less than one-tenth of fuel consumed when its use as an oxygenate is ignored.37 Renewable power and fuels technologies offers significant opportunities for combining GHG reductions with energy security, rural job creation,
37 Consumption of E-85 ethanol was 38 million gasoline equivalent gallons in 2005 and total fuel consumption was 421 million gasoline equivalent gallons in 2005 (EIA 2006a, 2007a)
and other needs in the long term. Renewable energy technologies are generally modular and can be used to help meet the energy needs of a standalone application or building, an industrial plant or community, or the larger needs of a regional or national electrical grid network. Renewable energy technologies can also be used in various combinations – including hybrids with fossil-fuel-based energy sources and with advanced storage systems – to improve renewable resource availability. Because of this flexibility, technologies and standards to safely and reliably interconnect individual renewable (and non-renewable) electric technologies, individual loads or buildings, and the electric grid are very important. In addition, the diversity of renewable energy sources offers a broad array of technology choices that can reduce CO2 emissions. The generation of electricity from solar, wind, geothermal, or hydropower sources contributes no CO2 or other greenhouse gases (GHGs) directly to the atmosphere, and emissions from renewable fuels are generally lower on a life-cycle basis than conventional fuels. Increasing the contribution of renewables to the nation’s energy portfolio will directly lower GHG intensity in proportion to the amount of carbon-emitting energy sources displaced.
Figure 3-6. Renewable Energy and Fuels Production, 2001-2005
0
5
10
15
20
25
30
35
40
2001 2002 2003 2004 2005
Bill
ion
Kilo
wat
thou
rs (p
ower
)
0.000
0.050
0.100
0.150
0.200
0.250
0.300
0.350
Qua
drill
ion
BTU
s (fu
els)
Wood/ Wood Waste MSW/Landfill GasWind GeothermalOther Biomass SolarEthanol Biodiesel
(Source: EIA 2007d, Table 4 & 11)

Strategies for Commercialization and Deployment
56
Suitable Renewable Power Technologies
Solar Thermal Pool Heaters – Solar thermal collectors have many uses, one of the most popular is pool heating. Low temperature (operating at temperatures below 110 F) solar thermal collectors for pool heating represented 15 million square feet of the roughly 16 million square feet shipped in 2005 (EIA 2006a, 2007a).
Geothermal Heat Pumps – Geothermal heat pumps use low-grade heat in the earth to provide heat in the winter and to act as a heat sink in the summer, using conventional vapor compression and underground piping systems. The potential of geothermal heat pumps in the United States is very large (estimates of greater than 66000 MW available by 2025); usage in 2006 was about 7500 MW (Green and Nix 2006).
The C&D strategies to accelerate the deployment of renewable power and fuels reflect the diversity of the renewable resources and technologies that merit market advancement. With such diversity comes the need for deployment mechanisms to be tailored to the resource/technology combination and to reflect the requirements of the intended market. Technologies Suitable for Deployment Renewable energy technologies are in various states of market penetration or readiness. A few examples of technologies that have that have successfully moved into commercial markets include:
Wind Power: Land-based wind has demonstrated robust market growth in recent years. However, significant untapped resources remain, and advances in materials, foundation, turbine and blade design will increase the potential for wind energy commercialization and allow for commercial development in low wind speed and offshore wind areas.
Solar Thermal Power: Solar thermal collectors are used to heat air or water directly. Although available for decades, these systems have not seen widespread deployment even though they have many applications, especially in the commercial buildings sector (Kalogirou 2004).
Solar Photovoltaic (PV) Power: In addition to PV systems currently in the market, advanced solar technologies in thin-film semiconductors can provide increased production volumes at reduced costs and greater efficiency in the near future. For example, cadmium telluride thin-film technology
is actively commercialized with cell efficiencies of more than 11 percent currently available and projected to be in the 15 percent range in the near future; and thin film PV has grown to nearly seven percent of worldwide PV shipments in only four years of commercial production.
Concentrating Solar Power: CSP, which has seen a resurgence in recent years with 50MW+ parabolic trough plants coming on line in the United States and Spain spurred on by various incentives, has the advantage of thermal storage which allows the power to be dispatched.
Geothermal Energy: The United States is the world’s largest producer of geothermal energy. Enhanced Geothermal Systems (EGS) can increase the amount of renewable, baseload electricity produced by tapping into resources across the U.S. EGS are both enhanced and engineered reservoirs created to produce energy from geothermal resources deficient in economical amounts of water and/or permeability.
Water Power: Full-scale prototypes of tidal and wave generators are in the demonstration phase, and more are being constructed. Tidal energy can be collected from tidal streams, the underwater current flow in entrances to bays or other narrow passages, with turbines similar to those used for wind energy; there are several installations in the world, including a grid-connected multi-turbine prototype in the East River in New York City (Verdant Power 2008). Another form of collection of tidal energy is through barrage systems that trap water in tidal lagoons and use the head pressure to drive a turbine; these are much larger capital projects than tidal stream systems, but there are operating examples (Electricit de France). There is one commercial wave energy plant in the world, located in Portugal; wave energy is converted to electricity by moving liquid through motors connected to generators.38
Biomass Power and Heat: Biomass is used for electric power generation through: direct-firing, cofiring, gasification, pyrolysis, and anaerobic digestion. Direct-firing involves burning the biomass material to create steam and drive a turbine, while co-firing involves mixing biomass
38 Wave Energy system described based on the operational specifications of the only commercial wave energy converters in the world, the Pelamis Converter, developed by Pelamis Wave Power Ltd. (formerly Ocean Power Delivery Ltd.)

Renewable Energy and Fuels January 2009
57
with coal in a coal-fired power plant; both of these technologies are already quite mature. Gasification and pyrolysis both involve high temperatures in a low or no oxygen environment to produce a gas or liquid for use. Anaerobic digestion is generally used for production of methane in a controlled environment; this technology is in use on farms and facilities like those that process municipal solid waste. Biomass is also used for process heat and for fuels, as described below.
Ethanol: Most ethanol in the U.S. is made from corn and utilized as an oxygenate blended with conventional gasoline (i.e., E-10 is 10 percent ethanol and E-85 is 85 percent ethanol). Ethanol has demonstrated significant market growth, growing from 2.8 billion gallons in 2003 to 6.5 billion gallons in 2007. Cellulosic ethanol is expected to increase the available resources for bio-based fuels; while cellulosic ethanol is not being commercially produced today, the President’s Advanced Energy Initiative aims to make cellulosic ethanol cost-competitive with gasoline by 2012.
Biodiesel: Biodiesel is an ester derived from fats or oily seeds; it is produced by a method called transesterification – mixing the fats or oils with methanol and reacting the mixture with a sodium or potassium hydroxide catalyst. This process also has a glycerol byproduct, which has many commercial applications in products like soap. Biodiesel can be used as an emissions-reducing additive to conventional diesel fuel or as a fuel itself in compression engines (NREL 2008).
The development of these technologies has helped increase their potential for commercialization by lowering costs, increasing efficiencies, and improving performance. Wind, for example, continues to exhibit strong growth. In 2007, domestic wind-generating capacity topped 15,500 MW and reached 22,600 MW in September 2008 (DOE 2009b). Solar and biomass technologies solutions are also growing rapidly, and the market for geothermal resources has recently begun to grow rapidly, taking advantage of new incentives to accelerate development.
Barriers to Deployment39 Despite advances in technologies, renewable power and fuels make up about six percent of the nation’s energy supply (EIA 2007c). While there are many renewable power and fuels technologies that could reduce GHG emissions, the following barriers illustrate significant challenges that currently impede their full deployment. While generalizations are being made to the technology sector as a whole, the relative importance of barriers is highly variable across this diverse suite of technologies.
Renewable power and fuels technologies provide external benefits such as low or zero carbon emissions that are not currently recognized in the market. Some utilities offer “green power” programs to consumers, allowing them to pay a premium to help the utility buy renewable generation; however, observed voluntary enrollments are lower than expected, given consumer’s “willingness to pay” discovered through market research studies (Bird and Sweezy 2006).
Most renewable energy technologies have high (up-front capital) costs40 and lower (or zero) fuel costs compared to fossil fuel technologies. Capital costs for renewable energy technologies have declined considerably over the past decades, but remain a constraint to widespread market penetration. While the cost-effectiveness of renewable energy technologies does not depend integrally on fuel costs (except for biomass technologies), this risk-reduction benefit is often missing from economic comparisons. Inadequate market infrastructure contributes to increased costs for renewable technologies (Painuly 2001).
39 The existence of barriers and their identification in this report in no way implies it is the responsibility of the Federal government to address every (or any) barrier, in whole or in part. 40 In an efficiently functioning market, absent significant market failures or other imperfections, “high cost” is usually a market signal indicating a technology is not economically viable, due to the existence of low demand or less costly competitors or substitutes. The existence of high cost, identified here as a barrier to greater C&D, does not by itself suggest government intervention is necessary or advisable. In the case of GHG emissions, there currently exists no regulatory scheme to internalize external costs and benefits of rising atmospheric GHG concentrations and, hence, a market failure is known to exist and government intervention may be warranted. In the absence of an internalized market-valuing mechanism, however, the extent of that intervention remains unclear (see Box 1-1 in Chapter 1).

Strategies for Commercialization and Deployment
58
As renewable technologies rapidly advance to achieve per-unit cost reductions, the market for these renewable power and fuels technologies faces increasing returns. This dynamic environment leads to market risks associated with uncertain costs of particular technologies relative to competitors. Some renewable power generation technologies such as wind and solar also have increased perceived risk related to the variability of the resource. Biomass power and fuels are also subject to a perceived high resource risk related to availability of long-term supply. Cellulosic biomass technologies suffer due to the risk of being “first of a kind” technologies. Investors need assurance that commercial operation of these technologies is possible, by obtaining loan guarantees, permits, etc.
Renewable fuels and power technologies face infrastructure limitations in the form of supply chain gaps and complementary technology shortages. For example, with small scale PV systems there is a lack of purchasing channels and trained installers in some states across the country. PV products can be difficult to find and are often not available as complete, certified, and guaranteed systems; PV systems would benefit in the market if they could be purchased, installed, and serviced by nationwide retailers. Expansion of renewable sources for electricity production, such as wind power, will require parallel expansion in transmission capability and a general improvement in the operation of the country’s electrical infrastructure. Similarly, transporting biofuels from production facilities to consumers may become a limiting factor as volumes of biofuels increase. Current pipeline infrastructure is designed to carry fuels from ports to population centers while most renewable fuels are produced in the heartland.
On-again/off-again tax credits contribute to fiscal uncertainty, which could negatively reduce the incentives to boost production. In certain scenarios, developers are more likely to focus on an accelerated timetable instead of optimizing production over the long run by, for instance, investing in longer-term facility scale-up needs, systems, and personnel training. Specifically, the renewable production tax credit (PTC), which provides a tax credit for each kWh of electricity generated by qualified wind, solar, geothermal, closed-loop biomass, or poultry waste resources
have been available for the first 10 years of operation for all qualifying plants that entered service from 1992 through mid-1999, later extended to 2001, then to 2003, and again with EPAct to 2007 and subsequently to 2009. Similarly, the small ethanol producer tax credit was seldom used because it was considered uncertain and complicated for 15 years; this tax credit and the small agri-biodiesel tax credits now provide $.10 per gallon tax credit to producers (Renewable Fuels Association 2006). Further, variability across states for incentives and programs for renewable energy and energy efficiency could be viewed as suboptimal.41
Interconnection requirements have been reformed in some states, but many states and utilities still have high backup or standby rates for small electric generating units and expensive equipment and inspection requirements that undermine these efforts. Time of use rates and other mechanisms to compensate PV and other technologies for generating electricity or reducing demand during peak periods when their generation is most valuable are not widely used. These practices are examples of competing fiscal policies42 impacting renewable power technologies.
Renewable portfolio standards that create markets for renewable energy exist in some states, vary widely in the amount of renewable energy required, and often have uneven incentives for different technologies – for example some recognize solar water heating, and some do not. Very few states have instituted rate structures that decouple utility compensation from the volume of their electricity sales; without decoupling, utilities have no incentive to encourage small renewable power installations. Similarly, fuel requirements vary between and within states. Variability across and within states contributes to statutory uncertainty and creating additional compliance
41 State incentives can be found through the Database of State Incentives for Renewables & Efficiency (DSIRE) (North Carolina State University 2008). 42 Existing fiscal policies, regulations, and statutes may be beneficial in a broad context of public policy, but often they compete with or conflict with the narrow objective of promoting C&D of certain GHG-reducing technologies. As a result, while providing overall benefits to society these policies may be found to hinder investment in clean energy technologies (see Box 1-2 in Chapter 1).

Renewable Energy and Fuels January 2009
59
Federal Programs at Work in Renewable Power and Fuels
Green Power Partnership – facilitates purchases of renewable energy and fuels through voluntary partnerships between the EPA and the private sector.
Biofuels Initiative – focuses on making cellulosic ethanol cost competitive by 2012.
Solar America Initiative – focuses on making solar energy cost-competitive with conventional forms of electricity by 2015 through technology partnerships and market transformation.
Green Power Network – the DOE-supported Green Power Network (DOE 2008e) provides data, information and analysis on the green power industry to help facilitate market activity.
burdens for businesses operating in these industries.
Decision makers and the general public face incomplete and imperfect information and remain largely unaware of renewable power and fuels technologies as well as their uses and benefits. Without greater trusted information, it may be difficult to move these technologies out of niche markets.
Renewable power and fuels technologies also face limitations posed by the industry structure, technical risks, and regulatory uncertainty. The existing electric grid and utility infrastructure assume large generation sources and wide load balancing areas – making inclusion of smaller, non-continuous generation sources problematic. Imbalance penalties (tariffs) charged by existing utilities pose challenges to renewable power profitability because of the variability of wind and solar PV. Technical risks abound; for example, each biofuel feedstock requires specific processing, PV materials require special handling, and some of these technologies face “first of a kind” risks in deployment. Furthermore, environmental permitting for renewable power projects falls under the purview of (highly variable) regulations promulgated by states, counties, and local municipalities. Commercialization and Deployment Strategy The U.S. strategy for accelerating the deployment of renewable power and fuels reflects a mix of broad-based policies and programs as well as technology- and application-specific activities. These activities include voluntary as well as regulatory approaches, and they focus on commercialization and deployment in both the government and the private sector. Altogether, the report identifies nearly 100 Federal programs, policies, and initiatives in operation today to encourage the deployment of renewable power and fuels in the marketplace (Figure 3-7). About 30 of these activities listed in Annex B involve tax policies and other financial incentives, reflecting the importance of external costs and upfront capital expenses in this sector. Because the rapid and large-scale penetration of renewable resources will require the close cooperation and buy-in of numerous public- and private-sector stakeholders, the strategy also includes a great deal of information outreach
and partnership development: specifically, Annex B identifies Federal government operating 28 labeling and information dissemination activities, 23 education, training and workforce development activities, and 19 policies and programs that involve coalition building and partnership. Market conditioning programs are also strongly represented, especially government procurement requirements. There are 11 Federal programs identified that support technology demonstrations. As a whole, these programs offer a diverse portfolio of solutions that deal with key barriers to the deployment of renewable power and fuels, as shown in Table 3-3. A total of 36 Federal deployment activities identified in Annex B help to overcome the barrier of incomplete and imperfect information by educating end-users, entrepreneurs, regulators, and stakeholders about renewable power and fuels. These efforts are implemented by a range of government agencies including but not limited to EPA, USDA, DOE, FTC, DOI, and SBA. For example, the FTC program for biomass-based diesel and bio-diesel labeling requires diesel pumps at retail locations to be labeled to show the percent of biomass-based diesel or bio-diesel in each blend. The recently authorized Biofuels and Biorefinery Information Center led by DOE and the USDA provides a variety of information ranging from biorefinery processing techniques to Federal and State laws and incentives related to renewable fuel production and use. EISA 2007 also authorized

Strategies for Commercialization and Deployment
60
DOE to establish Clean Energy Application Centers that encourage the outreach and deployment of clean energy technologies by focusing on education and outreach to end users, regulators, and stakeholders in a manner that leads to the deployment of clean energy technologies. Assessments, market research, consulting, and other forms of assistance can be made available to provide project-specific support in overcoming barriers to technology deployment. EISA 2007 called for the creation of a Center for Geothermal Technology Transfer which is charged with serving as an information clearinghouse for the geothermal industry by collecting and disseminating information or best practices in all areas relating to developing and utilizing geothermal resources. An array of tax incentives and programs are available to purchasers and producers of renewable energy to help overcome the barrier of high costs. DOE’s Office of Energy Efficiency and Renewable Energy and EPAct 2005 provide important structure in this area. Activities such as the Renewable Energy Production Tax Credits – which provides payments for electricity produced and sold by new renewable energy generation facilities – help offset high upfront costs by increasing suppliers’ return on investment. This tax incentive thus monetizes the
shared benefits of reduced GHG emissions, thereby compensating producers for some of the external benefits provided by low and zero carbon power and fuels. The EPAct 2005 established a 30 percent Investment Tax Credit to mitigate high up-front costs on residential solar or fuel cell applications. To help lessen investors’ financial risk, EPAct’s Credit for Holders of Clean Renewable Energy Bonds provides rural electric cooperatives and municipal electric utilities the equivalent of an interest-free loan for financing qualified energy projects. DOE’s Energy Sustainability and Efficiency Grants and Loans for Institutions is a program of information dissemination, technical assistance, grants, and loans to support energy efficiency and energy sustainability projects at public institutions. Twenty-three Federal deployment activities in Annex B address the barrier of market risk. As an example, Energy Savings in Government and Public Institutions, led by the U.S. Capitol Complex, promotes clean energy technologies in Federal facilities including photovoltaic roofs for the Rayburn House and Hart Senate Office Buildings and E-85 fuel at or near the Capitol Grounds Fuel Station. The joint DOE/USTDA program for
Figure 3-7. Federal Policies to Reduce GHGs through Renewable Power and Fuels, by Type of Policy and Measure
30
28
23
19
19
18
11
7
7
2
0 5 10 15 20 25 30 35
Tax Policy and Other Financial Incentives
Labeling & Information Dissemination
Education, Training, and S&T Workforce Development
International Cooperation
Coalitions & Partnerships
Market Conditioning including Government Procurement
Technology Demonstration
Codes and Standards
Legislative Act of Regulation
Risk Mitigation
Number of Activities
30
28
23
19
19
18
11
7
7
2
0 5 10 15 20 25 30 35
Tax Policy and Other Financial Incentives
Labeling & Information Dissemination
Education, Training, and S&T Workforce Development
International Cooperation
Coalitions & Partnerships
Market Conditioning including Government Procurement
Technology Demonstration
Codes and Standards
Legislative Act of Regulation
Risk Mitigation
Number of Activities Source: CCTP/Energetics Deployment Inventory Database dated January 2009 Note: Some activities fit into more than one category, so the total count exceeds the total number of identified activities (99) listed in this area. The figure does not include activities that are authorized but not implemented. See Annex B for details.

Renewable Energy and Fuels January 2009
61
International Geothermal Energy Development supports international collaborative efforts that promote the R&D and deployment of geothermal technologies used to develop hydrothermal and enhanced geothermal system resources. USTDA may encourage the participation of U.S. firms in the activity and may provide grants and other financial support for feasibility and resource assessment studies conducted in, or intended to benefit, less developed countries. A multi-agency effort is geared towards overcoming infrastructure limitations through the Federal Fleet Fueling Centers. Beginning in FY 2010, each Federal agency is required to reduce petroleum
consumption and increase alternative fuel consumption to achieve at least a 20 percent reduction in annual petroleum consumption and a 10 percent increase in annual alternative fuel consumption by no later than October 1, 2015. Each agency will develop a plan and give annual milestone reports to detail measures taken to reduce petroleum consumption. Measures may include the increased use of alternative fuels; the acquisition of vehicles with higher fuel economy, including (plug-in) hybrid and electric vehicles if the vehicles are commercially available; the substitution of cars for light trucks; an increase in vehicle load factors; a decrease in vehicle miles traveled; and a decrease in fleet size. Programs like the Biofuels Initiative
Table 3-3. Select Federal Activities Addressing Key Technology Deployment Barriers: Renewable Power and Fuels
Solutions
Key Technology Deployment Barriers
Major Programs, Policies, or Initiatives*
Illustrative Deployment Activities
Most Critical Barriers:
Incomplete and Imperfect Information 36
• Green Power Network (DOE) • Green the Capitol Initiative (CAO) • Renewable Energy Working Group (DOE)
High Costs 24
• Renewable Electricity Production Tax Credits • Conservation Innovation Grants (USDA) • Credit for Holders of Clean Renewable Energy
Bonds
Market Risks 23
• Standard Specifications for Biodiesel (EPA) • Renewable Fuels Standard (EPA) • Clean Energy Technology Exports Initiative (DOC,
DOE, USAID)
External Benefits and Costs 15 • Renewable Energy Production Incentive (DOE) • Standard Specifications for Biodiesel (EPA)
Competing Fiscal Priorities 13 • Renewable Electricity Production Credit
Infrastructure Limitations 9 • Biofuels Distribution and Advanced Biofuels Infrastructure (DOE)
Other Important Barriers:
Technical Risks 11 • Biomass R&D Initiative (DOE, USDA) • GeoPowering America
Industry Structure 4 • Public Utility Regulatory Policies Act
*Does not include activities that are authorized but not implemented. See Annex B for details.

Strategies for Commercialization and Deployment
62
target infrastructure limitations by supporting the transformation of existing agricultural and forest products facilities into integrated biorefineries. DOE’s Renewable Fuel Infrastructure Grants program will assist retail and wholesale motor fuel dealers with the installation, replacement, or conversion of motor fuel storage and dispensing infrastructure to be used exclusively for storing and dispensing renewable fuel blends. Grants will also be provided for the establishment of up to ten geographically dispersed refueling infrastructure corridors to ensure adequate distribution of renewable fuel blends. Efforts to overcome the nation’s electric grid limitations are summarized in Chapter 2.4, which covers the deployment of advanced grid technologies.
Potential Opportunities and Gaps Renewable power and fuels technologies have great GHG mitigation potential in the United States, particularly when regions exploit their comparative advantages (e.g., wind generation in the Upper Midwest, solar generation in the Southwest, and biomass in many regions including the Southeast). Renewable energy technologies are in various states of market readiness and penetration, with many already in place and offsetting GHG emissions and some still facing technical risks. With numerous Federal deployment activities operating today – including support for technology demonstrations, the market pull of Federal procurements, and incentives for the production of renewable energy and fuel – barriers are being addressed and progress is being made. Federal activities address high costs and external benefits and costs through tax policies and other financial incentives. The deployment strategies also include numerous information outreach and partnership development activities aimed at achieving the close cooperation and buy-in of numerous public- and private-sector stakeholders that is so critical to large-scale success in the marketplace.
Geothermal energy has the potential in the United States to supply clean, baseload electricity generation. Today, renewed interest in geothermal resources rises above the “low hanging fruit” opportunities to a resource explored for real development potential. A geothermal assessment summary published by the United States Geological Survey (USGS) in October, 2008 estimates that the full development of identified resources in the
western United States alone could increase geothermal electricity generating capacity to 9,057 MWe and that undiscovered resources in those areas could add an additional 30,033 MWe of capacity. In addition, EGS technologies, if commercialized, could account for as much as 517,800 MWe by 2050.
Geothermal energy is the thermal energy contained in the earth’s crust and in fluids located in the fractures and pores within the crust. This thermal energy can be used directly for heating or can used to generate electricity. Enhanced geothermal systems (EGS) present an opportunity to exploit the geothermal energy that is available everywhere in the subsurface. The aim of EGS is to create or access a system of subsurface fractures through which a fluid can be circulated, heated by contact with the hot rocks, and returned to the surface to produce electricity. Another source of geothermal energy is the hot water that is produced from oil and gas wells. This hot water is currently considered a waste, but can be used to produce electricity.
These programs do not fully address all of the barriers to renewables, although this does not imply that the Federal government is responsible for addressing any remaining barrier. Some barriers, like the production tax credit, are not only uncertain from year to year but also are not large enough to compensate for the cost differential faced by many renewable electricity options. Long-term extensions of production tax credits and investment tax credits, with gradual phase down or phase out, may stabilize investment in renewable power and fuels – especially for capital intensive projects. In addition, aggressively addressing the infrastructure and industry structure barriers such as insufficient long-distance transmission capacity and ethanol distribution networks could significantly encourage commercialization and deployment of renewable resources. Finally, with so many new deployment initiatives authorized by EISA 2007, evaluation of existing policies for commercialization and deployment may inform future policies as renewable fuels and power technologies develop.
3.4 NUCLEAR FISSION Nuclear power is among the premier technology options for reducing GHG emissions at scale. Each new plant could avoid as much as six million metric

Nuclear Fission January 2009
63
tons per year of GHG emissions, given the current mix of energy sources used in electricity generation.43 Over an expected operating lifetime, this would amount to about one-third of a GtCO2 (gigaton, or one billion metric tons).44 The C&D strategies for advancing the further commercialization and deployment of this GHG-reducing technology build on the successful record of existing operating plants, encourage the emergence and adoption of new and improved designs (Figure 3-8), and help address barriers believed to be impeding its broader application domestically and worldwide. Nuclear power, more precisely defined as nuclear fission to distinguish it from other forms of nuclear energy, is today a significant source of low to near-zero GHG-emitting “baseload” electricity production.45 In January 2008, 439 nuclear power reactors were operating worldwide.46 They produced about 15 percent of the world’s electricity (IEA 2008). In the United States, there are currently 104 operating nuclear plants. They provide about 19 percent of U.S. electricity production (EIA 2008). Annually, they avoid about 600 million metric tons of carbon dioxide emissions that would otherwise be released from conventional coal, gas, or oil-fired plants (CCTP 2006). During the past 50 years, U.S. nuclear power plants have operated safely and reliably with steadily improving economic performance. Significant advances have been achieved in reducing maintenance and operation costs and improving plant availability. Due primarily to its low fuel cost, nuclear power production costs are lower than those of other forms of baseload electricity generation. Its operating “capacity factor” of more than 90 percent is the highest in the power industry (Nuclear Energy Institute 2006). It is expected that the carbon mitigation benefits of these facilities will be 43 Calculation is based on average offset emissions from 1995-2007 divided by 103 plants in operation. Offset emissions calculated by the Nuclear Energy Institute from U.S. EPA and EIA data (Nuclear Energy Institute 2008). 44 Calculation assumes lifetime of 50 years. 45 Nuclear power plants are particularly well suited for generating “baseload” power, meaning they are most economical when operated at or near full capacity and with little load-following variability. 46 Worldwide, nearly 33 new reactors are under construction – mostly in China and India (IAEA 2008).
extended into the 2050s as their licenses are renewed for a total of 60 years of operation. In addition to electricity, nuclear plants produce large quantities of thermal energy47 that could be usefully employed for controlled heating in industrial processes, or as an energy alternative to electrolytic hydrogen production. In the future, some high-temperature advanced nuclear technology designs may offer significantly improved efficiencies in both power generation and hydrogen production. The energy from nuclear plants could also be used to desalinate seawater to provide clean drinking water to coastal areas. Research and development into autonomous, long-lived small nuclear power plants that do not require refueling could provide safe and reliable electric power to remote locations. Scenarios’ modeling48 shows that significant amounts of GHG emissions could be avoided by increasing the market share for electricity generation from nuclear power. Technologies Suitable for Commercialization and Deployment In the United States, the existing Generation II power plant designs are fully commercialized and
47 See CCTP 2006, pp. 89. 48 See CCTP 2006, Chapter 3 and referenced works.
Figure 3-8. The Evolution of Nuclear Power
Source: U.S. DOE Nuclear Energy Research Advisory Committee (BERAC) and the Generation IV International Forum (GIF) 2002
Strategies for Commercialization and Deployment
64
deployed. Their operating characteristics are such that they are typically the lowest marginal cost and first to be dispatched in meeting electricity grid demands.
For the future, several new nuclear power plant designs are under development. When completed, they are expected to produce even greater efficiencies and some designs will achieve passively safe operation. As a result, there appears to be a consensus in the nuclear community that these Generation III+ and Generation IV technologies, now under development, will provide additional advantages over previous designs. The Nuclear Regulatory Commission (NRC) has certified three new Generation III designs and one new Generation III/III+ design for construction in the United States.49 This certification means that, if industry determines these technologies are suitable and deployment is cost-effective, they could be constructed once appropriate licenses have been received. No Generation IV design has yet been submitted to NRC for approval, but a Generation IV reactor is under development as part of the Next Generation Nuclear Plant initiative. Generation IV designs, however, are not expected to contribute significantly to meeting commercial demand for some decades, and are not considered further here.
The four NRC-certified designs are: (a) the General Electric (GE) Advanced Boiling Water Reactor (ABWR), and the Westinghouse series of (b) AP600, (c) AP1000, and (d) System80+ plants. These designs offer a number of improvements over current generation nuclear reactors, including shorter construction times, enhanced safety and reliability, more efficient operation, lower cost maintenance, and improved power optimization (NRC 2008b). Full-scale ABWR plants have already been built in other countries. Other Generation III and III+ designs set to receive NRC approval include the Economic Simplified Boiling Water Reactor (ESBWR) from GE Nuclear, and the U.S. version Evolutionary Power Reactor (USEPR) from Areva NP. The European version from Areva, called the European Pressurized Water Reactor, is under construction in Finland and France. Mitsubishi expects to get its Advanced Pressurized Water
49 Design certification status for new reactor designs is available from “Design Certification Applications for New Reactors” (NRC 2008a).
Reactor design approved and sold in the United States.
Nuclear power technology in the United States continues to make progress technically, as evidenced above, and the early signs of expanded deployment are promising. Applications for combined Construction and Operating Licenses (COL) have been submitted for what may be the first new nuclear plants ordered in the U.S. in three decades. Several private sector consortia submitted Early Site Permit (ESP) applications for new plants using Generation III or III+ technologies to the Nuclear Regulatory Commission (NRC) for review. The NRC approved three in 2007 and will likely approve a fourth by 2009. A fifth ESP application is expected to be submitted in 2010, and a sixth application is anticipated at some point in the future.
Barriers to Deployment50 While the early signs of expanded deployment are promising, and the nuclear industry is taking its first steps to construct new nuclear plants, several significant factors remain that may slow or deter final investment decisions in the United States and potentially constrain widespread global expansion. Among the more pressing of these are: the high costs associated with design and construction of the first few plants and associated financial risk to investors; uncertainty with respect to the new licensing procedure; constraints in the supply chain infrastructure; uncertainty regarding long-term waste disposal; and the possible shortage of trained workers. Expansion of nuclear power globally is further complicated by concerns about nuclear proliferation. These factors are elaborated upon below:
Nuclear power plants have low operating costs, but are capital-intensive. A new nuclear fission power plant will likely require billions of dollars in capital investment. The time to completion, that is, when a revenue stream is to be realized, is uncertain with new ventures. The carrying charges and financial risks51 to investors associated with potential delays could result in
50 The existence of barriers and their identification in this report in no way implies it is the responsibility of the Federal government to address every (or any) barrier, in whole or in part. 51 Financial Risks fall under Market Risks in this report’s taxonomy of barriers.

Nuclear Fission January 2009
65
high costs,52 if the planned construction durations are extended, which could dilute utility earnings and thus reduce investment returns. This risk is expected to become more manageable with gained experience from the completion and commissioning of the first few new plants.
There is regulatory uncertainty associated with a new licensing regime. Nuclear power plant siting, construction, and operation are regulated by the NRC. Before 1992, plant developers were required to first obtain a construction license and then an operating license, which placed the utilities in a risky position of having no guarantee that a plant, once constructed, would be licensed to operate. Under new rules authorized in 1992 and recently fully implemented, plant developers apply for a combined construction and operating license (COL), which provides significantly more certainty to the process. This regulatory regime is currently being tested, so it is possible that construction and commissioning delays may occur.
The manufacturing infrastructure for major nuclear plant components contracted substantially over the past few decades, as no new nuclear plants were ordered in the U.S. and few were being built worldwide. The resulting supply-chain gaps present the nuclear industry with a key infrastructure limitation. At present there is only one location in the world where the large forgings for reactor vessels can be made. This constraint could slow the construction of new nuclear plants in the U.S., especially considering the competition for supply-chain resources resulting from the large nuclear expansion expected in China and other Asian countries in the next decade.
A lack of specialized knowledge may also impede the expansion of nuclear power. Most notably,
52 In an efficiently functioning market, absent significant market failures or other imperfections, “high cost” is usually a market signal indicating a technology is not economically viable, due to the existence of low demand or less costly competitors or substitutes. The existence of high cost, identified here as a barrier to greater C&D, does not by itself suggest government intervention is necessary or advisable. In the case of GHG emissions, there currently exists no regulatory scheme to internalize external costs and benefits of rising atmospheric GHG concentrations and, hence, a market failure is known to exist and government intervention may be warranted. In the absence of an internalized market-valuing mechanism, however, the extent of that intervention remains unclear (see Box 1-1 in Chapter 1).
there is a shrinking workforce of the highly skilled and specialized nuclear industry professionals, both in the engineering and supporting trades needed to construct plants to NRC specifications and to operate and maintain them. As the demand for skilled workers increases, industry will have increasing incentive to develop and implement needed training and education programs.
More generally, not necessarily for the first new starts, but for the realization of a significant expansion of nuclear power both domestically and abroad, there are political and societal barriers of waste disposal and non-proliferation, as well as limitations in the available electrical transmission infrastructure. In addition, a key benefit of the use of nuclear power, its low GHG emissions, is not yet captured in the marketplace.
There is regulatory uncertainty about long-term storage for radioactive waste and spent fuel. The Federal government continues to move forward to seek a license at the Yucca Mountain site for a long-term storage facility for high-level wastes and spent fuel from nuclear power plants, but progress has been slowed by procedural interventions. Significant expansion of the reactor fleet in the United States could be constrained if there is no clear path for the safe and secure long-term handling of these wastes.
Geopolitical concerns over the proliferation of technical capabilities to design and build nuclear weapons, arising from the construction and operation of the front- and back-end facilities of the civilian nuclear fuel cycle, presents a potentially serious other barrier to the expansion of the peaceful uses of nuclear power.
Although not unique to the expansion of nuclear power, there are other infrastructure barriers, such as transmission capacity limitations in some regions of the United States. The lack of these vital connections can make siting and construction of large capacity power generation facilities, such as nuclear reactors, difficult. Transmission capacity constraints have been alleviated somewhat by increased investment in transmission, which began in 2004. In the case of the first proposed new nuclear power plants, they will likely be co-located on sites with existing plants. However, resolving these issues more broadly will be necessary for the long-term growth of the industry.

Strategies for Commercialization and Deployment
66
Finally, one of the more compelling environmental advantages of nuclear power, as is the case with other low-GHG emitting sources of energy, is its avoidance of GHG emissions. When compared to traditional fossil fuel baseload power generating facilities, these avoidances are of significant scale. Yet, at present, such public benefits, referred to as external costs and benefits, have no tangible or offsetting value in the marketplace.
Commercialization and Deployment Strategy The U.S. strategy to promote the deployment of nuclear power is motivated, in part, by its larger strategy to slow the growth of GHG emissions, and eventually stop and reverse that growth. Nuclear power represents a significant technical opportunity to “decarbonize” the grid and help realize U.S. commitments to the UNFCCC’s ultimate goal of stabilizing GHG concentrations in the Earth’s atmosphere.
The U.S. strategy regarding nuclear power is to: (a) continue to support R&D on new and improved plant designs and advanced fuel cycles, and (b) work with the nuclear industry, its suppliers, customers, regulatory bodies, and interested parties to address systematically the remaining barriers to its greater application. With continued support of DOE, cooperation from international partners, and the recent passage of a number of significant pieces of domestic legislation, much progress has been made toward addressing these barriers, as outlined below.
Almost two dozen Federal programs, policies and measures identified in Annex B are part of the strategies to encourage the further commercialization and deployment of new nuclear power (Figure 3-9). These activities, some of which are shown in the accompanying text box, are tailored to help address barriers and commercial risks specific to the nuclear industry.
Regarding high costs and the associated financial risks to investors, the Consolidated Appropriations Act for FY 2008 provided extended authority for loan guarantees for new nuclear power plants. Specifically, the Act authorizes DOE to issue loan guarantees to eligible projects that "avoid, reduce, or sequester air pollutants or anthropogenic emissions of greenhouse gases" and "employ new or significantly improved technologies as compared to
technologies in service in the United States at the time the guarantee is issued." DOE was authorized to issue through FY 2009 up to $18.5 billion in loan guarantees for nuclear power projects. Additionally, in the Energy Policy Act of 2005, production tax credits are available for up to 6,000 megawatts of new nuclear capacity. Further, a standby support program is under development to cover debt service and replacement power purchases for the first six new reactors.
Additionally, the financial risks associated with the potential liability of operating of nuclear power plants are addressed by the Price-Anderson Act. The provisions of this Act were extended in EPAct 2005 to cover new plants. The amended Act indemnifies the industry against claims that might arise offsite from a major nuclear accident. Price-Anderson has been successful in overcoming what otherwise would be seen by investors a risk larger than one that could normally be expected to be commercially insured. Another type of damage compensation was authorized by EISA 2007 as the Convention on Supplementary Compensation for Nuclear Damage. This new liability pooling mechanism extends risk-reduction to U.S. exporters
Federal Programs at Work in Nuclear Fission
Price-Anderson Act – protects the nuclear industry from unlimited liability claims, reducing the financial risk to operators and investors in the nuclear industry, recently enhanced for supplementary compensation.
Streamlined Licensing – combined construction and operation licenses issued at the outset; early site permits; and standardized NRC-certified designs.
Loan Guarantees -- $20.5 billion in loan guarantees for nuclear energy projects.
Advanced Nuclear Energy Tax Credit – provides a production tax credit for electric generation from advanced nuclear facilities.
Standby Support Facility – provides debt service and replacement power cost protection to the first six new nuclear power plants
Global Nuclear Energy Partnership – encourages access to the benefits of nuclear power by developing countries without the necessity of self-development of all the fuel cycle expertise.
University Support – provides support for training in nuclear science and engineering.

Nuclear Fission January 2009
67
of nuclear technology, without increasing potential costs to U.S. operators already part of Price-Anderson.
Regarding regulatory uncertainty, the NRC has streamlined the process for licensing new power plants with its combined operating and construction licensing process. Regarding the uncertainties with this new licensing regime, the Energy Policy Act of 2005 authorized Standby Support for Nuclear Plant Delays, in the event that delays are the result of Federal processing delays. In addition, NRC has promoted standardized fission reactor plant designs rather than individualized designs. NRC has certified four reactor designs, and is currently reviewing an amendment to one of these, as well as reviewing three more designs. NRC has also reviewed and approved three applications for Early Site Permits, which were filed with DOE assistance.53 In addition, as of January 1, 2009, the NRC has received and docketed 17 COL applications and is expecting more. DOE’s Nuclear Power 2010 program has established two cost-shared projects to help demonstrate the new licensing regime thereby helping to reduce the licensing uncertainties associated with the process.
53 Early site permit status (NRC 2008c).
Regarding industry infrastructure limitations and lack of specialized knowledge, a number of initiatives are under consideration. A dialogue with the industry and its suppliers is underway to address infrastructure limitations. DOE also supports the operations of low power research reactors at selected universities throughout the United States. Modular construction techniques already in use in Asia may help overcome some of the risk to timely construction and competent operation of new plants.
Regarding other barriers concerning longer term and global expansion of nuclear power, the DOE continues work with NRC, EPA, and interested parties to address the radioactive waste issue. For the current fleet of power plants, this effort is focused on opening the repository at Yucca Mountain. For the significant expansion of nuclear power, the effort also involves R&D on advanced fuel cycles that could minimize waste and recycle spent fuel. Additionally, DOE is an active supporter of ongoing research, which seeks to extend to the benefits of nuclear power to other nations of the world, including the emerging economies, while minimizing the need for these nations to develop their own infrastructure for fuel enrichment, spent fuel reprocessing, and waste disposal.
Figure 3-9. Federal Activities to Reduce GHGs through Nuclear Fission, by Type of Policy and Measure
7
4
4
3
3
2
2
2
0 1 2 3 4 5 6 7 8
International Cooperation
Labeling & Information Dissemination
Tax Policy and Other Financial Incentives
Coalitions & Partnerships
Education, Training, and S&T Workforce Development
Risk Mitigation
Technology Demonstration
Market Conditioning including Government Procurement
Number of Activities
7
4
4
3
3
2
2
2
0 1 2 3 4 5 6 7 8
International Cooperation
Labeling & Information Dissemination
Tax Policy and Other Financial Incentives
Coalitions & Partnerships
Education, Training, and S&T Workforce Development
Risk Mitigation
Technology Demonstration
Market Conditioning including Government Procurement
Number of Activities Source: CCTP/Energetics Deployment Inventory Database dated January 2009 Note: Some activities fit into more than one category, so the total count exceeds the total number of identified activities (23) listed in this area. The figure does not include activities that are authorized but not implemented. See Annex B for details.

Strategies for Commercialization and Deployment
68
Finally, regarding external costs and benefits, the Energy Policy Act of 2005 authorized a production tax credit (PTC) for nuclear power, similar to that specified at a rate of 1.8 cents per kWh for electricity from wind and other renewable sources of energy. The PTC provides a tangible economic incentive for power production from qualifying sources and places nuclear power on a similar economic footing in this regard as other low-GHG emitting features, such as power production from wind and solar energy. In the case of nuclear power, the credit is limited to 6,000 megawatts over eight years of operation from the date of entry into service.
Together, these policies and measures constitute a robust and balanced array of Federally-supported activities that systematically address the key barriers believed to be impeding greater commercial
application of this technology. A comprehensive list of the activities is provided in Annex B. A representative selection of the more important of these activities, aligned with their respective barriers, is summarized in Table 3-4.
Potential Opportunities and Gaps From a deployment perspective, nuclear fission technology benefits from a well functioning commercial industry that is global in reach. In the United States, the utilities that own and operate nuclear power plants, and the customers that rely on them, know first hand the economic and environmental benefits of a power source that is reliable, clean, safe and efficient, and industry is seriously considering the merits of expanded capacity to meet growing consumer demands. Several consortia have taken first steps to go forward
Table 3-4. Select Federal Activities Addressing Key Technology Deployment Barriers: Nuclear Fission
Solutions Key Technology Deployment
Barriers Major
Programs, Policies, or Initiatives*
Illustrative Deployment Activities
Most Critical Barriers:
Regulatory Uncertainty 7
• Combined Construction and Operating License (NRC)
• Early Site Permits (NRC) • Global Nuclear Energy Partnership (DOE) • Nuclear Power 2010 (DOE) • Standard Design Certifications (NRC) • Standby Support (DOE)
Market Risks 4 • Loan Guarantee Program (DOE) • Price-Anderson Act (DOE) • Standby Support (DOE)
High Costs 2 • Loan Guarantee Program (DOE) • Tax credit for production from advanced
nuclear power facilities
Infrastructure Limitations 2 • Electric Permitting, Siting and Analysis (DOE) • Nuclear Power 2010 (DOE)
Lack of Specialized Knowledge 1 • University Nuclear Science and Engineering Support (NRC)
Other Important Barriers:
External Benefits and Costs 1 • Tax credit for production from advanced nuclear power facilities
*Does not include activities that are authorized but not implemented. See Annex B for details.

Summary January 2009
69
with the next generation of advanced nuclear designs. These designs build on 50 years of operating experience and are expected to provide for more efficient maintenance and operation, lower operating costs, and inherent safety.
This initial expansion, however, appears to be contingent upon satisfactory resolution of a number of key barriers, many of which are beyond the reach of any one individual firm and require supporting policies and measures at the Federal level. As part of broader strategies to encourage secure and economic energy sources and commercialize and deploy GHG-reducing technologies, the Federal government is putting into place numerous remedies as outlined above that help address these barriers. It is expected that these remedies will suffice to encourage the initial expansion of nuclear power and pave the way for further expansion.
Despite implementation of these policies and measures, the extent to which the industry will be successful in its expansion remains uncertain. Some barriers remain and the existing remedies are limited in scope in some cases to first-of-a-kind projects. The strategies for encouraging the continued deployment of nuclear power domestically and internationally must be vigilant in monitoring progress, evaluating the effectiveness of current policies and measures, exploring additional means for improvement, and evolve to meet future needs. Otherwise, nuclear power may not be able to contribute to the degree expected in making significant progress to U.S. climate change goals.
A few important areas requiring continued monitoring and evaluation, for example, include knowledge and infrastructure barriers; the interconnected set of cost and uncertainty barriers; progress toward opening a repository for waste; and transmission infrastructure capacity issues. Federal programs that address specialized knowledge gaps and help train nuclear engineers are important, but do not address the deficit of skilled craftsmen in supporting trades (such as nuclear grade welders and pipefitters).
3.5 SUMMARY The choices decision makers face when building new power plants and selecting fuel sources are strongly dependent on their expected investment
return and technical confidence, which leads to preference for proven, incumbent plant technology. As long as externalities and other issues exist it will be difficult for investors to take on the additional risks and expenses associated with the energy supply options discussed in this chapter.
Market expansion appears to be contingent upon satisfactory resolution of a number of additional barriers, many of which are beyond the reach of any one firm and require supporting policies and measures. As part of broad strategies to encourage secure and economic energy sources and commercialize and deploy GHG-reducing technologies, the Federal government has implemented hundreds of remedies that address these barriers. While it is expected that these remedies will encourage the initial expansion of some renewable fuels and power, barriers to widespread deployment remain to be addressed that may require efforts from industry or various levels of government.
For example, the Federal government has attempted to offset the high cost of renewable resources with financial incentives such as the Production Tax Credit and loan guarantees. However, these have been uncertain from year to year, and in some instances fall short of overcoming barriers to adoption of GHG-reducing technologies. Additionally, advances in areas outside of energy supply may be required as a key complement for overcoming infrastructure limitations to the deployment of energy supply technologies; two critical examples are the electric grid – which is also facing deployment barriers to investment – and development of a national ethanol distribution network.
Finally, evaluation of existing policies for commercialization and deployment may inform future policies as low-carbon energy supply technologies develop. As policies and market conditions change, it will be useful to monitor the incremental costs of low-carbon over conventional technologies to measure the effectiveness of the market and policies at internalizing the external benefits.

Strategies for Commercialization and Deployment
70

Chapter 4 January 2009
71
Chapter 4. Carbon Capture, Storage, and Sequestration54
54 Although many government programs and activities use the terms sequestration and storage interchangeably, for purposes of this National Strategy, sequestration refers to an increase in the CO2 content of a natural sink other than the atmosphere, while storage refers to the intentional deposition and management of CO2 – in geologic formations or other storage media.
Deployment of technologies to capture, store or sequester GHGs is intricately linked with the goal of reducing carbon emissions. This is especially true in the near-to mid-term as we bridge from emitting to non-emitting energy supply technologies and fuels. Carbon capture and geologic storage technologies are expected to work in conjunction to reduce GHG emissions from large concentration sources, such as fossil power plants and industrial facilities. Capture and storage are supported by domestic demonstration projects, international collaboration efforts, and information programs. Terrestrial sequestration offers a potential sink for carbon that cannot be stored in geologic formations and the large U.S. land base offers considerable potential for increasing terrestrial sequestration capabilities. However, this great opportunity comes at a relatively high cost for the many individual landowners who must change their practices and acquire additional skills or equipment to increase their land’s sequestration capacity. Thus, many Federal programs seek to reduce the costs of implementation, increase knowledge of the technical feasibility and provide education and information. Recent Federal activity has provided additional support to development and demonstration of carbon capture and storage technologies. EISA 2007 authorized creation of two demonstration activities to reduce technical risks in the area of carbon capture and subsequent geologic storage. On the front end, the Carbon Capture Demonstration
Program, EISA 2007 Sec. 703, authorizes a program for demonstration of capture, purification, and compression of carbon dioxide from industrial facilities. The Carbon Capture and Sequestration Research, Development, and Demonstration Act of 2007, Title VII Subtitle A of EISA 2007, enacts provisions for testing and validation of storage with carbon injection in different geologic materials, as well as different monitoring techniques. Title VII Subtitle B of EISA 2007 may provide additional support for both geologic and terrestrial sequestration by enacting sequestration resource assessments by the U.S. Geological Survey and the Department of the Interior. These assessments could support optimal development priorities and efficient markets by providing independent and objective information about the potential future availability and quality of sequestration opportunities. Altogether, the deployment of carbon capture, geologic storage, and terrestrial sequestration technologies and practices is supported by a broad range of Federal efforts, including financial incentives, international cooperation, and information programs (Figure 4-1).
4.1 CARBON CAPTURE Globally, the transformation of fossil-fuel-based combustion systems into low-carbon energy processes would enable the continued use of plentiful coal and other fossil energy resources. Such a transformation requires further development and

Strategies for Commercialization and Deployment
72
application of technologies to capture CO2 and store it using safe and acceptable means, such as geologic storage, thus preventing its emission into the atmosphere for the long term. While no power plants are fully utilizing carbon capture methods at the present time, a coal gasification facility for producing natural gas is using carbon capture, and several countries are conducting demonstrations and proposing projects for power plants and other industrial emitters. Carbon capture from coal gasification is already being demonstrated on a commercial level in the U.S. The Great Plains Synfuels Plant in North Dakota captures more than 200 million scf per day carbon dioxide in a 96 percent pure stream, part of which is sent via a 320 km pipeline to Canada and sold for use in an international CO2 storage and enhanced oil recovery research project (Weyburn II).55 Carbon capture at an Integrated
55 The Great Plains Synfuels Plant is operated by the Dakota Gasification Company, which provides data on all products from the coal gasification plant; they state that carbon dioxide production is more than 200 million standard cubic feet per day. The 96 percent number is their reported mole% in a typical
Gasification Combined Cycle (IGCC) electricity plant designed to produce hydrogen and electricity would have some significant design differences from the Great Plains facility, which was built to produce synfuels. The C&D strategies for accelerating the commercialization and deployment of carbon capture technologies focuses primarily on reducing the current technical risks, high costs, and limitations in infrastructure. Secondarily, it addresses the policy barriers that could thwart the wider deployment of these technologies. Carbon dioxide transport technology is mature and not a significant obstacle to deployment of capture technologies, however further research efforts and expansion of knowledge on CO2 transport could allow for capture and storage in distinctly different areas of the country with different kinds of coals and geologic storage opportunities. In addition, the
result over more than 400 samples. This data is from an April 2005 update (Dakota Gas Company).
Figure 4-1. Federal Policies to Reduce GHGs in Carbon Capture, Storage, and Sequestration, by Type of Policy and Measure
15
11
10
9
8
6
6
1
1
1
0 2 4 6 8 10 12 14 16
Tax Policy and Other Financial Incentives
International Cooperation
Labeling & Information Dissemination
Education, Training, and S&T Workforce Development
Coalitions & Partnerships
Technology Demonstration
Market Conditioning including Government Procurement
Risk Mitigation
Codes and Standards
Legislative Act of Regulation
Number of Activities
15
11
10
9
8
6
6
1
1
1
0 2 4 6 8 10 12 14 16
Tax Policy and Other Financial Incentives
International Cooperation
Labeling & Information Dissemination
Education, Training, and S&T Workforce Development
Coalitions & Partnerships
Technology Demonstration
Market Conditioning including Government Procurement
Risk Mitigation
Codes and Standards
Legislative Act of Regulation
Number of Activities Source: CCTP/Energetics Deployment Inventory Database dated January 2009 Note: Some activities fit into more than one category, so the total count exceeds the total number of identified activities (44) listed in this area. The figure does not include activities that are authorized but not implemented. See Annex B for details.

Carbon Capture January 2009
73
Suitable Carbon Capture Technologies: Post- and Pre-Combustion Examples
Post-combustion – This capture method involves separation of CO2 from flue gases, which can be accomplished using amine-based chemical absorbents. This method is being used now, but more for process applications than for CO2 capture.
Pre-combustion – Pre-combustion capture involves processing the primary fuel to separate CO2 and hydrogen, such as in gasification reactions. Pre-combustion capture is already commercial on a limited basis.
development and deployment of capture technologies may have benefits beyond the reduction of carbon emissions from fossil-fuel-based power. The application of these technologies could be expanded to include methods for capture of other gases and may also include other marketable byproducts. Technologies Suitable for Deployment As illustrated in the Figure 4-2, there are three basic processes for capturing CO2: post-combustion, pre-combustion, and oxyfuel (DOE 2006c). Post-Combustion capture refers to a chemical or physical separation process that extracts CO2 from the flue gases (boiler exhaust) of the conventional air-fired combustion process. The most common technology employed today is the use of an amine-based chemical absorbent to remove CO2 from industrial gas streams. For example, the natural gas production facilities, Sleipner (Norway) and In Salah (Algeria) use this amine-based chemical absorbent process to remove CO2 impurities from the natural gas production stream and then inject the CO2 into geologic formations.
Pre-combustion capture is being used at the North Dakota-based synfuel plant described above and is being developed for future application in IGCC electricity plants. Hydrocarbon feedstock is gasified and processed into CO2 and hydrogen prior to combustion. The concentration of CO2 at this stage is significantly higher than it would be in a post-
combustion process. As a result, the CO2 can be more easily separated, leaving behind the hydrogen, which can be used for combustion or to charge fuel cells. The oxyfuel process has not yet been tested in a large-scale facility. This technology utilizes pure oxygen instead of air in the combustion process. The use of oxygen results in a CO2 concentration in the flue gases of over 90 percent typically, which is
much greater than with traditional air-fired combustion and facilitates capture of the CO2. A small pilot-scale facility in Kimberlina, California, that has received both Federal and state support currently employs oxyfuel technology. In addition, considerable research is underway in the U.S. and particularly Europe on oxyfuel technology that is based on existing pulverized coal plant technology. Current techniques for the separation and capture of high purity CO2 streams are being adapted for low purity CO2 streams (10-12 percent for coal and 3-6 percent for natural gas) associated with fossil fuel combustion exhaust. In addition to the aforementioned technologies, there is considerable research underway to develop far more efficient CO2 capture methods. These include the use of carbon and sodium absorbents, lithium silicate, various
membrane technologies, cryogenic distillation, and innovative chemistry such as ionic liquids and metal organic frameworks.
Figure 4-2. Overview of CO2 Capture
Processes and Systems
(Source: IPCC 2005)
Strategies for Commercialization and Deployment
74
Barriers to Deployment56 Several significant factors constrain investment in the commercialization and widespread deployment of carbon capture technologies. Among the most critical barriers are: the inability of investors currently to realize the benefits of capture technologies; the technical risks associated with capture and geologic storage technologies, and integrating these technologies in the same plant; the high costs of adding these technologies to a power plant; and constraints in infrastructure, both at the plant and downstream. These are elaborated upon below:
Carbon capture and compression is a costly and complex process – by far the most expensive part of carbon capture and storage – requiring investors to assume there will be a significant market for captured CO2 or a cost imposed for emissions. Because the benefits of carbon capture technology cannot be fully realized by investors, they face an external benefits problem.
As many capture technology options have not been widely demonstrated in commercial applications at scale, investors face technical risks associated with unproven technologies, as well as uncertainty regarding the feasibility of geologic storage or the availability of significant other downstream uses for the captured CO2. Moreover, the addition of carbon capture technologies adds to the auxiliary electric load on the power plant, reducing available power for sale.
Currently, carbon capture, separation and compression can add as much as 50-80 percent to the costs of a power plant (CCTP 2006). Because there is no way to recover these high costs57 and
56 The existence of barriers and their identification in this report in no way implies it is the responsibility of the Federal government to address every (or any) barrier, in whole or in part. 57 In an efficiently functioning market, absent significant market failures or other imperfections, “high cost” is usually a market signal indicating a technology is not economically viable, due to the existence of low demand or less costly competitors or substitutes. The existence of high cost, identified here as a barrier to greater C&D, does not by itself suggest government intervention is necessary or advisable. In the case of GHG emissions, there currently exists no regulatory scheme to internalize external costs and benefits of rising atmospheric GHG concentrations and, hence, a market failure is known to exist and government intervention may be warranted. In the absence of an internalized market-valuing mechanism, however,
no price on carbon, there is little incentive to assume these costs and add the capture technologies.
Infrastructure limitations further constrain the deployment of capture technologies. Pipeline and geologic storage infrastructure as well as chemical separation areas will have to be developed. Expanded production of chemicals for transforming gas streams into usable carbon dioxide may be needed. In addition, after decades of adding pollution control equipment, many existing plants do not have the physical space available to fit the machinery needed for carbon capture.
Besides the critical barriers discussed above, the current uncertainty regarding GHG policy is an important barrier that impedes the domestic deployment of capture technologies. The U.S. Supreme Court has recently determined that the Environmental Protection Agency (EPA) has the authority to regulate CO2 and other GHGs, but how and when EPA will exercise this authority remains unknown at this time, creating policy uncertainty for investors. Commercialization and Deployment Strategy The U.S. strategy to promote the commercialization and deployment of carbon capture (and geologic storage) technologies is motivated, in part, by its larger strategy to slow and eventually stop the growth of GHG emissions. Given the significant coal resource endowments in the U.S. and many emerging economies abroad, coal will remain an integral fuel for power generation globally for the foreseeable future. Carbon capture technologies offer a significant opportunity to “decarbonize” power from coal, allowing this abundant resource to be fully exploited while still meeting national commitments to the goals of the UNFCCC. The U.S. strategy for accelerating the commercialization and deployment of carbon capture technologies is (a) to continue to support R&D on carbon capture and associated storage technologies, (b) to support demonstrations of advanced carbon capture technologies, in partnership with industry, and (c) to work with the coal industry,
the extent of that intervention remains unclear (see Box 1-1 in Chapter 1).

Carbon Capture January 2009
75
Federal Programs at Work in Carbon Capture
Carbon Sequestration Regional Partnerships – help determine the most suitable technologies, regulations, and infrastructure needs for carbon capture, storage, and sequestration.
Clean Coal Power Initiative – public/private partnership to promote technology transfer of advanced CCS technologies.
Carbon Sequestration Program – lowers capture costs by developing advanced sorbents and membranes.
Gasification Technologies Program – works to increase the efficiency and lower the costs of advanced gasification power systems, thus lowering the overall cost of coal-fueled electricity plants with carbon capture and storage.
its suppliers, customers, regulatory bodies, and other interested partners to address systematically the remaining barriers to the widespread use of these technologies. About 16 Federal programs, policies, and initiatives identified in Annex B encourage deployment of carbon capture technologies in the marketplace (Figure 4-3). Most of these activities impact carbon capture technologies in conjunction with GHG-reducing technologies in several other market areas. Approximately one-third of these Federal programs are designed expressly for carbon capture, storage, and sequestration. A demonstration component is included in four of the Annex B activities, including the Carbon Sequestration Regional Partnerships. A number of these activities involve international coalitions or partnerships between the government and private sector. Some key activities are shown in the accompanying text box. To address the high costs to investors of adding carbon capture technologies to plants, the Federal Loan Guarantee Program creates a financial incentive through the offer of loan guarantees for advanced coal projects, potentially including carbon capture and storage (CCS) or component technologies that could be integral to carbon capture and storage. Opportunities exist for significant reductions of the technical risks and high costs to investors of carbon
capture technologies. A number of DOE programs and partnerships work to capitalize on these opportunities through continued R&D as well as the validation and demonstration at commercial scale of advanced capture technologies. Some examples include the Gasification Technologies Program and the Clean Coal Power Initiative. The Gasification Technologies Program aims to reduce the cost and improve the flexibility and efficiency of advanced coal gasification power systems. To lower the costs of pre-combustion capture, the program researches novel approaches to make the oxygen for oxyfuel systems and reduce impurities in flue gases. The Carbon Sequestration Program demonstrates a portfolio of technologies that can capture and permanently store greenhouse gases, including carbon dioxide and methane, encouraging deployment of cost-effective carbon capture systems at both new and existing facilities. Its research focuses on transformative and revolutionary new and advanced capture concepts. For example, it is researching advanced sorbents and membranes that promise to lower the costs of carbon capture. In addition, DOE’s network of seven Carbon Sequestration Regional Partnerships works to identify and address the infrastructure limitations to deployment of carbon capture technologies. The partnerships leverage local expertise and experience to help determine the most suitable technologies, regulations, and infrastructure needs for the deployment of CCS technologies. To reduce the policy uncertainty, the U.S. government has convened the Major Economies Meetings on Energy Security and Climate Change. This series of meetings and workshops brings together the world’s 17 largest economies to develop a new international framework on greenhouse gas emissions. Together, these policies and measures reflect significant Federal support for the removal of barriers to the widespread deployment of carbon capture technologies. Annex B contains a full list of the activities in this area. A representative selection of the key activities, aligned with their respective barriers, may be found in Table 4-1.

Strategies for Commercialization and Deployment
76
Figure 4-3. Federal Policies to Reduce GHGs through Carbon Capture, by Type of Policy and Measure
6
5
4
4
4
2
1
1
0 1 2 3 4 5 6 7
International Cooperation
Tax Policy and Other Financial Incentives
Technology Demonstration
Coalitions & Partnerships
Labeling & Information Dissemination
Market Conditioning including Government Procurement
Risk Mitigation
Education, Training, and S&T Workforce Development
Number of Activities
6
5
4
4
4
2
1
1
0 1 2 3 4 5 6 7
International Cooperation
Tax Policy and Other Financial Incentives
Technology Demonstration
Coalitions & Partnerships
Labeling & Information Dissemination
Market Conditioning including Government Procurement
Risk Mitigation
Education, Training, and S&T Workforce Development
Number of Activities Source: CCTP/Energetics Deployment Inventory Database dated January 2009 Note: Some activities fit into more than one category, so the total count exceeds the total number of identified activities (16) listed in this area. The figure does not include activities that are authorized but not implemented. See Annex B for details.
Table 4-1. Select Federal Activities Addressing Key Technology Deployment Barriers: Carbon Capture
Solutions Key Technology Deployment
Barriers Major Programs, Policies, or Initiatives*
Illustrative Deployment Activities
Most Critical Barriers:
Technical Risks 3 • Clean Coal Power Initiative (DOE) • Gasification Technologies Program (DOE)
High Costs 3 • Clean Coal Power Initiative (DOE) • Gasification Technologies Program (DOE)
Infrastructure Limitations 1 • Carbon Seq. Regional Partnerships (DOE)
Other Important Barriers:
Policy Uncertainty 7 • Major Economies Meetings on Energy
Security and Climate Change (White House)
*Does not include activities that are authorized but not implemented. See Annex B for details.

Geologic Storage January 2009
77
Potential Opportunities and Gaps Carbon capture holds considerable promise as part of a series of technologies that will allow the United States and other nations to continue to take full advantage of their fossil-fuel resources, particularly coal and natural gas, in pursuit of continued economic development and prosperity. However, carbon capture technologies are really just starting to demonstrate this potential. The public and private sectors are expending a great deal of effort, often in partnership, in the research, development, and demonstration (RD&D) of carbon capture technologies in conjunction with geologic storage. Federally-sponsored demonstration programs have made encouraging progress this effort. In addition, the Federal Loan Guarantee program provides an incentive that reduces the costs of advanced coal technologies that are ready for early commercial deployment. The possible industrial uses of captured CO2 are likely to absorb only a small portion of the amounts currently emitted. Therefore, the deployment of carbon capture requires the concurrent development and deployment of storage technologies, and in particular, geologic storage. In addition, it requires the sufficient investment in pipeline infrastructure to transport the captured gases from their source to the storage site. As technical risks and costs are reduced through continued RD&D and financial incentives, the problem of external benefits remains significant for deployment of carbon capture technologies. The policy framework for treating CO2 emissions must be addressed in order to provide legal grounding and greater policy certainty for companies and investors in this area, as well as allow for realization of social benefits. It is expected that success of the Clean Coal Power Initiative demonstration projects will be instrumental in providing a technological push for power plant carbon capture in the U.S. as long as an accompanying market incentive or regulatory framework exists for carbon capture. In addition, as carbon capture technologies move from demonstration to full commercialization and deployment, the scope and effectiveness of current activities must be evaluated and measured, anticipating future needs and allowing room for
additional activities to be introduced as needed to ensure the widespread deployment of these technologies.
4.2 GEOLOGIC STORAGE Scientists around the world are looking for ways to store rather than emit CO2 produced by fossil-fuel combustion and industrial processes. Long term storage of GHGs in geologic formations is one possible way to avoid emissions, even with continued production of GHGs. Such geologic formations, located deep underground could store injected CO2 much like natural gas and oil have been stored naturally for millennia (Figure 4-4). Moreover, a great deal of experience exists worldwide for dealing with geologic formations like those currently being considered for potential CO2 storage. For example, the Sleipner (Norway) project is an example of a major carbon capture and storage effort that has been operating since 2000. This project captures the CO2 impurity from the natural gas stream and injects the CO2 into a saline aquifer, avoiding the release of over 1 million tonnes of CO2 per year. The C&D strategies for accelerating the commercialization and deployment of geologic storage technologies focus on activities to promote such storage including international collaborations,
Figure 4-4. Graphical Representation of Geologic Storage
(Source: IPCC 2005)

Strategies for Commercialization and Deployment
78
technology demonstrations, and training programs, in addition to continued research and development. In the long term, geologic storage of carbon dioxide in the form of a supercritical fluid could allow continued energy conversion through combustion of our nation’s coal resources with very low GHG emissions. Saline formations found under much of the U.S. may offer extensive storage capacity. Additionally, storage can be combined with efforts to improve recovery of other valuable energy commodities such as oil and natural gas. For instance, in the United States, carbon dioxide is injected into oil wells for enhanced oil recovery (EOR) programs. Gas injection has been used since 1972 and currently accounts for 50 percent of EOR projects in the U.S. (DOE 2008f). Through pilot projects, CO2 injection has been shown to improve natural gas recovery through methane extraction from deep, unmineable coal seams (CCTP 2006). Geologic storage of CO2 is expected to work as a system with carbon capture, separation, and compression activities at the point source, such as a fossil-fuel based power plant, and transport activities, if necessary, to move the compressed gas from the source to the storage site. The C&D strategies consider how geologic storage approaches might evolve as combinations of power generation, carbon capture, and storage mature. See also section 4.1 on carbon capture for more on this relationship. Technologies Suitable for Deployment Three primary types of geologic opportunities exist for trapping and storing CO2: oil and gas reservoirs, saline formations, and unmineable coal seams. The natural gas and petroleum industries have a long history of injecting CO2 into depleted or underperforming wells to boost production. In addition, these industries have vast experience with site identification, transportation of gases, and subsurface gas injection that can benefit the advancement of geological storage of CO2. Since CO2 is soluble in saline water and will dissolve in such a solution upon contact, it can be injected into saline formations and suspended there. Such formations lie below much of the United States. Substituting CO2 for nitrogen for injection into a deep seam coal bed displaces methane from the surface of the coal. This methane can then be
captured and used for both energy and industrial processes while the CO2 is left stored in the coal seam. DOE, as part of the Carbon Sequestration Regional Partnerships Phase II activities, is conducting 25 pilot-scale geologic storage projects, including nine EOR tests, 10 saline formation tests, five enhanced coal bed methane tests, and one enhanced gas recovery test. Phase III, initiated in 2007, will conduct several large volume tests in North America with injection rates up to 1,000,000 tons per year for several years. Scale up to these near-commercial levels will provide insights into important operational and technical issues in different formations. Barriers to Deployment58 Geologic storage and associated enhanced recovery of oil and natural gas are promising for long-term CO2 mitigation. Considerable Federal and private sector investment in R&D, combined with current knowledge, are helping to push this technology forward. However, a number of barriers impede the widespread use of geologic storage to reduce emissions of GHGs. Among the most critical are: the technical risks associated with the safety and permanence of geologic storage, the uncaptured external benefits of its use, and persistent uncertainty about the legal frameworks. These are elaborated upon below:
The technical risks associated with geologic storage, specifically the need for improved tools and practices to ensure its safety and permanence, stem from a lack of adequate knowledge about the amount of carbon dioxide that can be safely stored underground (i.e., without negative impacts on, say, drinking water supplies), for how long and with what level of potential leakage, if any, back to the surface. These risks include the rates and capacities of various sequestration reservoirs as well as any unintended environmental consequences of injecting high pressure CO2 in these various rock types.
Without a clear policy signal on GHG emissions, investors face persistent policy uncertainty that
58 The existence of barriers and their identification in this report in no way implies it is the responsibility of the Federal government to address every (or any) barrier, in whole or in part.

Geologic Storage January 2009
79
Suitable Geologic Storage Technologies: Injection and Storage Examples
Injection and Storage Technologies – Many technologies required for storing CO2 are borrowed from the petroleum industry, which uses CO2 injection for enhanced oil recovery. Technologies for CO2 processing, transport, compression, and subsurface reservoir engineering and characterization can also be leveraged from the petroleum industry (CCTP 2005).
may limit deployment of geologic storage technologies.
Moreover, investors in geologic storage cannot appropriate the societal benefits from climate change mitigation; because geologic storage primarily provides a good (i.e., GHG emissions reductions) that lacks a market, or proper regulatory incentives, that creates an external benefits problem. Lacking an appropriate regulatory scheme that internalizes such externalities results in lower investment in CO2 storage technologies than society would be expected to desire.
Property rights, and the attendant long-term legal and environmental responsibilities and liabilities, specifically with regard to deep subsurface spaces, vary significant among and within states. Clear property ownership is seen as necessary to attract investment in geologic storage. Therefore, persistent statutory uncertainty pertaining to property rights must be resolved.
In addition to those critical barriers, a number of other important factors, including limitations in the available pipeline infrastructure, potential exposure to liability, land use impacts, and negative public opinion, may impede the deployment of geologic storage.
While more than three decades of enhanced oil recovery have produced a large knowledge base on CO2 injection, geologic storage systems still face considerable infrastructure limitations. In particular, geologic storage of large quantities of CO2 will require a significant expansion of the CO2 transport system. A network of pipelines must be built to transport captured CO2 from the points of emission to the underground storage sites.
The potential liability stemming from possible geologic storage leaks, particularly long-term liability covering the period long after CO2 injection has ceased, creates a market risk for investors; clarification of long-term liability is a barrier to growth of this technology.
Public acceptance of geologic storage is critical to the success of this technology. Therefore, improving the technical knowledgebase and communicating this information will be necessary to overcome incomplete and imperfect
information to build full and useful public knowledge about the risks and benefits of geologic storage.
Commercialization and Deployment Strategy The U.S. strategy to promote the commercialization and deployment of carbon capture and geologic storage technologies is motivated, in part, by its larger strategy to slow and eventually stop the growth of GHG emissions. Given the significant coal resource endowments in the U.S. and key emerging economies abroad, coal will remain an integral fuel for power generation globally for the foreseeable future. Geologic storage technologies, used in conjunction with carbon capture at the emissions source, offers a significant opportunity to “decarbonize” power from coal, allowing this abundant resource to be fully exploited while still meeting national commitments to the UNFCCC. The U.S. strategy for accelerating the commercialization and deployment of geologic storage technologies is (a) to continue to support R&D on geologic storage and associated carbon capture technologies, (b) to support demonstrations of advanced carbon capture technologies, in partnership with industry, both here and abroad, and (c) to work with the coal industry, its suppliers, customers, regulatory bodies, and other interested partners to address systematically the remaining barriers to the widespread use of these technologies. The strategies include more than 15 programs, policies, and initiatives identified in Annex B that encourage the deployment of geologic storage (Figure 4-5). Most of these activities impact geologic storage in conjunction with other related GHG-reducing activities, most notably carbon capture.

Strategies for Commercialization and Deployment
80
Federal Activities at Work in Geologic Storage
Carbon Sequestration Regional Partnerships –include government agencies, universities and the private sector, and help determine the most suitable technologies, regulations, and infrastructure needs for carbon capture, storage, and sequestration for each region of the United States.
CO2 Storage Projects – As part of DOE’s Carbon Sequestration Program, seeks to develop and demonstrate capture and storage of CO2, including demonstration of advanced CO2, including measurement and detection technologies. Storage Projects include the Weyburn Demonstration Project, an international public/private partnership, transports, stores, and monitors CO2 in a Canadian oil field.
Clean Coal Power Initiative – public/private partnership to demonstrate advanced CCS technologies and other emissions reducing technologies at several new commercial-scale plants.
Recognizing the global nature of climate change solutions, seven programs have an international component, including the Carbon Sequestration Leadership Forum. Several Federal activities focus on demonstrations and monitoring CO2 storage; demonstration of successful storage is a necessary
step to alleviate serious technical risks associated with this technology. These programs often have an international component to reduce costs. Additionally, the strategies include measures that, among other things, foster collaboration, provide information, reduce first costs, and develop an educated workforce. The C&D strategies include Federally-supported R&D activities designed to mitigate technical risks associated with use of geologic storage for long-term CO2 storage. The Carbon Sequestration Program at DOE’s Office of Fossil Energy demonstrates a portfolio of technologies that can capture and permanently store greenhouse gases, including carbon dioxide and methane, encouraging deployment of geologic storage in conjunction with the introduction of cost-effective carbon capture systems at both new and existing facilities. This program includes demonstration of advanced CO2 measurement and detection technologies. The Clean Coal Power Initiative, a cost-shared partnership between the U.S. government and industry, will leverage Federal funding for demonstration of carbon capture and storage technologies at several new commercial-scale coal power plants. In addition, geologic storage is already being demonstrated through DOE’s current CO2 Storage
Figure 4-5. Federal Policies to Reduce GHGs through Geologic Storage, by Type of Policy and Measure
7
4
4
3
3
2
1
1
1
1
0 1 2 3 4 5 6 7 8
International Cooperation
Coalitions & Partnerships
Tax Policy and Other Financial Incentives
Technology Demonstration
Labeling & Information Dissemination
Market Conditioning including Government Procurement
Risk Mitigation
Codes and Standards
Legislative Act of Regulation
Education, Training, and S&T Workforce Development
Number of Activities
7
4
4
3
3
2
1
1
1
1
0 1 2 3 4 5 6 7 8
International Cooperation
Coalitions & Partnerships
Tax Policy and Other Financial Incentives
Technology Demonstration
Labeling & Information Dissemination
Market Conditioning including Government Procurement
Risk Mitigation
Codes and Standards
Legislative Act of Regulation
Education, Training, and S&T Workforce Development
Number of Activities Source: CCTP/Energetics Deployment Inventory Database dated January 2009 Note: Some activities fit into more than one category, so the total count exceeds the total number of identified activities (16) listed in this area. The figure does not include activities that are authorized but not implemented. See Annex B for details.

Geologic Storage January 2009
81
Projects, including as the Weyburn II projects, which stores CO2 captured at a North Dakota synfuels plant.59 The C&D strategies address the statutory uncertainty associated with the large-scale infrastructure development necessary for the wider deployment of geologic storage of CO2. Internationally, the Carbon Sequestration Leadership Forum promotes the appropriate technical, political, and regulatory environments for the development of CCS technology. Domestically, DOE’s network of seven Carbon Sequestration Regional Partnerships is carrying out small and large-scale CO2 storage tests that will help inform EPA’s ongoing process of developing regulations for large-scale CO2 storage. EPA’s Underground Injection Control (UIC) program is responsible for providing guidance and regulations on underground injection of fluids, including CO2. Under the Safe Drinking Water Act, EPA is responsible for ensuring that underground injection that may affect drinking water is conducted in a manner that is safe and protective of human health and the environment. EPA is working with DOE on developing standard framework for commercial-scale projects. A number of policies and measures work to reduce the policy uncertainty regarding GHG emissions. For example, President Bush’s Global Climate Change Initiative set an ambitious national goal for the reduction of GHG intensity. In addition, the U.S. government has convened the Major Economies Meetings on Energy Security and Climate Change. This series of meetings and workshops brings together the world’s 17 largest economies to develop a new international framework on greenhouse gas emissions. A number of Federal activities seek to eliminate the current incomplete and imperfect information regarding the potential impacts of geologic storage of large quantities of CO2. For example, EPA’s public outreach website on climate change includes a detailed page on geologic storage methods and impacts, with links to pertinent sources. USGS activities focused on the assessment of geologic carbon dioxide sequestration capacities in oil and 59 The Weyburn II project is an international effort for Enhanced Oil Recovery in Saskatchewan, Canada. This project is integrating carbon capture and storage through the purchase of captured carbon dioxide from a syngas plant in North Dakota.
gas reservoirs and saline formations also fill in critical information gaps regarding geologic CO2 storage. The Federal Loan Guarantee Program creates a financial incentive that may mitigate some of the market risk associated with geologic storage through the offer of loan guarantees for eligible CCS projects (DOE “Loan Guarantee Program”). Activities in the Carbon Sequestration Program work to identify the infrastructure limitations to deployment of carbon capture technologies. As part of this program, the Carbon Sequestration Regional Partnerships leverage local expertise and experience to help determine the most suitable technologies, regulations, and infrastructure needs for the deployment of CCS technologies in each of the various regions of the United States. Together, these policies and measures reflect a significant U.S. investment in the removal of barriers to the widespread deployment of geologic storage technologies. Annex B provides the full list of activities in this area. A representative selection of illustrative activities, aligned with their respective barriers, may be found in Table 4-2. Potential Opportunities and Gaps Geologic storage of GHGs holds considerable promise as part of a series of technologies that will allow the United States and other nations to continue to take full advantage of their fossil-fuel resources, particularly coal and natural gas, in pursuit of continued economic development and prosperity. Federal research, development, and demonstration (RD&D) programs are already making progress at identifying and limiting the technical risks associated with geologic storage technologies. Three Federal programs that are identified in Annex B, the Carbon Sequestration Leadership Forum, Carbon Sequestration Regional Partnerships, and Underground Injection Control, are fostering the development of codes and standards as well as methods to address other statutory uncertainties. Other programs, including EPA’s climate change website, work to provide information to the general public about the potential impacts of geologic storage and generate support for its use. The USGS is developing a methodology for quantifying the
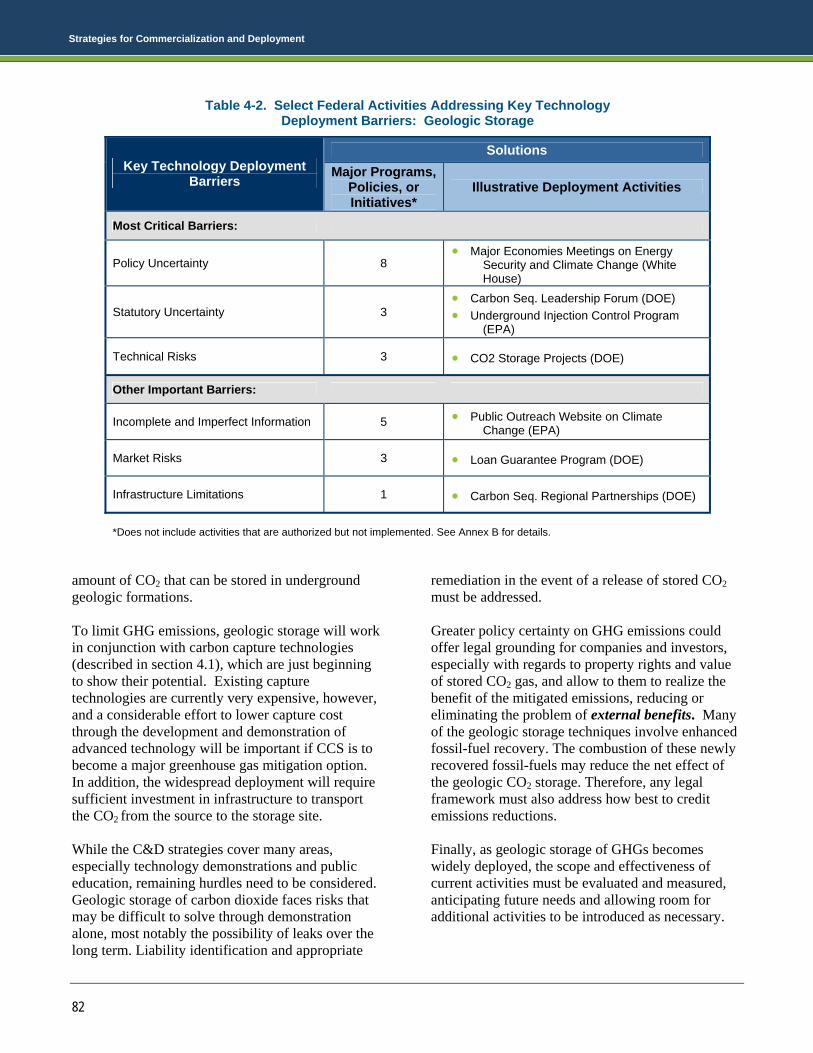
Strategies for Commercialization and Deployment
82
amount of CO2 that can be stored in underground geologic formations. To limit GHG emissions, geologic storage will work in conjunction with carbon capture technologies (described in section 4.1), which are just beginning to show their potential. Existing capture technologies are currently very expensive, however, and a considerable effort to lower capture cost through the development and demonstration of advanced technology will be important if CCS is to become a major greenhouse gas mitigation option. In addition, the widespread deployment will require sufficient investment in infrastructure to transport the CO2 from the source to the storage site. While the C&D strategies cover many areas, especially technology demonstrations and public education, remaining hurdles need to be considered. Geologic storage of carbon dioxide faces risks that may be difficult to solve through demonstration alone, most notably the possibility of leaks over the long term. Liability identification and appropriate
remediation in the event of a release of stored CO2 must be addressed. Greater policy certainty on GHG emissions could offer legal grounding for companies and investors, especially with regards to property rights and value of stored CO2 gas, and allow to them to realize the benefit of the mitigated emissions, reducing or eliminating the problem of external benefits. Many of the geologic storage techniques involve enhanced fossil-fuel recovery. The combustion of these newly recovered fossil-fuels may reduce the net effect of the geologic CO2 storage. Therefore, any legal framework must also address how best to credit emissions reductions. Finally, as geologic storage of GHGs becomes widely deployed, the scope and effectiveness of current activities must be evaluated and measured, anticipating future needs and allowing room for additional activities to be introduced as necessary.
Table 4-2. Select Federal Activities Addressing Key Technology Deployment Barriers: Geologic Storage
Solutions Key Technology Deployment
Barriers Major Programs,
Policies, or Initiatives*
Illustrative Deployment Activities
Most Critical Barriers:
Policy Uncertainty 8 • Major Economies Meetings on Energy
Security and Climate Change (White House)
Statutory Uncertainty 3 • Carbon Seq. Leadership Forum (DOE) • Underground Injection Control Program
(EPA)
Technical Risks 3 • CO2 Storage Projects (DOE)
Other Important Barriers:
Incomplete and Imperfect Information 5 • Public Outreach Website on Climate Change (EPA)
Market Risks 3 • Loan Guarantee Program (DOE)
Infrastructure Limitations 1 • Carbon Seq. Regional Partnerships (DOE)
*Does not include activities that are authorized but not implemented. See Annex B for details.

Terrestrial Sequestration January 2009
83
Suitable Terrestrial Sequestration Technologies:
Land Management Examples Cropland Management – precision agricultural techniques can increase productivity and reduce the rate at which CO2 is released into the atmosphere. No-tillage, and nutrient and water management can mitigate CO2 release into the atmosphere as well.
Forest Management – afforestation, reforestation and the mitigation of deforestation all mitigate atmospheric CO2 levels by increasing or maintaining carbon stocks in forests. Appropriate forest management and harvest techniques can maintain higher stand-level forest carbon stocks than traditional practices, and minimize carbon loss by reducing erosion, collateral tree damage, and burning of slash while harvesting trees (IPCC 2007).
4.3 TERRESTRIAL SEQUESTRATION
Terrestrial sequestration is the conversion of atmospheric CO2 to carbon stored in vegetation and soils through photosynthesis. This process can play a significant role in addressing the increase of CO2 in the atmosphere. For example, terrestrial sequestration currently offsets about 12.5 percent of all GHG emissions in the United States (EPA 2008, Table ES-2). Only a small fraction of this sequestration results from activities undertaken specifically to sequester carbon. At the same time, deforestation and other land-use changes currently account for about 30 percent of global GHG emissions (EPA 2006). Terrestrial sequestration is a distinct non-location specific approach to carbon capture compared to geologic storage (discussed in section 4.2), which is typically envisioned at point sources of CO2 (Figure 4-6). Given the size and productivity of the U.S. land base, terrestrial sequestration has distinct economic and environmental advantages as a GHG-reducing technology. Estimates of the biophysical potential to sequester additional carbon in U.S. cropland, grazing land, and forest lands range from nearly 1,100 TgCO2 to 1800 TgCO2.60 Some fraction of that physical potential could be realized by government programs or climate mitigation financial incentives; the fraction is likely to vary with the magnitude and duration of the incentive. Two recent studies, for example, estimate that a 15-year mitigation program providing a $15/tCO2 eq. incentive for afforestation and cropland soil carbon sequestration could produce 108-432 TgCO2 eq. on average annually (Lewandrowski et al. 2004; EPA 2005). With such potential, the C&D strategies seek to create a policy environment that encourages development of terrestrial sequestration possibilities. Terrestrial sequestration activities can provide a positive force for improving landscape-level land management and provide significant additional benefits to society, such as improvements in wildlife 60 Estimates based on summed potentials presented for croplands at 55-164 TgC (Lal et al. 1998), grazing lands at 29-110 TgC (Follett et al. 2001), and forest lands at 210 TgC (Joyce and Birdsey 2000). Estimates of potential savings from dedicated bioenergy croplands from 91-152 TgC (Tuskan and Walsh 2001) are excluded in this sum.
and fisheries habitat, enhanced soil productivity, reduction in soil erosion, and improved water quality. Additionally, biotechnology may be able to increase vegetation sequestering capacity through modification of chemical make up of plants (CCTP 2006). Technologies Suitable for Deployment Many technologies and practices that sequester carbon have already been widely adopted for other reasons. These include measures to improve soil conservation, reduce soil erosion, and increase crop yields. At the same time, soil carbon data has been compiled and used to estimate the soil carbon sequestration potential of these technologies and
Figure 4-6. Terrestrial Carbon Cycle
(Source: EPRI 2007)
Strategies for Commercialization and Deployment
84
management practices. Terrestrial sequestration technologies and practices suitable for commercialization and deployment include conservation tillage, conservation set-asides, cover crops, buffer strips, biomass energy crops, active forest management, active wildlife habitat management, low-impact harvesting, precision use of advanced information technologies, genetically improved stock, wood products life-cycle management, and advanced bio-products. Barriers to Commercialization and Deployment61 While there are many cost-competitive technologies that could enhance sequestration of carbon in the terrestrial environment, numerous barriers impede their full deployment. The chief barriers to expansion of terrestrial sequestration capacity are: the failure to gain from external benefits, a large and diverse industry structure that actually includes many industries and private lands, lack of specialized knowledge required to improve sequestration, and high private costs.
The lack of a formal carbon market deprives the owners of forests, croplands, and grasslands from capturing the full social value of the GHG benefits associated with improving the carbon sequestering capacities of their land resources.62 Until such a market develops, external benefits will remain a barrier, and investment in CO2 sequestration will be suboptimal.63
The industry is composed of many actors from large agribusiness to small private landowners. This diverse and fragmented industry structure makes effecting changes in practices and
61 The existence of barriers and their identification in this report in no way implies it is the responsibility of the Federal government to address every (or any) barrier, in whole or in part. 62 Incomplete carbon accounting that under values the maintenance of high-carbon storage biological systems such as wetlands, peatlands and permafrost, or over values intensive agricultural systems without long-term carbon storage, may misrepresent the benefits of biological sequestration. 63 We acknowledge that there are carbon markets. For example, the Chicago Climate Exchange (CCX) has been trading GHG and facilitating voluntary but legally binding GHG reductions in North America since 2003 (CCX 2009). This market, while growing, represents a small portion of GHG in the United States. The benefits to those who can supply GHG reductions will require for there to be a demand of GHG reductions from a greater portion of emitters.
technologies related to land and resource management difficult.
Even where cost-effective opportunities exist, many farmers and forest landowners lack the specialized knowledge necessary to manage and maintain their land resources to improve terrestrial sequestration capacity.
Land owners and managers face high costs64 in taking terrestrial sequestration upon themselves. In addition to implementation costs which are generally low, these costs include transactions, education, and opportunity costs. The opportunity costs will include any economic losses from reduced yields caused by the adoption of sequestration practices.
Also impeding expansion and management of terrestrial sequestration are other barriers, including policy uncertainty, liability risks, unfavorable property tax structures, incomplete and imperfect information, and remaining technical uncertainty.
Legal treatment of CO2 is not yet established, presenting policy uncertainty that inhibits capacity building in terrestrial sequestration.
At present, there is no formal liability structure for stored carbon (often referred to as the permanence or reversibility issue). Agreement on identifying liability for potential emissions from stored carbon could address this issue, potentially through a range of approaches, including an insurance or other system that could encourage market and landowner involvement by reducing risk in the market.
Current competing fiscal priorities,65 exemplified by some property tax laws, can distort incentives
64 In an efficiently functioning market, absent significant market failures or other imperfections, “high cost” is usually a market signal indicating a technology is not economically viable, due to the existence of low demand or less costly competitors or substitutes. The existence of high cost, identified here as a barrier to greater C&D, does not by itself suggest government intervention is necessary or advisable. In the case of GHG emissions, there currently exists no regulatory scheme to internalize external costs and benefits of rising atmospheric GHG concentrations and, hence, a market failure is known to exist and government intervention may be warranted. In the absence of an internalized market-valuing mechanism, however, the extent of that intervention remains unclear (see Box 1-1 in Chapter 1). 65 Existing fiscal policies, regulations, and statutes may be beneficial in a broad context of public policy, but often they compete with or conflict with the narrow objective of promoting

Terrestrial Sequestration January 2009
85
Federal Activities at Work in Terrestrial Sequestration
Conservation Reserve Program – promotes land-use changes, implemented through 10-15 year contracts, that provide carbon sequestration benefits, including shifting marginal croplands to long-term grass covers, forest land, and restored wetlands.
Terrestrial Carbon Sequestration to Benefit Fish & Wildlife – involves public/private partnerships to restore and enhance native forest and wildlife habitat on federal and privately owned lands.
Climate Change Bilateral Cooperation – include dialogue between nations leading to actions that combat climate change, including agriculture/forests, earth observation systems and carbon sequestration technologies.
faced by land owners. Land owners need clear consistent long-term messages from all levels of government and from markets to land management to reduce GHG emissions.
Optimal market conditions will also be limited by incomplete and imperfect information, as estimates of carbon sequestration are provided by a wide array of sources with varying degrees of reliability.
Additionally, a number of measurement and monitoring issues remain – particularly in the areas of measuring changes in soil carbon stocks at the field level, and accounting for potential trade-offs between CO2 and other GHGs (notably nitrous oxide emissions related to nitrogen fertilizer use). Significant methodological work is underway to address these technical risks, however.
Commercialization and Deployment Activities With the potential for terrestrial sequestration to mitigate GHG emissions without the significant infrastructure requirements associated with carbon capture and geologic storage, the C&D strategies include several measures to accelerate the adoption of technologies and practices for improved sequestration. These strategies include 37 Federal programs, policies and initiatives identified in Annex B that encourage deployment of terrestrial sequestration technologies and practices (Figure 4-7). About half of these activities are designed specifically to address barriers to terrestrial sequestration, with the other activities applicable to a wide range of technology areas. Figure 4-7 shows the types of policies and measures used by these activities. The most common type of measure is financial incentives to reduce the costs to landowners for improving sequestration capabilities; 12 programs identified in Annex B include financial incentives for employing practices that increase sequestration. Due to the readiness of the technology, the next four most common types all focus on spreading information – through collaborations, information programs, and education C&D of certain GHG-reducing technologies. As a result, while providing overall benefits to society these policies may be found to hinder investment in clean energy technologies (see Box 1-2 in Chapter 1).
efforts. About 11 Federal programs – such as the Conservation Reserve Program – directly coordinate with farmers and land owners to promote terrestrial sequestration, although many of these programs involve voluntary short-term contracts which do not guarantee permanent environmental benefits. Education and training are major components of nine of the identified Federal programs, such as the Rangeland, Pasture, and Forages National Program; similarly, nine programs include labeling and information dissemination efforts. These programs contribute to a portfolio of solutions addressing key barriers in this sector, as shown in Table 4-3. Several programs help offset the high costs associated with deploying terrestrial sequestration technologies and practices. These programs can also promote technologies and practices that allow landowners to recover costs through other benefits (such as improved crop yields or more productive forests). For instance, the USDA’s Grassland Reserve Program directs financial resources to help landowners protect and restore grasslands from conversion to cropland or other uses, although it does allow grazing. The Conservation Stewardship Program is implemented through five-year voluntary contracts and offers technical and financial assistance to help landowners to improve conservation measures on working lands.66 In
66 “Working lands include cropland, grassland, prairie land, improved pasture, and range land, as well as forested land that is an incidental part of an agriculture operation.” Clarification

Strategies for Commercialization and Deployment
86
addition, the Tropical Forestry Conservation Act works to improve sequestration activities in developing nations that are indebted to the United States by relieving debt in return for tropical forest conservation. External benefits associated with land conservation are ameliorated to some extent through numerous Federal programs, including DOI’s Terrestrial Carbon Sequestration to Benefit Fish & Wildlife. Through this program, companies support the planting of native hardwood trees in exchange for future carbon credits. Efforts to assist and train landowners, a primary focus of USDA’s Environmental Quality Incentives Program, help landowners overcome barriers related to the adoption of new or unfamiliar technologies and production practices. Volunteer programs for landowners, such as the Conservation of Private Grazing Land Initiative, also help address the lack of specialized knowledge through technical assistance and training activities specialized for natural resource conservation and terrestrial sequestration. from the Conservation Security Program Fact Sheet (USDA 2005).
The large fragmented industry structure is addressed through programs such as the Healthy Forests Reserve Program, which enrolls private landowners into conservation agreements that cumulatively impacts up to two million acres in the U.S. This is an especially useful measure as sequestration can require large amounts of land and small landowners have difficulty getting into the market. Potential Opportunities and Gaps Significant potential exists to expand terrestrial sequestration in the United States by facilitating a variety of low-cost land-based GHG mitigation opportunities in the forestry and agricultural sectors. The Federal portfolio includes measures that encourage deployment and adoption of terrestrial sequestration and improving technologies and practices. These measures are specifically addressing the need to reduce the costs and increase knowledge of technologies and practices to improve terrestrial sequestration. For cost reduction, many programs offset high costs and several policies address incremental or external costs born by those who adopt terrestrial sequestration improvements. Several of the identified programs provide education and training to increase specialized knowledge
Figure 4-7. Federal Policies to Reduce GHGs through Terrestrial Sequestration, by Type of Policy and Measure
12
9
9
8
7
5
2
1
0 2 4 6 8 10 12 14
Tax Policy and Other Financial Incentives
Labeling & Information Dissemination
Education, Training, and S&T Workforce Development
International Cooperation
Coalitions & Partnerships
Market Conditioning including Government Procurement
Technology Demonstration
Risk Mitigation
Number of Activities
12
9
9
8
7
5
2
1
0 2 4 6 8 10 12 14
Tax Policy and Other Financial Incentives
Labeling & Information Dissemination
Education, Training, and S&T Workforce Development
International Cooperation
Coalitions & Partnerships
Market Conditioning including Government Procurement
Technology Demonstration
Risk Mitigation
Number of Activities Source: CCTP/Energetics Deployment Inventory Database dated January 2009 Note: Some activities fit into more than one category, so the total count exceeds the total number of identified activities (37) listed in this area. The figure does not include activities that are authorized but not implemented. See Annex B for details.

Terrestrial Sequestration January 2009
87
among landowners – especially farmers, ranchers, and large landowners. With regard to the fragmented nature of the industry, the USDA has demonstrated that programs can be implemented that impact the behavior of the agriculture industry, which is made up of many small interests and is a subset of the terrestrial sequestration “industry,” although USDA is still working to demonstrate the link between behavioral changes and resulting environmental benefits.67 67 U.S. agriculture is composed of over 2 million farm enterprises, of which about 27 percent have annual sales less than $2,500 and about 56 percent have annual sales less than $10,000.
Deployment of these technologies and practices may still be hindered by the absence of clear prices for GHGs. Capturing external benefits of terrestrial sequestration could provide significant motivation. Improved techniques could reduce transaction costs for landowners and carbon-offset purchasers, increase the precision and accuracy of estimate of GHG benefits, and reduce uncertainties. Further development of decision support tools (like COMER-VR and COLE for cropland soil carbon and above-ground biomass in forest stands, respectively, in the DOE 1605(b) voluntary GHG registry program) would help landowners make informed decisions with the latest data available. Development of policy or technical methods to
Table 4-3. Select Federal Activities Addressing Key Technology Deployment Barriers: Terrestrial Sequestration
Solutions
Key Technology Deployment Barriers
Major Programs, Policies, or Initiatives*
Illustrative Deployment Activities
Most Critical Barriers:
High Costs 10 • Conservation Stewardship Program (USDA) • Grassland Reserve Program (USDA) • Tropical Forestry Conservation Act
External Benefits and Costs 8 • Conservation Reserve Program (USDA) • Terrestrial Carbon Sequestration to Benefit
Fish & Wildlife (DOI)
Lack of Specialized Knowledge 7
• Conservation of Private Grazing Land Initiative (USDA)
• Environmental Quality Incentives Program (USDA)
• Rangeland, Pasture, and Forages National Program (USDA)
Industry Structure 5 • Healthy Forests Reserve Program (USDA)
Other Important Barriers:
Incomplete and Imperfect Information 16 • Carbon Management Evaluation Tool – COMET-VR (USDA)
Policy Uncertainty 8 • Call to Establish a New Framework on GHG
Emissions (White House) • Climate Change Bilateral Cooperation (DOS)
Market Risks 5 • Soybean Promotion and Research Program (USDA)
Technical Risks 2 • Global Change National Program (USDA)
*Does not include activities that are authorized but not implemented. See Annex B for details.

Strategies for Commercialization and Deployment
88
address the reversibility and leakage issues regarding terrestrial offsets are feasible methods for reducing policy uncertainty and related market risks. Similarly, should independent carbon sequestration be implemented under EISA 2007, investment risks rising from uncertainty in carbon potentials and GHG fluxes may be reduced. Realizing the potential of terrestrial sequestration may require incentives that encourage adoption of carbon sequestering technologies and production practices across a fragmented industry as well as education and training to stimulate the creation of new technologies for making biobased products and bioenergy. It may also require greater coordination between terrestrial sequestration policies and those that seek to reduce emissions through energy supply and consumption sectors. The range of remaining deployment barriers and potential Federal roles warrant further consideration as the C&D strategies evolve to accommodate technologies and the market.
4.4 SUMMARY Even with the existing Federal programs, widespread deployment of CCS technologies remains a challenging goal. While technical risks and costs are being reduced via continued research, development, demonstration and financial incentives, external benefits remain a significant problem for the deployment of carbon capture and sequestration technologies. Except for a few limited instances of commercial use of CCS for enhanced oil and gas recovery in depleted wells and methane recovery in mines, there is little to no incentive to capture or attempt to store carbon. Further barriers to deployment of CCS technologies include the underdeveloped legal structure addressing long-term liability. Geologic storage and terrestrial sequestration markets will require a well-defined liability structure before they will be considered sound to investors. Carbon capture and geologic storage will also benefit from development of infrastructure, such as pipelines, to move carbon from major point sources into suitable geologies. In addition, these technologies do not have broad public knowledge and support, though outreach and education programs are currently underway to improve public awareness and assist in building a market. As demonstration projects are completed for
the fledging CCS industry, it should be reevaluated to ensure that federal programs and measures keep up with the changing needs of the future.

Chapter 5 January 2009
89
Chapter 5. Non-CO2 Greenhouse Gases
Reducing emissions of other GHGs, such as methane, nitrous oxide (N2O), and high global warming potential (GWP) industrial gases, such as hydrofluorocarbons (HFCs), perfluorocarbons (PFCs) and sulfur hexafluoride (SF6), affords significant near-term opportunities for addressing the underlying causes of climate change.68 Many of these GHGs have GWPs far higher than that of CO2. A diverse array of primary technologies, many of which are process-specific, can be deployed today to mitigate emissions of these gases. The bulk of current Federal deployment activities addressing barriers to non-CO2 GHG reduction encompass a wide range of voluntary programs; education, outreach, and information dissemination; public-private alliances and coalitions, including international partnerships; and tax policies and other financial incentives. Development of codes and standards, technology demonstrations, and legislation also are also playing a role (Figure 5-1). The following four sections describe how these Federal activities are designed to meet the particular deployment barriers faced by technologies that mitigate emissions of non-CO2 greenhouse gases.
5.1 METHANE FROM ENERGY AND WASTE
Methane emissions from the energy and waste sectors accounted for 31 percent of global non-CO2 GHG emissions, and nearly 50 percent of global methane 68 Chlorofluorocarbons (CFCs) and other related chemicals contribute to both global warming and stratospheric ozone depletion. Because ozone depleting substances (ODS) are already being phased out under the Montreal Protocol, they are not addressed in this report. ODS substitutes that are greenhouse gases (such as hydrofluorocarbons) are included in this report.
emissions in 2000. Major emission sources include coal mining, oil and natural gas systems, landfills, and wastewater treatment. Among the energy and waste-related methane sources, landfills and oil and gas systems are the largest, accounting for 11 and 15 percent respectively of global emissions. Most landfill methane emissions come from developed countries, where sanitary landfills facilitate the anaerobic decomposition of organic waste. Landfill methane emissions are expected to increase in developing nations and countries with economies in transition as solid waste is increasingly diverted to managed landfills (EPA 2006). In the United States, methane emissions from oil and gas systems represent the largest emission source, although these have decreased by about 12 percent since 1990. Landfill and coal mining emissions represent the second and third largest emissions sources respectively, and have also seen declines since 1990. Emissions from wastewater contribute the least, and have remained relatively stable during the time period, with only a slight increase. Looking across the key emission sources from the energy and waste sectors in the United States, methane emissions have declined by about 18 percent since 1990, equal to about 77 teragrams of carbon dioxide equivalent (Tg CO2 equivalent) through voluntary deployment of available, cost effective technologies (Table 5-1). Over the long term, the energy and waste sectors present some of the most promising and cost-effective near-term methane reduction opportunities. Reducing emissions of methane (the primary component in natural gas) can be cost-effective in many cases due to the market value of the recovered gas. In the oil and gas sector, cost-effective methane emission reduction technologies and practices already exist, but

Strategies for Commercialization and Deployment
90
there is still opportunity for their broader deployment. There is also opportunity for the increased development and use of leak detection and measurement systems. Long-term reductions in landfill gases will result from research on advanced utilization technologies and development and implementation of solid waste management alternatives. For coal mine emissions, advances in coal mine ventilation air methane (VAM) and new coalbed methane drilling techniques could help to reduce emissions. The C&D strategies for accelerating the deployment of technologies to reduce methane from energy and
waste sources combine market-based initiatives, voluntary assistance, and other programs to address the barriers that impede promising options from being adopted. These strategies recognize the need to engage various stakeholders in the public and private sectors, and are helping to build partnerships that enable more productive recovery and reduction of methane emissions. Technologies Suitable for Deployment The CCTP Strategic Plan (CCTP 2006) outlines some of the most promising GHG intensity-reducing concepts associated with reducing methane emissions from energy and waste. The
Federal strategy is focused on advancing the cost-effective recovery and utilization of methane emitted from the landfill, coal, oil, and gas industries. In the landfill sector, efforts to enhance landfill gas (LFG) recovery include bioreactor landfills that accelerate the decomposition of organic matter in the waste stream via enhanced microbiological processes. The first commercial full-scale anaerobic and aerobic bioreactor technology was operational in 2002. Advances in LFG utilization technology applications for smaller landfills include microturbines, Stirling engines and fuel cells, and larger scale applications
Figure 5-1. Federal Policies to Reduce Non-CO2 GHGs, by Type of Policy and Measure
24
23
18
13
10
8
7
4
2
2
0 5 10 15 20 25 30
Coalitions & Partnerships
Labeling & Information Dissemination
Education, Training, and S&T Workforce Development
Tax Policy and Other Financial Incentives
International Cooperation
Codes and Standards
Legislative Act of Regulation
Technology Demonstration
Risk Mitigation
Market Conditioning including Government Procurement
Number of Activities
24
23
18
13
10
8
7
4
2
2
0 5 10 15 20 25 30
Coalitions & Partnerships
Labeling & Information Dissemination
Education, Training, and S&T Workforce Development
Tax Policy and Other Financial Incentives
International Cooperation
Codes and Standards
Legislative Act of Regulation
Technology Demonstration
Risk Mitigation
Market Conditioning including Government Procurement
Number of Activities Source: CCTP/Energetics Deployment Inventory Database dated January 2009 Note: Some activities fit into more than one category, so the total count exceeds the total number of identified activities (63) listed in this area. The figure does not include activities that are authorized but not implemented. See Annex B for details.
Table 5-1. Change in U.S. Methane Emissions from Energy and Waste (Tg CO2 equivalent)
Source
1990 Emissions
2005 Emissions
% Change
Landfills 161.0 132.0 -18
Wastewater Treatment 24.8 25.4 +2
Coal Mining 81.9 52.4 -36
Natural Gas and Oil 158.9 139.6 -12
Total 426.6 349.4 -18
(Source: EPA 2007a)
Methane from Energy and Waste January 2009
91
Suitable Methane Reduction Technologies: Measurement and Recovery Examples
Landfill Gas – In recent years, bioreactor landfills have gained recognition as an innovation in solid-waste management. The National Energy Technology Lab funded a study of the Yolo County Pilot Bioreactor Landfill Demonstration to look for new ways to capture greenhouses gases from a bioreactor landfill. The results showed a tenfold increase in methane recovery and an associated reduction in time required for waste stabilization and composting of the landfill. (CCTP 2005)
Coal Mine Methane – Flow reversal reactors have been applied for oxidation of volatile organic pollutants and have been successfully tested at small scale with ventilation air methane. In addition, a field-scale thermal reactor has been tested in Australia and is currently being tested in West Virginia.
Methane Emissions from Oil and Gas Industry – Traditional leak measurement technologies are available. Advanced technologies, like the Hi-FlowTM Sampler, are in the deployment stage.
include alternative vehicle fuel conversion technology (e.g., biodiesel, liquid natural gas, methanol synthesis). Advances in coal mine VAM system technologies include flow reversal reactors, concentrators to increase the methane concentration to levels that will support oxidation, use as combustion air in small-scale reciprocating engines or mine-mouth power plants, and as a co-combustion medium with waste coal. The EPA is working with vendors to identify viable lean fuel turbines to improve their applicability for real-world VAM projects and identify sites and partners for field demonstration. Coal mine methane (CMM) recovery technologies include improved mine drainage systems through better directional drilling technologies, in-mine hydraulic fracturing techniques, and development of nitrogen and inert gas injection techniques. Approximately 90 percent of methane emissions from oil and gas are associated with natural gas systems. Advanced methane measurement and detection technologies include the GTI Hi-FlowTM Sampler which measures actual emission rates, hand held optical imaging cameras that can visualize methane leaks (e.g., Image Multi-Spectral Sensor, [IMSS] Camera), and promising remote sensing technologies
for quick and cost effective detection of fugitive methane emissions (such as from gas pipelines). Barriers to Deployment69 Multiple barriers prevent the deployment of methane-reducing technologies in the U.S. energy and waste sectors. Fluctuating energy prices can negatively impact investment in new technology and impede the infrastructure development that is required to deliver methane to energy markets. In some cases, complicated land ownership and mineral rights laws make it difficult for owners to capitalize on the recovery of methane.
Statutory uncertainty is created when there is variability among states as to the legal ownership of resources, land, and gas. For example, owners of coal, surface land, coal mine methane, and mineral rights may be different parties/entities, complicating negotiations for recovery of the gas and access to the land. In some cases, the issue of rights must be resolved through lawsuits.
Similarly, competing statutory priorities70 can inhibit deployment. The Supreme Court found that Federal coal leases granted under the 1909 and 1910 Coal Lands Acts did not include coal mine methane as part of the coal lease, impeding potential recovery. The result of these statues contributes to the uncertainty described above.
For some methane from energy and waste reduction technologies, high costs71 are an issue.
69 The existence of barriers and their identification in this report in no way implies it is the responsibility of the Federal government to address every (or any) barrier, in whole or in part. 70 Existing fiscal policies, regulations, and statutes may be beneficial in a broad context of public policy, but often they compete with or conflict with the narrow objective of promoting C&D of certain GHG-reducing technologies. As a result, while providing overall benefits to society these policies may be found to hinder investment in clean energy technologies (see Box 1-2 in Chapter 1). 71 In an efficiently functioning market, absent significant market failures or other imperfections, “high cost” is usually a market signal indicating a technology is not economically viable, due to the existence of low demand or less costly competitors or substitutes. The existence of high cost, identified here as a barrier to greater C&D, does not by itself suggest government intervention is necessary or advisable. In the case of GHG emissions, there currently exists no regulatory scheme to internalize external costs and benefits of rising atmospheric GHG concentrations and, hence, a market failure is known to exist and government intervention may be warranted. In the absence of an internalized market-valuing mechanism, however, the extent of that intervention remains unclear (see Box 1-1 in Chapter 1).

Strategies for Commercialization and Deployment
92
Federal Activities at Work to Reduce Methane Emissions from Energy and Waste
Coalbed Methane Outreach Program – targets the profitable recovery and use of coal mine methane, reducing methane emissions from mine ventilation air.
Natural Gas STAR Program – public-private partnership that encourages the identification and implementation of cost-effective methane emission reduction practices and technologies in the oil and gas sector.
Landfill Methane Outreach Program – promotes the capture and use of landfill gas as an energy source through a voluntary assistance and partnership program.
Liquefying natural gas, for example, is too costly for some operations, and even if profitable, limited capital is available for investment in high cost activities unless return on investment is very good.
Long-term purchase agreements with customers may be needed to stimulate investment in recovery systems; these can be difficult to negotiate. Market risks arise in obtaining secure, sustainable agreements for the sale or use of the recovered gases.
Technical risks can be an impediment as some of these technologies are not yet proven on a commercial scale or demonstrated in actual operation.
Cost-effective technologies may not be deployed because of incomplete and imperfect information; the energy and waste industries are not fully aware of the capabilities and benefits of these mitigation technologies, how they might be implemented, and their potentially attractive return on investment.
Infrastructure limitations can be a barrier to methane recovery because in many cases, there is no direct market for the gas or a pipeline nearby. Given the lack of infrastructure and access to market, flaring, venting or reinjection (in the oil and gas sector) may be the only viable options.
Another barrier to methane recovery is that methane may be a secondary issue in the operation from which it is emitted. In coal mines, for example, methane is vented from the mine workings because it is explosive. Mining companies have thus traditionally not viewed methane as an energy resource in its own right. Lack of public acceptance leading to community or local resistance to waste recovery operations may also pose a challenge in some cases, when concerns arise about impacts on local populations. For example, when recovered gas is expected to be coupled with an energy generation facility local residents may be resistant because of potential environmental impacts from combustion (not in my backyard). Or, concerns may arise about esthetic or other issues (bad aromas, additional truck traffic). Finally, the reduction of methane emissions from energy and waste has impacts that are external to the marketplace as they relate to GHG reduction; the inability to capture these external benefits for abatement (or bear external costs of emissions) inhibits progress in this sector.
Commercialization and Deployment Strategy The U.S. strategy to accelerate the deployment of technologies to mitigate methane emissions from energy and waste recognizes the potential value of methane as an energy resource. Utilizing methane produced from coal mining or landfills, for example, leads to a productive energy resource rather than a contribution to climate change. The C&D strategies also recognize the significant global warming potential of methane, and the need to pursue policies and programs that can make a real impact on mitigation. There are over 25 Federal programs, policies and initiatives identified in Annex B that encourage deployment of technologies and practices to reduce methane emissions from energy and waste (Figure 5-2). These activities address specific market barriers in this sector, with several programs designed expressly for reducing methane emissions from energy and waste. Federal actions focus on voluntary programs and public/private partnerships, such as the Natural Gas STAR Program – a voluntary partnership program between the EPA and the oil and natural gas industry. Ten programs identified have an information dissemination component. Included are multi-agency, international coalitions like the Methane to Markets Partnership. The current programs that make up the U.S. strategy in this area provide a portfolio of solutions for addressing the key barriers, as shown in Table 5-2. For example, high costs, market risks, and technical risks associated with introducing new technology in

Methane from Energy and Waste January 2009
93
the natural gas sector are mitigated through partnerships such as Methane to Markets, which provides information exchange and market supports to accelerate deployment. To address the statutory uncertainty related to ownership of coal mine methane, some states have adopted model legislation created by EPAct 1992. There are several Federal policies to address this issue nationwide, but these Federal actions can only partially address unique ownership issues that may involve Federal, State, local, and/or private owners.72 Incomplete and imperfect information is addressed by a number of activities identified in Annex B, including EPA’s Natural Gas STAR Program, which provides documents, tools, and resources for reducing methane emissions from oil and natural gas systems. Similar information-sharing programs are in place for the landfill and coal mining industries. The EPA Landfill Methane Outreach Program addresses incomplete information by providing data on
72 EPA’s newsletter, “Coalbed Methane Extra,” (EPA 2007b) provides a good discussion of the complex issues surrounding coal mine methane ownership.
available landfills, how to access it productively, and potential partnership opportunities. Infrastructure limitations that make it difficult to monetize captured methane emissions are addressed through partnerships that promote infrastructure development, including the Methane to Markets Partnership and the Global Gas Flaring Reduction Partnership. Potential Opportunities and Gaps The energy and waste sectors offer some of the most promising near-term and cost-effective opportunities for the reduction of methane emissions. Numerous approaches have already been successfully deployed that reduce emissions while utilizing captured methane in the marketplace. The Federal government is helping industry capitalize on these opportunities by supporting a diverse set of programs, policies and initiatives geared toward deploying currently available technologies and practices to reduce methane emissions. Many are directed toward improving gaps in incomplete and imperfect information. Several activities involve international collaborations, which allow coordinated global efforts
Figure 5-2. Federal Policies to Reduce GHGs of Methane Emissions from Energy and Waste, by Type of Policy and Measure
10
9
7
7
3
2
1
1
1
0 2 4 6 8 10 12
Labeling & Information Dissemination
International Cooperation
Coalitions & Partnerships
Education, Training, and S&T Workforce Development
Tax Policy and Other Financial Incentives
Legislative Act of Regulation
Risk Mitigation
Technology Demonstration
Market Conditioning including Government Procurement
Number of Activities
10
9
7
7
3
2
1
1
1
0 2 4 6 8 10 12
Labeling & Information Dissemination
International Cooperation
Coalitions & Partnerships
Education, Training, and S&T Workforce Development
Tax Policy and Other Financial Incentives
Legislative Act of Regulation
Risk Mitigation
Technology Demonstration
Market Conditioning including Government Procurement
Number of Activities Source: CCTP/Energetics Deployment Inventory Database dated January 2009 Note: Some activities fit into more than one category, so the total count exceeds the total number of identified activities (26) listed in this area. The figure does not include activities that are authorized but not implemented. See Annex B for details.

Strategies for Commercialization and Deployment
94
to deploy new technology and information sharing on research and development worldwide. Nonetheless, key barriers to further deployment such as incomplete information, lack of infrastructure, and high market and technical risks still remain. Widely fluctuating energy prices create uncertainty and impede investment in the necessary infrastructure for effective methane-recovery. Unclear legal ownership of resources, land, and gas creates additional barriers to deployment. Unless deployment activities can effectively address these issues, a number of near-term opportunities may be unrealized, such as deployment of the advanced technologies and practices that are under development today (e.g., advanced drilling and recovery, leak detection, bioreactor landfills).
5.2 METHANE AND NITROUS OXIDE EMISSIONS FROM AGRICULTURE
Globally, agricultural sources of methane and nitrous oxide contribute an estimated 5,729 Tg CO2 equivalent, and account for nearly 60 percent of global non-CO2 emissions (EPA 2006). The sources of global agricultural emissions are nitrous oxide (N2O) and methane (CH4) from crop and livestock production, which includes enteric fermentation (methane) from ruminant livestock and N2O and methane from manure. Rice production accounts for a small amount of methane emissions. In the United States in 2000, over 45 percent of total non-CO2 GHGs came from N2O and methane emissions from agriculture. Crop and livestock production account for most of these emissions, as illustrated in Figure 5-3. These emissions, however, cannot be entirely eliminated, although they can be reduced.
Table 5-2. Select Federal Activities Addressing Key Technology Deployment Barriers: Methane Emissions from Energy and Waste
Solutions Key Technology Deployment
Barriers Major Programs,
Policies, or Initiatives*
Illustrative Deployment Activities
Most Critical Barriers:
Incomplete and Imperfect Information 16
• Coalbed Methane Outreach Program (EPA) • Landfill Methane Outreach Program (EPA) • Methane to Markets Partnership (EPA) • Natural Gas STAR Program (EPA)
Infrastructure Limitations 4 • Global Gas Flaring Reduction Partnership • Landfill Methane Outreach Program (EPA) • Methane to Markets Partnership (EPA)
High Costs 3 • Methane to Markets Partnership (EPA)
Market Risks 3 • Methane to Markets Partnership (EPA)
Technical Risks 3 • Landfill Bioreactor Performance Assessment (EPA)
Statutory Uncertainty 3 • Ownership of Coalbed Methane (DOI)
*Does not include activities that are authorized but not implemented. See Annex B for details.
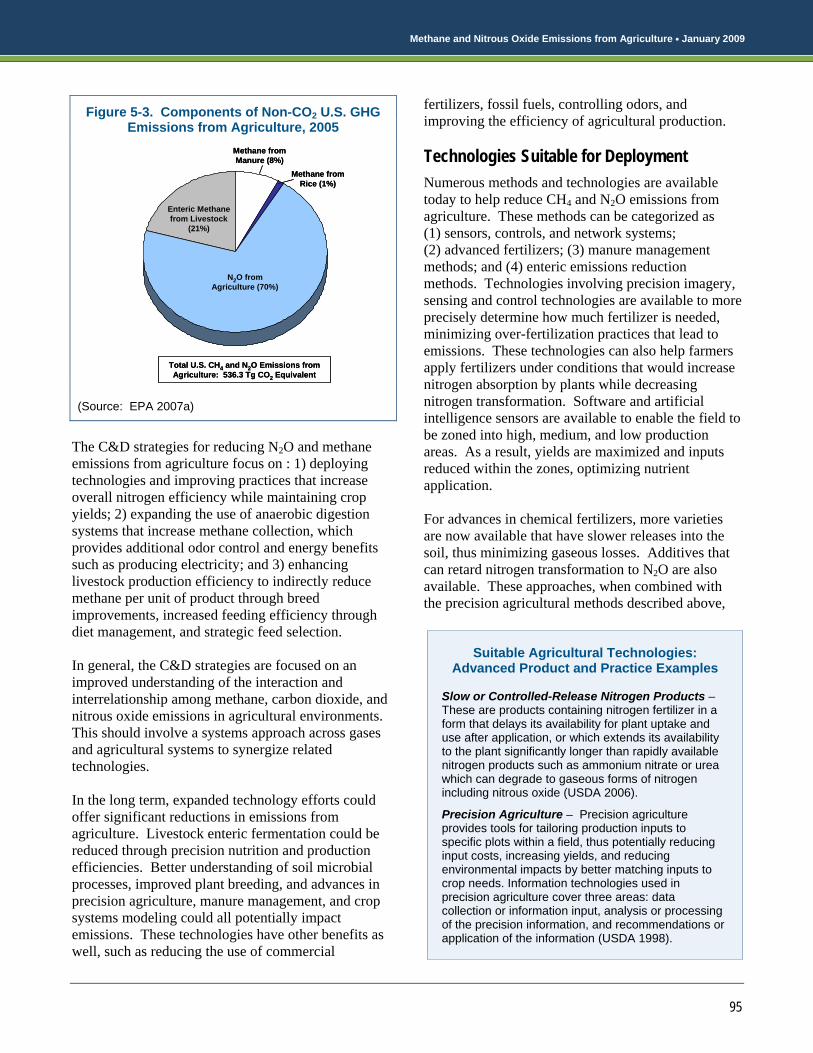
Methane and Nitrous Oxide Emissions from Agriculture January 2009
95
Suitable Agricultural Technologies: Advanced Product and Practice Examples
Slow or Controlled-Release Nitrogen Products – These are products containing nitrogen fertilizer in a form that delays its availability for plant uptake and use after application, or which extends its availability to the plant significantly longer than rapidly available nitrogen products such as ammonium nitrate or urea which can degrade to gaseous forms of nitrogen including nitrous oxide (USDA 2006).
Precision Agriculture – Precision agriculture provides tools for tailoring production inputs to specific plots within a field, thus potentially reducing input costs, increasing yields, and reducing environmental impacts by better matching inputs to crop needs. Information technologies used in precision agriculture cover three areas: data collection or information input, analysis or processing of the precision information, and recommendations or application of the information (USDA 1998).
The C&D strategies for reducing N2O and methane emissions from agriculture focus on : 1) deploying technologies and improving practices that increase overall nitrogen efficiency while maintaining crop yields; 2) expanding the use of anaerobic digestion systems that increase methane collection, which provides additional odor control and energy benefits such as producing electricity; and 3) enhancing livestock production efficiency to indirectly reduce methane per unit of product through breed improvements, increased feeding efficiency through diet management, and strategic feed selection. In general, the C&D strategies are focused on an improved understanding of the interaction and interrelationship among methane, carbon dioxide, and nitrous oxide emissions in agricultural environments. This should involve a systems approach across gases and agricultural systems to synergize related technologies. In the long term, expanded technology efforts could offer significant reductions in emissions from agriculture. Livestock enteric fermentation could be reduced through precision nutrition and production efficiencies. Better understanding of soil microbial processes, improved plant breeding, and advances in precision agriculture, manure management, and crop systems modeling could all potentially impact emissions. These technologies have other benefits as well, such as reducing the use of commercial
fertilizers, fossil fuels, controlling odors, and improving the efficiency of agricultural production. Technologies Suitable for Deployment Numerous methods and technologies are available today to help reduce CH4 and N2O emissions from agriculture. These methods can be categorized as (1) sensors, controls, and network systems; (2) advanced fertilizers; (3) manure management methods; and (4) enteric emissions reduction methods. Technologies involving precision imagery, sensing and control technologies are available to more precisely determine how much fertilizer is needed, minimizing over-fertilization practices that lead to emissions. These technologies can also help farmers apply fertilizers under conditions that would increase nitrogen absorption by plants while decreasing nitrogen transformation. Software and artificial intelligence sensors are available to enable the field to be zoned into high, medium, and low production areas. As a result, yields are maximized and inputs reduced within the zones, optimizing nutrient application. For advances in chemical fertilizers, more varieties are now available that have slower releases into the soil, thus minimizing gaseous losses. Additives that can retard nitrogen transformation to N2O are also available. These approaches, when combined with the precision agricultural methods described above,
Figure 5-3. Components of Non-CO2 U.S. GHG Emissions from Agriculture, 2005
Total U.S. CH4 and N2O Emissions from Agriculture: 536.3 Tg CO2 Equivalent
Enteric Methane from Livestock
(21%)
Methane from Manure (8%)
Methane from Rice (1%)
N2O from Agriculture (70%)
Total U.S. CH4 and N2O Emissions from Agriculture: 536.3 Tg CO2 Equivalent
Enteric Methane from Livestock
(21%)
Methane from Manure (8%)
Methane from Rice (1%)
N2O from Agriculture (70%)
(Source: EPA 2007a)

Strategies for Commercialization and Deployment
96
Federal Activities at Work in Methane and Nitrous Oxide Emissions from
Agriculture Natural Resources Conservation Service – helps people employ agricultural systems that can reduce methane and nitrous oxide emissions, among other benefits.
AgSTAR Program – provides outreach programs designed to reduce methane emissions from livestock waste by promoting the use of biogas recovery systems.
Methane to Markets Partnership – promotes advanced methane recovery and use projects through public-private partnerships in agriculture and other sectors.
can be used together to increase efficiency in agricultural practices, potentially reducing N2O emissions. Replacing conventional waste management systems, such as surface impoundments and manure storages with anaerobic treatment and gas recovery systems, commonly called anaerobic digesters can reduce methane emissions from manures handled as liquid, slurries, and semi-solids. Methane produced from these types of manure handling methods can be reduced by digester technologies, similar to those used for primary treatment at domestic wastewater treatment plants. These are biological processes that stabilize organic materials and occur under controlled conditions and collect the off-gases produced, mostly methane, which can later be used as a fuel to produce electricity, heat, or fuel. Methane from enteric fermentation is also being minimized through better feed and forage management, which can increase the digestibility and reduce residence digestion time in the rumen. Management practices that increase the calving percentages, birth and weaning weights and daily weight gain of growing animals, along with reducing the calving interval will also contribute to lower enteric emissions. Methods include using improved feed grains and forage, increased surface area of the feeds, addition of fiber sources, treatment of the feeds/forages to increase digestibility, and appropriate use of concentrated supplements. Precision agriculture technologies also improve forage and feedstuffs production efficiencies and increase digestibility. Remote and field-deployed
sensors/monitors and information management systems can improve animal production efficiency by monitoring forage, crops, soils, and water. Additionally, new fencing technologies allowing for optimal forage production and utilization can be deployed. New software tools are also being designed that allow producers to evaluate the effects of various management changes on production and GHG emissions before adopting the actual practices. Barriers to Deployment73 The high costs of technology investment in a low margin industry, getting information out to the widely dispersed farming community, and the lack of specialized knowledge necessary to implement energy-related technology all constitute significant barriers in this sector.
High costs74 are a significant barrier, depending on the application and market or regional issues. A technology might be cost-effective in some applications (e.g., regions where electricity is expensive) but not others. The economics for methane recovery from livestock and poultry are more challenging than in the landfill or oil and gas sector, where it is already practiced. Methane recovery is also not a core component of the agricultural business model. Building a digester and energy generation system usually requires considerable capital and might not be feasible for smaller operations. In some cases (e.g., precision agriculture), initial high investment costs must be absorbed by the farming operation prior to any financial benefit from use, which can be challenging for smaller farms in particular (Colorado 2005).
73 The existence of barriers and their identification in this report in no way implies it is the responsibility of the Federal government to address every (or any) barrier, in whole or in part. 74 In an efficiently functioning market, absent significant market failures or other imperfections, “high cost” is usually a market signal indicating a technology is not economically viable, due to the existence of low demand or less costly competitors or substitutes. The existence of high cost, identified here as a barrier to greater C&D, does not by itself suggest government intervention is necessary or advisable. In the case of GHG emissions, there currently exists no regulatory scheme to internalize external costs and benefits of rising atmospheric GHG concentrations and, hence, a market failure is known to exist and government intervention may be warranted. In the absence of an internalized market-valuing mechanism, however, the extent of that intervention remains unclear (see Box 1-1 in Chapter 1).

Methane and Nitrous Oxide Emissions from Agriculture January 2009
97
Incomplete and imperfect information is one of the most pervasive barriers to deployment of GHG-reducing technologies in this sector. The community is fragmented, which contributes to poor information flow. There is a lack of awareness of new technologies that could be deployed that could reduce nitrogen emissions, and the energy, economic, environmental, or other benefits are not clearly communicated and understood. Imperfect information also results from poor records management by producers, which can result in missed opportunities to improve livestock productivity and decrease GHG emissions.
Lack of specialized knowledge is an issue for methane recovery in agriculture. Operators lack specialized knowledge, including training and technical expertise in methane reduction and/or recovery systems and practices, which are outside of most core agricultural production competencies. Farmers and ranchers may require outside technical expertise to design and install methane recovery systems. The same is true for precision agriculture, where the farmer must undergo training to use the tools, and then understand how to interpret the data consistently and apply it.
Difficulty with accurately measuring and accounting for emission reductions in the agriculture sector poses technical risks that inhibit deployment of new technologies in this sector. Measurement and monitoring (M&M) systems are necessary to complement these technologies to assess their efficacy and properly value the benefits of using these technologies in regions or states where GHG emissions are restricted. This is particularly challenging for enteric fermentation and soil N2O reductions because accurate measurement approaches are difficult, expensive, or require frequent and large sample sizes due to high variability in measurement results.
Market Risks are an obstacle to reducing GHG emissions from agriculture. An example would be that beef consumers may be reluctant to purchase grass fed beef vs. feedlot finished beef because of price differences and therefore no clearly provided benefit (Koneswaran and Nierenberg 2008). Downstream consumer preferences, as in this example, can impact the incentives for agriculture to utilize methane reducing practices.
The structure of the agricultural community, which is comprised of many thousands of autonomous farmers and ranchers, also constitutes a barrier to technological change in general as it contributes to critical barriers of higher risks, incomplete information, and lack of specialized knowledge. The fragmented agricultural market is not sufficiently informed of the technologies and practices that could reduce emissions. Additionally, agricultural practices which reduce or recover methane and nitrous oxide emissions have impacts that are external to the marketplace as they relate to GHG reduction; the inability to capture these external benefits for abatement (or bear external costs of emissions) inhibits progress in this sector. Commercialization and Deployment Strategy Many Federal programs, policies, and initiatives are currently underway that encourage deployment of technologies and practices to reduce methane and nitrous oxide emissions from agriculture (see Figure 5-4 and Annex B). Federal actions focus on voluntary programs that partner with farmers and land owners. Five programs identified in Annex B include an education component to provide land-users with training on technologies and practices such as precision agriculture and cropping system models. Several Federal activities have an international scope, reflecting the opportunities worldwide for deployment of technologies and practices in this sector. These programs provide an array of solutions that address key barriers in this sector, as shown in Table 5-3. Section 9007 of the 2008 Farm Bill (Rural Energy for America) has provided the majority of cost share funding over the past five years, followed by state programs, to expand the use of anaerobic digestion at farms and promote rural renewable energy development in this sector. EPA’s AgSTAR program is an outreach and extension program that has been active in the promotion of anaerobic digestion technologies since the early 1990’s. The program has in the past developed commercial scale farm systems as demonstration sites for the livestock industry and now provides general and technical information on anaerobic digesters, as well as project development tools to expand deployment rates and reduce investment risk. The USDA coordinates with the AgSTAR program in implementing Section 9007. The Environmental Quality Incentives Program helps stimulate investment and overcome high costs by

Strategies for Commercialization and Deployment
98
offering financial (up to 75 percent cost-share) and technical help to assist participants install or implement structural and management practices on eligible agricultural land. Imperfect information about new methane- and nitrous oxide-reducing technologies in this sector is being addressed by various programs including USDA’s Global Change National Program and EPA’s AgSTAR program. Organizations such as the Natural Resources Conservation Service address the lack of specialized knowledge through numerous technical assistance programs that promote resource-efficient agricultural production. Potential Opportunities and Gaps Agriculture, including both crop and livestock production, is a major contributor to non-CO2 GHG emissions in the U.S. and globally. Advanced technologies and practices offer viable options to reduce methane and nitrous oxide emissions from agriculture, and many are already in use today. The Federal government is supporting programs to encourage more efficient technologies and practices in this sector that focus on education, training, and outreach. These activities tackle multiple areas, including soil management, manure management, and livestock enteric fermentation. U.S. livestock
populations are growing to meet increasing demands for livestock products in developing countries. As a result increases in agricultural emissions as well as surface water pollution events are likely. Introducing emission control practices such as anaerobic digesters into these areas early on presents an opportunity for large emissions reductions and other pollution control options, which are currently being implemented by the Methane to Markets Partnership. Critical barriers of high costs and risks associated with new investments, imperfect information, and the lack of specialized knowledge are inhibiting widespread deployment of new technologies that can reduce CH4 and N2O emissions from agriculture. Additionally, the inability to recover the external benefits or reducing methane and nitrous oxide emissions also inhibit technology adoption. In the future, adoption of innovative or revolutionary agricultural technologies will be needed to stimulate change in this widely fractionated and diverse sector.
Figure 5-4. Federal Policies to Reduce GHGs of Methane and Nitrous Oxide Emissions from Agriculture, by Type of Policy and Measure
7
6
5
4
2
1
1
0 1 2 3 4 5 6 7 8
Tax Policy and Other FinancialIncentives
International Cooperation
Education, Training, and S&TWorkforce Development
Labeling & InformationDissemination
Risk Mitigation
Market Conditioning includingGovernment Procurement
Coalitions & Partnerships
Number of Activities
7
6
5
4
2
1
1
0 1 2 3 4 5 6 7 8
Tax Policy and Other FinancialIncentives
International Cooperation
Education, Training, and S&TWorkforce Development
Labeling & InformationDissemination
Risk Mitigation
Market Conditioning includingGovernment Procurement
Coalitions & Partnerships
Number of Activities Source: CCTP/Energetics Deployment Inventory Database dated January 2009 Note: Some activities fit into more than one category, so the total count exceeds the total number of identified activities (18) listed in this area. The figure does not include activities that are authorized but not implemented. See Annex B for details.

Emissions of High Global-Warming Potential Gases January 2009
99
5.3 EMISSIONS OF HIGH GLOBAL-WARMING POTENTIAL GASES
High-GWP gases such as hydrofluorocarbons (HFCs), perfluorocarbons (PFCs), and sulfur hexafluoride (SF6) are very strong global warming agents, commonly hundreds to thousands of times more potent than CO2. These synthetic gases represent about four percent of global (2000) and 14 percent of U.S. (2006) non-CO2 emissions, but are expected to increase significantly worldwide due to growing demand for refrigeration and air conditioning and the industrialization of developing economies (EPA 2006, 2008). Emissions of high-GWP gases result from both their direct use and as unintentional byproducts. The gases are used by a range of industries, each with its own unique technical requirement for performance and safety. In addition, PFCs and HFC-23 emissions result as a byproduct of
primary aluminum and HCFC-22 production respectively. Figure 5-5 illustrates the primary sources of U.S. high GWP greenhouse gas emissions, which fall into two broad categories, each with different R&D priorities and deployment barriers. High-GWP gases used as substitutes for ozone-depleting substances (ODS) are a growing emissions source in the United States and globally. These high-GWP gases are being used as replacements for chemicals (like CFCs) that deplete the stratospheric ozone layer. One class of chemical for ODS substitution is: hydrofluorocarbons (HFCs). While HFCs do not deplete the ozone layer, they are potent GHGs. Figure 5-5 illustrates the emissions from all ODS applications. It should be noted, however, that the ODS being replaced are also potent greenhouse gases and that in many applications their
Table 5-3. Select Federal Activities Addressing Key Technology Deployment Barriers: Methane and Nitrous Oxide Emissions from Agriculture
Solutions Key Technology Deployment
Barriers Major Programs,
Policies, or Initiatives*
Illustrative Deployment Activities
Most Critical Barriers:
Incomplete and Imperfect Information 8
• AgSTAR Program (EPA, DOE, USDA) • Global Change National Program (USDA) • Methane to Markets Partnership (EPA)
High Costs 6 • Environmental Quality Incentives Program
(USDA) • Rural Energy for America (USDA)
Lack of Specialized Knowledge 4 • AgSTAR Program (EPA, DOE, USDA) • Methane to Markets Partnership (EPA)
Market Risks 5 • Methane to Markets Partnership (EPA)
Technical Risks 2 • Global Change National Program (USDA)
Other Important Barriers:
External Benefits and Costs 3 • Environmental Quality Incentives Program (USDA)
Industry Structure 2 • Conservation Reserve Program (USDA)
*Does not include activities that are authorized but not implemented. See Annex B for details.

Strategies for Commercialization and Deployment
100
replacements are non-greenhouse gas substitutes such as hydrocarbons.75 High-GWP gases are also generally used in industrial applications where they are critical to highly complex manufacturing processes and provide safety and system reliability. High-GWP gases are also emitted as byproducts from the manufacture of refrigerants (HCFC-22) and from the production of primary aluminum. In the near-term, development of safe, high-performing, cost-effective climate protection technologies could reduce the emission of high GWP gases by 40 percent, and more dramatic reductions are possible within a few decades including the elimination of some high-GWP gas emissions by key industries. Improved technologies will be needed to enable these long-term emission reductions. Emerging technologies include environmentally friendly alternative cover gases to replace SF6 for magnesium melt protection, improved process controls to reduce PFC emissions from aluminum smelting, the use of molecular fluorine (F2) to replace SF6 and PFCs in chemical vapor deposition chamber
75 Ozone-depleting substances are already being phased out under the Montreal Protocol, and so they are not addressed in this report. ODS substitutes that are greenhouse gases (such as hydrofluorocarbons) are included in this report.
cleaning and plasma etching processes, and alternatives to the use of SF6 in high-voltage electric equipment. The CCTP Strategic Plan (CCTP 2006) outlines some of the most promising GHG intensity-reducing concepts associated with high-GWP gases. The C&D strategies for mitigating the production of high GWP gases reflect the diversity of the sources (mostly industrial) and the fact that solutions and technologies are highly specific to the application. While broad-based policies and programs may be effective in some cases, mitigation of some sources will require solutions that are tailored for an individual industry. These solutions may also require turnover of capital assets that have not reached the end of their useful life, and represent a prohibitive expense to the industry.
Technologies Suitable for Deployment Numerous domestic technologies are available that are suitable for immediate deployment, although the degree of their commercialization varies. For instance, low-GHG approaches to supermarket refrigeration and motor vehicle air conditioning show particular promise. In addition, five industry areas have technologies that can reduce emissions of high-GWP gases: (1) Semiconductors: process optimizations, alternative chemicals, and advanced abatement; (2) Magnesium: SF6 capture/recycle and alternative chemicals; (3) Aluminum: process optimization to reduce anode effects and resulting PFC emissions; (4) Electric Power Systems: advanced leak detection and repair; and (5) HCFC-22 Producers: process optimization and abatement technologies. For example, newly developed electrically heated catalysts can oxidize high-GWP gases in the semiconductor industry before they are emitted. Also, the magnesium industry is conducting full scale demonstrations and byproduct emissions measurement studies of climate-friendly alternative cover gas technologies with early results promising greater than 95 percent GHG emission reductions as compared to traditional SF6-based technology. Many
Figure 5-5. High-GWP Gas Emissions in the U.S. by Source (Tg CO2 Equivalents)
0
20
40
60
80
100
120
140
1990 1995 2000 2005
ODS Substitutes
HCFC-22 Production
Electrical Transmission/Distribution
Semiconductor Manufacture
Aluminum Production
Magnesium Production/Processing
TgC
O2
equi
vale
nt
0
20
40
60
80
100
120
140
1990 1995 2000 2005
ODS Substitutes
HCFC-22 Production
Electrical Transmission/Distribution
Semiconductor Manufacture
Aluminum Production
Magnesium Production/Processing
TgC
O2
equi
vale
nt
ODS Substitutes
HCFC-22 Production
Electrical Transmission/Distribution
Semiconductor Manufacture
Aluminum Production
Magnesium Production/Processing
ODS Substitutes
HCFC-22 Production
Electrical Transmission/Distribution
Semiconductor Manufacture
Aluminum Production
Magnesium Production/Processing
TgC
O2
equi
vale
nt
(Source: EPA 2007a)
Emissions of High Global-Warming Potential Gases January 2009
101
Suitable High GWP Reducing Technologies: Refrigeration and Air Conditioning
Examples Supermarket Refrigeration – Technologies under development include distributed refrigeration, which reduces the need for excessive refrigerant piping (and hence emissions), and secondary-loop refrigeration, which segregates refrigerant-containing equipment to a separate central location while using a benign fluid to transfer heat from food display cases.
Motor Vehicle Air Conditioning – R&D is underway to commercialize low-GWP refrigerants, mainly CO2 (GWP=1) and HFC-152a (GWP=120). These have been tested with some success in full-scale vehicles and are being used to replace CFC-12, an ozone depleting substance with a GWP of 8500.
technologies have been developed recently that could reduce or eliminate the use of high-GWP gases and thus have the potential to reduce a significant amount of domestic GHG emissions; however, numerous barriers prevent their full deployment. Barriers to Deployment76 Although these technologies show promise and have demonstrated performance through testing of full or near-full scale prototypes, their widespread penetration can be hindered by numerous barriers. To reduce emissions of high-GWP gases, three strategies are generally proposed: 1) use of alternative substances, 2) process design to avoid the emission, and 3) abatement or control once emitted or to prevent emission. The deployment challenges are highly specific to the technology and industry where they will be applied, and to the strategy employed. In some cases, climate protection strategies may produce cost savings and accelerate rather than inhibit the deployment of the technology. For example, when electric utilities successfully identify and repair SF6 leaks from high voltage transmission equipment, cost savings are realized. In other cases, however, such as in the installation of PFC abatement devices, the technology deployment adds to the cost of production and is less attractive.
76 The existence of barriers and their identification in this report in no way implies it is the responsibility of the Federal government to address every (or any) barrier, in whole or in part.
High costs77 are a crosscutting deployment barrier: if the alternative gases and technologies were less expensive, GHG replacement would be occurring more rapidly. Some of the incremental costs are required for risk mitigation: for example, the high-concentration effects of CO2 and the flammability of HFC-152a necessitate additional safety engineering to allow use of these alternative refrigerants. In addition, technologies that involve changeover and slow-down of manufacturing processes can result in revenue losses.
It is difficult to change industry practices when the primary benefit – the reduction of high-GWP gases – is a social good that may not generate any return on investment to the manufacturer. These external benefits and costs do not provide any incentive for industry to innovate, because investing in process improvements that reduce GHG emissions may not lead to greater profits. However, as noted, climate technology strategies in some cases may produce cost benefits to the technology user.
Incomplete and imperfect information presents a key barrier to the deployment of new technologies in this sector. Familiarity with the performance and availability of substitutes for high-GWP gases, and ways to reduce GHG emissions from agriculture and from industrial combustion is often lacking. Information collection consumes time and resources, especially for small firms, and many industries prefer to expend their human and financial capital on other investment priorities. Converting to new practices using substitutes for high-GWP gases requires firms to invest heavily in health and safety analysis to protect against substitute gases that are often more toxic.
Similarly, deployment is hindered by a lack of specialized knowledge. In many industries, there are no simple drop-in substitutes for the high-GWP gases. Some are more toxic or may produce toxic
77 In an efficiently functioning market, absent significant market failures or other imperfections, “high cost” is usually a market signal indicating a technology is not economically viable, due to the existence of low demand or less costly competitors or substitutes. The existence of high cost, identified here as a barrier to greater C&D, does not by itself suggest government intervention is necessary or advisable. In the case of GHG emissions, there currently exists no regulatory scheme to internalize external costs and benefits of rising atmospheric GHG concentrations and, hence, a market failure is known to exist and government intervention may be warranted. In the absence of an internalized market-valuing mechanism, however, the extent of that intervention remains unclear (see Box 1-1 in Chapter 1).

Strategies for Commercialization and Deployment
102
Federal Activities at Work in High-GWP Gases
SF6 Emission Reduction Partnership for Electric Power Systems – provides voluntary industry programs aimed at reducing SF6 emissions via cost-effective technologies and practices to meet high voltage insulating needs.
Significant New Alternatives Policy (SNAP) – evaluates and regulates substitutes for ozone-depleting substances being phased out under the stratospheric ozone protection provisions of the Clean Air Act. Global Warming Potential is one of many criteria considered in determining acceptable alternatives to ozone-depleting substances.
Mobile Air Conditioning Climate Protection Partnership – promotes next-generation vehicle air conditioning systems and the development of cost-effective designs and improved service procedures to minimize refrigerant emissions from vehicles.
byproducts resulting in health and safety issues; others require thermal abatement and the collection of off-gases from exhausts. A high level of workforce knowledge is required to master the safe and effective use of these substitutes.
Other barriers include market risks from global competition and patent practices that are determined to be anti-competitive. The migration and globalization pressures on some of the industries (for example, aluminum) that use and/or emit high-GWP gases making it difficult for companies to undertake the significant facility upgrades necessary to eliminate emissions.
Commercialization and Deployment Strategy The U.S. strategies for mitigating emissions of high GWP gases reflect a mix of broad-based policies and programs as well as application-specific activities. A key component of the C&D strategies is to address the high costs and market risks associated with changing industrial processes. The strategies recognize that promoting industry-wide changes may require close cooperation and buy-in from stakeholders along the supply chain. This is being accomplished in some cases through government/industry partnerships that encourage collaboration and universal adoption of cost-effective technology solutions.
Twenty-seven Federal programs, policies and initiatives identified in Annex B encourage deployment of technologies and practices to reduce emissions of high global-warming potential gases (Figure 5-6). Included are activities that address high-GWP gases as part of a complementary strategy to improve air quality, reduce ozone-depleting substances, or reduce CO2 or other GHGs. Eleven programs in Annex B contain components specifically designed for reducing emissions of high-GWP gases. These activities include public/private partnerships tailored for particular industries and gases, such as perfluorocarbons (PFCs) and sulfur hexafluoride (SF6). Several industry-specific Federal activities promote voluntary reductions for the semiconductor, electric power systems, aluminum, and magnesium industries. Government/industry partnerships, which provide forums for partners to share strategies for reducing or eliminating emissions, are important components of the PAMs portfolio. Several other programs implement codes and
standards, including programs to reduce ozone-depleting substances that are also high-GWP gases.
As a whole, these programs provide a portfolio of opportunities that deal with key barriers in this sector, as shown in Table 5-4. For example, the barrier of incomplete and imperfect information is addressed by a host of far-reaching programs disseminating performance information on technologies that reduce high-GWP gases, including the Asia-Pacific Partnership on Clean Development and Climate. The lack of specialized knowledge in this sector is addressed by a number of partnership activities, such as the EPA’s Voluntary Aluminum Industrial Partnership, which helps partners evaluate the factors that influence the generation of PFCs.
Voluntary public-private partnerships have at times catalyzed climate protection strategies that also improve the industry’s productivity or process efficiency. EPA’s family of partnerships with the high-GWP emitting industries strives to identify new technologies and process improvements that not only reduce emissions of high-GWP gases but also improve production efficiency, thereby saving money. To illustrate, the Mobile Air Conditioning Climate Protection Partnership helps to reduce high costs by working closely with industry to develop cost-effective designs and improved service procedures.
The Significant New Alternatives Policy (SNAP) Program evaluates and regulates substitutes for

Nitrous Oxide Emissions from Combustion and Industrial Sources January 2009
103
ozone-depleting chemicals being phased out under the Clean Air Act (CAA). SNAP addresses the issue of external benefits and costs by providing a safe, smooth transition away from ozone-depleting compounds, identifying substitutes that offer lower overall risks to human health and the environment. Companies have in fact achieved significant economic benefits from the sale of these non-ODS alternatives and related equipment.
Potential Opportunities and Gaps High-GWP gases constitute a growing source of GHG emissions worldwide. Significant opportunities currently exist to reduce, manage, and possibly eliminate emissions of some high-GWP gases. Federal programs, policies and initiatives are currently underway to capitalize on many of these opportunities with the deployment of safe, high-performing, and cost-effective technologies. The Federal portfolio features public/private partnerships in targeted industries that are specially designed to reduce or eliminate high-GWP gas emissions.
While these and other Federal activities are successfully helping to encourage deployment of climate protection technologies, some key barriers to further market penetration still exist. These remaining
barriers include high costs and the inability to capture external benefits as well as lack of information and specialized knowledge required to deploy substitutes for high GWP gases. Broader industry concerns like market risks for companies facing stiff price competition and patent practices that are determined to be anti-competitive may increase uncertainty and slow deployment going forward. Evaluation of existing Federal policies and their impacts in these areas is recommended. In the future, as new and more advanced technologies reach their potential, Federal policies may need to evolve accordingly.
5.4 NITROUS OXIDE EMISSIONS FROM COMBUSTION AND INDUSTRIAL SOURCES
Globally, stationary and mobile source combustion and industrial production of acids accounted for about four percent of global non-CO2 emissions in 2000, or about 390 Tg CO2 equivalent (EPA 2006). Stationary sources include steam boilers and other systems used for power and heat production; mobile sources include primarily transportation systems (e.g., trucks, cars, buses, trains, ships). Combustion of fossil fuels by mobile and stationary sources is the largest non-
Figure 5-6. Federal Policies to Reduce GHG Emissions of High-GWP Gases, by Type of Policy and Measure
15
14
6
6
3
2
1
1
0 2 4 6 8 10 12 14 16
Coalitions & Partnerships
Labeling & Information Dissemination
International Cooperation
Education, Training, and S&T Workforce Development
Tax Policy and Other Financial Incentives
Codes and Standards
Risk Mitigation
Market Conditioning including Government Procurement
Number of Activities
15
14
6
6
3
2
1
1
0 2 4 6 8 10 12 14 16
Coalitions & Partnerships
Labeling & Information Dissemination
International Cooperation
Education, Training, and S&T Workforce Development
Tax Policy and Other Financial Incentives
Codes and Standards
Risk Mitigation
Market Conditioning including Government Procurement
Number of Activities Source: CCTP/Energetics Deployment Inventory Database dated January 2009 Note: Some activities fit into more than one category, so the total count exceeds the total number of identified activities (27) listed in this area. The figure does not include activities that are authorized but not implemented. See Annex B for details.

Strategies for Commercialization and Deployment
104
agricultural contributor to N2O emissions; NOX from combustion is chemically transformed in the atmosphere and deposited in the form of nitrogen compounds, resulting in emissions of N2O similar to those from fertilizer application. In the production of industrial acids, nitric acid is currently the largest contributor to nitrous oxide emissions.
U.S. N2O emissions from combustion and industrial acid production accounted for nearly 10 percent of total non-CO2 GHG emissions, with combustion accounting for over 70 percent in 2000. Figure 5-7 shows the relative contributions from both sources. U.S. emissions of N2O associated with industrial acid production declined significantly after 1996 due to voluntary industry action and could remain relatively stable.
In order to identify the most promising approaches and technologies for reducing N2O emissions from combustion from stationary and mobile sources, it is critical to understand how N2O is formed during combustion and under what circumstances catalytic technologies contribute to N2O emissions. The main research thrust in the near term is to improve
scientific understanding of these basic questions. The C&D strategies for mitigating N2O emissions from industry are focused on critical barriers that hinder market penetration of N2O abatement technologies for nitric acid production.
Table 5-4. Select Federal Activities Addressing Key Technology Deployment Barriers: Emissions of High-GWP Gases
Solutions Key Technology Deployment
Barriers Major Programs,
Policies, or Initiatives*
Illustrative Deployment Activities
Most Critical Barriers:
Incomplete and Imperfect Information 19
• Asia-Pacific Partnership on Clean Development and Climate (DOS)
• National Pollution Prevention Vendor Database (EPA)
Lack of Specialized Knowledge 7
• PFC Reduction/Climate Partnership for the Semiconductor Industry (EPA)
• SF6 Emission Reduction Partnership for Electric Power Systems (EPA)
• Voluntary Aluminum Industrial Partnership (EPA)
High Costs 2 • Mobile Air Conditioning Climate Protection Partnership (EPA)
External Benefits and Costs 1 • Responsible Appliance Disposal Program (EPA)
Other Important Barriers:
Market Risks 2 • Loan Guarantee Program (DOE)
*Does not include activities that are authorized but not implemented. See Annex B for details.
Figure 5-7. U.S. N2O Emissions from Combustion and Industrial Sources, 2005
(Source: EPA 2007a)

Nitrous Oxide Emissions from Combustion and Industrial Sources January 2009
105
Reducing Nitrous Oxide Emissions from Combustion and Industrial Sources Today
N2O Emissions from the Nitric Acid Industry – A catalyst to reduce nitrous oxide emissions from SCR plants is being developed in the Netherlands, and a manufacturer of nitric acid is testing a catalyst for use in the ammonia burners in nitric acid plants. Both research groups claim to be capable of reducing nitrous oxide emissions by up to 90 percent and their technology can be easily installed on existing plants. These technologies could be available for commercial application by 2010.
For both stationary and mobile combustion sources, N2O emissions appear to vary greatly with different technologies and under different operating conditions, and the phenomena involved are poorly understood. In industrial acid production, research to develop advanced catalysts that reduce nitrous oxide to elemental nitrogen with greater efficiency could further limit nitrous oxide emissions.
Technologies Suitable for Deployment The CCTP Strategic Plan (CCTP 2006) outlines some of the most promising GHG intensity-reducing concepts associated with reducing nitrous oxide emissions from combustion and industrial sources. Current Federal research is focused on better understanding the formation and magnitude of N2O emissions from fuel combustion and catalytic converter operation; evaluating the climate-forcing potential of atmospheric nitrogen deposition, especially from combustion; and developing emission models to assess the potential climate benefits from changes in emissions from nitrous oxide. Since this is in the basic research phase there are no technologies suitable for deployment at this time.
Nitric acid production is the largest industrial source of N2O emissions. Virtually all of the nitric acid produced in the United States is manufactured by the catalytic oxidation of ammonia. The nitric acid industry currently controls NOx emissions using both non-selective catalytic reduction (NSCR) and selective catalytic reduction (SCR) technologies. NSCR is very effective at controlling nitrous oxide while SCR can actually increase nitrous oxide emissions. Only 20 percent of nitric acid plants use nonselective catalytic reduction today. Additional research is needed to develop new catalysts that reduce N2O with greater efficiency, and to improve
nonselective catalytic reduction technology to make it a viable alternative to selective catalytic reduction and other control options.
Barriers to Deployment78 In general, the barriers to deployment of technologies that reduce nitrous oxides from combustion and industry are similar to the barriers for reducing carbon emissions in the relevant sectors (transportation, electricity generation, industry). These include high risks associated with technology performance, and in some cases, fiscal policies that inhibit rather than encourage investment.
Technical risks in general impede the adoption of new technologies in the industrial sector, particularly where processing performance, productivity, or product quality may be impacted and the effects are uncertain or not well-demonstrated. For both stationary (power plant) and mobile sources (primarily transportation) of emissions, adoption of advanced pollution control technologies may require demonstration and/or validation to overcome high risks of adoption and development.
Adoption of more efficient technologies that could potentially reduce N2O emissions in vehicles faces market risks related to uncertain energy prices. New engine technologies, for example, could reduce emissions from freight transport, but market penetration of these is greatly influenced by energy costs. Volatile energy prices create an uncertain market demand for efficient, low-emissions products.
Competing fiscal priorities79 can result in tax depreciation schedules that adversely influence adoption of new technology in industry by providing disincentives to investment (Brown and Chandler 2008).
Other barriers also may be minimizing the potential of advanced technologies to reduce N2O emissions from combustion and industry. The long capital 78 The existence of barriers and their identification in this report in no way implies it is the responsibility of the Federal government to address every (or any) barrier, in whole or in part. 79 Existing fiscal policies, regulations, and statutes may be beneficial in a broad context of public policy, but often they compete with or conflict with the narrow objective of promoting C&D of certain GHG-reducing technologies. As a result, while providing overall benefits to society these policies may be found to hinder investment in clean energy technologies (see Box 1-2 in Chapter 1).

Strategies for Commercialization and Deployment
106
Federal Activities at Work: N2O Emissions from Combustion and
Industrial Sources
Environmental Technology Verification Program – independently verifies the performance of innovative private sector environmental technologies to help accelerate the market penetration of advanced technologies, such as those than can reduce NOx and N2O.
Innovations for Existing Plants – seeks to develop and deploy a portfolio of environmental control technologies (such as advanced NOx controls) that can be retrofitted to existing coal-fired power plants.
Clean Coal Power Initiative – provides government co-financing for new coal technologies that can help utilities boost plant efficiency, reducing pollutants such as N2O.
lifetimes of existing industrial equipment could delay the adoption of new technology in both the combustion and acid production areas. Finally, the reduction of nitrous oxides has impacts that are external to the marketplace and therefore are not fully factored into the decision making of industry managers.
Commercialization and Deployment Strategy The U.S. strategies address barriers to commercialization and deployment of N2O-reducing technologies and practices from combustion and industrial sources. Since N2O emissions do not contribute significantly to ozone formation or other public health problems, N2O has not been a focus of emission reduction activities. However, thirty-six complementary activities identified in Annex B, such as those that encourage combustion efficiency improvements, offer the potential to reduce N2O emissions (Figure 5-8). Federal actions focus on voluntary programs and public/private partnerships, such as the EPA’s SmartWay Transport Partnership, which is designed to increase energy efficiency in the freight industry and reduce up to 200,000 tons of NOx by 2012. Twelve of the identified programs focus on information dissemination and seven activities are international in scope. Considering the wide range of
programs, policies, and initiatives that encourage emissions reductions from combustion and industrial sources, these activities offer a robust portfolio of policies and programs addressing key barriers in this sector, as shown in Table 5-5.
The technical risks associated with introducing N2O-reducing technologies into the marketplace are addressed by various programs including the EPA’s
Figure 5-8. Federal Policies to Reduce GHGs of N2O Emissions from Combustion and Industrial Sources, by Type of Policy and Measure
12
10
9
7
6
5
5
3
2
1
0 2 4 6 8 10 12 14
Labeling & Information Dissemination
Coalitions & Partnerships
Tax Policy and Other Financial Incentives
International Cooperation
Codes and Standards
Legislative Act of Regulation
Education, Training, and S&T Workforce Development
Technology Demonstration
Market Conditioning including Government Procurement
Risk Mitigation
Number of Activities
12
10
9
7
6
5
5
3
2
1
0 2 4 6 8 10 12 14
Labeling & Information Dissemination
Coalitions & Partnerships
Tax Policy and Other Financial Incentives
International Cooperation
Codes and Standards
Legislative Act of Regulation
Education, Training, and S&T Workforce Development
Technology Demonstration
Market Conditioning including Government Procurement
Risk Mitigation
Number of Activities Source: CCTP/Energetics Deployment Inventory Database dated January 2009 Note: Some activities fit into more than one category, so the total count exceeds the total number of identified activities (36) listed in this area. The figure does not include activities that are authorized but not implemented. See Annex B for details.

Summary January 2009
107
Clean Automotive Technology Program. Similarly, the Voluntary Diesel Retrofit Program is working with state, local, and industry partners to implement and verify the effectiveness of pollution-reducing technologies. To address market risks, EPA’s SmartWay Transport Partnership is connecting with states, banks, and other organizations to develop innovative financing options for purchasing emissions reduction technologies. The accelerated amortization for atmospheric pollution control facilities in the Energy Policy Act of 2005 (§1309) helps ameliorate competing fiscal priorities that can result in outdated tax depreciation schedules. This tax provision allows for certain air pollution control facilities to be amortized over 60 months.
Potential Opportunities and Gaps Emissions of nitrous oxides from stationary and mobile combustion and industrial acid production are important contributors to non-CO2 GHG emissions in the United States. Numerous technologies and practices to mitigate emissions are already in place and are constraining emissions growth. The Federal government is targeting combustion efficiency and NOx pollution in transportation, power plants, and industries that are concurrently reducing emissions of nitrous oxides. Increased usage of non-combustion fuels and power sources is also a large potential opportunity to decrease NOx emissions.
While these actions have produced successes, barriers to further deployment of nitrous-oxide-reducing technologies and practices still exist. In particular, nitrous oxide impacts external to the market, high risks, and competing fiscal priorities may be impeding sufficient investment in new technologies. In the future, as the role of nitrous oxides in climate change is better understood, new strategies may be implemented for reducing their impacts and more complete information may be available to industry and the general public.
5.5 SUMMARY Important deployment gaps and opportunities remain. External benefits and costs, high costs, and technical risks hinder progress. In addition, lack of specialized knowledge among stakeholders is a key barrier. For example, substitutes exist for high-GWP gases in aluminum, magnesium and other industries, but they require a relatively high level of skill and industry-specific expertise to implement successfully and economically. New or expanded programs by government or industry may be needed to overcome the complex barriers inherent to reduction of non-CO2 gases, which largely reside outside the mainstream of other mitigation efforts. Further work is needed to assess and design the most cost-effective strategies for each.
Table 5-5. Select Federal Activities Addressing Key Technology Deployment Barriers: N2O Emissions from Combustion and Industrial Sources
Solutions Key Technology Deployment
Barriers Major Programs,
Policies, or Initiatives*
Illustrative Deployment Activities
Most Critical Barriers:
Technical Risks 6
• Clean Automotive Technology Program (EPA) • Environmental Technology Verification
Program (EPA) • Voluntary Diesel Retrofit Program (EPA)
Market Risks 4 • SmartWay Transport Partnership (EPA)
Competing Fiscal Priorities 1 • Accelerated Amortization for Atmospheric Pollution Control Facilities
Other Important Barriers:
External Benefits and Costs 5 • Accelerated Amortization for Atmospheric Pollution Control Facilities
*Does not include activities that are authorized but not implemented. See Annex B for details.

Strategies for Commercialization and Deployment
108

Chapter 6 January 2009
109
Chapter 6. Conclusion
The most significant opportunities for reducing, avoiding, capturing and sequestering GHG emissions in the near-term, for both CO2 and non-CO2 greenhouses, can be found among the 15 technology areas, as presented in Chapters 2 through 5. The employment of GHG-reducing technologies and practices is critical to the attainment of U.S. climate change goals. In the preceding discussions of each technology area, their respective potentials for reducing GHG emissions, current status and circumstances relative to their prospects for commercialization and deployment (C&D) were assessed. The C&D Strategies Report outlines the situation, identifies barriers and risks that can potentially hinder deployment, and summarizes existing policies and measures that help address barriers to C&D, including various risks associated with each technology’s adoption in the marketplace. Federal efforts to deploy GHG-reducing technologies evidence a long, evolving history, replete with recent additions and expansions. Highlighted throughout the C&D Strategies Report, and catalogued in its annexes, are more than 300 policies and measures (PAMs) either in place and operating today, or recently mandated and expected to soon be implemented (see Annex B). The C&D Strategies Report organizes these efforts into more than 20 genres. These range from education, outreach and demonstration programs to building or equipment codes and performance standards; from financial incentives to domestic and international partnerships; and more. The activities are further augmented by other PAMs at regional, state, and local levels. These PAMs help address many facets of the C&D challenge simultaneously. Collectively, these efforts have the effect of promoting deployment across
multiple economic sectors. To the degree appropriate, such activities facilitate market entry of GHG-reducing technologies, such as hybrid cars, high-efficiency technologies incorporated into modern or retrofitted buildings, advanced clean coal power plants, carbon capture, highly efficient industrial processes, and a wide range of low-GHG emitting clean technologies for fuels and power. Additionally, market forces, advancing science, and global concerns about the potential impacts of climate change are working together to reshape behavioral norms and consumer choices, which are pulling the technologies faster into the marketplace. Altogether, significant progress is being made. In developing the C&D Strategies Report, more than 300 GHG-reducing technologies were identified as suitable for commercialization and development. Some of the technologies are in the marketplace today, but appear to be impeded from greater market adoption by various barriers. Others are near-ready, but still distant from widespread adoption due to an array of technical, market, regulatory, and other barriers. Barriers (see below) can impede progress across every stage of the commercialization and deployment process. While some barriers are unique to the technology or sectors where they will likely be employed, others are general and have far-reaching implications across economic sectors. In some cases, barriers are cultural or historical. Others may be ingrained in risk-averse sectors not typically prone to acceptance of technology change.80
80 The existence of barriers and their identification in this report in no way implies it is the responsibility of the Federal government to address every (or any) barrier, in whole or in part.

Strategies for Commercialization and Deployment
110
The complexity and diversity of the barriers suggest that overcoming them successfully will likely require efforts by all stakeholders. Understanding the nature of barriers and their pervasiveness in technology deployment and commercialization is the key to identifying where interventions may be beneficial and formulating effective C&D policies if necessary. The most common and critical barriers are summarized below. Technical details may be found in Chapters 2 through 5. Common and Critical Barriers Many of the barriers to deployment affect relatively limited numbers of technologies or limited portions of the market, while others are systemic and economy-wide. For a summary of the breadth of impact of the 20 barriers defined in Chapter 1, see Figure 6-1 and Table 6-1 (indicates sectors where each barrier is viewed as either critical or important). Ten barriers were found to be critical or important to at least a third of the technology sectors. Most notable are external benefits and costs, high costs,
technical and market risks, lack of specialized knowledge, incomplete and imperfect information, infrastructure limitations, industry structure, competing fiscal priorities, and policy uncertainty. Five of these are related to the economics of investment or so called cost-effectiveness barriers (as defined in Chapter 1). Progress on these ten common obstacles in a broad fashion by the appropriate stakeholders could accelerate and expand the uptake of GHG-reducing technologies. In some instances, economy-wide actions may be more efficient in addressing common barriers than a plethora of targeted, specific policy instruments (Brown et al. 2007). Characterizing barriers more broadly by CCTP goal area, rather than by technology area, highlights some key differences (Table 6-2). While all four CCTP goal areas are impacted by external benefits and costs, high costs, technical risks, and market risks, the deployment barriers they face are otherwise distinct. Some of the characteristics unique to the CCTP goal areas are summarized below. Policy intervention is
Figure 6-1. Critical and Important Barriers by CCTP Goal Area
0 1 2 3 4 5 6 7 8 9 10 11 12 13 14 15
External Benefits and Costs
High Costs
Technical Risks
Market RisksLack of Specialized Knowledge
Competing Fiscal Priorities
Fiscal Uncertainty
Competing Regulatory Priorities
Regulatory Uncertainty
Competing Statutory Priorities
Statutory Uncertainty
Anti-competitive Patent Practices
IP Transaction Costs
Weak International Patent Protection
University, Industry, Government Perceptions
Incomplete and Imperfect Information
Infrastructure Limitations
Industry Structure
Policy Uncertainty
Misplaced Incentives
Bar
rier T
ypes
Number of Technology Sectors Impacted by Each Barrier
Energy End-Use and InfrastructureEnergy SupplyCarbon Capture and SequestrationNon-CO2 GHGs
IP Barriers
Statutory Barriers
Regulatory Barriers
Fiscal Barriers
Cost-Effectiveness Barriers
Other Barriers

Chapter 6 January 2009
111
Table 6-1. Major Barriers Inhibiting Deployment of GHG-Reducing Technologies
CCTP Goal Area CCTP Sector
Exte
rnal
B
enef
its a
nd
Cos
ts
Hig
h C
osts
Tech
nica
l Ris
ks
Mar
ket R
isks
Inco
mpl
ete
and
Impe
rfec
t In
form
atio
n
Lack
of
Spec
ializ
ed
Kno
wle
dge
Infr
astr
uctu
re
Lim
itatio
ns
Com
petin
g Fi
scal
Prio
ritie
s
Indu
stry
St
ruct
ure
Polic
y
Unc
erta
inty
Transportation
Buildings
Industry
Energy End-Use and
Infrastructure Electric Grid and
Infrastructure Low-Emission, Fossil-Based
Fuels and Power
Hydrogen
Renewable Energy & Fuels
Energy Supply
Nuclear Fission
Carbon Capture Geologic Storage
Carbon Capture and
Sequestration Terrestrial
Sequestration Methane
Emissions from Energy and
Waste
Methane and Nitrous Oxide
Emissions from Agriculture
Emissions of High Global-
Warming Potential Gases
Non-CO2 Greenhouse
Gases
Nitrous Oxide Emissions from Combustion and
Industrial Sources
Totals 15 13 12 11 9 8 8 6 6 6
*This table lists the 10 barriers judged to be critical ( ) or important ( ) obstacles to the deployment of five or more of the 15 technology strategies (i.e., CCTP Sector). Symbols indicate that a barrier is judged to be a critical or important obstacle to the deployment of technologies in a particular sector.

Strategies for Commercialization and Deployment
112
not always the appropriate solution and as such requires careful consideration.
Infrastructure limitations are key obstacles to carbon capture and storage technologies, which require plants with carbon capture, as well as the creation of an industrial supply chain including carbon dioxide pipelines or other means of transport (although the pipeline network is easier to solve technologically and from a cost perspective than the carbon capture plants). Similarly, all four low-carbon energy supply sectors are impacted by infrastructure limitations, such as the lack of a long-term nuclear waste repository, underdeveloped distribution systems for alternative transportation fuels, and insufficient grid capacity to connect regions of high renewable resources with urban concentrations of electricity demand.
Industry structure is an important hindrance to energy end-use and infrastructure technologies and to low-carbon energy supply technologies. Industry fragmentation in the buildings industry slows technological change, inhibits intra-industry coordination, and limits investment. The decision-making process includes diverse stakeholders whose interests often do not align. At the other extreme of industry structure, complete market consolidation can also hinder technology deployment. For example, natural monopolies in the power industry are such that newer, smaller types of power production are often inhibited in
their market entry in favor of larger, baseload power sources.
Policy uncertainty is a key barrier to the deployment of energy end-use and infrastructure technologies and carbon capture and storage technologies, and others whose benefits are largely tied to a societal value of reducing GHG emissions. As long as there is policy uncertainty associated with legal treatment of GHG emissions, investment in technologies to capture and sequester CO2 will be limited.
Competing fiscal priorities are important barriers to deployment in the energy end-use areas. Because most utilities lack cost-recovery mechanisms for energy-efficiency investments, electric utilities and wire companies in most states experience revenue erosion when they promote energy efficiency. This impedes utility, or even utility-coordinated, investments to promote efficient buildings and industrial practices.
Crosscutting and Common Deployment Activities The portfolio of Federal activities that help address barriers includes crosscutting initiatives and narrowly targeted efforts. For example, the Clean Energy Initiative spans multiple agencies and addresses high costs, imperfect information, infrastructure limitations, and others. Although crosscutting
Table 6-2. Summary of Major Barriers Inhibiting Deployment by Goal*
CCTP Goal Area
Exte
rnal
Ben
efits
an
d C
osts
Hig
h C
osts
Tech
nica
l Ris
ks
Mar
ket R
isks
Inco
mpl
ete
and
Impe
rfec
t In
form
atio
n
Lack
of
Spec
ializ
ed
Kno
wle
dge
Infr
astr
uctu
re
Lim
itatio
ns
Indu
stry
Str
uctu
re
Polic
y
Unc
erta
inty
Com
petin
g Fi
scal
Pr
iorit
ies
Energy End-Use and Infrastructure
Energy Supply
Carbon Capture and Sequestration
Non-CO2 Greenhouse
Gases
*Checks indicate that a barrier is judged to be a critical or important obstacle to the deployment of two or more technology strategies within a particular CCTP goal area.

Chapter 6 January 2009
113
activities by intent do not exclusively address a single barrier, each is an important contributor to overall C&D strategies. Collectively, they add coherence across activities within and among the many participating Federal agencies and economic sectors. The most common type of deployment activities are
identified in Table 6-3. These include education, labeling and information programs; tax policy and other financial incentives; international cooperation; and other coalitions and partnerships. These are used in part because they are generally easier to implement, have the potential to reach a broad
Table 6-3. Types of Deployment Activities by Technology Strategy*
CCTP Goal Area
Technology Strategies
Educ
atio
n, la
belin
g an
d in
form
atio
n di
ssem
inat
ion
Tax
polic
y an
d ot
her f
inan
cial
in
cent
ives
Coa
litio
ns &
par
tner
ship
s
Inte
rnat
iona
l coo
pera
tion
Mar
ket c
ondi
tioni
ng in
clud
ing
gove
rnm
ent p
rocu
rem
ent
Tech
nolo
gy d
emon
stra
tion
Cod
es a
nd s
tand
ards
Legi
slat
ive
act o
f reg
ulat
ion
Ris
k m
itiga
tion
Transportation 54 29 24 15 16 12 10 7 1
Buildings 58 21 22 15 20 5 14 5 3
Industry 45 14 28 13 4 6 2 1 2 Energy End-Use and Infrastructure
Electric Grid and Infrastructure 19 7 11 12 4 6 1 3 1
Low-Emission, Fossil-Based Fuels and Power 23 15 8 14 5 6 2 1 1
Hydrogen 11 6 2 5 3 4 3 0 1
Renewable Energy & Fuels 48 30 19 19 18 11 7 7 2
Energy Supply
Nuclear Fission 7 4 3 7 2 2 0 0 2
Carbon Capture 5 5 4 6 2 4 0 0 1
Geologic Storage 4 4 4 7 2 3 1 1 1 Carbon
Sequestration Terrestrial Sequestration 18 12 7 8 5 2 0 0 1
Methane Emissions from Energy and Waste 14 3 7 9 1 1 0 2 1
Methane and Nitrous Oxide Emissions from
Agriculture 8 7 1 6 1 0 0 0 2
Emissions of High Global-Warming Potential Gases 17 3 15 6 1 0 2 0 1
Non-CO2 Greenhouse
Gases
Nitrous Oxide Emissions from Combustion and
Industrial Sources 14 9 10 7 2 3 6 5 1
Totals 345 169 165 149 86 65 48 32 21
* Column totals represent the number of deployment activities impacting the 15 technology strategies. Totals are indicative measures of relative frequency of application. Double counting occurs because a single deployment activity may impact multiple technology strategies. The count does not include activities that are authorized but not implemented. See Annex B for details.

Strategies for Commercialization and Deployment
114
constituency, and fit relatively easily within the existing political processes. Aligning Deployment Activities with Barriers The Federal deployment activities comprising Annex B help address the most common and critical barriers that tend to hinder widespread technology deployment of GHG-reducing technologies and meet the specific needs of each CCTP sector, as shown in Table 6-4. The bold numbers illustrate how Federal activities are designed to address specific challenges. For instance, tax policy and other financial incentives are geared to reduce the high costs associated with purchase and use of low-carbon technologies; market risk is addressed by market conditioning efforts.
Tax policy and other financial incentives and high costs. Financial incentives, including tax policies
offered in the Energy Policy Act of 2005 provide numerous examples of alignment with high costs. For instance, EPAct reduces costs via tax credit for generation from advanced nuclear energy facilities, and for new homes meeting IECC energy efficiency standards. The USDA’s Rural Energy for America Program, which assists agricultural producers and rural small businesses with purchasing renewable energy and energy efficiency systems, is an example of the relationship between financial incentives and high cost barriers.
Technology demonstrations and technical risks. In some cases, technical risks for near-commercial technologies can be mitigated through demonstrations that help to prove to investors that the technology can operate outside of the research environment. For example, DOE’s Clean Coal Power Initiative programs are demonstrating new
Table 6-4. Types of Deployment Activities by CCTP Barrier*
Deployment Activity
Hig
h C
osts
Tech
nica
l Ris
ks
Mar
ket R
isks
Exte
rnal
Ben
efits
an
d C
osts
Lack
of
Spec
ializ
ed
Kno
wle
dge
Com
petin
g Fi
scal
Pr
iorit
ies
Inco
mpl
ete
and
Impe
rfec
t In
form
atio
n
Infr
astr
uctu
re
Lim
itatio
ns
Indu
stry
Str
uctu
re
Polic
y
Unc
erta
inty
Tax policy and other financial incentives 57 8 7 36 6 21 11 8 5 6
Technology demonstration 7 27 5 0 3 0 8 6 1 4
Codes and standards 5 4 12 14 4 0 6 1 13 4
Coalitions and partnerships 7 14 5 4 20 1 48 5 7 11
International cooperation 4 4 8 1 7 0 16 3 1 12
Market conditioning including government procurement 2 4 25 6 1 0 6 4 3 7
Education, labeling and information dissemination 17 18 14 7 43 3 107 13 13 16
Legislative act of regulation 7 0 5 8 0 1 1 0 1 5
Risk mitigation 2 0 5 1 0 0 0 0 0 0
*Each activity can encompass multiple key barriers with varying degrees of effectiveness, likelihood of commercial success, and private sector interest and incentive to invest. While these factors are not quantified in this table, the breakdown of number of relevant activities does provide a window into the strategic alignment of activities and barriers. Bolded numbers represent the type of deployment activity that most frequently addresses each of six types of barriers. Activities in columns are not additive; some apply to multiple categories. The count does not include activities that are authorized but not implemented. See Annex B for details.
Chapter 6 January 2009
115
clean coal technology to pave the way for wider commercial use. DOD’s Fuel Cell Test and Evaluation Center (FCTec) provides validation and demonstration of fuel cell systems to reduce technical risks and accelerate commercialization.
Market conditioning and market risk. Federal programs that require purchasing GHG-reducing technologies are helping alleviate market risk by establishing a demand floor. Activities such as Federal Renewable Energy Purchases, administered by DOE’s Federal Energy Management Program, promote the use of distributed and renewable energy, and EPAct requirements mandate Federal procurement of GHG-reducing technologies. EPAct Section 782 requires Federal fleets to begin leasing or purchasing fuel cell vehicles and hydrogen energy systems no later than 2010, which guarantees technology producers some market demand.
Tax policy and other fiscal incentives and external benefits and costs. The existence of un-priced benefits and costs distort the price of GHG-reducing technologies and competing technologies. By introducing fiscal incentives and penalties, these un-priced effects can be “internalized” into operation of the marketplace, allowing GHG-reducing technologies to compete more effectively. This is done, for example by the Alternative Motor Vehicle Credit and by production tax credits for renewable and nuclear power generation, as specified in EPAct 2005.
Education, labeling and information dissemination and imperfect information. Incomplete or inaccessible information can cause market inefficiencies and in some cases, there is a Federal role in helping to address information issues. For example, EPA’s Green Vehicle Guide and the DOE-EPA ENERGY STAR program exemplify the alignment of information dissemination and imperfect information. These deployment programs rate products based on energy and fuel efficiency and help consumers choose the vehicle or product that meets their needs.
Education, labeling and information dissemination and lack of specialized knowledge. Novel technologies often face issues of workforce training and knowledge gaps in the business and financing communities. Education and workforce development programs provide training and outreach activities to address this need. Examples
operating today include DOE’s Graduate Automotive Technology Education Program and EPA’s AgSTAR Program, which provides specialized information about methane emissions from agriculture.
In conclusion, this report systematically examines the market readiness of key technologies identified as important to meeting climate change mitigation goals. It assesses the barriers and business risks impeding their progress and greater market application. Importantly, by documenting the hundreds of Federal policies, programs, regulations, incentives, and other activities that are in effect and operating today, or soon to be implemented, all of which are intended to address these barriers, it provides a comprehensive context for evaluating the adequacy of current policy and the potential need, if any, for additional measures that might be undertaken by government or industry. Finally, it draws conclusions about the current situation, identifies gaps and opportunities, and suggests analytical principles that should be applied to assess and formulate policies and measures to accelerate the commercialization and deployment of these technologies. It also calls for a continuing process of stewardship, analysis and evaluation. With hundreds of Federal programs, policies and measures in place today, with more soon to be implemented, all augmented by additional activities at the State and regional levels, and with annual investments of more than $4 billion in associated Federal R&D, GHG reducing technologies are being deployed and barriers to their greater adoption are being addressed. Accelerated diffusion of these technologies is expected, as the existing and new Federal activities are implemented more broadly and take effect. However, realizing the full potential of these technologies is still being impeded in some important areas by significant barriers. Successful implementation of commercialization and deployment strategies requires effective stewardship, including changes and updates, as may be appropriate. This report establishes a framework for moving forward, taking stock of existing efforts, and establishing a continuing process of analysis and evaluation. This includes examining future opportunities, as outlined in this report. It also includes evaluations of the efficacy, cost, and cost-effectiveness of existing

Strategies for Commercialization and Deployment
116
activities, monitoring the implementation of newly enacted authorities, and investigating key barriers. Given that energy security and climate change are two of the great challenges of our time, it is appropriate to note that both share a common solution – technology. The policies and measures detailed in this report evidence a robust array of Federal action. It also points the way to areas for further improvement. In conjunction with the CCTP Strategic Plan, the two reports - one guiding R&D, the other promoting C&D - constitute an inspired vision for realizing the potential of innovation and technology in addressing energy security and climate change concerns.

References January 2009
117
References
American Council for an Energy-Efficient Economy
(ACEEE). 2007. “Senate Energy Bill Will Save Consumers and Businesses at Least $400 Billion.” News Release, December 14, 2007. http://www.aceee.org/press/0712energy-bill-2.htm
Argonne National Laboratory (ANL). 2008. “The Greenhouse Gases, Regulated Emissions, and Energy Use in Transportation (GREET) Model, Version 1.8b.” Argonne, IL: Transportation Technology R&D Center.
Berg, David. 1988. Keynote Address to 1st Meeting of the EPA Administrator’s National Advisory Council for Environmental Technology Transfer.
Brown, M.A. 2004. “Obstacles to Energy Efficiency,” Encyclopedia of Energy, Volume 4, pp. 465-475.
Brown, M.A. and S.J. Chandler. 2008. “Governing Confusion: How Statutes, Fiscal Policy, and Regulations Impede Clean Energy Technologies.” Stanford Law and Policy Review (19) 3:472-509.
Brown, M., J. Chandler, M. Lapsa, and B. Sovacool. 2007 (revised 2008). Carbon Lock-In: Barriers to Deploying Climate Change Mitigation Technologies. Oak Ridge, TN: Oak Ridge National Laboratory. http://www.ornl.gov/sci/eere/PDFs/Carbon_Lock-In_200811.pdf (accessed December 2008)
Brown, M.A., F. Southworth, and T. Stovall. 2005. Towards a Climate-Friendly Built Environment. Arlington, VA: Pew Center on Global Climate Change. http://www.pewclimate.org
Bird, L. and B. Swezey. 2006. Green Power Marketing in the United States: A Status Report (9th Ed.). http://www.eere.energy.gov/greenpower/resources/pdfs/40904.pdf
Casten, T.R. and R.U. Ayres. 2007. Energy Myth Eight - Worldwide Power Systems are Economically and Environmentally Optimal in Sovacool, B. K. and Brown, M. A. (eds.) Energy and American Society – Thirteen Myths. New York: Springer Publishing Company, pp. 201-237.
CEQ. 2007. Twenty In Ten: Strengthening America's Energy Security www.whitehouse.gov/stateoftheunion/2007/initiatives/energy.html
Chicago Climate Exchange (CCX). 2009. http://www.chicagoclimatex.com/ (accessed January 2009)
CNW Marketing Research (CNW). 2004. “Record gas prices nip big SUV sales.” http://money.cnn.com/2004/05/17/pf/autos/suvs_gas/ (accessed January 2009)
Colorado. 2005. Colorado Agricultural IOF Technology Assessments: Precision Agriculture and Anaerobic Digestion. State of Colorado, Governor’s Office of Energy Conservation and Management. http://ewb-kansasstate.wikispaces.com/space/showimage/ Anaerobic+Digestion+Typical+Plant.pdf
Dakota Gasification Company. “Great Plains Synfuels Product Information.” www.dakotagas.com/Products/index.html (accessed December 2008).

Strategies for Commercialization and Deployment
118
Davis, S. and S. Diegel. 2006. Transportation Energy Data Book: Edition 25. Oak Ridge, TN: Oak Ridge National Laboratory.
Electric Power Research Institute (EPRI). 2007. “Closing the Fuel Carbon Cycle.” EPRI Journal Spring 2007. http://mydocs.epri.com/docs/CorporateDocuments/EPRI_Journal/2007-Spring/1014795.pdf
Electricit de France. “The Rance tidal power plant.” http://www.edf.fr/html/en/decouvertes/voyage/ usine/retour-usine.html (accessed December 2008).
Energy Independence and Security Act of 2007, Public Law 110-140, 110th Congress (EISA). 2007. http://frwebgate.access.gpo.gov/cgi-bin/getdoc.cgi?dbname=110_cong_public_laws&docid=f:publ140.110.pdf (accessed January 2009)
Energy Information Administration (EIA). 2005. Annual energy outlook 2005: with projections to 2025, DOE/EIA-0383(2005). Washington, DC: U.S. Department of Energy.
Energy Information Administration (EIA). 2006a. Annual Energy Outlook 2006, DOE/EIA-0383(2006). Washington, DC: U.S. Department of Energy.
Energy Information Administration (EIA). 2006b. International Energy Outlook, DOE/EIA-0484(2006). Washington, DC: U.S. Department of Energy.
Energy Information Administration (EIA). 2007a. Annual Energy Outlook 2007 with Projections to 2030 – Overview, DOE/EIA-0383(2007). http://www.eia.doe.gov/oiaf/aeo/index.html, accessed 7/16/07.
Energy Information Administration (EIA). 2007b. International Energy Outlook 2007, DOE/EIA-0484(2007). http://www.eia.doe.gov/oiaf/ieo/index.html.
Energy Information Administration (EIA). 2007c. Renewable Energy Trends, 2005. http://www.eia.doe.gov/cneaf/solar.renewables/page/trends/rentrends.html#_ftn11 change to 2007c
Energy Information Administration (EIA). 2008. Annual Energy Outlook 2008 with Projections to 2030 – Overview, DOE/EIA-0383(2007). http://www.eia.doe.gov/oiaf/aeo/index.html
Energy Independence and Security Act of 2007, Public Law 110-140, 110th Congress (EISA). 2007. http://frwebgate.access.gpo.gov/cgi-bin/getdoc.cgi?dbname=110_cong_public_laws&docid =f:publ140.110.pdf
Follett R.F., J.M. Kimble, and R. Lal. 2001. The potential of US grazing lands to sequester carbon and mitigate the greenhouse effect. New York: Lewis Publishers.
Garland, N. 2008. “Department of Energy’s Fuel Cell Subprogram,” 2008 Fuel Cell Seminar and Exposition, October, 2008.
Green, B., and G. Nix. 2006. Geothermal - the energy under our feet. http://www.nrel.gov/docs/fy07osti/40665.pdf.
Holdren, J.P. 2006. “The Energy Innovation Imperative: Addressing Oil Dependence, Climate Change, and Other 21st Century Energy Challenges.” Innovations, pp. 3-23.
Idaho National Laboratory. 2007. “What is Geothermal Energy?” http://geothermal.id.doe.gov/ what-is.shtml
International Atomic Energy Agency (IAEA). 2006. “Nuclear Power Reactors in the World.” http://www-pub.iaea.org/MTCD/publications/PDF/RDS2-26_web.pdf
International Energy Agency (IEA). 2006. World energy outlook 2006. Paris: International Energy Agency.
International Energy Agency (IEA). 2008. Key World Energy Statistics 2008. http://www.iea.org/Textbase/publications/free_new_Desc.asp?PUBS_ID=1199 (accessed January 2009)
Intergovernmental Panel on Climate Change (IPCC). 2005. IPCC Special Report on Carbon Dioxide Capture and Storage. Prepared by Working Group III of the Intergovernmental Panel on Climate Change [Metz, B., O. Davidson, H. C. de Coninck, M. Loos, and L. A. Meyer (eds.)].

Glossary January 2009
119
Cambridge University Press, Cambridge, United Kingdom and New York, NY, USA, 442 pp. http://arch.rivm.nl/env/int/ipcc/pages_media/SRCCS-final/IPCCSpecialReportonCarbondioxideCaptureandStorage.htm
Intergovernmental Panel on Climate Change (IPCC). 2007. IPCC. 2007. Working group III: Fourth Assessment Report. http://www.mnp.nl/ipcc/pages_media/AR4-chapters.html
Jaffe, A.B. and R.N. Stavins. 1994. “The Energy-Efficiency Gap,” Energy Policy, 22(10): 804-810.
Joyce, L.A. and R. Birdsey, eds. 2000. The impact of climate change on American’s forests: a technical document supporting the 2000 USDA Forest Service RPA assessment, 133. Gen. Tech. Rep. RMRS-GTR-59. Fort Collins, Colorado: U.S. Department of Agriculture. http://www.fs.fed.us/rm/pubs/rmrs_gtr059.pdf
Kalogirou, S. A. 2004. Solar Thermal Collectors and Applications. Progress in Energy and Combustion Science, 30(3), 231-295.
Kammen, D. and Nemet, G. F. 2007. “Energy Myth Eleven – Energy R&D Investment Takes Decades to Reach the Market” in Energy and American Society– Thirteen Myths. Sovacool, B. K. and Brown, M. A. (eds.) Energy and American Society – Thirteen Myths. New York: Springer Publishing Company.
Koneswaran, G., and Nierenberg, D. Global farm production and global warming: impacting and mitigating climate change. Environmental Health Perspectives 116 (5) (May 2008). http://www.ehponline.org/members/2008/11034/11034.pdf
Lal, R., J.M. Kimble, R.F. Follett, and C.V. Cole. 1998. The Potential of U.S. Cropland to Sequester Carbon and Mitigate the Greenhouse Effect. Boca Raton, FL: CRC Press.
Lewandrowski, J., M. Peters, C. Jones, R. House, M. Sperrow, M. Eve, and K. Paustian. 2004. Economics of Sequestering Carbon in the U.S. Agricultural Sector. Technical Bulletin Number
1909. Washington, DC: U.S. Department of Agriculture, Economic Research Service.
Murphy L. and P. Edwards. 2003. Bridging the Valley of Death: Transitioning from Public to Private Sector Financing, Golden, CO: National Renewable Energy Laboratory. http://www.cleanenergystates.org/CaseStudies/NREL-Bridging_the_Valley_of_Death.pdf
National Academy of Engineering (NAE). 2004. The Hydrogen Economy: Opportunities, Costs, Barriers, and R&D Needs. Washington, DC: The National Academies Press. http://www.nap.edu/books/0309091632/html/
National Energy Technology Laboratory (NETL). 2007. “Cost and Performance Baseline for Fossil Energy Plants, Volume 1: Bituminous Coal and Natural Gas to Electricity,” p.12, Exhibit ES-7. http://www.netl.doe.gov/energy-analyses/pubs/Bituminous%20Baseline_Final%20Report.pdf
National Renewable Energy Laboratory (NREL). 2002. “Proceedings of the 2002 U.S. DOE Hydrogen and Fuel Cells Annual Program/Lab R&D Review, May 6-10, 2002, Golden, Colorado.” Golden, CO, NREL/CP-610-32405. http://www.nrel.gov/docs/fy02osti/32405.pdf
National Renewable Energy Laboratory (NREL). 2008. “Learning about Renewable Energy-Biofuels.” http://www.nrel.gov/learning/re_biofuels.html (accessed December 2008)
North American Electric Reliability Corporation (NERC). 2007. 2007 Long-Term Reliability Assessment: 2007–2016. Princeton, NJ: NERC.
North Carolina State University. 2008. North Carolina Solar Center. “Database of State Incentives for Renewables & Efficiency (DSIRE).” www.dsireusa.org/index.cfm?EE=1&RE=1 (accessed December 2008).
Northeast Advanced Vehicle Consortium. “Northeast Advanced Vehicle Consortium: Advanced Transportation for the Northeast.” http://www.navc.org (accessed December 2008)

Strategies for Commercialization and Deployment
120
Nuclear Energy Institute. 2006. “Top Ten Reasons Nuclear Power is Vital to America’s Energy Policy.” http://www.nei.org/documents/Top_10_Reasons_To_Support_Nuclear.pdf
Nuclear Energy Institute. 2008. “Emissions Avoided by the U.S. Nuclear Industry 1995–2007.” http://www.nei.org/filefolder/Emissions_Avoided_by_the_US_Nuclear_Industry_Yearly.xls
Ogden, J.M. 1999. “Prospects for Building a Hydrogen Energy Infrastructure,” chapter in Annual Review of Energy and the Environment, vol. 24, pp. 227–79.
Ogden, J.M. 2002. “Hydrogen: The Fuel of the Future?” Physics Today, Vol. 55, No. 4, p. 69-74.
Pacala, Stephen W. and Robert H. Socolow. 2004. “Stabilization Wedges: Solving the Climate Problem for the Next 50 Years with Current Technologies,” Science 305: 968-972.
Painuly, J.P. 2001. “Barriers to Renewable Energy Penetration. A Framework for Analysis.” Renewable Energy, Vol. 24.
Pelamis Wave Power Ltd. “Pelamis Wave Power.” http://www.pelamiswave.com/index.php (accessed January 2009)
Pew Center on Global Climate Change. “Vehicle Greenhouse Gas Emissions Standards.” http://pewclimate.org/what_s_being_done/in_the_states/vehicle_ghg_standard.cfm (accessed December 2008).
Ratafia-Brown, J.A., Manfredo, L., Hoffmann, J. et al. 2002. An Environmental Assessment of IGCC Power Systems, Presented at the Nineteenth Annual Pittsburgh Coal Conference, September 23 – 27, 2002. http://www.netl.doe.gov/technologies/coalpower/gasification/pubs/pdf/18.pdf
REN21 2008. “Renewables Global Status Report 2008 Update.” Paris: REN21 Secretariat and Washington, DC: Worldwatch Institute. http://www.ren21.net/globalstatusreport/download/ RE_GSR_2008_Update.pdf
Renewable Fuels Association. 2006. The Enhanced Small Ethanol Producer Tax Credit I.R.C. Sec.
40(b)(3). http://www.ethanolrfa.org/policy/regulations/federal/septc/documents/SEPTCPublication0601.pdf
Taylor, Jerry and Peter Van Doren. 2007. Energy Myth Five – Price Signals are Insufficient to induce Efficient Energy Investments, in Benjamin K. Sovacool and Marilyn A. Brown, eds., Energy and American Society – Thirteen Myths, New York: Springer, pp. 125-144.
Teresko, John. 2007. “The Hydrogen Economy: Lift Trucks First?” Industry Week, July 1.
Tuskan, G.A., and M.E. Walsh. 2001. “Short-rotation Woody Crop Systems, Atmospheric Carbon Dioxide and Carbon Management: a U.S. Case Study.” The Forestry Chronicle 77:259-264.
U.S. Climate Change Science Program (CCSP) and the Subcommittee on Global Change Research. 2003. Strategic Plan for the U.S. Climate Change Science Program. http://www.climatescience.gov/Library/stratplan2003/final/default.htm
U.S. Climate Change Technology Program (CCTP). 2005. Technology options for the near and long term. Washington, DC: U.S. Department of Energy. http://www.climatetechnology.gov/library/2005/tech-options/index.htm
U.S. Climate Change Technology Program (CCTP). 2006. Strategic Plan. Washington, DC: U.S. Department of Energy, DOE/PI-005. http://www.climatetechnology.gov
U.S. Department of Agriculture (USDA). 1998. Precision Agriculture: Information Technology for Improved Resource Use. http://www.ers.usda.gov/publications/agoutlook/apr1998/ao250f.pdf
U.S. Department of Agriculture (USDA). 2005. Natural Resources Conservation Service (NRCC). “Conservation Security Program Fact Sheet.” http://www.nrcs.usda.gov/Programs/csp/ pdf_files/csp_fs3_05.pdf
U.S. Department of Agriculture (USDA). 2006. Energy Estimator, Energy Consumption

Glossary January 2009
121
Awareness Tool, http://nfat.sc.egov.usda.gov/Help.aspx
U.S. Department of Energy (DOE). “Loan Guarantee Program―Program Background and Features.” http://lgprogram.energy.gov/features.html (accessed December 2008).
U.S. Department of Energy (DOE). 2002. National transmission grid study. Washington, DC: U.S. Department of Energy. http://www.pi.energy.gov/pdf/library/TransmissionGrid.pdf
U.S. Department of Energy (DOE). 2004. Frio Formation Test Well Injected With Carbon Dioxide. http://www.fossil.energy.gov/news/techlines/2004/tl_frio_injection.html
U.S. Department of Energy (DOE). 2005. Energy Efficiency and Renewable Energy, Building Technologies Program Multi-Year Program Plan, Research, Development, and Demonstration Plan: Planned Program Activities for 2006 – 2011. http://www.eere.energy.gov/buildings/ about/mypp_2006.html
U.S. Department of Energy (DOE). 2006a. Hearing on “U.S. Department of Energy’s Climate Change Technology Program Strategic Plan.” http://www.climatetechnology.gov/library/2006/testimony20sep2006.htm
U.S. Department of Energy (DOE). 2006b. Hydrogen Posture Plan, an Integrated Research, Development, and Demonstration Plan. Washington, DC: U.S. Department of Energy. http://www.hydrogen.energy.gov/pdfs/hydrogen_posture_plan_dec06.pdf
U.S. Department of Energy (DOE). 2006c. “Carbon Sequestration Technology Roadmap and Program Plan 2006” p. 11-12. http://www.fossil.energy.gov/sequestration/publications/ programplans/2006/2006_sequestration_roadmap.pdf
U.S. Department of Energy (DOE). 2006d. “Independent Review of Distributed Hydrogen Production from Natural Gas,” Golden, CO: National Renewable Energy Laboratory,
NREL/BK-150-40382. http://www.hydrogen.energy.gov/pdfs/40382.pdf
U.S. Department of Energy (DOE). 2007a. Energy Efficiency and Renewable Energy. Buildings Energy Data Book. http://buildingsdatabook.eren.doe.gov/
U.S. Department of Energy (DOE). 2007b. Energy Efficiency and Renewable Energy. Energy Technology Solutions: Public-Private Partnerships Transforming Industry. Washington DC: U.S. Department of Energy. http://www1.eere.energy.gov/industry/bestpractices/pdfs/itp_successes.pdf
U.S. Department of Energy (DOE). 2008a. Energy Efficiency and Renewable Energy. Hydrogen, Fuel Cells & Infrastructure Technology Program. “Hydrogen Production.” http://www1.eere.energy.gov/ hydrogenandfuelcells/production/
U.S. Department of Energy (DOE). 2008b. Hydrogen Program. “Early Markets: Fuel Cells for Backup Power.” http://www1.eere.energy.gov/hydrogenandfuelcells/education/pdfs/early_markets_backup _power.pdf
U.S. Department of Energy (DOE). 2008c. Energy Efficiency and Renewable Energy. Hydrogen, Fuel Cells & Infrastructure Technology Program. “Fuel Cells.” http://www1.eere.energy.gov/ hydrogenandfuelcells/fuelcells/
U.S. Department of Energy (DOE). 2008d. Energy Efficiency and Renewable Energy. Hydrogen, Fuel Cells & Infrastructure Technology Program. “Hydrogen Delivery.” http://www1.eere.energy.gov/ hydrogenandfuelcells/delivery/current_technology.html
U.S. Department of Energy (DOE). 2008e. Energy Efficiency and Renewable Energy. “The Green Power Network.” www.eere.energy.gov/greenpower (accessed December 2008).
U.S. Department of Energy (DOE). 2008f. “Enhanced Oil Recovery/CO2 Injection.”

Strategies for Commercialization and Deployment
122
http://www.fossil.energy.gov/programs/oilgas/eor/index.html (accessed December 2008)
U.S. Department of Energy (DOE). 2009a. Figure provided by DOE Hydrogen Program via email correspondence, January 2006.
U.S. Department of Energy (DOE). 2009b. “Installed U.S. Wind Capacity and Wind Project Locations.” http://www.windpoweringamerica.gov/wind_installed_capacity.asp (accessed January 2009)
U.S. DOE Nuclear Energy Research Advisory Committee (BERAC) and the Generation IV International Forum (GIF). 2002. “A Technology Roadmap for Generation IV Nuclear Energy Systems.” http://gif.inel.gov/roadmap/pdfs/gen_iv_roadmap.pdf
U.S. Department of State. 2006. U.S. Climate Action Report – 2006: Fourth National Communication of the United States of America under the United Nations Framework Convention on Climate Change. http://www.state.gov/g/oes/rls/rpts/car/
U.S. Department of Transportation (DOT). 2002. Freight analysis framework. Washington, DC: Federal Highway Administration.
U.S. Environmental Protection Agency (EPA). “State Best Practices.” http://www.epa.gov/cleanenergy/energy-programs/state-and-local/state-best-practices.html (accessed December 2008)
U.S. Environmental Protection Agency (EPA). 2005. Greenhouse Gas Mitigation Potential in U.S. Forestry and Agriculture. Washington, DC. EPA 430-R-05-006.
U.S. Environmental Protection Agency (EPA). 2006. Global Anthropogenic Non-CO2 GHG Emissions: 1990-2020. USEPA 430-R-06-005. http://www.epa.gov/nonco2/econ-inv/international.html#global_anthropogenic
U.S. Environmental Protection Agency (EPA). 2007a. Inventory of U.S. Greenhouse Gas Emissions and Sinks: 1990-2005. USEPA 430-R-07-002. http://www.epa.gov/climatechange/emissions/ usinventoryreport.html
U.S. Environmental Protection Agency (EPA). 2007b. Office of Air and Radiation. Coal mine methane ownership issues. Coalbed Methane Extra (Fall 2007). EPA-430-N-00-004. http://www.epa.gov/cmop/docs/fall_2007.pdf
U.S. Environmental Protection Agency (EPA). 2008. Inventory of U.S. Greenhouse Gas Emissions and Sinks: 1990-2006. USEPA 430-R-08-005. http://www.epa.gov/climatechange/emissions/usinventoryreport.html
U.S. Government Accountability Office (GAO). 2006. “Report to Congressional Requesters. Department of Energy: Key Challenges Remain for Developing and Deploying Advanced Energy Technologies to Meet Future Needs.” GAO-07-106.
U.S. Nuclear Regulatory Commission (NRC). 2008a. “Design Certification Applications for New Reactors.” http://www.nrc.gov/reactors/new-reactors/design-cert.html (accessed December 2008)
U.S. Nuclear Regulatory Commission (NRC). 2008b. “Backgrounder on New Nuclear Plant Design.” http://www.nrc.gov/reading-rm/doc-collections/fact-sheets/new-nuc-plant-des-bg.html (accessed December 2008)
U.S. Nuclear Regulatory Commission (NRC). 2008c. “Early Site Permit Applications for New Reactors.” http://www.nrc.gov/reactors/new-reactors/esp.html (accessed December 2008)
Verdant Power. 2008. “The RITE Project.” http://www.verdantpower.com/what-initiative (accessed December 2008)
World Nuclear Association (WNA). 2006. Plans for New Reactors Worldwide. http://www.world-nuclear.org/info/inf17.htm

Glossary January 2009
123
Glossary
Alternative Fuel Vehicles (AFVs): AFVs can run on non-petroleum fuels (e.g., ethanol, propane, natural gas) and enable higher combustion efficiencies that reduce GHG emissions.
Biodiesel: Biodiesel refers to a non-petroleum-based diesel fuel consisting of short chain alkyl (methyl or ethyl) esters, made by transesterification of vegetable oil, which can be used (alone, or blended with conventional petrodiesel) in unmodified diesel-engine vehicles.
Bioreactor Landfill: Bioreactor landfilling is a process in which water and air are circulated into a specially designed landfill, in order to cause accelerated biological decomposition of the waste material.
Climate Action Plan (CAP): Plans to help states identify and evaluate feasible and effective policies to reduce their greenhouse gas emissions through a combination of public and private sector policies and programs.
Climate (Greenhouse Gas Reduction) Registry: Reporting program or database used to document greenhouse gas emissions levels and voluntary or mandatory actions that reduce emissions of greenhouse gases or remove greenhouse gases from the atmosphere.
Commercialization: Sequence of actions necessary to achieve market entry and general market competitiveness of new innovative technologies, process, and products.
Carbon Capture: The capture of CO2 emissions from large point sources, such as coal-based power plants, oil refineries, and industrial processes.
Carbon Sequestration: The process of increasing the carbon content of a natural CO2 sink other than the atmosphere.
Carbon Storage: The intentional deposition and management of CO2 in geologic formations or other storage media.
Corporate Average Fuel Economy Standards (CAFE): CAFE regulations were first enacted in the U.S. in 1975 to improve the average fuel economy of cars and light trducks in the wake of the 1973 Arab Oil Embargo. Historically, it is the sales-weighted harmonic mean fuel economy, expressed in miles per gallon (mpg), of a manufacturer's fleet of current model year passenger cars or light trucks with a gross vehicle weight rating of 8,500 pounds (3,856 kg) or less, manufactured for sale in the United States. CAFE standards were recently tightened for the first time in over 20 years.
Deployment: The selection and use of a commercially available technology-based product or service in normal operations by businesses, individuals, or government agencies.
Deployment Activities: Government policies and programs intended to accelerate the diffusion and adoption of technologies or practices to achieve desired public policy goals.
End-Use Technologies: Technologies that are aimed at reducing the use (efficiency improvements and fuel replacement) of GHG-emitting energy sources in the building, industry, and transportation sectors thereby reducing GHG emissions. This also includes technologies that reduce GHG emissions directly from industrial processes. Additionally, technologies that improve the electric infrastructure (grid) contribute to reduced GHG emissions by reducing

Strategies for Commercialization and Deployment
124
line losses (efficiency) and improving access to carbon-free electric generation.
Energy Efficiency Resource Standards (EERS): Mechanism to encourage more efficient generation, transmission, and use of electricity and natural gas. State public utility commissions or other regulatory bodies set electric and/or gas energy savings targets for utilities, often with flexibility to achieve the target through a market-based trading system. All EERS include end-use energy savings improvements; in some cases, distribution system efficiency improvements and combined heat and power (CHP) systems and other high-efficiency distributed generation systems are included as well.
ENERGY STAR®: ENERGY STAR is labeling program that identifies energy efficient consumer products. It was created in 1992 and is jointly run by EPA and DOE.
Energy Supply Technologies: Technologies characterized by low- or net-zero CO2 emissions. These include: low-emission, fossil-based power, renewable energy (solar, wind, hydro, biomass, & geothermal), nuclear fission, and fusion energy. These can be combined with technologies for improved energy carriers (electricity, hydrogen and low-carbon fuels).
Externality: Externality exists when the action of an individual or a firm affects the production or consumption of another party, with no market mechanism for compensating for the action. When the impact is positive, it is referred to as external economy or external benefit, however, when the impact is negative, it is referred to as external diseconomy or external cost.
Flexfuel: A flexfuel, flexible-fuel vehicle (FFV), or dual-fuel vehicle is an automobile with a multi-fuel engine that can typically use different sources of fuel which are either mixed in the same tank or with separate tanks and fuel systems for each fuel. A common example is a vehicle that can accept gasoline mixed with varying levels of bioethanol (gasohol).
Fuel Efficiency: In the context of transportation, “fuel efficiency” commonly refers to the energy efficiency of a particular vehicle model, where its total output (range, or “mileage”) is given as a ratio of range units per a unit amount of input fuel (gasoline, diesel, etc.). This ratio is given in “miles per gallon” (mph) in the U.S.
Geothermal Power: Geothermal power (from the Greek words geo, meaning earth, and thermal, meaning heat) is energy generated by heat stored beneath the Earth's surface or the collection of absorbed heat in the atmosphere and oceans.
Global Warming Potential (GWP): The GWP is the relative ability of a gas to trap heat in the atmosphere over a given timeframe, compared to the CO2 reference gas (per unit weight). GWP values allow for a comparison of the impacts of emissions and reductions of different gases, although they typically have an uncertainty of ±35 percent (EPA 2005). The choice of timeframe is significant and can change relative GWPs by orders of magnitude. All non-CO2 gases are compared to CO2, which has a GWP of one. The GWPs of other GHGs, using a 100-year time horizon, range from 23 for methane to 22,200 for SF6.
Green Pricing: Optional utility service that allows customers of traditional utilities to support a greater level of utility investment in renewable energy by paying a premium on their electric bill to cover any above-market costs of acquiring renewable energy resources.
Greenhouse Gases (GHGs): Water vapor, carbon dioxide (CO2), nitrous oxide (N2O) methane (CH4), and ozone (O3) are the primary GHGs in the Earth’s atmosphere. In addition, there are a number of entirely human-made GHGs in the atmosphere, such as the halocarbons and other chlorine- and bromine-containing substances, dealt with under the Montreal Protocol. Besides CO2, N2O, and CH4, the Kyoto Protocol deals with the GHGs sulphur hexafluoride (SF6), hydrofluorocarbons (HFCs), and perfluorocarbons (PFCs).
Greenhouse Gas Emissions Target: Targets refer to the emission levels or emission rates set as goals for countries, sectors, companies, or facilities. When these goals are to be reached by specified years, the years at which goals are to be met are referred to as the timetables. In the Kyoto Protocol, a target is the percent reduction from the 1990 emissions baseline that the country has agreed to.
Greenhouse Gas Intensity: The ratio of greenhouse gas emissions to economic output.
HVAC: An abbreviation for the heating, ventilation, and air-conditioning system; the system or systems that condition air in a building. Building systems

Glossary January 2009
125
compete based on their ability to provide thermal comfort, acceptable indoor air quality, and reasonable installation, operation, and maintenance costs.
Hybrid Electric Vehicles (HEVs): HEVs use a combination of electric and mechanical power to reduce greenhouse gas (GHG) emissions by nearly one-half compared to conventional gasoline vehicles.
Hydroelectric Power: Hydropower or hydraulic power is the force or energy of moving water. Hydroelectric power now supplies about 715,000 MWe or 19 percent of world electricity.
Imperfect Information: Lack of information about technology performance; bundled benefits; decision-making complexities; high cost of gathering and processing information; lack of public consensus about global climate change and its causes.
Infrastructure Limitation: Infrastructure limitations inhibit the market penetration of low-carbon transportation fuels in many regions and urban markets. Examples include lack of pipelines, refueling stations, and other distribution channels for alternative fuels.
Intelligent Transportation Systems (ITS): Intelligent transportation system refers to efforts to add information and communications technology to transport infrastructure and vehicles in an effort to manage factors that typically are at odds with each other, such as vehicles, loads, and routes, to improve safety and reduce vehicle wear, transportation times, and fuel consumption.
Oil Sands: Oil sands or tar sands are technically described as bituminous sands. The sands are naturally occurring mixtures of sand or clay, water, and an extremely dense and viscous form of petroleum called bitumen. They are found in large amounts in many countries throughout the world, but are found in extremely large quantities in Canada and Venezuela. Oil sands may represent as much as two-thirds of the world's total petroleum resource, with at least 1.7 trillion barrels (270×109 m3) in the Canadian Athabasca Oil Sands and perhaps 235 billion barrels (37×109 m3) of extra heavy crude in the Venezuelan Orinoco tar sands.
Oil Shale: Oil shale, a fine-grained sedimentary rock, contains significant amounts of kerogen (a solid mixture of organic chemical compounds), from which technology can extract liquid hydrocarbons. It
requires more processing than crude oil, which affects its economic viability as a crude oil substitute. Deposits of oil shale are located around the world, including major deposits in the United States of America. Global deposits are estimated as equivalent to 2.8 trillion to 3.3 trillion barrels (450×109 to 520×109 m3) of recoverable oil.
Organisation for Economic Co-operation and Development (OECD): OECD is an international organization of thirty countries that accept the principles of representative democracy and free market economy.
Market Failure: Market failure occurs when freely functioning markets, operating without government intervention, fail to deliver an efficient or optimal allocation of resources, such that economic and social welfare may not be maximized, leading to a loss of allocative and productive efficiency. This is usually because the benefits that the market confers on individuals or firms carrying out a particular activity diverge from the benefits to society as a whole.
Market Risks: The risks associated with uncertainties regarding market prices and market demand for inputs, e.g., feed stocks, labor, and products.
Non-CO2 GHGs and Other Gases: Include methane, nitrous oxide, and high-GWP gases, hydrofluorocarbons (HFCs), perfluorocarbons (PFCs), sulfur hexafluoride (SFC6), and tropospheric ozone, tropospheric ozone precursors, and black and organic carbon aerosols.
No-Till Farming: No-till farming is considered a kind of conservation tillage system and is sometimes called zero tillage. It is a way of growing crops from year to year without disturbing the soil through tillage.
Public Benefits Fund: Pool of resources typically created by levying a small fee or surcharge on customers’ electricity rates, which can be used by states to invest in clean energy supply.
Regional Greenhouse Gas Initiatives (RGGI): Cooperative effort between two or more states to reduce greenhouse gas emissions.
Renewable Portfolio Standard (RPS): A policy that requires electricity providers to obtain a

Strategies for Commercialization and Deployment
126
minimum percentage of their power from renewable energy resources by a certain date.
Solar Photovoltaic (PV) Power: Photovoltaics is a technology that converts light directly into electricity. At the end of 2007, according to preliminary data, cumulative global production was 12,400 megawatts.
Technical Risks: The risks associated with inputs to construction, production, and operation, as well as uncertainties regarding system requirements and performance.
Transit Buses: In addition to providing significantly more mileage per passenger than cars and trucks with single passengers, transit buses also use GHG emission-reducing technologies such as compressed natural gas spark-ignited engines and diesel hybrid electric systems.
Urban Heat Island (UHI): An urban heat island is a metropolitan area which is significantly warmer than its surroundings. The main cause of the urban heat island is modification of the land surface by urban development, while waste heat generated by energy usage is a secondary contributor. Partly as a result of the urban heat island effect, monthly rainfall is about 28 percent greater between 20-40 miles downwind of cities, compared with upwind.
Vehicle Greenhouse Gas Standards: Requirements that set specific limits to the amount of greenhouse gasses that can be released into the environment from vehicles.
Wetland: A wetland is an area of land consisting of soil that is saturated with moisture, such as a swamp, marsh, or bog, and are the subject of conservation efforts and Biodiversity Action Plans.
Zero Net Energy Building: A general term applied to a building with a net energy consumption of zero over a typical year through a combination of energy efficient design and systems as well as use of renewable energy technologies to provide power to the building.

Annex A January 2009
A-1
Annex A. Outline of the Inventory of Greenhouse Gas-Reducing Technologies
The following outline lists all technologies and technology categories found in the inventory of greenhouse gas-reducing technologies suitable for commercialization and deployment developed to comply with Title XVI of the Energy Policy Act of 2005. The inventory is available as a spreadsheet. Statutory Requirements Title XVI of the Energy Policy Act of 2005 (EPAct 2005) requires the Department of Energy to produce an inventory of domestic greenhouse gas intensity-reducing technologies that are suitable for commercialization and deployment. Approach Definitions
The U.S. Climate Change Technology Program (CCTP) interpreted the following clauses in order to execute the EPAct 2005 requirements: Suitable for commercialization and deployment. “Suitability” is interpreted as the level of technical maturity that would enable a technology to be commercialized now or in the near future. CCTP identified the technical maturity level using the methodology outlined under “Inventory Structure” below. Suitable technologies do not include those still undergoing bench-scale or pilot-scale testing, but do include those that are already in the market to a limited extent and those that have been successfully demonstrated at a commercial scale. The criteria for suitability exclude barriers that would inhibit market penetration. For example, a technology that has been demonstrated once successfully at a commercial scale but is too expensive at that time for widespread use is still considered suitable, because it is technologically mature. Barriers to further commercialization are addressed in the next section. GHG intensity-reducing technologies. GHG intensity is defined by the EPAct 2005 legislation as the ratio between total annual U.S. GHG emissions and the U.S. gross domestic product (GDP). As was done in the CCTP Strategic Plan, this report focuses on technologies that reduce either GHG emissions or GHG concentrations in the atmosphere. The distinction between absolute reductions and intensity reductions is important. Note, however, that there are not sufficient data on the macroeconomic impacts of the widespread deployment of technologies that reduce GHG emissions to reliably determine the intensity effects of individual technologies.

Strategies for Commercialization and Deployment
A-2
Inventory Structure The technology inventory was structured in the framework illustrated in Table 1.
For simplicity, the technologies are categorized within the framework according to the structure of the CCTP Strategic Plan, which groups all government-sponsored climate change technology R&D into the four broad categories listed in Table 1. Each one of the four categories is then broken down into more detailed technology sub-categories that are largely taken from the CCTP report, Technology Options for the Near and Long Term (2005), which is structured similarly to, but contains greater detail and depth than, the Strategic Plan. CCTP evaluated the technologies and assigned each a technical maturity level (TML) based on technology readiness levels developed by the U.S. Department of Defense (DoD) and National Aeronautics and Space Administration (NASA). Because some of the inventory sub-categories are aggregates of several technologies and because second or third generations are being developed for some technologies, CCTP assigned a range of technical maturity levels to each category or sub-category. For example, compact fluorescent light bulbs (CFL) are widely available commercially, justifying a high-end maturity score of 5 on the TML (DOE-CCTP) scale. However, researchers are currently developing the next generation of CFLs that are more efficient and have improved color rendition. Thus, CFLs are assigned a TML range from 2 to 5.81 Technologies with a TML score of 4 or 5 are considered to be suitable for commercialization and deployment because their readiness has been validated in a real-world environment. Those with lower scores were not considered to be mature enough for commercialization. It should be emphasized that a TML score of 4 or 5 does not imply any specific degree of commercialization or deployment, although some technologies with these scores have been commercialized and deployed to some extent. This score simply means that they are technologically mature enough for full operational use in the near term. Obstacles that impede commercialization, such as high cost, high risk, or market barriers, are covered in other sections of this report.
81 For expediency and an increased focus on technologies available for commercialization and deployment in the near term, scores of 1, 2, and 3 were consolidated into a single category called “1-3”.
Table 1. Sample Table From GHG Intensity-Reducing Technologies
Category Tech Maturity Level Range
Tech Maturity Level
Justification
References
Reducing Emissions from Energy Use and Infrastructure
Reducing Emissions from Energy Supply
Capturing and Sequestering Carbon
Reducing Potential for Climate Effects of Non-CO2 GHG

Annex A January 2009
A-3
Table 2. Technology Maturity Level
Technical Maturity Level (TML)
Technical Maturity Level Scale DOE-CCTP DoD TRL83 Description82
1. Basic principles observed and reported
Lowest level of technology readiness. Scientific research begins to be translated into applied research and development. An example might include paper studies of a technology's basic properties.
1. Fundamental Research
2. Technology concept and/or application formulated
Invention begins. Once basic principles are observed, practical applications can be invented. Applications are speculative and there may be no proof or detailed analysis to support the assumptions. Examples are limited to analytic studies.
3. Analytical and experimental critical function and/or characteristic proof of concept
Active research and development is initiated. This includes analytical studies and laboratory studies to physically validate analytical predictions of separate elements of the technology. Examples include components that are not yet integrated or representative.
2. Application specific technology development
4. Component and/or breadboard validation in laboratory environment
Basic technological components are integrated to establish that they will work together. This is relatively "low fidelity" compared to the eventual system. Examples include integration of "ad hoc" hardware in the laboratory.
5. Component and/or breadboard validation in relevant environment
Fidelity of breadboard technology increases significantly. The basic technological components are integrated with reasonably realistic supporting elements so it can be tested in a simulated environment. Examples include "high fidelity" laboratory integration of components.
3. Working prototype in validation testing
6. System/ subsystem model or prototype demonstration in a relevant environment
Representative model or prototype system, which is well beyond that of TRL 5, is tested in a relevant environment. Represents a major step up in a technology's demonstrated readiness. Examples include testing a prototype in a high-fidelity laboratory environment or in simulated operational environment.
7. System prototype demonstration in a operational environment
Prototype near or at planned operational system. Represents a major step up from TRL 6, requiring the demonstration of an actual system prototype in an operational environment, such as in a light duty vehicle on the road. Examples include testing a prototype battery in an operational hybrid gas-electric vehicle.
4. System readiness validated
8. Actual system completed and qualified through test and demonstration
Technology has been proven to work in its final form and under expected conditions. In almost all cases, this TRL represents the end of true system development. Examples include developmental test and evaluation of the system in its intended parent system to determine if it meets design specifications.
5.Systems in use and operating
9. Actual system proven through successful mission operations
Actual application of the technology in its final form and under real life conditions, such as those encountered in operational test and evaluation. In almost all cases, this is the end of the last "bug fixing" aspects of true system development. Examples include using the system under various real life conditions.
82 Technical Readiness Level Scale, Department of Defense Directive, 5000.2-R, with minor modifications to reflect energy-related examples. 83 Technical Readiness Level Scale, Department of Defense Directive, 5000.2-R.

Strategies for Commercialization and Deployment
A-4
Technology Inventory Outline Listings in black indicate technologies that CCTP estimates are ready for commercialization in the near term, if it has not been commercialized already. Listings in gray are technologies that CCTP believes are not ready for near-term commercialization.
4.0 Reducing Emissions from Energy Use and Infrastructure 4.1 Transportation 4.1.1 Light Vehicles - Hybrid, Fuel Cell and Alternative-Fuel Vehicles 4.1.1.1 Hybrid Electric Vehicles and Powertrain Components (Electronics, Storage, Motors) 4.1.1.2 Plug-in Hybrid Electric Vehicle (HEV) or All Electric-Vehicles 4.1.1.3 Fuel Cell Vehicles 4.1.1.4 Advanced Conventional Vehicles 4.1.1.4.1 Compression-Ignition Direct-Injection (CIDI) 4.1.1.4.2 Lean Combustion — Homogeneous Charge Compression Ignition (HCCI) 4.1.1.4.3 Gasoline Direct-Injection 4.1.1.5 Alternative-Fuel Vehicles 4.1.1.5.1 Natural Gas or Propane Powered Vehicles 4.1.1.5.2 Alcohol-Gasoline Flexfuel Light Duty Vehicles 4.1.1.5.3 Biodiesel Light Duty Vehicles 4.1.1.5.4 Hydrogen Internal Combustion Engine (ICE) - Fuel Cell Hybrid 4.1.1.6 Lightweighting Materials Technologies that Can Reduce Vehicle Weight 4.1.1.6.1 Automotive Metals 4.1.1.6.2 Low-Cost Carbon Fiber 4.1.1.6.3 Polymer Composites 4.1.1.6.4 Recycling 4.1.2 Heavy Vehicles 4.1.2.1 High-Pressure, Common-Rail Fuel Injection 4.1.2.2 Bottoming Cycle Systems 4.1.2.3 Friction and Wear Reduction 4.1.2.4 Software Technology to Improve Vehicle Aerodynamics 4.1.2.5 Advanced Power Electronics 4.1.2.6 Energy Storage 4.1.2.7 Hybrid Powertrains 4.1.2.8 Lightweight Materials Technologies 4.1.3 Fuels for Advanced Combustion Engines 4.1.3.1 Low-Sulfur Diesel Fuel that Allows More Efficient Emissions Control 4.1.3.2 Diesel Fuel Produced from Expected Heavier and Sourer Crude Oil Feedstocks 4.1.3.3 Diesel Fuel Produced from Oil Sands, Shale Oil 4.1.3.4 Biodiesel Produced from Vegetable Oils and Waste Fats 4.1.3.5 Fischer-Tropsch (FT) Diesel Produced from Natural Gas, Biomass and Coal 4.1.4 Intelligent Transportation Systems (ITS) Infrastructure 4.1.4.1 Adaptive Traffic Signal-Control Systems and Freeway Management Systems 4.1.4.2 Incident Management Systems

Annex A January 2009
A-5
4.1.4.3 Intelligent Transportation Systems (ITS) Applications for Intermodal Freight 4.1.4.4 Traveler Information/Navigation Systems 4.1.4.5 Electronic Screening of Commercial Vehicles 4.1.4.6 Electronic Toll Collection (ETC) 4.1.5 Aviation 4.1.5.1 Alternate Fuel Ground Support Equipment (GSE) and Airport Ground Access Vehicles 4.1.5.2 Advanced Propulsion Concepts 4.1.5.3 New Aircraft Materials and Design Practices Continue to Reduce Aircraft Empty Weight 4.1.5.4 Information Technology and Management Science Advances 4.1.6 Transit Buses - Urban Duty Cycle, Heavy Vehicles 4.1.6.1 Compressed Natural Gas Spark-Ignited Engines 4.1.6.2 Diesel Hybrid Electric Systems with Current Energy Storage Technologies 4.1.6.3 Exhaust After-Treatment Technology for Both NOx and Particulates 4.1.7 Marine Vessels 4.1.7.1 Hydrodynamics 4.1.7.2 Propulsion Systems 4.1.7.3 Ship Lightweighting 4.1.8 Rapid Public Transport Systems 4.2 Buildings 4.2.1 Commercial and Residential Building Energy Systems 4.2.1.1 Envelope Design 4.2.1.1.1 Windows and doors - dynamic response, highly insulating façade systems, and natural lighting technologies/designs 4.2.1.1.2 Roofs, walls, and foundations - advanced/energy efficient designs; high-performance advanced/vacuum insulation components and systems 4.2.1.2 Component Systems 4.2.1.2.1 Heating, cooling, ventilation, and water heating 4.2.1.2.1.1 Central systems 4.2.1.2.1.2 Packaged (rooftop) units 4.2.1.2.1.3 Water heating/fan coil units 4.2.1.2.1.4 Indoor Air Quality 4.2.1.2.2 Lighting 4.2.1.2.2.1 High efficiency conventional technologies 4.2.1.2.2.2 IC fixtures, controls, and distribution systems 4.2.1.2.2.3 Solid state lighting 4.2.1.2.2.4 Daylighting 4.2.1.2.3 Other energy demands 4.2.1.2.3.1 Office equipment and plug loads 4.2.1.2.3.2 Other building-specific "process" loads 4.2.1.2.4 Energy supply-integration with buildings 4.2.1.3 Building performance and commissioning 4.2.1.3.1 Building diagnostic, information and monitoring systems 4.2.1.4 Integrated Building Concepts (systems integration) 4.2.1.4.1 High performance buildings

Strategies for Commercialization and Deployment
A-6
4.2.1.4.2 Whole building energy simulation tools - EnergyPlus 4.2.2 Urban Heat Island Technologies 4.2.2.1 Shading 4.2.2.2 Paving Technologies 4.3 Industry 4.3.1 Energy Conversion and Utilization 4.3.1.1 High-Efficiency Burners and Boilers 4.3.1.1.1 Radiation Stabilized Burner 4.3.1.1.2 Callidus Ultrablue Cub Burner 4.3.1.1.3 Spyrocor™ Radiant Tube Heater Inserts 4.3.1.1.4 Forced Internal Recirculation Burner 4.3.1.1.5 M-Pakttm Ultra-Low NOx Burners 4.3.1.1.6 Process Heater System 4.3.1.1.7 Super Boiler 4.3.1.2 Energy Utilization 4.3.1.2.1 Industrial Combined Heat and Power Systems 4.3.1.2.2 Material Preheating Systems 4.3.1.2.3 Waste Heat Recovery 4.3.2 Resource Recovery and Utilization 4.3.2.1 Recovery Technologies 4.3.2.2 Reuse Technologies 4.3.2.3 Fundamental Chemistry to Allow Use of Carbon Dioxide as Feedstocks 4.3.3 Industrial Process Efficiency (by Industry) 4.3.3.1 Aluminum Industry 4.3.3.2 Chemicals Industry 4.3.3.3 Forest Products Industry 4.3.3.4 Glass Industry 4.3.3.5 Metal Casting Industry 4.3.3.6 Mining Industry 4.3.3.7 Steel Industry 4.3.3.8 Cement and Other Industries 4.3.4 Enabling Technologies for Industrial Processes 4.3.4.1 Advanced Materials 4.3.4.1.1 H-Series Cast Austenitic Stainless Steels 4.3.4.1.2 Ceramic and Refractory Low-Permeability Components for Aluminum Melting and Casting 4.3.4.1.3 Zirconia Coating for High Pressure Die Casting Process 4.3.4.1.4 Nickel Aluminide (Ni3Al) Intermetallic: Heat and Corrosion Resistant Alloys 4.3.4.1.5 Improved Composite Tubes for Kraft Recovery Boilers 4.3.4.1.6 Chromium Tungsten Alloys for Reaction Vessels 4.3.4.1.7 Advanced Weld Overlays 4.3.4.1.8 Materials for High-Temperature Black Liquor Gasification 4.3.4.2 Sensors, Controls, and Automation Enable More Robust Industrial Process Operations 4.3.4.2.1 Parallel Beam X-Ray Diffraction (XRD) System

Annex A January 2009
A-7
4.3.4.2.2 Fiber Optic Sensor for Combustion Measurement and Control 4.3.4.2.3 Fiber Sizing Sensor and Controller 4.3.4.2.4 Solid-State Sensors for Monitoring Hydrogen 4.3.4.2.5 On-Line Laser-Based Ultrasonic Thickness (LUT) Gauge 4.3.4.2.6 Multigas™ Analyzer 4.3.4.2.7 Emerging Sensors and Control 4.3.4.3 Other Enabling Technologies 4.4 Electric Grid and Infrastructure 4.4.1 High-Temperature Superconductivity 4.4.1.1 HTS Cable 4.4.1.2 HTS Transformer 4.4.1.3 HTS Fault Current Limiters 4.4.1.4 HTS Motors 4.4.1.5 HTS Generators 4.4.1.6 HTS Flywheel System 4.4.2 Transmission and Distribution (T&D) Technologies 4.4.2.1 Composite-Core, Low-Sag Transmission Conductors 4.4.2.2 Real-Time Grid Operations Using Measured Data and Automatic, Intelligent Controllers 4.4.2.3 High-Voltage DC Transmission (HVDC) 4.4.3 Distributed Generation and Combined Heat and Power 4.4.3.1 Advanced Industrial Turbines and Microturbines 4.4.3.2 Energy-Storage Systems 4.4.3.3 Concentrating Solar Power 4.4.3.4 Fuel Cells 4.4.3.5 Natural Gas Engines 4.4.3.6 Photovoltaic (PV) Systems 4.4.3.7 Hybrid Systems 4.4.3.8 Wind Energy Systems 4.4.4 Energy Storage 4.4.4.1 Pumped Hydro 4.4.4.2 Compressed Gas 4.4.4.3 Superconducting Magnetic Energy Storage (SMES) 4.4.4.4 Batteries 4.4.4.5 Flywheels 4.4.4.6 Ultracapacitors 4.4.5 Sensors, Controls, IT, and Communications 4.4.5.1 Sensors 4.4.5.2 Controls 4.4.5.3 Communications 4.4.5.4 Information Technology 4.4.6 Power Electronics 4.4.6.1 Megawatt-Level Inverters 4.4.6.2 Fast Semiconductor Switches

Strategies for Commercialization and Deployment
A-8
5.0 Reducing Emissions from Energy Supply 5.1 Low-Emission, Fossil-Based Fuels and Power 5.1.1 Coproduction/Hydrogen 5.1.1.1 Gasifiers for Solid Feedstocks 5.1.1.1.1 285-MWe Coal-Based Transport Gasifier 5.1.1.2 Partial Oxidation (POX) Reformers for Natural Gas Feedstock 5.1.1.3 Shift Reactors 5.1.1.4 Hydrogen-Fueled Combustion Turbines 5.1.1.4.1 Hydrogen Turbines for IGCC power plants 5.1.1.4.2 Turbines and Combustors for Oxy-Fuel Rankine Cycle Systems 5.1.1.4.3 High Efficiency Zero-Emission Hydrogen Combustion Technology for MW-Scale Turbines 5.1.1.5 Steam Turbines for Combined Cycle Power Generation 5.1.1.6 Fischer-Tropsch Reactors and Product Recovery Train 5.1.1.6.1 Coal Waste to FT Fuels 5.1.1.7 Physical Solvent-Based Absorption System for CO2 Recovery 5.1.1.8 Cryogenic Oxygen Separation 5.1.1.9 Ion Transport Membranes (ITM) for O2 Separation and Ceramic Membranes for H2 Recovery 5.1.1.10 Solid-Oxide Fuel Cells (SOFC) 5.1.1.11 CO2 Compression and Drying System 5.1.2 Advanced Power Systems 5.1.2.1 Integrated Gasification Combined Cycle (IGCC) 5.1.2.2 Advanced Combustion Systems 5.1.2.2.1 Advanced Combustion/Gasification Hybrid Technology 5.1.2.2.2 Oxygen-Enhanced Combustion 5.1.2.2.3 Lignite Fuel Enhancement through Drying Using Waste Heat 5.1.2.2.4 Control Systems 5.1.3 Distributed Generation/Stationary Fuel Cells 5.1.3.1 Complete Direct-Cycle Hybrid System 5.1.3.2 Complete Indirect-Cycle Hybrid System 5.2 Hydrogen 5.2.1 Hydrogen Production from Nuclear Fission and Fusion 5.2.1.1 Advanced, High-Temperature Fission Reactors, Alternative and Autothermal Reactors 5.2.1.2 Fusion Reactor Using Gas, Liquid-Metal, or Molten-Salt Cooling 5.2.2 Hydrogen Systems Technology Validation 5.2.3 Hydrogen Production and Distribution Using Electricity and Fossil/Alternative Energy 5.2.3.1 Central Hydrogen Production from Natural Gas and Coal with Carbon Sequestration 5.2.3.2 Central Hydrogen Production from Biomass Gasification 5.2.3.3 Distributed Hydrogen Production from Natural Gas 5.2.3.4 Distributed Hydrogen Production from Bio-Derived Liquids 5.2.3.5 Hydrogen Production from Water Electrolysis 5.2.3.6 Hydrogen Production from Photoelectrochemical Water Splitting 5.2.3.7 Hydrogen Production from Biological Processes 5.2.3.8 Hydrogen Production from Solar-Driven High Temperature Thermochemical Water Splitting
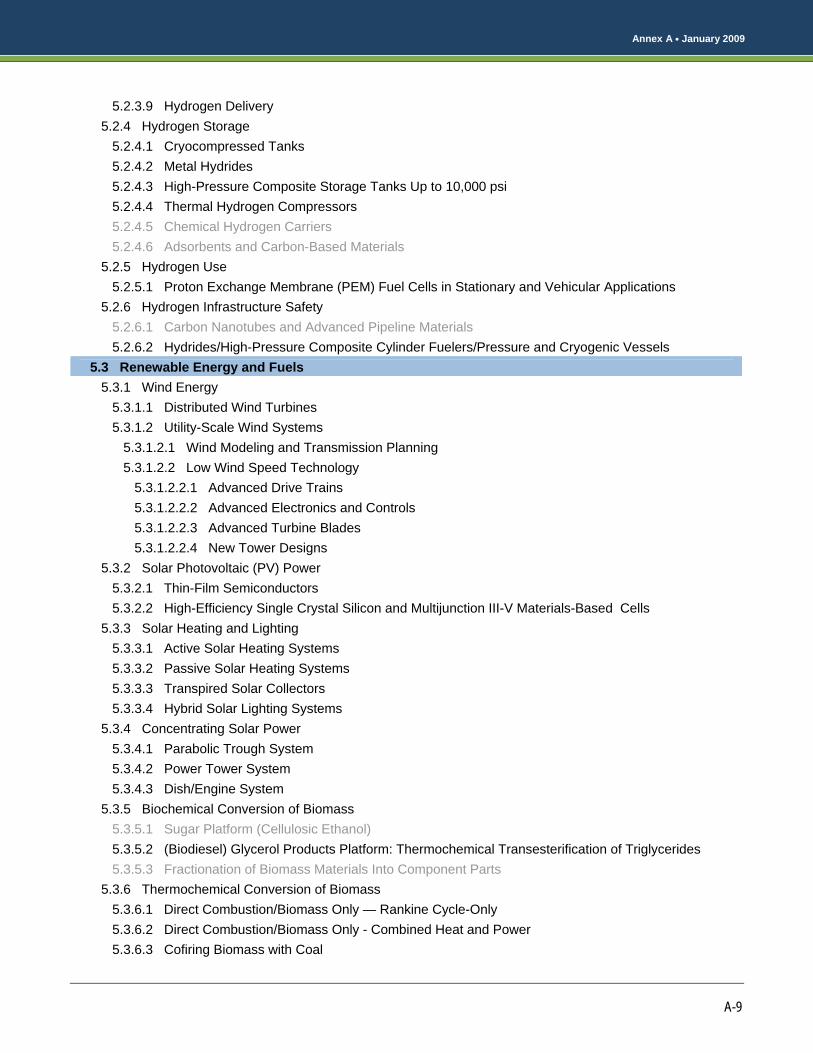
Annex A January 2009
A-9
5.2.3.9 Hydrogen Delivery 5.2.4 Hydrogen Storage 5.2.4.1 Cryocompressed Tanks 5.2.4.2 Metal Hydrides 5.2.4.3 High-Pressure Composite Storage Tanks Up to 10,000 psi 5.2.4.4 Thermal Hydrogen Compressors 5.2.4.5 Chemical Hydrogen Carriers 5.2.4.6 Adsorbents and Carbon-Based Materials 5.2.5 Hydrogen Use 5.2.5.1 Proton Exchange Membrane (PEM) Fuel Cells in Stationary and Vehicular Applications 5.2.6 Hydrogen Infrastructure Safety 5.2.6.1 Carbon Nanotubes and Advanced Pipeline Materials 5.2.6.2 Hydrides/High-Pressure Composite Cylinder Fuelers/Pressure and Cryogenic Vessels 5.3 Renewable Energy and Fuels 5.3.1 Wind Energy 5.3.1.1 Distributed Wind Turbines 5.3.1.2 Utility-Scale Wind Systems 5.3.1.2.1 Wind Modeling and Transmission Planning 5.3.1.2.2 Low Wind Speed Technology 5.3.1.2.2.1 Advanced Drive Trains 5.3.1.2.2.2 Advanced Electronics and Controls 5.3.1.2.2.3 Advanced Turbine Blades 5.3.1.2.2.4 New Tower Designs 5.3.2 Solar Photovoltaic (PV) Power 5.3.2.1 Thin-Film Semiconductors 5.3.2.2 High-Efficiency Single Crystal Silicon and Multijunction III-V Materials-Based Cells 5.3.3 Solar Heating and Lighting 5.3.3.1 Active Solar Heating Systems 5.3.3.2 Passive Solar Heating Systems 5.3.3.3 Transpired Solar Collectors 5.3.3.4 Hybrid Solar Lighting Systems 5.3.4 Concentrating Solar Power 5.3.4.1 Parabolic Trough System 5.3.4.2 Power Tower System 5.3.4.3 Dish/Engine System 5.3.5 Biochemical Conversion of Biomass 5.3.5.1 Sugar Platform (Cellulosic Ethanol) 5.3.5.2 (Biodiesel) Glycerol Products Platform: Thermochemical Transesterification of Triglycerides 5.3.5.3 Fractionation of Biomass Materials Into Component Parts 5.3.6 Thermochemical Conversion of Biomass 5.3.6.1 Direct Combustion/Biomass Only — Rankine Cycle-Only 5.3.6.2 Direct Combustion/Biomass Only - Combined Heat and Power 5.3.6.3 Cofiring Biomass with Coal

Strategies for Commercialization and Deployment
A-10
5.3.6.4 Gasifier-Gas Turbine Combined Cycle of Biomass 5.3.6.5 Biomass Pyrolysis 5.3.7 Biomass Residues 5.3.7.1 Agricultural Residues (Corn Stover, Straws from Wheat, Rice, and Other Grain Crops) 5.3.7.2 Wood Residues Resulting from Lumber, Furniture, and Fiber Production 5.3.7.3 Forest Residues 5.3.7.4 Black Liquors from Pulp Production 5.3.7.5 Animal Wastes from Confined Production of Chickens, Pigs, and Cows 5.3.7.6 Energy from Urban Wood Waste or Municipal Solid Waste 5.3.8 Energy Crops 5.3.8.1 Short Rotation Woody Crops 5.3.8.2 Woody Coppice Crops 5.3.8.3 Perennial Grass Crops 5.3.8.4 Technologies to Increase Yield and Improve Management of Energy Crops 5.3.9 Photoconversion 5.3.9.1 Power Production 5.3.9.2 Fuels Production 5.3.9.3 Materials and Chemicals Production 5.3.9.4 Photobiological Production of Pigments, Food Products, Pesticides, and Drugs 5.3.10 Advanced Hydropower 5.3.10.1 New Turbine Designs that Improve Survivability of Fish that Pass through the Power Plant 5.3.10.2 Auto-Venting Turbines 5.3.10.3 Reregulating and Aerating Weirs 5.3.10.4 Adjustable-Speed Generators 5.3.10.5 New Assessment Methods 5.3.10.6 Advanced Instrumentation and Control Systems 5.3.11 Geothermal Energy 5.3.11.1 Exploration Technologies 5.3.11.2 Resource Characterization and Management 5.3.11.3 Drilling Technologies 5.3.11.4 Geothermal Conversion Systems 5.3.11.5 Enhanced Geothermal Systems 5.3.11.6 Geothermal Direct Use 5.3.11.7 Geothermal Heat Pumps 5.3.11.8 Coproduction of Minerals 5.3.12 Ocean Energy 5.3.12.1 Current Energy 5.3.12.1.1 Barrage or Dam 5.3.12.1.2 Tidal Fence 5.3.12.1.3 Turbine Technology 5.3.12.2 Wave Energy 5.3.12.2.1 Oscillating Water Column (OWC) 5.3.12.2.2 Taper Channel System (Tapchan)

Annex A January 2009
A-11
5.3.12.2.3 Pendulor Device 5.3.12.3 Ocean Thermal Energy Conversion (OTEC) 5.4 Nuclear Fission 5.4.2 Research Under the Generation IV Nuclear Energy Systems Initiative 5.4.1 Research and Development on Nuclear Power Plant Technologies for Near-Term Deployment 5.4.1.1 Certified Advanced Light Water Reactor Designs (ALWR) 5.4.1.1.1 Advanced Boiling Water Reactor (ABWR) 5.4.1.1.2 Advanced Passive AP600 5.4.1.1.3 System 80+ 5.4.1.1.4 AP1000 5.4.1.1.5 Economic Simplified Boiling Water Reactor (ESBWR) 5.4.1.2 Reactor Designs from Overseas for Near-Term U.S. Deployment 5.4.1.2.1 ACR-700 and ACR-1000 5.4.1.2.2 European Pressurized Water Reactor (EPR) 5.4.1.2.3 Advanced Pressurized Water Reactor (APWR) 5.4.3 Advanced Fuel Cycle Initiative (AFCI) 5.5 Fusion Energy 5.5.1 Fusion Energy 6.0 Capturing and Sequestering Carbon 6.1 Carbon Capture 6.1.1 Post-Combustion Capture 6.1.1.1 Amine Scrubbing 6.1.1.2 Carbon Absorbents 6.1.1.3 Sodium Absorbents 6.1.1.4 Lithium Silicate 6.1.1.5 Cryogenic Distillation 6.1.1.6 Membranes (Polymer, Ceramic, Palladium, Mine, or Ionic Liquid Coated) 6.1.1.7 Capture of CO2 from Flue Gas and Algal Conversion to Biomass 6.1.2 Precombustion Decarbonization 6.1.3 Hydrides 6.1.4 Oxy-Fuel Combustion 6.2 Geologic Storage 6.2.1 Storage and Recovery 6.2.1.1 Storage 6.2.1.1.1 Enhanced Mineralization 6.2.1.2 Recovery of Oil or Methane 6.2.1.2.1 Methane Recovery from Coal Beds 6.2.1.2.2 Oil Recovery through CO2 Injection 6.2.2 Surveying 6.2.3 Monitoring, Fate and Transport 6.2.4 Novel Sequestration Systems 6.2.4.1 Geologic Storage and In Situ Biological Conversion to Methane

Strategies for Commercialization and Deployment
A-12
6.3 Terrestrial Sequestration 6.3.1 Land Management 6.3.1.1 Cropland Management and Precision Agriculture 6.3.1.1.1 Conservation Tillage, Especially No-Till 6.3.1.1.2 Residue Management 6.3.1.1.3 Reducing Fallow 6.3.1.1.4 Cover Crops 6.3.1.1.5 Nutrient Management 6.3.1.1.6 Manure and Organic Matter Additions 6.3.1.1.7 Water Management 6.3.1.1.8 Erosion Control 6.3.1.1.9 Advanced Information Technologies for Efficient Application of Management Treatments 6.3.1.1.10 Genetically Modified or Herbicide-Tolerant Crops 6.3.1.1.11 Technologies that Increase Agricultural Productivity 6.3.1.2 Converting Croplands to Reserves and Buffers 6.3.1.2.1 Riparian Buffers 6.3.1.3 Advanced Forest and Wood Products Management 6.3.1.3.1 Global Positioning Satellites and Ground Sensing Systems 6.3.1.3.2 Wood Product Development, Substitution, and Management Pathways 6.3.1.4 Grazing Management 6.3.1.4.1 Alternative Grazing Practice 6.3.1.4.2 Vegetation Management 6.3.1.4.3 Water Management 6.3.1.4.4 Erosion Control 6.3.1.5 Restoration of Degraded Rangelands 6.3.1.5.1 Reestablishment of Vegetation/Vegetation Management 6.3.1.5.3 Restoring Soil Function 6.3.1.6 Wetland Restoration, Management, and Carbon Sequestration 6.3.1.6.1 Restoration of Riparian Zones, Estuaries and Tidal Marshes, and Other Wetland Systems 6.3.1.6.2 Management of Periodically Flooded Rice Fields and Floodplains 6.3.1.6.3 Protection of Wetlands that Might Otherwise Become Large Sources of GHG Emissions 6.3.1.7 Carbon Sequestration on Reclaimed Mined Lands 6.3.2 Biotechnology 6.3.2.1 Modify Plant Chemistry to Improve Soil Carbon Levels 6.3.2.2 Bioengineer Microorganisms to Improve Soil Carbon Levels 6.3.3 Improved Measurement and Monitoring 6.3.3.1 Terrestrial Sensors, Measurements, and Modeling 6.3.3.1.1 Instruments to Measure GHG Fluxes Among Soils, Plants, Animals, and the Atmosphere 6.3.3.1.2 Models to Integrate Spatial and Temporal Variability into a Decision Context 6.3.3.1.3 Distributed Quantification Technologies that Integrate Measurement and Modeling 6.3.3.2 Measuring and Monitoring Systems for Forests 6.3.3.2.1 Forest and Land Inventory Systems 6.3.3.2.2 Aerial, Satellite and Ground Sensing Technologies

Annex A January 2009
A-13
6.4 Ocean Sequestration 6.4.1 Ocean Sequestration - Direct Injection 6.4.1.1 Drilling Simulation and Wells, Transport of Gases, and CO2 Injection 6.4.2 Ocean Sequestration - Iron Fertilization 7.0 Reducing Potential for Climate Effects of Non-CO2 GHGs 7.1 Methane Emissions from Energy and Waste 7.1.1 Anaerobic and Aerobic Bioreactor Landfills 7.1.1.1 Anaerobic and Aerobic Bioreactor Technologies 7.1.2 Conversion of Landfill Gas to Alternative Uses 7.1.2.1 Conversion of Gas to CNG/LNG 7.1.2.2 Pipeline Quality Gas Production and CO2 Separation & Production 7.1.2.3 Conversion of Landfill Gas (LFG) to Methanol and Ethanol 7.1.3 Electricity-Generation Technology for Landfill Gas 7.1.3.1 Fuel Cells 7.1.3.2 Microturbines 7.1.3.3 Stirling Engine and Organic Rankine Cycle (ORC) 7.1.4 Advances in Coal Mine Ventilation Air Systems 7.1.4.1 Flow Reversal Reactors 7.1.4.2 Lean Fuel Turbines 7.1.5 Advances in Coal Mine Methane Recovery Systems 7.1.5.1 Directional Drilling 7.1.5.2 Second Gas Injection to Enhance Recovery 7.1.6 CH4 Leakage Mitigation from Natural Gas and Petroleum Systems 7.1.6.1 Advanced Measurement Technologies 7.1.6.2 Remote Sensing Technologies 7.1.7 Wastewater Treatment 7.2 Methane and Nitrous Oxide Emissions from Agriculture 7.2.1 Advanced Agricultural Systems for N2O Emission Reduction 7.2.1.1 Precision Agriculture Sensors and Controls 7.2.1.2 Advanced AI and Information Networking Technologies 7.2.1.3 Control-Release Fertilizers and Pesticides 7.2.1.4 Nitrogen Transformation Inhibitors 7.2.1.5 Improved Best-Management Systems (BMP) 7.2.1.6 Genetically Engineered Plants 7.2.2 Methane Reduction Options for Manure Management 7.2.2.1 Centralized Digester Technologies 7.2.2.2 Farm-Scale Digesters 7.2.2.3 Separation Process Technologies 7.2.2.4 Aeration Process Technologies 7.2.3 Advanced Agricultural Systems for Enteric Emissions Reduction 7.2.3.1 Improved Feed and Forage Management 7.2.3.2 Best-Management Practices for Increased Productivity (Including Growth Promotants and Other Agents) 7.2.3.3 Bacteria and Microbe Modification in the Rumen

Strategies for Commercialization and Deployment
A-14
7.3 Emissions of High Global-Warming Potential Gases 7.3.1 Semiconductor Industry: Abatement Technologies 7.3.1.1 Oxidation and Advanced Burner Technology 7.3.1.2 Catalytic Oxidation Technology 7.3.1.3 Radio-Frequency and Microwave Surface Plasma Technology 7.3.1.4 Cold Plasma Abatement 7.3.2 Semiconductor Industry: Substitutes for High GWP Gases 7.3.2.1 Substitutes for Perfluorocarbons 7.3.3 Semiconductors and Magnesium: Recovery and Recycle 7.3.3.1 Cryogenic Capture 7.3.3.2 Membrane Separation 7.3.3.3 Pressure Swing 7.3.4 Aluminum Industry: Perfluorocarbons Emissions 7.3.4.1 Inert Anodes 7.3.4.2 Improved Controls, Point-Feeder Systems and Practices 7.3.5 Electric Power Systems and Magnesium: Substitutes for SF6 7.3.5.1 Alternatives for SF6 in Electric Power Systems 7.3.5.2 Alternatives for SF6 in Magnesium Industry 7.3.7 Supermarket Refrigeration: Hydrofluorocarbon Emissions 7.3.7.1 Distributed Refrigeration 7.3.7.2 Secondary-Loop Refrigeration 7.4 Nitrous Oxide Emissions from Combustion and Industrial Sources 7.4.1 Combustion 7.4.1.1 Combustion and Post-Combustion NOx Control Systems for Tropospheric Ozone Control 7.4.2 Industrial Sources 7.4.2.1 N2O Abatement Technologies for Nitric Acid Production

Annex B January 2009
B-1
Annex B. Inventory of Federal Activities that Promote Commercialization and Deployment of GHG-Reducing Technologies and Practices
The inventory of Federal activities presents a broad range of policies, financial incentives, voluntary programs, and other actions that encourage deployment of GHG-reducing technologies and practices. While the U.S. strategy to address climate change balances near-term opportunities with long-term investments in breakthrough technologies, this inventory focuses on encouraging GHG-reducing practices and technologies that are suitable for deployment today.84 The inventory is not intended to be exhaustive but to provide perspective on the breadth of activities currently in place. These Federal efforts span the major sectors of the U.S. economy, encompassing energy supply (fossil, nuclear, and renewable); energy end-use in transportation, buildings, industry, and electric grid; and carbon capture and sequestration. In total, the inventory covers 15 technology areas described in the report. There are also countless businesses, state and local governments, and NGOs working to deploy new climate change technologies and practices in various ways. These efforts are not included in Annex B; instead, Annex C provides examples of major non-Federal activities that support, enhance, and build upon the Federal strategy. The inventory is separated into two parts based on funding status and whether it is already represented in the inventory by component activities.
• Part 1 consists of deployment activities that are currently active, funded, or proposed for funding in the President’s FY09 Budget. Also included are major actions that may not have an associated budget, such as Presidential announcements (e.g., Call to Establish a New Framework on Greenhouse Gas Emissions), and international agreements (e.g., State Department’s formal agreement for Climate Change Bilateral Cooperation). Programs or initiatives that are already represented in the inventory by their component activities are not included in Part 1 to avoid double counting. For instance, DOE’s Vehicle Technologies Program is not included in Part 1 because its component C&D activities are already included (e.g., 21st Century Truck Partnership, Advanced Vehicle Testing, etc.). The tables in the report that present the number of deployment activities are based on the activities listed in Part 1.
• Part 2 includes deployment activities that are enacted or authorized (by EISA 2007 for example) but not yet funded or implemented. Activities where the funding or implementation status could not be determined are also included in Part 2. This list provides a sample of new developments that could
84 Refer to Annex A for a working definition of ‘technologies suitable for deployment’

Strategies for Commercialization and Deployment
B-2
augment the large array of existing policies and measures presented in Part 1. Part 2 also lists major efforts currently underway that are already included by way of their component activities in Part 1. These are not included in Part 1 to avoid double counting, and are denoted with an asterisk. The tables in the report that present the number of deployment activities do not include activities listed in Part 2.
Activities in both Part 1 and Part 2 fit the Criteria for Inclusion, as described below. Criteria for Inclusion in the Inventory In order for an activity to be included in the Deployment Inventory, it must meet the following conditions:
Led by a Federal agency. Major efforts carried out by a national laboratory or university that are led by a Federal agency are also included (e.g., Gasification Technologies Program at the National Energy Technology Laboratory). Currently, more than a dozen agencies lead one or more of the activities in the inventory. Directly contributing to one or more of CCTP’s emissions-reduction goals as outlined in Section 2.2 of the CCTP Strategic Plan (CCTP 2006). Activities were included if they address CCTP goals even if the original intent of the activity was something other than reducing GHGs, such as increasing energy security, preserving wildlife habitat, or reducing hazardous waste. Eligible activities can encourage deployment of either technologies or practices, such as no-till farming and conservation reserve programs. Considered a major activity. Determining what constitutes a ‘major’ activity involves judgment into the size and scope of the program. As a general rule, if the program does not have its own website it was not considered a major activity. Activities range in scale from technology-specific education guides (e.g., Green Vehicle Guide) to broad major Acts (e.g., Public Utility Regulatory Policies Act) and Presidential announcements (eg, Call to Establish a New Framework on Greenhouse Gas Emissions). Removing barriers to commercialization and deployment. The activity must address one or more of the barriers to deployment as described Table 1.2 of this report. Promoting GHG-reducing practices or technologies suitable for deployment. Activities promoting technologies that are at or beyond the full scale technology demonstration phase are eligible to be listed in the inventory. If the primary focus of a program is research and development, then the program must contain a deployment element in order to be included; and only the deployment portion of that activity is included in this inventory – not R&D. Programs limited to advancing basic research or scientific understanding of climate change are not included; they must seek to deploy near-term technologies or encourage GHG-reducing practices.
Organization of the Inventory Annex B is separated into Part 1 and Part 2 as described above. Within each part, deployment activities can cross numerous sectors of the economy or purposefully target unique barriers in specific market and technology segments. The annex is organized to show crosscutting activities first (applying to more than 1 of the 15 technology sectors), followed by sector-specific activities (applying to exactly 1 technology sector). Activities are listed alphabetically within each section.

Annex B January 2009
B-3
DEPLOYMENT INVENTORY PART 1
Official Name of Activity Lead Agency
Website or Link to Associated Statute
Crosscutting Activities: Activities relevant to multiple CCTP sectors Actions to Expedite Energy-Related Projects
White House http://www.ofee.gov/eo/eo13212.html
Advanced Energy Storage Program DOE http://www.oe.energy.gov/randd/energy_storage.htm
Air Conditioning and Refrigeration Equipment Manufacturing EPA
http://www.epa.gov/Ozone/snap/partnerships/index.html http://www.epa.gov/Ozone/snap/refrigerants/ARI_ResponsibleUseGuide.pdf
Alternative Fuel Infrastructure Tax Credit Treasury
http://frwebgate.access.gpo.gov/cgi-bin/getdoc.cgi?dbname=109_cong_bills&docid=f:h6enr.txt.pdf
Alternative Motor Vehicle Credit Treasury http://www.eere.energy.gov/afdc/progs/fed_all.cgi?afdc/US/0 Asia-Pacific Partnership on Clean Development and Climate DOS http://www.asiapacificpartnership.org/ Biobased Products and Bioenergy Program USDA
http://www.rurdev.usda.gov/rbs/biomass/biomass.htm http://www.ars.usda.gov/bbcc/
Biofuels Distribution and Advanced Biofuels Infrastructure DOE
http://frwebgate.access.gpo.gov/cgi-bin/getdoc.cgi?dbname=110_cong_public_laws&docid=f:publ140.110.pdf
Biofuels Initiative DOE http://www1.eere.energy.gov/biomass/biofuels_initiative.html
Business Energy Tax Credit Treasury
http://www.dsireusa.org/library/includes/incentive2.cfm?Incentive_Code=US02F&State=federal¤tpageid=1&ee=1&re=1 http://frwebgate.access.gpo.gov/cgi-bin/getdoc.cgi?dbname=109_cong_bills&docid=f:h6enr.txt.pdf
Carbon Dioxide Information Analysis Center (CDIAC) DOE http://cdiac.ornl.gov/ Carbon Sequestration Leadership Forum (CSLF) DOE http://www.cslforum.org/ Carbon Sequestration Regional Partnerships DOE
http://www.fossil.energy.gov/programs/sequestration/partnerships/index.html
Clean Automotive Technology Program EPA http://www.epa.gov/otaq/technology/
Clean Coal Power Initiative DOE
http://www.fossil.energy.gov/programs/powersystems/cleancoal/index.html http://www.netl.doe.gov/technologies/coalpower/cctc/ccpi/index.html
Clean Construction USA EPA http://www.epa.gov/cleandiesel/construction/
Clean Energy Technology Exports Initiative (CETE)
DOC, DOE,
USAID http://www.pi.energy.gov/documents/CETE_StratPlan.pdf Clean Energy-Environment Municipal Network EPA
http://www.epa.gov/cleanenergy/energy-programs/state-and-local/local.html
Clean Energy-Environment State Partnership Program EPA http://www.epa.gov/cleanenergy/stateandlocal/partnership.htm Clean School Bus USA EPA http://www.epa.gov/cleanschoolbus/ Climate Change Bilateral Cooperation DOS http://www.state.gov/g/oes/climate/ Climate Friendly Parks DOI http://www.nps.gov/climatefriendlyparks/index.htm Climate Leaders EPA http://www.epa.gov/climateleaders/
Climate Technology Partnership (CTP) DOE, EPA,
USAID
http://www.usaid.gov/our_work/environment/climate/pub_outreach/story_egypt.html http://www.usctcgateway.gov/usctc/programs/programs_detail.cfm?LinkAdvID=43077

Strategies for Commercialization and Deployment
B-4
Official Name of Activity Lead Agency
Website or Link to Associated Statute
Crosscutting Activities: Activities relevant to multiple CCTP sectors
Climate VISION—Voluntary Innovative Sector Initiatives: Opportunities Now
DOE, DOT, EPA, USDA http://www.climatevision.gov/
Coal Technology Export DOE http://www.mbe.doe.gov/budget/07budget/Content/Volumes/Vol_7_FE.pdf
Commercial Aviation Alternative Fuels Initiative (CAAFI) DOT
www.faa.gov/news/fact_sheets/news_story.cfm?newsId=10112 http://web.mit.edu/aeroastro/partner/caafi/caafi-descrip.pdf
Conservation Innovation Grants (CIG) USDA http://www.nrcs.usda.gov/programs/cig/ Conservation of Private Grazing Land (CPGL) initiative USDA http://www.nrcs.usda.gov/PROGRAMS/cpgl/ Conservation Reserve Program (CRP) USDA http://www.nrcs.usda.gov/programs/crp/ Conservation Stewardship Program USDA http://www.nrcs.usda.gov/Programs/csp/ Consortium for Research on Renewable Industrial Materials
USDA, DOE, EPA http://www.corrim.org/
Continuous, Lower Energy, Emissions and Noise (CLEEN) Program DOT
http://www.faa.gov/news/conferences_events/2008_market_research_conference/
Diesel Fueled Vehicles: Meeting Tier 2 Standards DOE http://www.eere.energy.gov/afdc/incentives_laws_epact.html Distributed Energy Program DOE http://www.eere.energy.gov/de/ E85: The Campaign for an American Fuel DOE
http://www1.eere.energy.gov/cleancities/toolbox/campaign_strategies.html
Easy Ways to Save Energy DOE http://www1.eere.energy.gov/industry/saveenergynow/pdfs/save_energy_fs.pdf
Efficient Energy for Sustainable Development Partnership (EESD) Many http://www.sdp.gov/sdp/initiative/c17707.htm Electric Permitting, Siting and Analysis DOE http://www.oe.energy.gov/our_organization/psa.htm Energy Improvement and Extension Act IRS http://thomas.loc.gov/cgi-bin/query/D?c110:5:./temp/~c110K9KkOf::
Energy Savers DOE, EPA,
HUD http://www.energysavers.gov/ ENERGY STAR Program DOE, EPA http://www.energystar.gov
Environmental Goods and Services Agreement USTR
http://www.ustr.gov/Document_Library/Press_Releases/2007/November/USTR_Schwab_to_Announce_New_Climate_Initiatives_for_WTO,_Including_a_New_Environmental_Goods_Services_Agreement_(EGSA).html
Environmental Quality Incentives Program (EQIP) USDA http://www.nrcs.usda.gov/PROGRAMS/EQIP/ Environmental Technology Verification Program EPA http://www.epa.gov/etv/ EPA General Public Outreach (Climate Change website) EPA http://www.epa.gov/climatechange/ Executive Order: Strengthening Federal Environmental, Energy, and Transportation Management
White House
http://www.whitehouse.gov/news/releases/2007/01/print/20070124-2.html
Federal Fleet Dual-Fuel Vehicles: Fuel Use Requirement DOE
http://www.eere.energy.gov/afdc/incentives_laws_epact.html http://www1.eere.energy.gov/femp/pdfs/41891.pdf
Federal Network for Sustainability Many http://www.federalsustainability.org/index.htm Federal Utility Partnership Working Group (FUPWG) DOE http://www1.eere.energy.gov/femp/program/utility/utility_fupwg.html

Annex B January 2009
B-5
Official Name of Activity Lead Agency
Website or Link to Associated Statute
Crosscutting Activities: Activities relevant to multiple CCTP sectors
Federal Woody Biomass Utilization Working Group
DOI, DOE, EPA, USDA
http://www.fs.fed.us/forestmanagement/WoodyBiomassUtilization/index.sht ml
Fuel Cell Test and Evaluation Center (FCTec) DoD http://www.fctec.com/fctec_about.asp
Global Change National Program USDA http://www.ars.usda.gov/research/programs/programs.htm?NP_CODE=204
Global Climate Change (GCC) Program USAID http://www.usaid.gov/our_work/environment/climate/gcc_brochure.html Global Climate Change Initiative (Ambitious National Goal to Reduce Emissions Intensity)
White House http://www.whitehouse.gov/ceq/global-change.html
Global Gas Flaring Reduction partnership (GGFR)
DOE via World Bank www.worldbank.org/ggfr
Great American Woodstove Changeout Campaign EPA http://www.epa.gov/woodstoves/changeout.html Green Communities Program EPA http://www.epa.gov/greenkit/index.htm Green the Capitol Initiative CAO http://cao.house.gov/greenthecapitol/ Green Vehicle Guide EPA http://www.epa.gov/greenvehicles/ GreenChill Advanced Refrigeration Partnership EPA
http://www.epa.gov/ozone/partnerships/greenchill/index.html http://www.state.gov/g/oes/rls/rpts/car/90319.htm
Greening of the National Park Service DOI http://www.nps.gov/renew/ HFC-23 Emission Reduction Partnership EPA http://www.epa.gov/cpd.html HFCIT Hydrogen Education Program DOE http://www.eere.energy.gov/hydrogenandfuelcells/education/
Home Appliance Manufacturing EPA
http://www.epa.gov/Ozone/snap/download/RecommendedPracticesforHFCemissions.pdf http://www.epa.gov/Ozone/snap/partnerships/index.html
Hydrogen Codes and Standards Program DOE http://www.eere.energy.gov/hydrogenandfuelcells/codes/activities.html
Hydrogen Fuel Initiative (HFI) DOE http://www.hydrogen.gov/thepresidentshydrogen_fi.html http://www.hydrogen.energy.gov/budget.html
Hydrogen Program DOE http://www.hydrogen.energy.gov/about.html Indicators of Energy Intensity in the United States DOE http://intensityindicators.pnl.gov/
Innovations for Existing Plants DOE http://www.fossil.energy.gov/programs/powersystems/pollutioncontrols/index.html
Integrated Environmental Strategies (IES) EPA http://www.epa.gov/ies/ John Warner National Defense Authorization Act DoD http://thomas.loc.gov Labs21 EPA http://www.labs21century.gov/ Landfill Methane Outreach Program (LMOP) EPA http://www.epa.gov/lmop/
Loan Guarantee Program DOE http://www.lgprogram.energy.gov/ http://www.nuclear.gov/energyPolicyAct2005/neEPACT2a.html
Major Economies Meetings on Energy Security and Climate Change (ie, Call to Establish a New Framework on Greenhouse Gas Emissions)
White House
http://www.eere.energy.gov/news/news_detail.cfm/news_id=11006 http://www.state.gov/g/oes/climate/mem/
Management of Bulk Petroleum DoD http://www.desc.dla.mil/DCM/Files/Chapter%205%20V3.pdf

Strategies for Commercialization and Deployment
B-6
Official Name of Activity Lead Agency
Website or Link to Associated Statute
Crosscutting Activities: Activities relevant to multiple CCTP sectors Mandatory Reporting of Greenhouse Gas Emissions EPA
http://www.epa.gov/climatechange/emissions/ghgrulemaking.html http://www.rules.house.gov/110/text/omni/divf.pdf
Methane to Markets Partnership (M2M) EPA http://www.methanetomarkets.org/ Millennium Challenge Corporation (MCC) DOS http://www.mcc.gov/ Mobile Air Conditioning Climate Protection Partnership EPA http://www.epa.gov/cppd/mac/ Modified Accelerated Cost-Recovery System (MACRS) Treasury
http://www.dsireusa.org/library/includes/genericfederal.cfm?currentpageid=1&search=federal&state=US&RE=1&EE=1
National Action Plan for Energy Efficiency (NAPEE) DOE, EPA http://www.epa.gov/solar/actionplan/eeactionplan.htm National Defense Authorization Act for FY2008 DoD
http://thomas.loc.gov http://www.govtrack.us/congress/bill.xpd?tab=summary&bill=h110-1585
National Environmental Performance Track EPA http://www.epa.gov/performancetrack/ National Fuel Cell Bus Technology Development Program (NFCBP) DOT
http://www.fta.dot.gov/funding/grants/grants_financing_3695.html http://earmarks.omb.gov/resources/citations/citation_109.pdf
National Hydrogen Learning Demonstration DOE
http://www1.eere.energy.gov/hydrogenandfuelcells/tech_validation/fleet_demonstration.html
National Pollution Prevention (P2) Vendor Database (VENDINFO) EPA http://es.epa.gov/vendors/ New and Emerging Environmental Technologies (NEET) Clean Air Technologies Database EPA http://neet.rti.org Partnership for Clean Fuels and Vehicles EPA http://www.state.gov/g/oes/rls/fs/2003/19942.htm PFC Reduction/Climate Partnership for the Semiconductor Industry EPA http://www.epa.gov/highgwp/semiconductor-pfc/index.html
Pollution Prevention Grants Program EPA http://www.epa.gov/p2/pubs/grants/ppis/ppis.htm http://www.eere.energy.gov/afdc/progs/fed_all.cgi?afdc/US/0
Power the Army! DoD Presidential Directive on Energy and Fuel Conservation DOE http://www1.eere.energy.gov/femp/about/pres_directive.html Public Utility Regulatory Policies Act of 1978 (PURPA) FERC
http://www.nwppa.org/web/presentations/PP_Fourm_3-06/PURPA%20Redline.pdf
Rebuild America DOE http://www.eere.energy.gov/buildings/program_areas/rebuild.html Renewable and Distributed Systems Integration Program DOE http://www.oe.energy.gov/DocumentsandMedia/oe_fs_edtp_web.pdf Renewable Energy and Energy Efficiency Partnership (REEEP) http://www.reeep.org/ Renewable Energy Systems and Energy Efficiency Improvements Programs (Rural Energy for America Program (REAP)) USDA
http://www.rurdev.usda.gov/rbs/farmbill/index.html http://www.usda.gov/wps/portal/!ut/p/_s.7_0_A/7_0_1OB?contentidonly=true&contentid=energy_spotlights.xml
Research and Innovative Technology Administration (RITA) DOT http://www.rita.dot.gov/ Responsible Appliance Disposal (RAD) Program EPA http://www.epa.gov/ozone/partnerships/rad/index.html

Annex B January 2009
B-7
Official Name of Activity Lead Agency
Website or Link to Associated Statute
Crosscutting Activities: Activities relevant to multiple CCTP sectors SF6 Emission Reduction Partnership for Electric Power Systems EPA http://www.epa.gov/highgwp/electricpower-sf6/index.html SF6 Emission Reduction Partnership for the Magnesium Industry EPA http://www.epa.gov/highgwp/magnesium-sf6/index.html Small Business Technology Transfer (STTR) Program SBA http://www.sba.gov/sbir/indexsbir-sttr.html SmartWay Grow & Go EPA http://www.epa.gov/smartway/growandgo/ SmartWay Transport Partnership EPA http://www.epa.gov/otaq/smartway/index.htm Solar Decathlon DOE http://www.eere.energy.gov/solar_decathlon/ Solid State Energy Conversion Alliance (SECA) DOE
http://www.fossil.energy.gov/programs/powersystems/fuelcells/fuelcells_seca.html
Soybean Promotion and Research Program USDA
http://www.ars.usda.gov/Bbcc/USDA_BBCC.htm http://www.ams.usda.gov/lsg/mpb/rp-soy.htm
Standard Specifications for Biodiesel EPA
http://frwebgate.access.gpo.gov/cgi-bin/getdoc.cgi?dbname=110_cong_public_laws&docid=f:publ140.110.pdf
State Energy Program DOE http://www.eere.energy.gov/state_energy_program/ Super Energy Savings Performance Contracts (ESPC) DOE http://www1.eere.energy.gov/femp/financing/superespcs.html Support for Renewable Portfolio Standards and Renewable Energy Certificates DOE http://www.eere.energy.gov/wip/
Technical Assistance Program (TAP) DOE
http://www.ornl.gov/adm/wfo/exthome.htm http://www.epa.gov/cleanenergy/pdf/gta/gta_appendix-a.pdf http://www.naseo.org/funding/TAP%20Summary%20PMC%20Meeting%20080106.pdf
The Global Village Energy Partnership USAID http://www.gvep.org/ The United Nations Framework Convention on Climate Change (UNFCCC) DOS http://unfccc.int/2860.php Transformational Energy Action Management (TEAM) Initiative DOE http://www.doe.gov/news/5300.htm Tribal Energy Program DOE http://www.eere.energy.gov/tribalenergy/ Twenty In Ten: Strengthening America's Energy Security
White House http://www.whitehouse.gov/stateoftheunion/2007/initiatives/energy.html
U.S.-EU High Level Dialogue on Climate Change, Clean Energy and Sustainable Development DOS
http://useu.usmission.gov/Dossiers/Energy/Oct2506_High_Level_Dialogue.asp
Utility Energy Service Contracts DOE http://www1.eere.energy.gov/femp/financing/uescs.html Visualization and Controls Program DOE Voluntary Aluminum Industrial Partnership (VAIP) EPA http://www.epa.gov/highgwp/aluminum-pfc/index.html Voluntary Code of Practice for the Reduction of Emissions of HFC & PFC Fire Protection Agents (VCOP) EPA
http://www.epa.gov/Ozone/snap/partnerships/index.html http://www.epa.gov/Ozone/snap/refrigerants/vcopdocument.pdf
Voluntary Reporting of Greenhouse Gases DOE http://www.eia.doe.gov/oiaf/1605/2nd_broc.html

Strategies for Commercialization and Deployment
B-8
Official Name of Activity Website or Link to Associated Statute
Intellectual Property Crosscutting Activities American Inventors Protection Act (AIPA) of 1999 http://thomas.loc.gov/cgi-bin/bdquery/z?d106:s.01948:
Bayh-Dole Patent and Trademark Laws Amendment Act
http://thomas.loc.gov/cgi-bin/bdquery/R?d096:FLD002:@1(96+517)
Cooperative Research and Technology Enhancement (CREATE) Act of 2004
http://thomas.loc.gov/cgi-bin/bdquery/z?d108:SN02192:|TOM:/bss/d108query.html|
Federal Technology Transfer Act http://thomas.loc.gov/cgi-bin/bdquery/R?d099:FLD002:@1(99+502)
National Competitiveness Technology Transfer Act http://thomas.loc.gov/cgi-bin/bdquery/R?d101:FLD002:@1(101+189)
National Cooperative Research and Production Act of 1993
http://thomas.loc.gov/cgi-bin/bdquery/z?d103:HR01313:|TOM:/bss/d103query.html|
National Technology Transfer and Advancement Act of 1995
http://thomas.loc.gov/cgi-bin/bdquery/R?d104:FLD002:@1(104+113)
Stevenson-Wydler Technology Innovation Act http://thomas.loc.gov/cgi-bin/bdquery/D?d096:1:./temp/~bdCaIu:@@@L&summ2=m&
Technology Transfer Commercialization Act http://thomas.loc.gov/cgi-bin/bdquery/R?d106:FLD002:@1(106+404)
Trademark Clarification Act http://thomas.loc.gov/cgi-bin/bdquery/R?d098:FLD002:@1(98+620)

Annex B January 2009
B-9
Official Name of Activity Lead
Agency Website or Link to Associated Statute
Federal activities applicable to a single CCTP Sector are provided below (non-crosscutting activities):
Strategic Goal Area: Transportation
21st Century Truck Partnership DOE http://www1.eere.energy.gov/vehiclesandfuels/about/partnerships/21centurytruck/index.html
Advanced Vehicle Testing Activity (AVTA) DOE http://www1.eere.energy.gov/vehiclesandfuels/avta/index.html
Air Pollution Control Program EPA http://www.eere.energy.gov/afdc/progs/fed_all.cgi?afdc/US/0
Aircraft Fuel Efficiency Goal DOT http://www.state.gov/g/oes/rls/rpts/car/90319.htm
Alternative Motor Fuels Act DOT http://www.nhtsa.dot.gov/cars/rules/CAFE/Rulemaking/AMFAFinalRule2004.htm
Arterial Management Program DOT http://ops.fhwa.dot.gov/arterial_mgmt/traffic_sig.htm Australia and South Pacific Initiative to Reduce Emissions (ASPIRE) DOT
http://www.faa.gov/news/speeches/news_story.cfm?newsId=10169 http://www2.faa.gov/news/updates/aspire/
Automotive Fuel Economy Program, Corporate Average Fuel Economy (CAFE) DOT
http://climate.dot.gov/fuel.html http://energy.senate.gov/public/_files/RL342941.pdf
Best Workplaces for Commuters Program DOT, EPA http://www.bwc.gov/ Center for Climate Change and Environmental Forecasting DOT http://climate.dot.gov/index.html
Challenge X: Crossover to Sustainable Mobility DOE
http://www1.eere.energy.gov/vehiclesandfuels/deployment/education/fcvt_challengex.html http://www.challengex.org/about/index.html
Clean Cities DOE http://www.eere.energy.gov/cleancities/
Clean Cities International (CCI) DOE http://www1.eere.energy.gov/cleancities/international.html
Clean Fuels Grant Program DOT http://www.fta.dot.gov/funding/grants/grants_financing_3560.html Commercial Vehicle Information Systems and Network (CVISN) DOT http://cvisn.fmcsa.dot.gov/
Commuter Choice DOT, EPA http://www.commuterchoice.com/ Congestion Mitigation and Air Quality (CMAQ) Improvement Program DOT, EPA http://www.fhwa.dot.gov/environment/cmaqpgs/ Federal Workforce Transportation Benefit
White House http://ceq.eh.doe.gov/nepa/regs/eos/eo13150.html
FreedomCAR and Fuel Partnership DOE http://www1.eere.energy.gov/vehiclesandfuels/about/partnerships/freedomcar/index.html
Fuel Cell Motor Vehicle Credit Treasury http://frwebgate.access.gpo.gov/cgi-bin/getdoc.cgi?dbname=109_cong_bills&docid=f:h6enr.txt.pdf
Fuel Cell School Buses DOE http://www.eere.energy.gov/afdc/incentives_laws_epact.html
Fuel Economy Guide DOE, EPAhttp://www.fueleconomy.gov/feg/byfueltype.htm http://www.fueleconomy.gov/feg/FEG2007.pdf
Fuel Economy Labeling for Passenger Vehicles and Light Trucks EPA
http://www.epa.gov/fueleconomy/basicinformation.htm http://www1.eere.energy.gov/vehiclesandfuels/epact/
Gas guzzler tax Treasury http://www.cbo.gov/showdoc.cfm?index=767&sequence=3 Graduate Automotive Technology Education (GATE) DOE
http://www1.eere.energy.gov/vehiclesandfuels/deployment/education/fcvt_gate.html
Hybrid Motor Vehicle Credit Treasury
http://frwebgate.access.gpo.gov/cgi-bin/getdoc.cgi?dbname=109_cong_bills&docid=f:h6enr.txt.pdf http://www.eere.energy.gov/afdc/progs/fed_all.cgi?afdc/US/0
Hybrid Truck Users Forum (HTUF) DoD http://www.calstart.org/programs/htuf/

Strategies for Commercialization and Deployment
B-10
Official Name of Activity Lead Agency
Website or Link to Associated Statute
Federal activities applicable to a single CCTP Sector are provided below (non-crosscutting activities):
Strategic Goal Area: Transportation
Improving Air Quality through Land Use Activities EPA
http://www.epa.gov/otaq/stateresources/policy/transp/landuse/r01001.pdf
International Mass Transportation Program (IMTP) DOT http://www.fta.dot.gov/assistance/research_4491.html
It All Adds Up to Cleaner Air DOT, EPA http://www.italladdsup.gov/index.html Joint Flexible Fuel/Hybrid Vehicle Commercialization Initiative DOE http://www.eere.energy.gov/afdc/incentives_laws_epact.html Metropolitan and Statewide Transportation Planning Grant Program DOT http://www.fta.dot.gov/funding/grants/grants_financing_3563.html National Research and Technology Program DOT http://www.fta.dot.gov/funding/grants/grants_financing_5484.html National Transportation Idle Free Corridors EPA http://www.epa.gov/smartway/idling.htm Next Generation Air Transportation System (NextGen) DOT http://www.jpdo.aero/ Nonurbanized Area Formula Grant Program DOT http://www.fta.dot.gov/funding/grants/grants_financing_3555.html Partnership for AiR Transportation Noise & Emissions Reduction (PARTNER) DOT http://web.mit.edu/aeroastro/partner/projects/index.html Paul S. Sarbanes Transit in Parks Program DOT http://www.fta.dot.gov/funding/grants/grants_financing_6106.html Program Information Directory for Transportation Control Measures EPA
http://yosemite.epa.gov/aa/tcmsitei.nsf/9bd6f3b7217f80c28525652f0053e105/a952e65d4f9d09df852566de000ff77a!OpenDocument
Reduced Vertical Separation Minimums (RVSM) DOT http://www.faa.gov/ATS/ato/rvsm1.htm State and Alternative Fuel Provider Rule DOE http://www1.eere.energy.gov/vehiclesandfuels/epact/state/index.html The National Strategy to Reduce Congestion on America’s Transportation Network DOT http://isddc.dot.gov/OLPFiles/OST/012988.pdf Traffic Incident Management (TIM) Program DOT http://ops.fhwa.dot.gov/incidentmgmt/index.htm Transit Capital Investment Grant Program DOT http://www.fta.dot.gov/funding/grants/grants_financing_3558.html Transit Cooperative Research Program (TCRP) DOT http://www.fta.dot.gov/funding/grants/grants_financing_3552.html
Urbanized Area Formula Grant Program DOT http://www.fta.dot.gov/funding/grants/grants_financing_3561.html Voluntary Airport Low Emission (VALE) Program DOT http://www.faa.gov/airports_airtraffic/airports/environmental/vale/ 63 additional Part 1 activities relevant to Transportation are listed under Crosscutting Activities
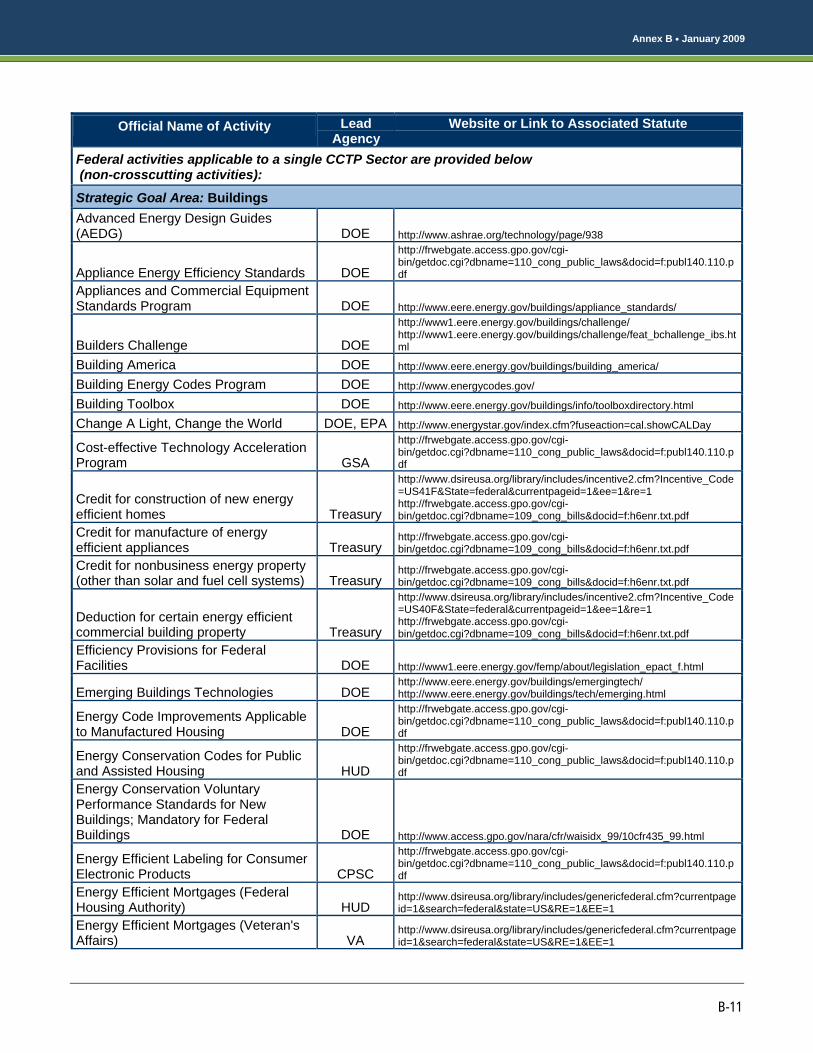
Annex B January 2009
B-11
Official Name of Activity Lead
Agency Website or Link to Associated Statute
Federal activities applicable to a single CCTP Sector are provided below (non-crosscutting activities):
Strategic Goal Area: Buildings Advanced Energy Design Guides (AEDG) DOE http://www.ashrae.org/technology/page/938
Appliance Energy Efficiency Standards DOE
http://frwebgate.access.gpo.gov/cgi-bin/getdoc.cgi?dbname=110_cong_public_laws&docid=f:publ140.110.pdf
Appliances and Commercial Equipment Standards Program DOE http://www.eere.energy.gov/buildings/appliance_standards/
Builders Challenge DOE
http://www1.eere.energy.gov/buildings/challenge/ http://www1.eere.energy.gov/buildings/challenge/feat_bchallenge_ibs.html
Building America DOE http://www.eere.energy.gov/buildings/building_america/
Building Energy Codes Program DOE http://www.energycodes.gov/
Building Toolbox DOE http://www.eere.energy.gov/buildings/info/toolboxdirectory.html
Change A Light, Change the World DOE, EPA http://www.energystar.gov/index.cfm?fuseaction=cal.showCALDay
Cost-effective Technology Acceleration Program GSA
http://frwebgate.access.gpo.gov/cgi-bin/getdoc.cgi?dbname=110_cong_public_laws&docid=f:publ140.110.pdf
Credit for construction of new energy efficient homes Treasury
http://www.dsireusa.org/library/includes/incentive2.cfm?Incentive_Code=US41F&State=federal¤tpageid=1&ee=1&re=1 http://frwebgate.access.gpo.gov/cgi-bin/getdoc.cgi?dbname=109_cong_bills&docid=f:h6enr.txt.pdf
Credit for manufacture of energy efficient appliances Treasury
http://frwebgate.access.gpo.gov/cgi-bin/getdoc.cgi?dbname=109_cong_bills&docid=f:h6enr.txt.pdf
Credit for nonbusiness energy property (other than solar and fuel cell systems) Treasury
http://frwebgate.access.gpo.gov/cgi-bin/getdoc.cgi?dbname=109_cong_bills&docid=f:h6enr.txt.pdf
Deduction for certain energy efficient commercial building property Treasury
http://www.dsireusa.org/library/includes/incentive2.cfm?Incentive_Code=US40F&State=federal¤tpageid=1&ee=1&re=1 http://frwebgate.access.gpo.gov/cgi-bin/getdoc.cgi?dbname=109_cong_bills&docid=f:h6enr.txt.pdf
Efficiency Provisions for Federal Facilities DOE http://www1.eere.energy.gov/femp/about/legislation_epact_f.html
Emerging Buildings Technologies DOE http://www.eere.energy.gov/buildings/emergingtech/ http://www.eere.energy.gov/buildings/tech/emerging.html
Energy Code Improvements Applicable to Manufactured Housing DOE
http://frwebgate.access.gpo.gov/cgi-bin/getdoc.cgi?dbname=110_cong_public_laws&docid=f:publ140.110.pdf
Energy Conservation Codes for Public and Assisted Housing HUD
http://frwebgate.access.gpo.gov/cgi-bin/getdoc.cgi?dbname=110_cong_public_laws&docid=f:publ140.110.pdf
Energy Conservation Voluntary Performance Standards for New Buildings; Mandatory for Federal Buildings DOE http://www.access.gpo.gov/nara/cfr/waisidx_99/10cfr435_99.html
Energy Efficient Labeling for Consumer Electronic Products CPSC
http://frwebgate.access.gpo.gov/cgi-bin/getdoc.cgi?dbname=110_cong_public_laws&docid=f:publ140.110.pdf
Energy Efficient Mortgages (Federal Housing Authority) HUD
http://www.dsireusa.org/library/includes/genericfederal.cfm?currentpageid=1&search=federal&state=US&RE=1&EE=1
Energy Efficient Mortgages (Veteran's Affairs) VA
http://www.dsireusa.org/library/includes/genericfederal.cfm?currentpageid=1&search=federal&state=US&RE=1&EE=1

Strategies for Commercialization and Deployment
B-12
Official Name of Activity Lead Agency
Website or Link to Associated Statute
Federal activities applicable to a single CCTP Sector are provided below (non-crosscutting activities):
Strategic Goal Area: Buildings
Energy Reduction Goals for Federal Buildings Many
http://frwebgate.access.gpo.gov/cgi-bin/getdoc.cgi?dbname=110_cong_public_laws&docid=f:publ140.110.pdf
Energy Star Federal Buildings DOE, EPA
http://frwebgate.access.gpo.gov/cgi-bin/getdoc.cgi?dbname=110_cong_public_laws&docid=f:publ140.110.pdf
EnergySmart Schools DOE http://www.eere.energy.gov/buildings/energysmartschools/ Environmentally Preferable Purchasing (EPP) EPA http://www.epa.gov/epp/
Federal Building Energy Efficiency Performance Standards DOE
http://frwebgate.access.gpo.gov/cgi-bin/getdoc.cgi?dbname=110_cong_public_laws&docid=f:publ140.110.pdf
Federal catalogs of Energy Efficient Products DoD, GSA http://www1.eere.energy.gov/femp/pdfs/epact05_fem_chart.pdf Federal Purchasing of Energy-Efficient Products DOE
http://www.eere.energy.gov/femp/procurement/ http://www.wbdg.org/pdfs/eo13221.pdf
GreenScapes EPA http://www.epa.gov/epaoswer/non-hw/green/
Heat Island Reduction Initiative (HIRI) EPA http://www.epa.gov/heatisland/index.html High Performance Buildings Initiative (HPBi) DOE
http://www.eere.energy.gov/buildings/highperformance/goals_objectives.html
Home Energy Saver DOE, EPA http://hes.lbl.gov/hes/vh.shtml Interagency Sustainability Working Group DOE
http://www.eere.energy.gov/femp/technologies/sustainable_workinggroup.cfm
Lighting Energy Efficiency Standards DOE
http://frwebgate.access.gpo.gov/cgi-bin/getdoc.cgi?dbname=110_cong_public_laws&docid=f:publ140.110.pdf
Low Income Home Energy Assistance Program (LIHEAP) HUD http://www.acf.hhs.gov/programs/ocs/liheap/ Partnership for Advancing Technology in Housing (PATH) HUD http://www.pathnet.org/sp.asp?id=15221
Partnership for Clean Indoor Air EPA http://www.state.gov/g/oes/rls/fs/2003/19942.htm Partnership for Home Energy Efficiency (PHEE)
DOE, EPA, HUD http://www.energysavers.gov/phee.html
Residential Energy Efficiency Tax Credit Treasury
http://www.dsireusa.org/library/includes/SeeAllFederal.cfm?Search=federal&federal=federal&state=federal¤tpageid=1&ee=0&re=1
Smart Growth Program EPA http://www.epa.gov/smartgrowth/basic_info.htm State and Local Energy Performance Contracting DOE
http://www.eere.energy.gov/state_energy_program/topic_definition_detail.cfm/topic=110
Whole Building Design Guide Many http://www.wbdg.org/index.php
You Have the Power (YHTP) DOE http://www.eere.energy.gov/femp/services/yhtp/ 60 additional Part 1 activities relevant to Buildings are listed under Crosscutting Activities

Annex B January 2009
B-13
Official Name of Activity Lead
Agency Website or Link to Associated Statute
Federal activities applicable to a single CCTP Sector are provided below (non-crosscutting activities): Strategic Goal Area: Industry
America's Marketplace Recycles (AMR) EPA http://www.epa.gov/epaoswer/osw/conserve/amr.htm Coal Combustion Products Partnership (C2P2) Program EPA http://www.epa.gov/epaoswer/osw/conserve/c2p2/index.htm
Green Suppliers Network (GSN) EPA http://www.epa.gov/greensuppliers/
Industrial Assessment Centers DOE http://www1.eere.energy.gov/industry/bestpractices/iacs.html Industrial Technologies Program Best Practices DOE http://www1.eere.energy.gov/industry/bestpractices/index.html
Industries of the Future (Crosscutting) DOE http://www1.eere.energy.gov/industry/technologies/industries.html
Industries of the Future (Specific) DOE http://www1.eere.energy.gov/industry/technologies/industries.html Manufacturing Extension Partnership (MEP) DOC http://www.mep.nist.gov/
NASA Technology Portal (TechFinder) NASA http://technology.nasa.gov/
Pay As You Throw (PAYT) Program EPA http://www.epa.gov/epaoswer/non-hw/payt/index.htm
Plug-In To eCycling EPA http://www.epa.gov/epaoswer/osw/conserve/plugin/index.htm
Resource Conservation Challenge (RCC) EPA http://www.epa.gov/epaoswer/osw/conserve/index.htm
Save Energy Now DOE http://www1.eere.energy.gov/industry/saveenergynow/ WasteWise (Climate and Waste Program) EPA http://www.epa.gov/wastewise/ 51 additional Part 1 activities relevant to Industry are listed under Crosscutting Activities
Official Name of Activity Lead Agency
Website or Link to Associated Statute
Federal activities applicable to a single CCTP Sector are provided below (non-crosscutting activities): Strategic Goal Area: Electric grid and infrastructure
GridWorks DOE http://www.oe.energy.gov/randd/gridworks.htm http://www.oe.energy.gov/DocumentsandMedia/multiyearplan_final.pdf
Superconductivity Program DOE http://www.oe.energy.gov/randd/supercon.htm
37 additional Part 1 activities relevant to Electric grid and infrastructure are listed under Crosscutting Activities

Strategies for Commercialization and Deployment
B-14
Official Name of Activity Lead
Agency Website or Link to Associated Statute
Federal activities applicable to a single CCTP Sector are provided below (non-crosscutting activities):
Strategic Goal Area: Low-emission, fossil-based fuels and power
Clean Coal Facility Tax Credit Treasury http://www.senate.gov/~finance/sitepages/leg/072705legwmchart.pdf
Combined Heat and Power (CHP) Partnership
EPA http://www.epa.gov/chp/
42 additional Part 1 activities relevant to Low-emission fossil-based fuels and power are listed under Crosscutting Activities
Official Name of Activity Lead Agency
Website or Link to Associated Statute
Federal activities applicable to a single CCTP Sector are provided below (non-crosscutting activities):
Strategic Goal Area: Hydrogen
International Partnership for the Hydrogen Economy (IPHE)
DOE http://www.iphe.net/
21 additional Part 1 activities relevant to Hydrogen are listed under Crosscutting Activities

Annex B January 2009
B-15
Official Name of Activity Lead
Agency Website or Link to Associated Statute
Federal activities applicable to a single CCTP Sector are provided below (non-crosscutting activities):
Strategic Goal Area: Renewable energy and fuels
Biomass Research and Development Initiative (BRDI)
DOE, USDA http://www.brdisolutions.com/default.aspx
Credit for holders of Clean Renewable Energy Bonds (CREBs) Treasury
http://www.dsireusa.org/library/includes/SeeAllFederal.cfm?Search=federal&federal=federal&state=federal¤tpageid=1&ee=0&re=1 http://frwebgate.access.gpo.gov/cgi-bin/getdoc.cgi?dbname=109_cong_bills&docid=f:h6enr.txt.pdf
Federal Renewable Energy Purchases DOE http://www1.eere.energy.gov/femp/program/utility/utilityman_renew.html
Federal Sector Renewable Energy Goals DOE http://www.eere.energy.gov/femp/technologies/renewable_fedrequire.cfm
Federal Wind Siting Information Center DOE http://www1.eere.energy.gov/windandhydro/federalwindsiting/
GeoPowering America DOE http://www.eere.energy.gov/geothermal/gpw/
Geothermal Resource Leasing, Geothermal Resources Unit Agreements DOI
http://a257.g.akamaitech.net/7/257/2422/01jan20061800/edocket.access.gpo.gov/2007/pdf/E7-7991.pdf http://www.mms.gov/ooc/press/2006/press0721.htm
Geothermal Technologies Program (GTP) DOE http://www1.eere.energy.gov/geothermal/technology_verification.html
Global Bioenergy Partnership (GBEP)
DOE, DOS, USDA http://www.fao.org/newsroom/en/news/2006/1000405/index.html
Green Power Network DOE http://www.eere.energy.gov/greenpower/
Green Power Partnership EPA http://www.epa.gov/greenpower/index.htm
International Biofuels Forum (IBF) DOS http://www.un.org/News/briefings/docs/2007/070302_Biofuels.doc.htm International Renewable and Energy Efficiency Activities DOE http://www1.eere.energy.gov/international/ International Renewable Energy Conference DOS http://www.wirec2008.gov/wps/portal/wirec2008
National Biodiesel Education Program USDA
http://www.uidaho.edu/bioenergy/ http://www.usda.gov/oce/newsroom/congressional_testimony/Collins_011007.pdf http://www.biodiesel.org/usda/
Renewable Electricity Production Credit (REPC) Treasury
http://frwebgate.access.gpo.gov/cgi-bin/getdoc.cgi?dbname=109_cong_bills&docid=f:h6enr.txt.pdf
Renewable Energy Policy Network for the 21st Century (REN21) DOS http://www.ren21.net/ Renewable Energy Production Incentive (REPI) DOE http://www.eere.energy.gov/repi/
Renewable Energy Working Group DOE http://www.eere.energy.gov/femp/technologies/renewable_workinggroup.cfm
Renewable Fuels Standard EPA http://www.epa.gov/otaq/renewablefuels/ Residential Solar and Fuel Cell Tax Credit Treasury
http://www.dsireusa.org/library/includes/genericfederal.cfm?currentpageid=1&search=federal&state=US&RE=1&EE=1
Small Ethanol Producer Credit Treasury http://frwebgate.access.gpo.gov/cgi-bin/getdoc.cgi?dbname=109_cong_bills&docid=f:h6enr.txt.pdf
Solar America Initiative (SAI) DOE http://www1.eere.energy.gov/solar/solar_america/
Solar Powers America (SPA) DOE http://www.mbe.doe.gov/budget/07budget/Content/Volumes/vol_3_ES.pdf
Utility Solar Water Heating Initiative DOE http://www1.eere.energy.gov/solar/ush2o/index.html
Volumetric Ethanol Excise Tax Credit Treasury http://www.cbo.gov/showdoc.cfm?index=6581&sequence=0

Strategies for Commercialization and Deployment
B-16
Official Name of Activity Lead Agency
Website or Link to Associated Statute
Federal activities applicable to a single CCTP Sector are provided below (non-crosscutting activities):
Strategic Goal Area: Renewable energy and fuels
Wind Powering America (WPA) DOE http://www.eere.energy.gov/windandhydro/windpoweringamerica/index.asp
72 additional Part 1 activities relevant to Renewable energy and fuels are listed under Crosscutting Activities
Official Name of Activity Lead Agency
Website or Link to Associated Statute
Federal activities applicable to a single CCTP Sector are provided below (non-crosscutting activities):
Strategic Goal Area: Nuclear fission
Advanced Fuel Cycle Initiative (AFCI) DOE http://nuclear.energy.gov/AFCI/neAFCI.html Combined Construction and Operating License NRC http://www.nrc.gov/reactors/new-licensing/col.html Credit for production from advanced nuclear power facilities Treasury
http://www.irs.gov/pub/irs-irbs/irb06-18.pdf http://www.nuclear.gov/energyPolicyAct2005/neEPACT2a.html
Early Site Permits (ESP) NRC http://www.nrc.gov/reactors/new-licensing/esp.html Global Nuclear Energy Partnership (GNEP) DOE http://www.gnep.energy.gov/
Nuclear Power 2010 DOE http://www.ne.doe.gov/np2010/neNP2010a.html
Price-Anderson Act (PAA) DOE
http://www.ne.doe.gov/publicInformation/nePublicInfomationPriceAnderson2.html http://gc.energy.gov/price-anderson_act.htm
Standard Design Certifications NRC http://www.nrc.gov/reactors/new-licensing/design-cert.html Standby Support for Certain Nuclear Plant Delays DOE http://www.ne.doe.gov/energyPolicyAct2005/neEPACT2b.html University Nuclear Science and Engineering Support NRC http://www.nuclear.gov/energyPolicyAct2005/neEPACT2a.html 14 additional Part 1 activities relevant to Nuclear fission are listed under Crosscutting Activities
Official Name of Activity Lead Agency
Website or Link to Associated Statute
Federal activities applicable to a single CCTP Sector are provided below (non-crosscutting activities):
Strategic Goal Area: Carbon capture
Gasification Technologies Program DOE http://www.netl.doe.gov/technologies/coalpower/gasification/index.html
15 additional Part 1 activities relevant to Carbon capture are listed under Crosscutting Activities

Annex B January 2009
B-17
Official Name of Activity Lead
Agency Website or Link to Associated Statute
Federal activities applicable to a single CCTP Sector are provided below (non-crosscutting activities):
Strategic Goal Area: Geologic storage
CO2 Storage Projects DOE http://www.netl.doe.gov/technologies/carbon_seq/core_rd/storage.htmlhttp://www.co2captureandstorage.info/project_specific.php?project_id=140
Underground Injection Control (UIC) Program
EPA http://www.epa.gov/safewater/uic/index.html
15 additional Part 1 activities relevant to Geologic storage are listed under Crosscutting Activities
Official Name of Activity Lead Agency
Website or Link to Associated Statute
Federal activities applicable to a single CCTP Sector are provided below (non-crosscutting activities):
Strategic Goal Area: Terrestrial sequestration
Cooperative Conservation Initiative DOI http://www.doi.gov/initiatives/conservation.html Federal Biobased Products Preferred Procurement Program (FB4P) USDA http://www.biobased.oce.usda.gov/fb4p/
Grassland Reserve Program (GRP) USDA http://www.nrcs.usda.gov/programs/GRP/ Healthy Forests Reserve Program (HFRP) USDA http://www.nrcs.usda.gov/programs/HFRP/ProgInfo/Index.html
Initiative Against Illegal Logging DOS http://www.usaid.gov/about_usaid/presidential_initiative/logging.html Northern Institute of Applied Carbon Science (NIACS) USDA http://nrs.fs.fed.us/niacs/about/ Rangeland, Pasture, and Forages National Program USDA
http://www.ars.usda.gov/research/programs/programs.htm?NP_CODE=205
Terrestrial Carbon Sequestration to Benefit Fish & Wildlife DOI http://www.fws.gov/southeast/carbon/index.html Tools for Carbon Inventory, Management, and Reporting USDA http://nrs.fs.fed.us/carbon/tools/ Tropical Forestry Conservation Act (TFCA) Treasury
http://www.state.gov/g/oes/rls/fs/2003/22973.htm, http://www.usaid.gov/our_work/environment/forestry/tfca.html
Voluntary Reporting of Greenhouse Gases-Carbon Management Evaluation Tool (COMET-VR) USDA http://cometvr.colostate.edu/ 26 additional Part 1 activities relevant to Terrestrial sequestration are listed under Crosscutting Activities

Strategies for Commercialization and Deployment
B-18
Official Name of Activity Lead
Agency Website or Link to Associated Statute
Federal activities applicable to a single CCTP Sector are provided below (non-crosscutting activities):
Strategic Goal Area: Methane emissions from energy and waste
Coalbed Methane Outreach Program (CMOP) EPA http://www.epa.gov/cmop/ Landfill Bioreactor Performance Assessment EPA http://www.epa.gov/nrmrl/pubs/600r07060/600R07060.pdf
Natural Gas STAR Program EPA http://www.epa.gov/gasstar/index.htm New Source Performance Standards and Emissions Guidelines (Stringent Landfill Rule) EPA http://epa.gov/ttn/atw/landfill/landflpg.html
Ownership of Coalbed Methane DOI https://energy.navy.mil/publications/law_US/92epact/hr_1300.htm 21 additional Part 1 activities relevant to Methane emissions from energy and waste are listed under Crosscutting Activities
Official Name of Activity Lead Agency
Website or Link to Associated Statute
Federal activities applicable to a single CCTP Sector are provided below (non-crosscutting activities):
Strategic Goal Area: Methane and nitrous oxide emissions from agriculture
AgSTAR Program DOE, EPA,
USDA http://www.epa.gov/agstar/index.html 17 additional Part 1 activities relevant to Methane and nitrous oxide emissions from agriculture are listed under Crosscutting Activities
Official Name of Activity Website or Link to Associated Statute
Federal activities applicable to a single CCTP Sector are provided below (non-crosscutting activities):
Strategic Goal Area: Emissions of high global warming potential gases
27 Part 1 activities relevant to Emissions of high GWP gases are listed under Crosscutting Activities

Annex B January 2009
B-19
Official Name of Activity Lead
Agency Website or Link to Associated Statute
Federal activities applicable to a single CCTP Sector are provided below (non-crosscutting activities):
Strategic Goal Area: Nitrous oxide emissions from combustion and industrial sources
Accelerated amortization for atmospheric pollution control facilities Treasury
http://frwebgate.access.gpo.gov/cgi-bin/getdoc.cgi?dbname=109_cong_bills&docid=f:h6enr.txt.pdf
Clean Air Interstate Rule (CAIR) EPA http://www.epa.gov/cair/index.html
Clean Air Nonroad Diesel Rule EPA http://www.epa.gov/nonroad-diesel/2004fr.htm
Clean Ports USA EPA http://www.epa.gov/cleandiesel/ports/
Heavy-Duty Highway Diesel Program EPA http://www.epa.gov/otaq/highway-diesel/index.htm National Ambient Air Quality Standards (NAAQS) EPA http://www.epa.gov/air/criteria.html
Reformulated Gasoline Program EPA http://www.epa.gov/otaq/rfg.htm
Voluntary Diesel Retrofit Program EPA http://www.epa.gov/otaq/retrofit/ 31 additional Part 1 activities relevant to Nitrous oxide emissions from combustion and industrial sources are listed under Crosscutting Activities

Strategies for Commercialization and Deployment
B-20
DEPLOYMENT INVENTORY PART 2 The Deployment Inventory Part 2 provides a sample of new developments that could augment the large array of existing policies and measures presented in Part 1. These include deployment activities that are enacted or authorized (by EISA 2007 for example) but not yet funded or implemented. Activities where the funding or implementation status could not be determined are also included in this list. Additionally, Part 2 lists major efforts currently underway (and funded) that are already included by way of their component activities in Part 1. These are not included in Part 1 to avoid double counting, and are denoted with an asterisk in the table below.
Official Name of Activity Lead Agency
Website or Link to Associated Statute
18Seconds.org DOE, EPAhttp://www.eere.energy.gov/news/daily.cfm/hp_news_id=45 http://green.yahoo.com/18seconds/
Advanced Battery Loan Guarantee Program DOE
http://frwebgate.access.gpo.gov/cgi-bin/getdoc.cgi?dbname=110_cong_public_laws&docid=f:publ140.110.pdf
Advanced Energy Initiative* DOE http://www.whitehouse.gov/stateoftheunion/2006/energy/index.html
Advanced Geothermal Energy Research and Development Act of 2007 DOE
http://frwebgate.access.gpo.gov/cgi-bin/getdoc.cgi?dbname=110_cong_public_laws&docid=f:publ140.110.pdf
Advanced Technology Locomotive Grant Pilot Program DOT, EPA
http://frwebgate.access.gpo.gov/cgi-bin/getdoc.cgi?dbname=110_cong_public_laws&docid=f:publ140.110.pdf
Advanced Technology Vehicles Manufacturing Incentive Program DOE
http://frwebgate.access.gpo.gov/cgi-bin/getdoc.cgi?dbname=110_cong_public_laws&docid=f:publ140.110.pdf
Alliance for Small Business Opportunities (NASBO) NASA http://sbir.gsfc.nasa.gov/SBIR/nasbo.html Assessment of Carbon Sequestration and Methane and Nitrous Oxide Emissions from Ecosystems USGS
http://frwebgate.access.gpo.gov/cgi-bin/getdoc.cgi?dbname=110_cong_public_laws&docid=f:publ140.110.pdf
Assistance to Promote Clean and Energy Efficient Technologies in Foreign Countries
USAID, DOC
http://frwebgate.access.gpo.gov/cgi-bin/getdoc.cgi?dbname=110_cong_public_laws&docid=f:publ140.110.pdf
Atlantic Interoperability Initiative to Reduce Emissions (AIRE) DOT
http://www.faa.gov/news/speeches/news_story.cfm?newsId=8989 http://www.faa.gov/about/office_org/headquarters_offices/ato/publications/071024%20A_AIRE_Partners_Briefing.pdf
Biodiesel and renewable diesel tax credit Treasury
http://frwebgate.access.gpo.gov/cgi-bin/getdoc.cgi?dbname=109_cong_bills&docid=f:h6enr.txt.pdf
Biofuels and Biorefinery Information Center
DOE, USDA
http://frwebgate.access.gpo.gov/cgi-bin/getdoc.cgi?dbname=110_cong_public_laws&docid=f:publ140.110.pdf
Biomass-based Diesel and Biodiesel Labeling FTC
http://frwebgate.access.gpo.gov/cgi-bin/getdoc.cgi?dbname=110_cong_public_laws&docid=f:publ140.110.pdf
Biorefinery Commercialization (EPAct Section 932) DOE
http://www1.eere.energy.gov/biomass/federal_biomass.html http://www1.eere.energy.gov/office_eere/congressional_test_050807_house.html
Biorefinery Energy Efficiency DOE
http://frwebgate.access.gpo.gov/cgi-bin/getdoc.cgi?dbname=110_cong_public_laws&docid=f:publ140.110.pdf
Bright Tomorrow Lighting Prizes DOE
http://frwebgate.access.gpo.gov/cgi-bin/getdoc.cgi?dbname=110_cong_public_laws&docid=f:publ140.110.pdf
Building Technologies Program* DOE http://www.eere.energy.gov/buildings/about/index.html
Carbon Capture Demonstration Program DOE
http://frwebgate.access.gpo.gov/cgi-bin/getdoc.cgi?dbname=110_cong_public_laws&docid=f:publ140.110.pdf

Annex B January 2009
B-21
Official Name of Activity Lead Agency
Website or Link to Associated Statute
Carbon Sequestration Capacity Assessment USGS
http://frwebgate.access.gpo.gov/cgi-bin/getdoc.cgi?dbname=110_cong_public_laws&docid=f:publ140.110.pdf http://energy.er.usgs.gov/health_environment/co2_sequestration/
Carbon Sequestration Program* DOE http://www.fossil.energy.gov/programs/sequestration/index.html
Center for Geothermal Technology Transfer DOE
http://frwebgate.access.gpo.gov/cgi-bin/getdoc.cgi?dbname=110_cong_public_laws&docid=f:publ140.110.pdf
Clean Energy Application Centers DOE
http://frwebgate.access.gpo.gov/cgi-bin/getdoc.cgi?dbname=110_cong_public_laws&docid=f:publ140.110.pdf
Clean Energy Initiative: Powering Sustainable Development from Village to Metropolis* DOS http://www.state.gov/g/oes/rls/fs/2002/16387.htm Climate Change Technology Program (CCTP)* DOE http://www.climatetechnology.gov/
Commercial Insulation Demonstration Program DOE
http://frwebgate.access.gpo.gov/cgi-bin/getdoc.cgi?dbname=110_cong_public_laws&docid=f:publ140.110.pdf
Convention on Supplementary Compensation for Nuclear Damage DOE
http://frwebgate.access.gpo.gov/cgi-bin/getdoc.cgi?dbname=110_cong_public_laws&docid=f:publ140.110.pdf
Cool Your World With ENERGY STAR EPA http://www.energystar.gov/index.cfm?c=heat_cool.pr_consumer_cool_change
Demonstration Grant Program for Local Governments EPA
http://frwebgate.access.gpo.gov/cgi-bin/getdoc.cgi?dbname=110_cong_public_laws&docid=f:publ140.110.pdf
Department of Energy Carbon Capture and Sequestration Research, Development, and Demonstration Act of 2007 DOE
http://frwebgate.access.gpo.gov/cgi-bin/getdoc.cgi?dbname=110_cong_public_laws&docid=f:publ140.110.pdf
Domestic Manufacturing Conversion Grant Program DOE http://www.eere.energy.gov/afdc/incentives_laws_epact.html Electric Markets Technical Assistance Program (State and Regional Policy Assistance)* DOE http://www.oe.energy.gov/state_assist.htm
Electric Vehicle Tax Credit Treasury http://frwebgate.access.gpo.gov/cgi-bin/getdoc.cgi?dbname=109_cong_bills&docid=f:h6enr.txt.pdf
Electricity Delivery and Energy Reliability Program* DOE
http://www.oe.energy.gov/ http://www.mbe.doe.gov/budget/07budget/Content/Volumes/vol_3_ES.pdf
Energy Efficiency and Conservation Block Grants DOE
http://frwebgate.access.gpo.gov/cgi-bin/getdoc.cgi?dbname=110_cong_public_laws&docid=f:publ140.110.pdf
Energy Efficiency and Renewable Energy Worker Training Program (Green Jobs Act of 2007) DOL, DOE
http://frwebgate.access.gpo.gov/cgi-bin/getdoc.cgi?dbname=110_cong_public_laws&docid=f:publ140.110.pdf
Energy Efficiency for Data Center Buildings DOE, EPA
http://frwebgate.access.gpo.gov/cgi-bin/getdoc.cgi?dbname=110_cong_public_laws&docid=f:publ140.110.pdf
Energy Independence and Security Act of 2007* Many
http://frwebgate.access.gpo.gov/cgi-bin/getdoc.cgi?dbname=110_cong_public_laws&docid=f:publ140.110.pdf
Energy Information Administration (EIA)* DOE http://www.eia.doe.gov/
Energy Policy Act of 1992* http://thomas.loc.gov/cgi-bin/query/z?c102:H.R.776.ENR: http://www.cbo.gov/showdoc.cfm?index=6218&sequence=0
Energy Policy Act of 2005 * http://frwebgate.access.gpo.gov/cgi-

Strategies for Commercialization and Deployment
B-22
Official Name of Activity Lead Agency
Website or Link to Associated Statute
bin/getdoc.cgi?dbname=109_cong_bills&docid=f:h6enr.txt.pdf
Energy Policy Act of 2005 - Title XIII Tax Incentives* http://www.cbo.gov/showdoc.cfm?index=6581&sequence=0 Energy Policy Act of 2005 Title VII—Vehicles and Fuels*
http://frwebgate.access.gpo.gov/cgi-bin/getdoc.cgi?dbname=109_cong_bills&docid=f:h6enr.txt.pdf
Energy Savings in Government and Public Institutions - United States Capitol Complex AOC
http://frwebgate.access.gpo.gov/cgi-bin/getdoc.cgi?dbname=110_cong_public_laws&docid=f:publ140.110.pdf
Energy Storage for Transportation and Electric Power (U.S. Energy Storage Competitiveness Act of 2007) DOE
http://frwebgate.access.gpo.gov/cgi-bin/getdoc.cgi?dbname=110_cong_public_laws&docid=f:publ140.110.pdf
Energy Sustainability and Efficiency Grants and Loans for Institutions DOE
http://frwebgate.access.gpo.gov/cgi-bin/getdoc.cgi?dbname=110_cong_public_laws&docid=f:publ140.110.pdf
Energy-Intensive Industries Program DOE
http://frwebgate.access.gpo.gov/cgi-bin/getdoc.cgi?dbname=110_cong_public_laws&docid=f:publ140.110.pdf
Federal and State Procurement of Fuel Cell Vehicles and Hydrogen Energy Systems DOE http://www.eere.energy.gov/afdc/incentives_laws_epact.html Federal Energy Management Program (FEMP)* DOE http://www1.eere.energy.gov/femp/about/index.html
Federal Fleet Conservation Requirements DOE
http://frwebgate.access.gpo.gov/cgi-bin/getdoc.cgi?dbname=110_cong_public_laws&docid=f:publ140.110.pdf
Federal Fleet Fueling Centers Many
http://frwebgate.access.gpo.gov/cgi-bin/getdoc.cgi?dbname=110_cong_public_laws&docid=f:publ140.110.pdf
Federal Woody Biomass*
DOI, DOE, EPA, USDA
http://www.forestsandrangelands.gov/Woody_Biomass/index.shtml http://www.fs.fed.us/forestmanagement/WoodyBiomassUtilization/index.shtml
Geologic Sequestration Training and Research DOE, NAS
http://frwebgate.access.gpo.gov/cgi-bin/getdoc.cgi?dbname=110_cong_public_laws&docid=f:publ140.110.pdf
Grants for Biofuel Production R&D in Certain States DOE
http://frwebgate.access.gpo.gov/cgi-bin/getdoc.cgi?dbname=110_cong_public_laws&docid=f:publ140.110.pdf
Grants for Production of Advanced Biofuels DOE
http://frwebgate.access.gpo.gov/cgi-bin/getdoc.cgi?dbname=110_cong_public_laws&docid=f:publ140.110.pdf
Group of 8 (G8) Gleneagles 2005 Plan of Action: Climate Change, Clean Energy and Sustainable Development*
White House
http://www.g8.gov.uk/servlet/Front?pagename=OpenMarket/Xcelerate/ShowPage&c=Page&cid=1094235520309 http://www.whitehouse.gov/news/releases/2005/07/20050708-2.html http://www.fco.gov.uk/Files/kfile/PostG8_Gleneagles_CCChangePlanofAction.pdf
Healthy High-Performance Schools EPA
http://frwebgate.access.gpo.gov/cgi-bin/getdoc.cgi?dbname=110_cong_public_laws&docid=f:publ140.110.pdf
Healthy Homes and Communities Partnership* EPA http://www.state.gov/g/oes/rls/fs/2003/19942.htm
H-Prize DOE
http://frwebgate.access.gpo.gov/cgi-bin/getdoc.cgi?dbname=110_cong_public_laws&docid=f:publ140.110.pdf
Hydrogen, Fuel Cells & Infrastructure Technologies Program (HFCIT)* DOE http://www1.eere.energy.gov/hydrogenandfuelcells/
Industrial Technologies Program* DOE
http://www1.eere.energy.gov/industry/ http://www.mbe.doe.gov/budget/07budget/Content/Volumes/vol_3_ES.pdf

Annex B January 2009
B-23
Official Name of Activity Lead Agency
Website or Link to Associated Statute
Integrated Earth Observation System (IEOS) NASA http://usgeo.gov/docs/EOCStrategic_Plan.pdf
International Clean Energy Foundation
DOS, DOE,
USAID
http://frwebgate.access.gpo.gov/cgi-bin/getdoc.cgi?dbname=110_cong_public_laws&docid=f:publ140.110.pdf
International Geothermal Energy Development
DOE, USTDA
http://frwebgate.access.gpo.gov/cgi-bin/getdoc.cgi?dbname=110_cong_public_laws&docid=f:publ140.110.pdf
Marine and Hydrokinetic Renewable Energy Research and Development Act
DOE, DOI, DOC
http://frwebgate.access.gpo.gov/cgi-bin/getdoc.cgi?dbname=110_cong_public_laws&docid=f:publ140.110.pdf
Modernization of Electric Grid DOE
http://frwebgate.access.gpo.gov/cgi-bin/getdoc.cgi?dbname=110_cong_public_laws&docid=f:publ140.110.pdf
NASA Earth Missions (Terra, Aqua, Aura, NPP, OCO, Suborbital) NASA http://science.hq.nasa.gov/missions/earth.html National Clean Diesel Campaign (NCDC)* EPA http://www.epa.gov/cleandiesel/ National Climate Change Technology Initiative (NCCTI)* DOE http://www.climatetechnology.gov/about/NCCTIprioritiesFY2007.htm
National Media Campaign to Save Energy DOE
http://frwebgate.access.gpo.gov/cgi-bin/getdoc.cgi?dbname=110_cong_public_laws&docid=f:publ140.110.pdf
National Resources Conservation Service Programs* USDA http://www.nrcs.usda.gov/PROGRAMS/
Near-term Transportation Sector Electrification Program DOE
http://frwebgate.access.gpo.gov/cgi-bin/getdoc.cgi?dbname=110_cong_public_laws&docid=f:publ140.110.pdf
New Source Performance Standards (NSPS)* EPA http://www.epa.gov/Region7/programs/artd/air/nsps/nsps.htm
Office of Commercial High Performance Green Buildings DOE
http://frwebgate.access.gpo.gov/cgi-bin/getdoc.cgi?dbname=110_cong_public_laws&docid=f:publ140.110.pdf
Office of Federal High Performance Green Buildings GSA
http://frwebgate.access.gpo.gov/cgi-bin/getdoc.cgi?dbname=110_cong_public_laws&docid=f:publ140.110.pdf
Oil & Natural Gas Transmission, Distribution & Storage Program DOE http://www.fossil.energy.gov/programs/oilgas/delivery/index.html
Plug-in Electric Drive Vehicle Program DOE
http://frwebgate.access.gpo.gov/cgi-bin/getdoc.cgi?dbname=110_cong_public_laws&docid=f:publ140.110.pdf
Product Stewardship* EPA http://www.epa.gov/epaoswer/non-hw/reduce/epr/index.htm
Renewable Energy Deployment Grants DOE
http://frwebgate.access.gpo.gov/cgi-bin/getdoc.cgi?dbname=110_cong_public_laws&docid=f:publ140.110.pdf
Renewable Energy Innovation Manufacturing Partnership DOE
http://frwebgate.access.gpo.gov/cgi-bin/getdoc.cgi?dbname=110_cong_public_laws&docid=f:publ140.110.pdf
Renewable Fuel Infrastructure Grants DOE
http://frwebgate.access.gpo.gov/cgi-bin/getdoc.cgi?dbname=110_cong_public_laws&docid=f:publ140.110.pdf
Renewable Fuel Rules for New Facilities EPA
http://frwebgate.access.gpo.gov/cgi-bin/getdoc.cgi?dbname=110_cong_public_laws&docid=f:publ140.110.pdf
Residential Energy Conservation Subsidy Exclusion Treasury
http://www.dsireusa.org/library/includes/SeeAllFederal.cfm?Search=federal&federal=federal&state=federal¤tpageid=1&ee=0&re=1
Significant New Alternatives Policy (SNAP) Program* EPA http://www.epa.gov/ozone/snap/
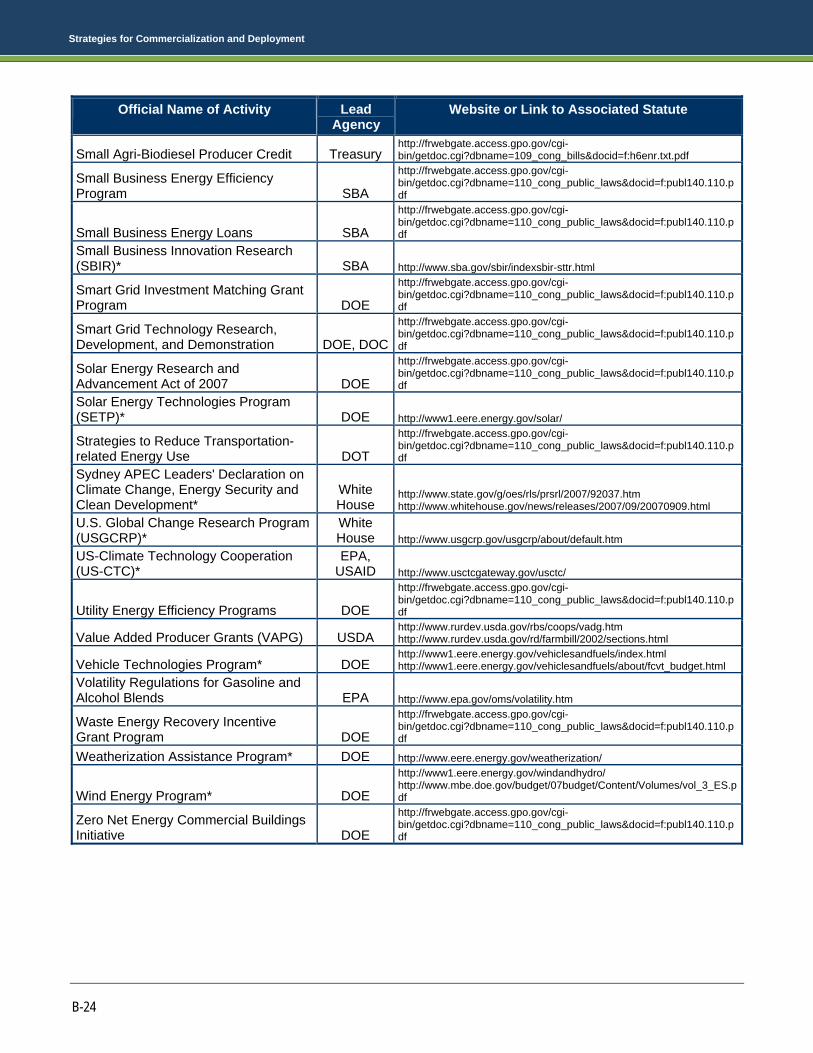
Strategies for Commercialization and Deployment
B-24
Official Name of Activity Lead Agency
Website or Link to Associated Statute
Small Agri-Biodiesel Producer Credit Treasury http://frwebgate.access.gpo.gov/cgi-bin/getdoc.cgi?dbname=109_cong_bills&docid=f:h6enr.txt.pdf
Small Business Energy Efficiency Program SBA
http://frwebgate.access.gpo.gov/cgi-bin/getdoc.cgi?dbname=110_cong_public_laws&docid=f:publ140.110.pdf
Small Business Energy Loans SBA
http://frwebgate.access.gpo.gov/cgi-bin/getdoc.cgi?dbname=110_cong_public_laws&docid=f:publ140.110.pdf
Small Business Innovation Research (SBIR)* SBA http://www.sba.gov/sbir/indexsbir-sttr.html
Smart Grid Investment Matching Grant Program DOE
http://frwebgate.access.gpo.gov/cgi-bin/getdoc.cgi?dbname=110_cong_public_laws&docid=f:publ140.110.pdf
Smart Grid Technology Research, Development, and Demonstration DOE, DOC
http://frwebgate.access.gpo.gov/cgi-bin/getdoc.cgi?dbname=110_cong_public_laws&docid=f:publ140.110.pdf
Solar Energy Research and Advancement Act of 2007 DOE
http://frwebgate.access.gpo.gov/cgi-bin/getdoc.cgi?dbname=110_cong_public_laws&docid=f:publ140.110.pdf
Solar Energy Technologies Program (SETP)* DOE http://www1.eere.energy.gov/solar/
Strategies to Reduce Transportation-related Energy Use DOT
http://frwebgate.access.gpo.gov/cgi-bin/getdoc.cgi?dbname=110_cong_public_laws&docid=f:publ140.110.pdf
Sydney APEC Leaders' Declaration on Climate Change, Energy Security and Clean Development*
White House
http://www.state.gov/g/oes/rls/prsrl/2007/92037.htm http://www.whitehouse.gov/news/releases/2007/09/20070909.html
U.S. Global Change Research Program (USGCRP)*
White House http://www.usgcrp.gov/usgcrp/about/default.htm
US-Climate Technology Cooperation (US-CTC)*
EPA, USAID http://www.usctcgateway.gov/usctc/
Utility Energy Efficiency Programs DOE
http://frwebgate.access.gpo.gov/cgi-bin/getdoc.cgi?dbname=110_cong_public_laws&docid=f:publ140.110.pdf
Value Added Producer Grants (VAPG) USDA http://www.rurdev.usda.gov/rbs/coops/vadg.htm http://www.rurdev.usda.gov/rd/farmbill/2002/sections.html
Vehicle Technologies Program* DOE http://www1.eere.energy.gov/vehiclesandfuels/index.html http://www1.eere.energy.gov/vehiclesandfuels/about/fcvt_budget.html
Volatility Regulations for Gasoline and Alcohol Blends EPA http://www.epa.gov/oms/volatility.htm
Waste Energy Recovery Incentive Grant Program DOE
http://frwebgate.access.gpo.gov/cgi-bin/getdoc.cgi?dbname=110_cong_public_laws&docid=f:publ140.110.pdf
Weatherization Assistance Program* DOE http://www.eere.energy.gov/weatherization/
Wind Energy Program* DOE
http://www1.eere.energy.gov/windandhydro/ http://www.mbe.doe.gov/budget/07budget/Content/Volumes/vol_3_ES.pdf
Zero Net Energy Commercial Buildings Initiative DOE
http://frwebgate.access.gpo.gov/cgi-bin/getdoc.cgi?dbname=110_cong_public_laws&docid=f:publ140.110.pdf

Annex C January 2009
C-1
Annex C. Deployment-Related Activities of States and the District of Columbia85
Many U.S. states and regions have begun taking actions to reduce GHG emissions, such as setting emission reduction targets, mandating investment in renewable energy sources and energy efficiency, and developing action plans to mitigate and adapt to climate change. Annex D lists eleven key activities that the States and the District of Columbia are undertaking to encourage the deployment of GHG mitigating technologies and designates which States are undertaking each of these activities. Note that Annex D does not attempt to evaluate the magnitude, maturity or effectiveness of these activities. The information in Annex D was provided by the U.S. Environmental Protection Agency, with supplemental information from the Pew Center on Global Climate Change, and is accurate as of April 2008. It is provided as an illustration of the extensive deployment activities occurring at all levels of government. For the most up-to-date information, please see the U.S. Environmental Protection Agency, which refreshes its data quarterly.
85 Pew Center on Global Climate Change, http://pewclimate.org/ and EPA, “State Best Practices,” http://www.epa.gov/cleanenergy/stateandlocal/activities.htm.

Strategies for Commercialization and Deployment
C-2
States & D.C. GH
G E
mis
sion
s Ta
rget
s
Ren
ewab
le P
ortfo
lio
Stan
dard
s
Vehi
cle
GH
G S
tand
ards
86
Reg
iona
l GH
G In
itiat
ives
Clim
ate
Act
ion
Plan
s
GH
G R
epor
ting
&
Reg
istr
ies
GH
G In
vent
ory
Publ
ic B
enef
it Fu
nd
Gre
en P
ricin
g Pr
ogra
ms
Bio
fuel
s M
anda
tes
or
Ince
ntiv
es
Ener
gy E
ffici
ency
R
esou
rce
Stan
dard
s
Alabama
Alaska
Arizona
Arkansas
California
Colorado
Connecticut
D.C.
Delaware
Florida
Georgia
Hawaii
Idaho
Illinois
Indiana
Iowa
Kansas
Kentucky
Louisiana
Maine
Maryland
Massachusetts
Michigan
Minnesota
Mississippi
Missouri
86 States poised to adopt California vehicle GHG standards.(Pew Center on Global Climate Change).

Annex C January 2009
C-3
States & D.C. GH
G E
mis
sion
s Ta
rget
s
Ren
ewab
le P
ortfo
lio
Stan
dard
s
Vehi
cle
GH
G S
tand
ards
86
Reg
iona
l GH
G In
itiat
ives
Clim
ate
Act
ion
Plan
s
GH
G R
epor
ting
&
Reg
istr
ies
GH
G In
vent
ory
Publ
ic B
enef
it Fu
nd
Gre
en P
ricin
g Pr
ogra
ms
Bio
fuel
s M
anda
tes
or
Ince
ntiv
es
Ener
gy E
ffici
ency
R
esou
rce
Stan
dard
s
Montana
Nebraska
Nevada
New Hampshire
New Jersey
New Mexico
New York
North Carolina
North Dakota
Ohio
Oklahoma
Oregon
Pennsylvania
Rhode Island
South Carolina
South Dakota
Tennessee
Texas
Utah
Vermont
Virginia
Washington
West Virginia
Wisconsin
Wyoming

Strategies for Commercialization and Deployment
C-4

Annex D January 2009
D-1
Annex D. Energy Policy Act of 2005, Title XVI

Strategies for Commercialization and Deployment
D-2
H.R.6
Energy Policy Act of 2005 (Enrolled as Agreed to or Passed by Both House and Senate)
TITLE XVI--CLIMATE CHANGE
Subtitle A--National Climate Change Technology Deployment
SEC. 1601. GREENHOUSE GAS INTENSITY REDUCING TECHNOLOGY STRATEGIES.
Title XVI of the Energy Policy Act of 1992 (42 U.S.C. 13381 et seq.) is amended by adding at the end the following:
`SEC. 1610. GREENHOUSE GAS INTENSITY REDUCING STRATEGIES.
`(a) Definitions- In this section: `(1) ADVISORY COMMITTEE- The term `Advisory Committee' means the Climate Change Technology Advisory Committee established under subsection (f)(1). `(2) CARBON SEQUESTRATION- The term `carbon sequestration' means the capture of carbon dioxide through terrestrial, geological, biological, or other means, which prevents the release of carbon dioxide into the atmosphere. `(3) COMMITTEE- The term `Committee' means the Committee on Climate Change Technology established under subsection (b)(1). `(4) DEVELOPING COUNTRY- The term `developing country' has the meaning given the term in section 1608(m). `(5) GREENHOUSE GAS- The term `greenhouse gas' means--
`(A) carbon dioxide; `(B) methane; `(C) nitrous oxide; `(D) hydrofluorocarbons; `(E) perfluorocarbons; and `(F) sulfur hexafluoride.
`(6) GREENHOUSE GAS INTENSITY- The term `greenhouse gas intensity' means the ratio of greenhouse gas emissions to economic output. `(7) NATIONAL LABORATORY- The term `National Laboratory' has the meaning given the term in section 3(3) of the Energy Policy Act of 2005.
`(b) Committee on Climate Change Technology`( 1) IN GENERAL- Not later than 180 days after the date of enactment of this section, the President shall establish a Committee on Climate Change Technology to--
`(A) integrate current Federal climate reports; and `(B) coordinate Federal climate change technology activities and programs carried out in furtherance of the strategy developed under subsection (c)(1).
`(2) MEMBERSHIP- The Committee shall be composed of at least 7 members, including-- `(A) the Secretary, who shall chair the Committee; `(B) the Secretary of Commerce; `(C) the Chairman of the Council on Environmental Quality;

Annex D January 2009
D-3
`(D) the Secretary of Agriculture; `(E) the Administrator of the Environmental Protection Agency; `(F) the Secretary of Transportation; `(G) the Director of the Office of Science and Technology Policy ; and `(H) other representatives as may be determined by the President.
`(3) STAFF- The members of the Committee shall provide such personnel as are necessary to enable the Committee to perform its duties.
`(c) National Climate Change Technology Policy - `(1) IN GENERAL- Not later than 18 months after the date of enactment of this section, the Committee shall, based on applicable Federal climate reports, submit to the Secretary and the President a national strategy to promote the deployment and commercialization of greenhouse gas intensity reducing technologies and practices developed through research and development programs conducted by the National Laboratories, other Federal research facilities, institutions of higher education, and the private sector. `(2) UPDATES- The Committee shall--
`(A) at the time of submission of the strategy to the President under paragraph (1), also make the strategy available to the public; and `(B) update the strategy every 5 years, or more frequently as the Committee determines to be necessary.
`(d) Climate Change Technology Program- Not later than 180 days after the date on which the Committee is established under subsection (b)(1), the Secretary, in consultation with the Committee, shall establish within the Department of Energy the Climate Change Technology Program to--
`(1) assist the Committee in the interagency coordination of climate change technology research, development, demonstration, and deployment to reduce greenhouse gas intensity; and `(2) carry out the programs authorized under this section.
`(e) Technology Inventory- `(1) IN GENERAL- The Secretary shall conduct and make public an inventory and evaluation of greenhouse gas intensity reducing technologies that have been developed, or are under development, by the National Laboratories, other Federal research facilities, institutions of higher education, and the private sector to determine which technologies are suitable for commercialization and deployment. `(2) REPORT- Not later than 180 days after the completion of the inventory under paragraph (1), the Secretary shall submit to Congress a report that includes the results of the completed inventory and any recommendations of the Secretary. `(3) USE- The Secretary shall use the results of the inventory as guidance in the commercialization and deployment of greenhouse gas intensity reducing technologies. `(4) UPDATED INVENTORY- The Secretary shall--
`(A) periodically update the inventory under paragraph (1), including when determined necessary by the Committee; and `(B) make the updated inventory available to the public.
`(f) Climate Change Technology Advisory Committee- `(1) IN GENERAL- The Secretary, in consultation with the Committee, may establish under section 624 of the Department of Energy Organization Act (42 U.S.C. 7234) a Climate Change Technology Advisory Committee to identify statutory, regulatory, economic, and other barriers to the commercialization and deployment of greenhouse gas intensity reducing technologies and practices in the United States. `(2) COMPOSITION- The Advisory Committee shall be composed of the following members, to be appointed by the Secretary, in consultation with the Committee:
`(A) 1 representative shall be appointed from each National Laboratory. `(B) 3 members shall be representatives of energy - producing trade organizations.

Strategies for Commercialization and Deployment
D-4
`(C) 3 members shall represent energy -intensive trade organizations. `(D) 3 members shall represent groups that represent end-use energy and other consumers. `(E) 3 members shall be employees of the Federal Government who are experts in energy technology, intellectual property, and tax. `(F) 3 members shall be representatives of institutions of higher education with expertise in energy technology development that are recommended by the National Academy of Engineering.
`(3) REPORT- Not later than 1 year after the date of enactment of this section and annually thereafter, the Advisory Committee shall submit to the Committee a report that describes--
`(A) the findings of the Advisory Committee; and `(B) any recommendations of the Advisory Committee for the removal or reduction of barriers to commercialization, deployment, and increasing the use of greenhouse gas intensity reducing technologies and practices.
`(g) Greenhouse Gas Intensity Reducing Technology Deployment- `(1) IN GENERAL- Based on the strategy developed under subsection (c)(1), the technology inventory conducted under subsection (e)(1), the greenhouse gas intensity reducing technology study report submitted under subsection (e)(2), and reports under subsection (f)(3), if any, the Committee shall develop recommendations that would provide for the removal of domestic barriers to the commercialization and deployment of greenhouse gas intensity reducing technologies and practices. `(2) REQUIREMENTS- In developing the recommendations under paragraph (1), the Committee shall consider in the aggregate--
`(A) the cost-effectiveness of the technology; `(B) fiscal and regulatory barriers; `(C) statutory and other barriers; and `(D) intellectual property issues.
`(3) DEMONSTRATION PROJECTS- In developing recommendations under paragraph (1), the Committee may identify the need for climate change technology demonstration projects. `(4) REPORT- Not later than 18 months after the date of enactment of this section, the Committee shall submit to the President and Congress a report that--
`(A) identifies, based on the report submitted under subsection (f)(3), any barriers to, and commercial risks associated with, the deployment of greenhouse gas intensity reducing technologies; and `(B) includes a plan for carrying out demonstration projects.
`(5) UPDATES- The Committee shall-- `(A) at the time of submission of the report to Congress under paragraph (4), also make the report available to the public; and `(B) update the report every 5 years, or more frequently as the Committee determines to be necessary.
`(h) Procedures for Calculating, Monitoring, and Analyzing Greenhouse Gas Intensity- The Secretary, in collaboration with the Committee and the National Institute of Standards and Technology, and after public notice and opportunity for comment, shall develop standards and best practices for calculating, monitoring, and analyzing greenhouse gas intensity. `(i) Demonstration Projects-
`(1) IN GENERAL- The Secretary shall, subject to the availability of appropriations, support demonstration projects that--
`(A) increase the reduction of the greenhouse gas intensity to levels below that which would be achieved by technologies being used in the United States as of the date of enactment of this section; `(B) maximize the potential return on Federal investment;

Annex D January 2009
D-5
`(C) demonstrate distinct roles in public-private partnerships; `(D) produce a large-scale reduction of greenhouse gas intensity if commercialization occurred; and `(E) support a diversified portfolio to mitigate the uncertainty associated with a single technology.
`(2) COST SHARING- In supporting a demonstration project under this subsection, the Secretary shall require cost-sharing in accordance with section 988 of the Energy Policy Act of 2005. `(3) AUTHORIZATION OF APPROPRIATIONS- There are authorized to be appropriated such sums as are necessary to carry out this subsection.
`(j) Cooperative Research and Development Agreements- In carrying out greenhouse gas intensity reduction research and technology deployment activities under this subtitle, the Secretary may enter into cooperative research and development agreements under section 12 of the Stevenson-Wydler Technology Innovation Act of 1980 (15 U.S.C. 3710a).'.
Subtitle B--Climate Change Technology Deployment in Developing Countries
SEC. 1611. CLIMATE CHANGE TECHNOLOGY DEPLOYMENT IN DEVELOPING COUNTRIES.
The Global Environmental Protection Assistance Act of 1989 (Public Law 101-240; 103 Stat. 2521) is amending by adding at the end the following:
`PART C--TECHNOLOGY DEPLOYMENT IN DEVELOPING COUNTRIES `SEC. 731. DEFINITIONS.
`In this part: `(1) CARBON SEQUESTRATION- The term `carbon sequestration' means the capture of carbon dioxide through terrestrial, geological, biological, or other means, which prevents the release of carbon dioxide into the atmosphere. `(2) GREENHOUSE GAS- The term `greenhouse gas' means carbon dioxide, methane, nitrous oxide, hydrofluorocarbons, perfluorocarbons, and sulfur hexafluoride. `(3) GREENHOUSE GAS INTENSITY- The term `greenhouse gas intensity' means the ratio of greenhouse gas emissions to economic output.
`SEC. 732. REDUCTION OF GREENHOUSE GAS INTENSITY.
`(a) Lead Agency- `(1) IN GENERAL- The Department of State shall act as the lead agency for integrating into United States foreign policy the goal of reducing greenhouse gas intensity in developing countries. `(2) REPORTS-
`(A) INITIAL REPORT- Not later than 180 days after the date of enactment of this part, the Secretary of State shall submit to the appropriate authorizing and appropriating committees of Congress an initial report, based on the most recent information available to the Secretary from reliable public sources, that identifies the 25 developing countries that are the largest greenhouse gas emitters, including for each country--
`(i) an estimate of the quantity and types of energy used;

Strategies for Commercialization and Deployment
D-6
`(ii) an estimate of the greenhouse gas intensity of the energy , manufacturing, agricultural, and transportation sectors; `(iii) a description the progress of any significant projects undertaken to reduce greenhouse gas intensity; `(iv) a description of the potential for undertaking projects to reduce greenhouse gas intensity; `(v) a description of any obstacles to the reduction of greenhouse gas intensity; and `(vi) a description of the best practices learned by the Agency for International Development from conducting previous pilot and demonstration projects to reduce greenhouse gas intensity.
`(B) UPDATE- Not later than 18 months after the date on which the initial report is submitted under subparagraph (A), the Secretary shall submit to the appropriate authorizing and appropriating committees of Congress, based on the best information available to the Secretary, an update of the information provided in the initial report. `(C) USE`(
i) INITIAL REPORT- The Secretary of State shall use the initial report submitted under subparagraph (A) to establish baselines for the developing countries identified in the report with respect to the information provided under clauses (i) and (ii) of that subparagraph. `(ii) ANNUAL REPORTS- The Secretary of State shall use the annual reports prepared under subparagraph (B) and any other information available to the Secretary to track the progress of the developing countries with respect to reducing greenhouse gas intensity.
`(b) Projects- The Secretary of State, in coordination with Administrator of the United States Agency for International Development, shall (directly or through agreements with the World Bank, the International Monetary Fund, the Overseas Private Investment Corporation, and other development institutions) provide assistance to developing countries specifically for projects to reduce greenhouse gas intensity, including projects to--
`(1) leverage, through bilateral agreements, funds for reduction of greenhouse gas intensity; `(2) increase private investment in projects and activities to reduce greenhouse gas intensity; and `(3) expedite the deployment of technology to reduce greenhouse gas intensity.
`(c) Focus- In providing assistance under subsection (b), the Secretary of State shall focus on-- `(1) promoting the rule of law, property rights, contract protection, and economic freedom; and `(2) increasing capacity, infrastructure, and training.
`(d) Priority- In providing assistance under subsection (b), the Secretary of State shall give priority to projects in the 25 developing countries identified in the report submitted under subsection (a)(2)(A).
`SEC. 733. TECHNOLOGY INVENTORY FOR DEVELOPING COUNTRIES.
`(a) In General- The Secretary of Energy , in coordination with the Secretary of State and the Secretary of Commerce, shall conduct an inventory of greenhouse gas intensity reducing technologies that are developed, or under development in the United States, to identify technologies that are suitable for transfer to, deployment in, and commercialization in the developing countries identified in the report submitted under section 732(a)(2)(A). `(b) Report- Not later than 180 days after the completion of the inventory under subsection (a), the Secretary of State and the Secretary of Energy shall jointly submit to Congress a report that--
`(1) includes the results of the completed inventory; `(2) identifies obstacles to the transfer, deployment, and commercialization of the inventoried technologies;

Annex D January 2009
D-7
`(3) includes results from previous Federal reports related to the inventoried technologies; and `(4) includes an analysis of market forces related to the inventoried technologies.
`SEC. 734. TRADE-RELATED BARRIERS TO EXPORT OF GREENHOUSE GAS INTENSITY REDUCING TECHNOLOGIES.
`(a) In General- Not later than 1 year after the date of enactment of this part, the United States Trade Representative shall (as appropriate and consistent with applicable bilateral, regional, and mutual trade agreements)--
`(1) identify trade-relations barriers maintained by foreign countries to the export of greenhouse gas intensity reducing technologies and practices from the United States to the developing countries identified in the report submitted under section 732(a)(2)(A); and `(2) negotiate with foreign countries for the removal of those barriers.
`(b) Annual Report- Not later than 1 year after the date on which a report is submitted under subsection (a)(1) and annually thereafter, the United States Trade Representative shall submit to Congress a report that describes any progress made with respect to removing the barriers identified by the United States Trade Representative under subsection (a)(1).
`SEC. 735. GREENHOUSE GAS INTENSITY REDUCING TECHNOLOGY EXPORT INITIATIVE.
`(a) In General- There is established an interagency working group to carry out a Greenhouse Gas Intensity Reducing Technology Export Initiative to--
`(1) promote the export of greenhouse gas intensity reducing technologies and practices from the United States; `(2) identify developing countries that should be designated as priority countries for the purpose of exporting greenhouse gas intensity reducing technologies and practices, based on the report submitted under section 732(a)(2)(A); `(3) identify potential barriers to adoption of exported greenhouse gas intensity reducing technologies and practices based on the reports submitted under section 734; and `(4) identify previous efforts to export energy technologies to learn best practices.
`(b) Composition- The working group shall be composed of -- `(1) the Secretary of State, who shall act as the head of the working group; `(2) the Administrator of the United States Agency for International Development; `(3) the United States Trade Representative; `(4) a designee of the Secretary of Energy ; `(5) a designee of the Secretary of Commerce; and `(6) a designee of the Administrator of the Environmental Protection Agency.
`(c) Performance Reviews and Reports- Not later than 180 days after the date of enactment of this part and each year thereafter, the interagency working group shall--
`(1) conduct a performance review of actions taken and results achieved by the Federal Government (including each of the agencies represented on the interagency working group) to promote the export of greenhouse gas intensity reducing technologies and practices from the United States; and `(2) submit to the appropriate authorizing and appropriating committees of Congress a report that describes the results of the performance reviews and evaluates progress in promoting the export of greenhouse gas intensity reducing technologies and practices from the United States, including any recommendations for increasing the export of the technologies and practices.

Strategies for Commercialization and Deployment
D-8

