chapter 7, appendix a...chapter 7, appendix a - field manual for pennsylvania design rainfall...
TRANSCRIPT
Chapter 7, Appendix A - Field Manual for Pennsylvania Design Rainfall Intensity Publication 584 Charts from NOAA Atlas 14 Version 3 Data 2010 Edition
7A - 1
CHAPTER 7, APPENDIX A
FIELD MANUAL FOR PENNSYLVANIA DESIGN RAINFALL INTENSITY CHARTS
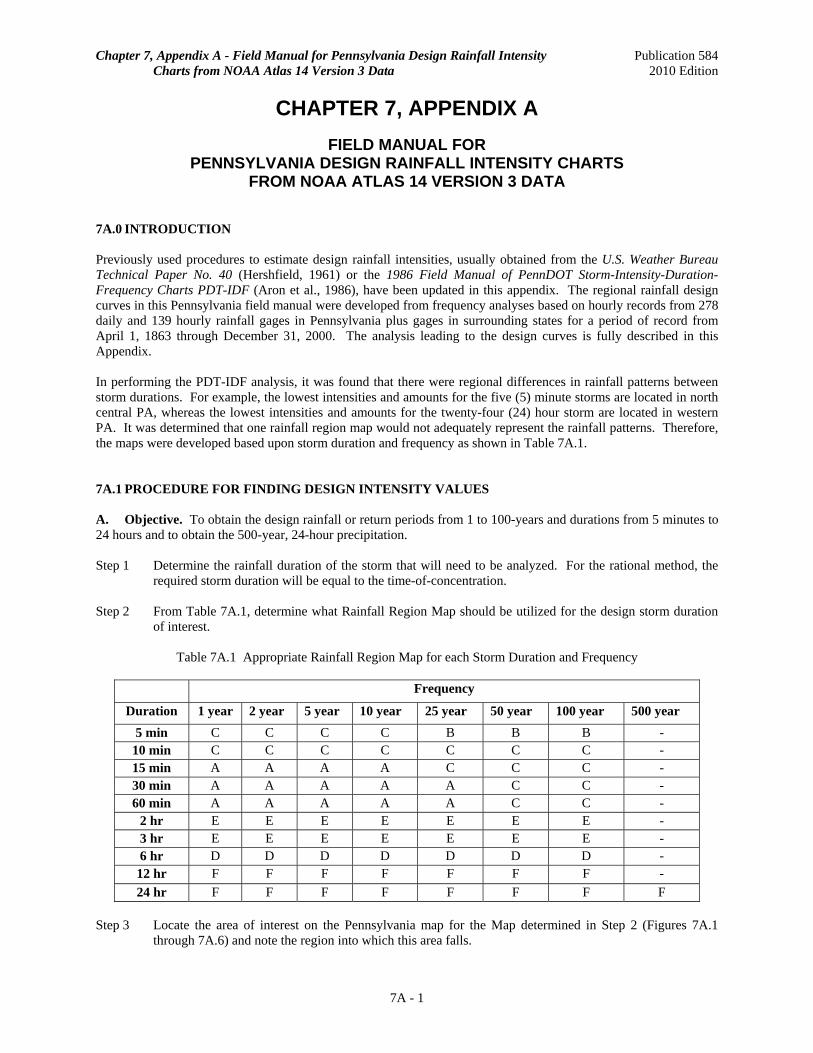
FROM NOAA ATLAS 14 VERSION 3 DATA 7A.0 INTRODUCTION Previously used procedures to estimate design rainfall intensities, usually obtained from the U.S. Weather Bureau Technical Paper No. 40 (Hershfield, 1961) or the 1986 Field Manual of PennDOT Storm-Intensity-Duration-Frequency Charts PDT-IDF (Aron et al., 1986), have been updated in this appendix. The regional rainfall design curves in this Pennsylvania field manual were developed from frequency analyses based on hourly records from 278 daily and 139 hourly rainfall gages in Pennsylvania plus gages in surrounding states for a period of record from April 1, 1863 through December 31, 2000. The analysis leading to the design curves is fully described in this Appendix. In performing the PDT-IDF analysis, it was found that there were regional differences in rainfall patterns between storm durations. For example, the lowest intensities and amounts for the five (5) minute storms are located in north central PA, whereas the lowest intensities and amounts for the twenty-four (24) hour storm are located in western PA. It was determined that one rainfall region map would not adequately represent the rainfall patterns. Therefore, the maps were developed based upon storm duration and frequency as shown in Table 7A.1. 7A.1 PROCEDURE FOR FINDING DESIGN INTENSITY VALUES A. Objective. To obtain the design rainfall or return periods from 1 to 100-years and durations from 5 minutes to 24 hours and to obtain the 500-year, 24-hour precipitation. Step 1 Determine the rainfall duration of the storm that will need to be analyzed. For the rational method, the
required storm duration will be equal to the time-of-concentration. Step 2 From Table 7A.1, determine what Rainfall Region Map should be utilized for the design storm duration
of interest.
Table 7A.1 Appropriate Rainfall Region Map for each Storm Duration and Frequency
Frequency
Duration 1 year 2 year 5 year 10 year 25 year 50 year 100 year 500 year 5 min C C C C B B B -
10 min C C C C C C C - 15 min A A A A C C C - 30 min A A A A A C C - 60 min A A A A A C C -
2 hr E E E E E E E - 3 hr E E E E E E E - 6 hr D D D D D D D - 12 hr F F F F F F F - 24 hr F F F F F F F F
Step 3 Locate the area of interest on the Pennsylvania map for the Map determined in Step 2 (Figures 7A.1
through 7A.6) and note the region into which this area falls.

Chapter 7, Appendix A - Field Manual for Pennsylvania Design Rainfall Intensity Publication 584 Charts from NOAA Atlas 14 Version 3 Data 2010 Edition
If a basin should be found to lie on the boundary between two regions, the intensities should be obtained from the two corresponding regional graphs and averaged. In the case that the basin is large enough to be divided into areas Ai and Aj of measurable size in the adjacent regions i and j, a weighted average intensity may be used.
j i
j j i i
AAAIAII
+
+=
Step 4 From the PDT-IDF curves for that region, determine the rainfall intensity. The rainfall values for the five-minute through six (6) hour storms can be obtained directly from Tables 7A.2(a/b) through 7A.6(a/b) for each of the five regions or from interpolation from the PDT-IDF curves, Figures 7A.7(a/b) through 7A.16(a/b). For the twelve (12) and twenty-four (24) hour storms, the rainfall values can only be obtained directly from Tables 7A.2(a/b) through 7A.6(a/b) for each of the five regions.
Table 7A.2(a) Five (5) minute through twenty-four (24) hour storm totals for Region 1 (Metric).
Region 1 Rainfall Total
1-Yr Storm 2-Yr Storm 5-Yr Storm 10-Yr Storm 25-Yr Storm 50-Yr Storm 100-Yr Storm 500-Yr Storm
Duration (Min)
cm cm cm cm cm cm cm cm
5 0.70 0.83 1.00 1.13 1.29 1.39 1.47 10 1.09 1.30 1.56 1.75 1.97 2.11 2.22 15 1.34 1.59 1.91 2.15 2.44 2.61 2.76 30 1.77 2.13 2.63 2.99 3.45 3.73 3.99 60 2.16 2.62 3.30 3.81 4.48 4.92 5.33
120 2.52 3.03 3.79 4.41 5.28 5.98 6.64 180 2.77 3.32 4.15 4.82 5.80 6.55 7.34 360 3.49 4.17 5.17 6.02 7.22 8.11 9.04 720 4.30 5.14 6.33 7.38 8.93 10.09 11.32
1440 5.18 6.19 7.59 8.74 10.40 11.80 13.30 17.11
Table 7A.2(b) Five (5) minute through twenty-four (24) hour storm totals for Region 1 (U.S. Customary).
Region 1 Rainfall Total
1-Yr Storm 2-Yr Storm 5-Yr Storm 10-Yr Storm 25-Yr Storm 50-Yr Storm 100-Yr Storm 500-Yr Storm
Duration (Min)
in in in in in in in in
5 0.28 0.33 0.39 0.45 0.51 0.55 0.58 10 0.43 0.51 0.61 0.69 0.78 0.83 0.87 15 0.53 0.63 0.75 0.85 0.96 1.03 1.09 30 0.70 0.84 1.03 1.18 1.36 1.47 1.57 60 0.85 1.03 1.30 1.50 1.76 1.94 2.10
120 0.99 1.19 1.49 1.74 2.08 2.35 2.62 180 1.09 1.31 1.63 1.90 2.28 2.58 2.89 360 1.37 1.64 2.04 2.37 2.84 3.19 3.56 720 1.69 2.02 2.49 2.91 3.52 3.97 4.46
1440 2.04 2.44 2.99 3.44 4.09 4.65 5.24 6.74
7A - 2

Chapter 7, Appendix A - Field Manual for Pennsylvania Design Rainfall Intensity Publication 584 Charts from NOAA Atlas 14 Version 3 Data 2010 Edition
7A - 3
Table 7A.3(a) Five (5) minute through twenty-four (24) hour storm totals for Region 2 (Metric).
Region 2 Rainfall Total
1-Yr Storm 2-Yr Storm 5-Yr Storm 10-Yr Storm 25-Yr Storm 50-Yr Storm 100-Yr Storm 500-Yr Storm
Duration (Min)
cm cm cm cm cm cm cm cm
5 0.76 0.91 1.08 1.22 1.40 1.52 1.63 10 1.18 1.42 1.68 1.88 2.14 2.31 2.46 15 1.45 1.73 2.07 2.32 2.65 2.86 3.06 30 1.93 2.32 2.84 3.23 3.75 4.10 4.43 60 2.36 2.87 3.60 4.15 4.88 5.40 5.93
120 2.77 3.35 4.19 4.87 5.82 6.60 7.46 180 3.05 3.67 4.59 5.34 6.41 7.29 8.27 360 3.83 4.60 5.73 6.68 8.03 9.07 10.17 720 4.73 5.67 7.01 8.20 9.97 11.36 12.84
1440 5.68 6.80 8.37 9.70 11.67 13.40 15.32 20.70
Table 7A.3(b). Five (5) minute through twenty-four (24) hour storm totals for Region 2 (U.S. Customary).
Region 2 Rainfall Total
1-Yr Storm 2-Yr Storm 5-Yr Storm 10-Yr Storm 25-Yr Storm 50-Yr Storm 100-Yr Storm 500-Yr Storm
Duration (Min)
in in in in in in in in
5 0.30 0.36 0.43 0.48 0.55 0.60 0.64 10 0.47 0.56 0.66 0.74 0.84 0.91 0.97 15 0.57 0.68 0.81 0.91 1.04 1.13 1.20 30 0.76 0.92 1.12 1.27 1.47 1.61 1.74 60 0.93 1.13 1.42 1.63 1.92 2.13 2.33
120 1.09 1.32 1.65 1.92 2.29 2.60 2.94 180 1.20 1.45 1.81 2.10 2.52 2.87 3.25 360 1.51 1.81 2.26 2.63 3.16 3.57 4.00 720 1.86 2.23 2.76 3.23 3.92 4.47 5.06
1440 2.24 2.68 3.30 3.82 4.60 5.27 6.03 8.15
Chapter 7, Appendix A - Field Manual for Pennsylvania Design Rainfall Intensity Publication 584 Charts from NOAA Atlas 14 Version 3 Data 2010 Edition
7A - 4
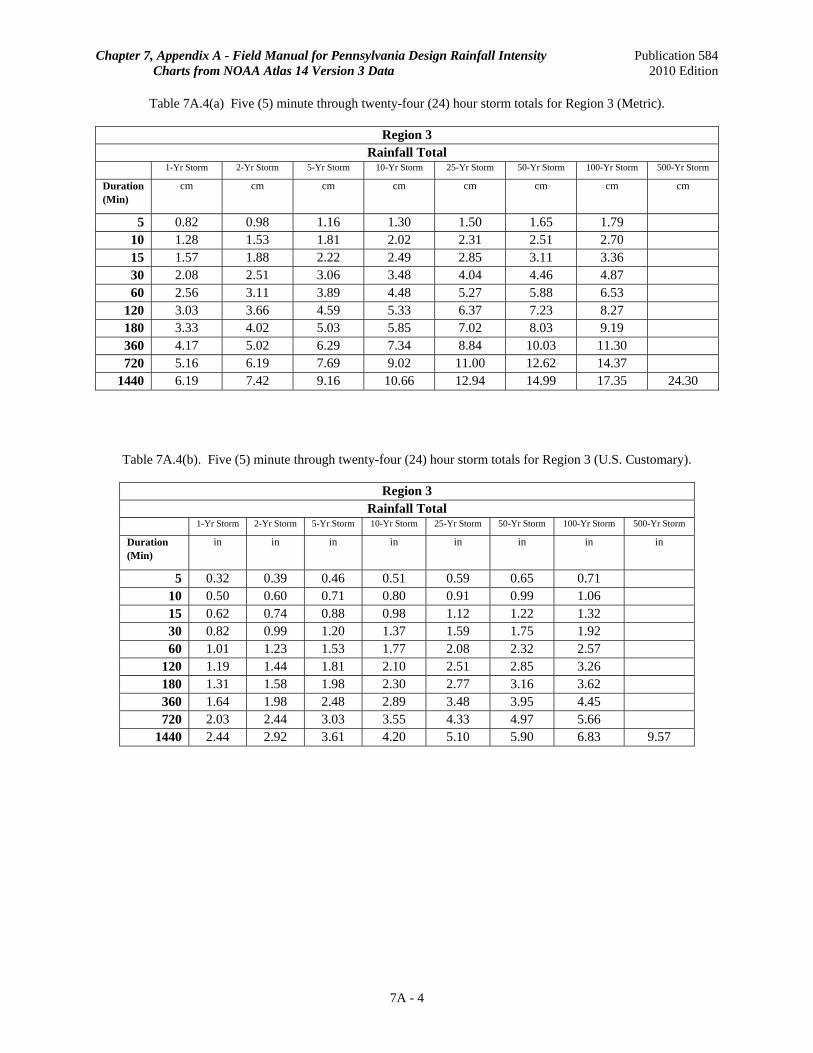
Table 7A.4(a) Five (5) minute through twenty-four (24) hour storm totals for Region 3 (Metric).
Region 3 Rainfall Total
1-Yr Storm 2-Yr Storm 5-Yr Storm 10-Yr Storm 25-Yr Storm 50-Yr Storm 100-Yr Storm 500-Yr Storm
Duration (Min)
cm cm cm cm cm cm cm cm
5 0.82 0.98 1.16 1.30 1.50 1.65 1.79 10 1.28 1.53 1.81 2.02 2.31 2.51 2.70 15 1.57 1.88 2.22 2.49 2.85 3.11 3.36 30 2.08 2.51 3.06 3.48 4.04 4.46 4.87 60 2.56 3.11 3.89 4.48 5.27 5.88 6.53
120 3.03 3.66 4.59 5.33 6.37 7.23 8.27 180 3.33 4.02 5.03 5.85 7.02 8.03 9.19 360 4.17 5.02 6.29 7.34 8.84 10.03 11.30 720 5.16 6.19 7.69 9.02 11.00 12.62 14.37
1440 6.19 7.42 9.16 10.66 12.94 14.99 17.35 24.30
Table 7A.4(b). Five (5) minute through twenty-four (24) hour storm totals for Region 3 (U.S. Customary).
Region 3 Rainfall Total
1-Yr Storm 2-Yr Storm 5-Yr Storm 10-Yr Storm 25-Yr Storm 50-Yr Storm 100-Yr Storm 500-Yr Storm
Duration (Min)
in in in in in in in in
5 0.32 0.39 0.46 0.51 0.59 0.65 0.71 10 0.50 0.60 0.71 0.80 0.91 0.99 1.06 15 0.62 0.74 0.88 0.98 1.12 1.22 1.32 30 0.82 0.99 1.20 1.37 1.59 1.75 1.92 60 1.01 1.23 1.53 1.77 2.08 2.32 2.57
120 1.19 1.44 1.81 2.10 2.51 2.85 3.26 180 1.31 1.58 1.98 2.30 2.77 3.16 3.62 360 1.64 1.98 2.48 2.89 3.48 3.95 4.45 720 2.03 2.44 3.03 3.55 4.33 4.97 5.66
1440 2.44 2.92 3.61 4.20 5.10 5.90 6.83 9.57

Chapter 7, Appendix A - Field Manual for Pennsylvania Design Rainfall Intensity Publication 584 Charts from NOAA Atlas 14 Version 3 Data 2010 Edition
7A - 5
Table 7A.5(a) Five (5) minute through twenty-four (24) hour storm totals for Region 4 (Metric).
Region 4 Rainfall Total
1-Yr Storm 2-Yr Storm 5-Yr Storm 10-Yr Storm 25-Yr Storm 50-Yr Storm 100-Yr Storm 500-Yr Storm
Duration (Min)
cm cm cm cm cm cm cm cm
5 0.89 1.06 1.24 1.39 1.61 1.78 1.95 10 1.38 1.65 1.93 2.16 2.47 2.71 2.95 15 1.69 2.02 2.38 2.66 3.06 3.36 3.66 30 2.24 2.71 3.28 3.72 4.34 4.82 5.31 60 2.76 3.36 4.18 4.82 5.67 6.36 7.12
120 3.28 3.98 4.99 5.80 6.91 7.85 9.09 180 3.61 4.36 5.47 6.37 7.64 8.77 10.11 360 4.50 5.45 6.85 7.99 9.65 10.99 12.43 720 5.59 6.72 8.37 9.84 12.03 13.88 15.89
1440 6.69 8.03 9.94 11.61 14.21 16.59 19.38 27.89
Table 7A.5(b). Five (5) minute through twenty-four (24) hour storm totals for Region 4 (U.S. Customary).
Region 4 Rainfall Total
1-Yr Storm 2-Yr Storm 5-Yr Storm 10-Yr Storm 25-Yr Storm 50-Yr Storm 100-Yr Storm 500-Yr Storm
Duration (Min)
in in in in in in in in
5 0.35 0.42 0.49 0.55 0.63 0.70 0.77 10 0.54 0.65 0.76 0.85 0.97 1.07 1.16 15 0.67 0.79 0.94 1.05 1.21 1.32 1.44 30 0.88 1.07 1.29 1.47 1.71 1.90 2.09 60 1.09 1.32 1.65 1.90 2.23 2.51 2.80
120 1.29 1.57 1.96 2.28 2.72 3.09 3.58 180 1.42 1.72 2.16 2.51 3.01 3.45 3.98 360 1.77 2.14 2.70 3.15 3.80 4.33 4.89 720 2.20 2.65 3.29 3.87 4.74 5.46 6.26
1440 2.64 3.16 3.91 4.57 5.60 6.53 7.63 10.98

Chapter 7, Appendix A - Field Manual for Pennsylvania Design Rainfall Intensity Publication 584 Charts from NOAA Atlas 14 Version 3 Data 2010 Edition
7A - 6
Table 7A.6(a) Five (5) minute through twenty-four (24) hour storm totals for Region 5 (Metric).
Region 5 Rainfall Total
1-Yr Storm 2-Yr Storm 5-Yr Storm 10-Yr Storm 25-Yr Storm 50-Yr Storm 100-Yr Storm 500-Yr Storm
Duration (Min)
cm cm cm cm cm cm cm cm
5 0.95 1.13 1.32 1.48 1.72 1.91 2.11 10 1.47 1.76 2.06 2.29 2.64 2.91 3.19 15 1.81 2.16 2.53 2.82 3.27 3.61 3.96 30 2.40 2.90 3.49 3.97 4.63 5.18 5.76 60 2.96 3.61 4.47 5.15 6.06 6.84 7.72
120 3.54 4.30 5.39 6.26 7.45 8.48 9.90 180 3.90 4.71 5.92 6.89 8.25 9.51 11.03 360 4.84 5.87 7.40 8.65 10.46 11.95 13.56 720 6.02 7.25 9.04 10.66 13.07 15.14 17.42
1440 7.20 8.64 10.73 12.57 15.49 18.19 21.40 31.49
Table 7A.6(b). Five (5) minute through twenty-four (24) hour storm totals for Region 5 (U.S. Customary).
Region 5 Rainfall Total
1-Yr Storm 2-Yr Storm 5-Yr Storm 10-Yr Storm 25-Yr Storm 50-Yr Storm 100-Yr Storm 500-Yr Storm
Duration (Min)
in in in in in in in in
5 0.37 0.45 0.52 0.58 0.68 0.75 0.83 10 0.58 0.69 0.81 0.90 1.04 1.15 1.26 15 0.71 0.85 1.00 1.11 1.29 1.42 1.56 30 0.94 1.14 1.37 1.56 1.82 2.04 2.27 60 1.17 1.42 1.76 2.03 2.39 2.69 3.04
120 1.39 1.69 2.12 2.46 2.93 3.34 3.90 180 1.53 1.86 2.33 2.71 3.25 3.75 4.34 360 1.91 2.31 2.91 3.40 4.12 4.70 5.34 720 2.37 2.86 3.56 4.20 5.15 5.96 6.86
1440 2.83 3.40 4.22 4.95 6.10 7.16 8.43 12.40

Chapter 7, Appendix A - Field Manual for Pennsylvania Design Rainfall Intensity Publication 584 Charts from NOAA Atlas 14 Version 3 Data 2010 Edition
7A - 7
1. Example. Determine the 10-year rainfall intensity for a drainage area in eastern Schuylkill County that has a time-of-concentration (Tc) of 12 minutes. Step 1 The duration would be equal to the time-of-concentration or 12 minutes Step 2 Since 12 minutes is less than half way between the midpoint between the 10- and 15-minute
increment in Table 7A.1, the Map corresponding to the 10-minute duration would be utilized, or Map C. If the Tc value falls between values shown in Table 7A.1, one should round to the nearest value in the Table. For example, if a 14-minute Tc was obtained, the map shown for the 15-minute duration should be utilized, or Map A. A value of 12.5 would also be rounded to 15 minutes and Map A chosen. Note that rounding is only necessary for map determination. The original Tc value should be utilized to obtain the rainfall intensity.
Step 3 From Map C, the site would fall in Region 4. Step 4 From the PDT-IDF curve for Region 4, the 10-year, 12-minute storm would be 12.2 cm per hour
(4.8 in per hour). NOTE: EQUATION 7.9 FOR THE RATIONAL METHOD IN METRIC UNITS USES mm/hr AS
THE RAINFALL UNIT, NOT cm/hr. CHARTS IN APPENDIX 7A ARE IN UNITS OF cm/hr. THE RAINFALL INTENSITIES DERIVED FROM APPENDIX 7A WILL NEED TO BE CONVERTED FROM cm/hr TO mm/hr FOR USE IN THE RATIONAL METHOD, METRIC UNITS.
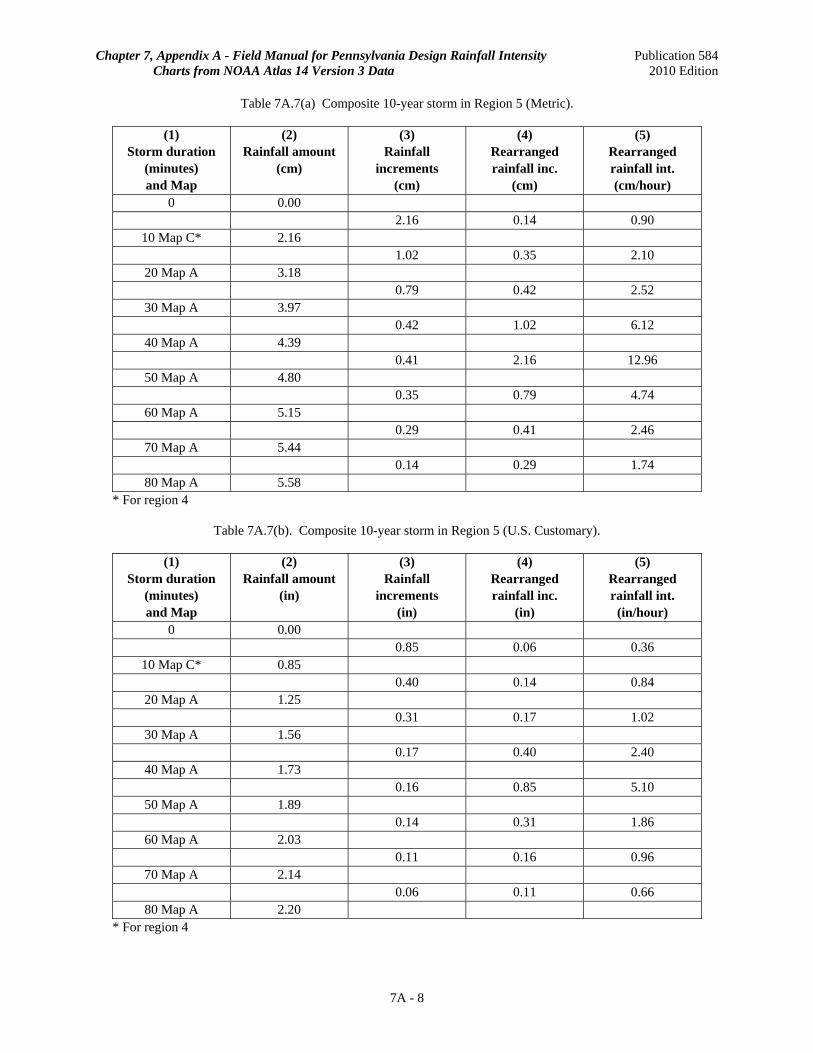
B. Composite Design Storms. In storm runoff modeling, design storms are often needed which are not only appropriate for the entire watershed, but for individual subareas as well. Design storms are typically classified by Average Recurrence Interval (ARI), which is established based upon the frequency of an event or how often an event is statistically likely to occur. The ARI is inversely equivalent to the probability that an event will occur in any given year. For instance, a 100-storm is inversely equivalent to 0.01 which means this event has a 1% chance of occurring in any given year. Similarly, the 25-year storm has is inversely equivalent to 0.04 which means this event has a 4% probability of occurring in any given year. A complete design storm, constructed as described below, will demonstrate the procedures used to obtain precipitation estimates for a given ARI which can then be used for design and analysis. The composite design storm should be generated such that the maximum rain falling over any time span (centered around the storm peak), equals the design storm depth indicated for the corresponding durations. As an example, a 10-year design storm for the same site will be constructed for a location in Map C, Region 4 for the 10-minute duration and Map A, Region 5 for the 20 through 80 minute durations. The storm is to be defined in 10-minute intervals, for a total duration of 80 minutes. The storm peak shall be placed at or right after the center of the storm and that the storm shape be approximately symmetrical. Step 1 From Figures 7A.13(b) and 7A.14(b), obtain 10-year rainfall amounts for the 10 minute duration and
from Figures 7A.15(b) and 7A.16(b), obtain 10-year rainfall amounts for the 20-… 80-minute durations (the appropriate map and region), and list them as in column (2) in Tables 7A.7(a) and 7A.7(b).
Step 2 Compute the incremental rainfall amounts between consecutive durations. Enter into column (3). Step 3 Rearrange the rainfall increments from column (3) to column (4) in a quasi-symmetrical pattern, moving
first and largest storm interval time to 40-50 minutes, the second to 30-40 minutes, the third to 50-60 minutes and so forth.
Step 4 Compute the rain intensities during the time increments, dividing column (4) by the time step (10
minutes) and multiplying by 60 minutes. Enter the intensities into column (5) and plot the hyetograph.
Chapter 7, Appendix A - Field Manual for Pennsylvania Design Rainfall Intensity Publication 584 Charts from NOAA Atlas 14 Version 3 Data 2010 Edition
7A - 8
Table 7A.7(a) Composite 10-year storm in Region 5 (Metric).
(1) Storm duration
(minutes) and Map
(2) Rainfall amount
(cm)
(3) Rainfall
increments (cm)
(4) Rearranged rainfall inc.
(cm)
(5) Rearranged rainfall int. (cm/hour)
0 0.00 2.16 0.14 0.90
10 Map C* 2.16 1.02 0.35 2.10
20 Map A 3.18 0.79 0.42 2.52
30 Map A 3.97 0.42 1.02 6.12
40 Map A 4.39 0.41 2.16 12.96
50 Map A 4.80 0.35 0.79 4.74
60 Map A 5.15 0.29 0.41 2.46
70 Map A 5.44 0.14 0.29 1.74
80 Map A 5.58 * For region 4
Table 7A.7(b). Composite 10-year storm in Region 5 (U.S. Customary).
(1) Storm duration
(minutes) and Map
(2) Rainfall amount
(in)
(3) Rainfall
increments (in)
(4) Rearranged rainfall inc.
(in)
(5) Rearranged rainfall int.
(in/hour) 0 0.00 0.85 0.06 0.36
10 Map C* 0.85 0.40 0.14 0.84
20 Map A 1.25 0.31 0.17 1.02
30 Map A 1.56 0.17 0.40 2.40
40 Map A 1.73 0.16 0.85 5.10
50 Map A 1.89 0.14 0.31 1.86
60 Map A 2.03 0.11 0.16 0.96
70 Map A 2.14 0.06 0.11 0.66
80 Map A 2.20 * For region 4

Chapter 7, Appendix A - Field Manual for Pennsylvania Design Rainfall Intensity Publication 584 Charts from NOAA Atlas 14 Version 3 Data 2010 Edition
Figure 7A.1 Map A. 15-, 30- and 60-minute durations for storms occurring with an ARI of 1-, 2-, 5-, 10-years and 30- and 60-minute durations for storms occurring with an ARI of 25-years.
7A - 9

Chapter 7, Appendix A - Field Manual for Pennsylvania Design Rainfall Intensity Publication 584 Charts from NOAA Atlas 14 Version 3 Data 2010 Edition
Figure 7A.2 Map B. 5-minute durations for storms occurring with an ARI of 25-, 50- and 100-years.
7A - 10

Chapter 7, Appendix A - Field Manual for Pennsylvania Design Rainfall Intensity Publication 584 Charts from NOAA Atlas 14 Version 3 Data 2010 Edition
Figure 7A.3 Map C. 5- and 10-minute durations for storms occurring with an ARI of 1-, 2-, 5-, and 10-years, 10- and 15-minute durations for storms occurring with an ARI of 25-years
and 10-, 15-, 30-, 60-minute durations for storms occurring with an ARI of 50- and 100-years.
7A - 11
Chapter 7, Appendix A - Field Manual for Pennsylvania Design Rainfall Intensity Publication 584 Charts from NOAA Atlas 14 Version 3 Data 2010 Edition
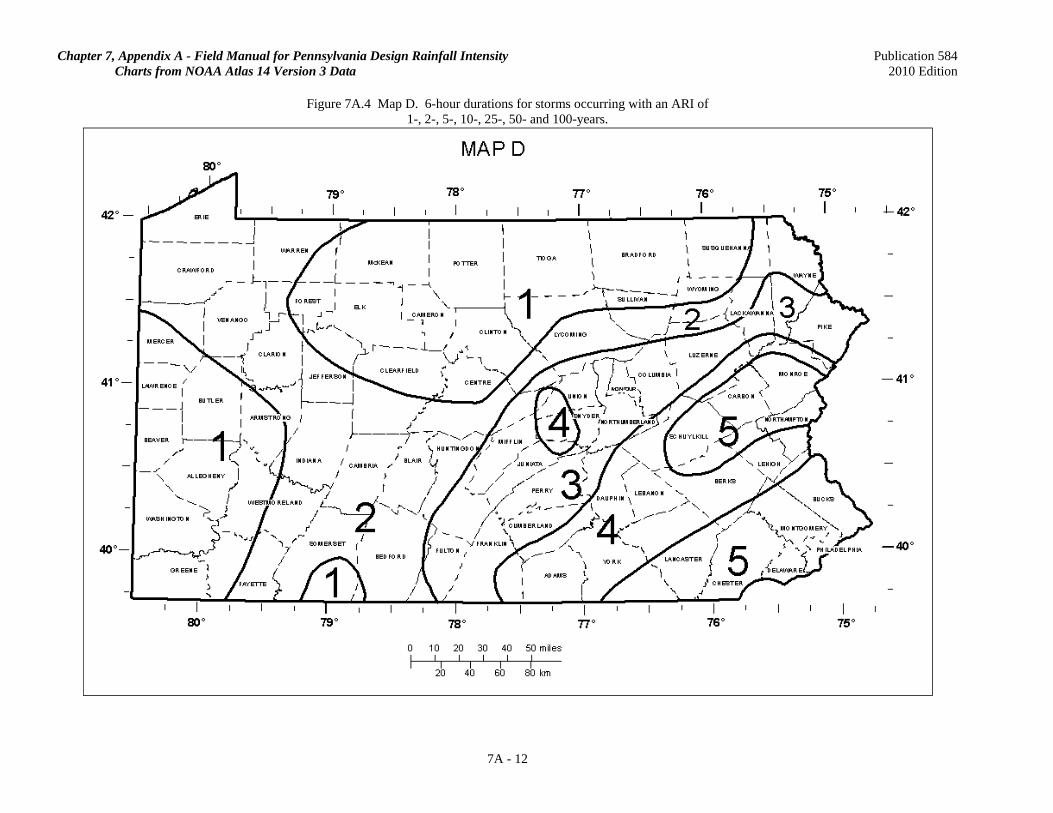
Figure 7A.4 Map D. 6-hour durations for storms occurring with an ARI of 1-, 2-, 5-, 10-, 25-, 50- and 100-years.
7A - 12
Chapter 7, Appendix A - Field Manual for Pennsylvania Design Rainfall Intensity Publication 584 Charts from NOAA Atlas 14 Version 3 Data 2010 Edition
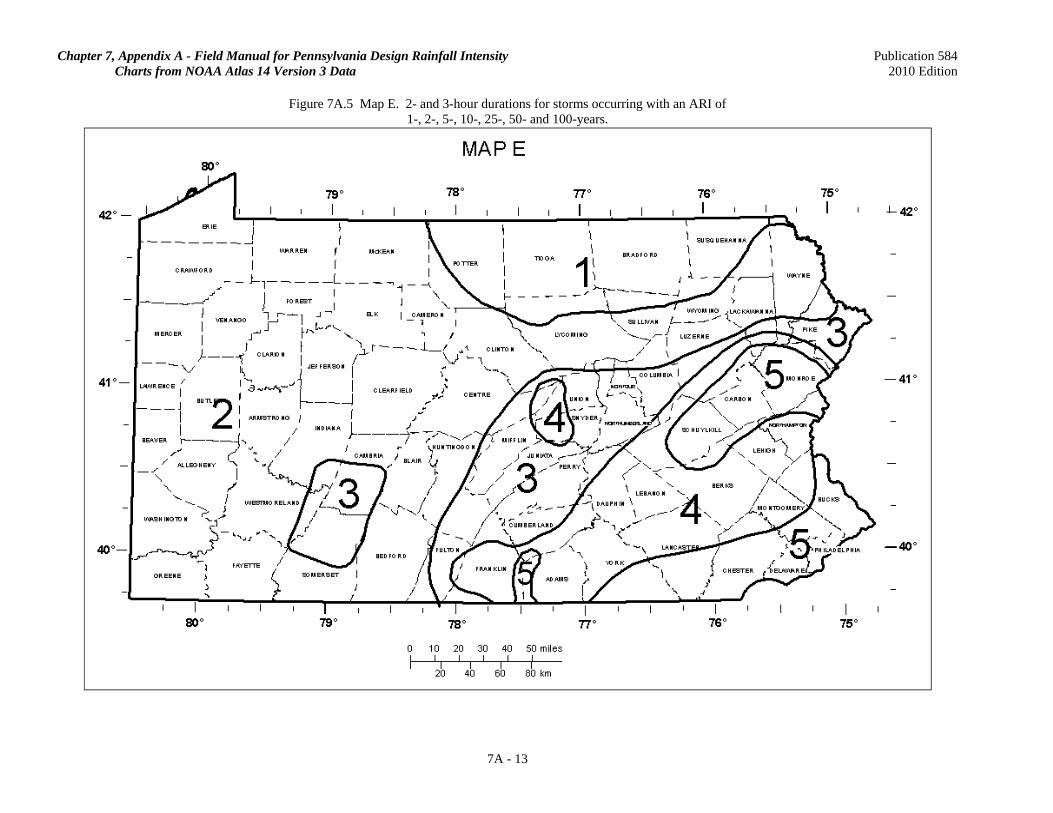
Figure 7A.5 Map E. 2- and 3-hour durations for storms occurring with an ARI of 1-, 2-, 5-, 10-, 25-, 50- and 100-years.
7A - 13
Chapter 7, Appendix A - Field Manual for Pennsylvania Design Rainfall Intensity Publication 584 Charts from NOAA Atlas 14 Version 3 Data 2010 Edition
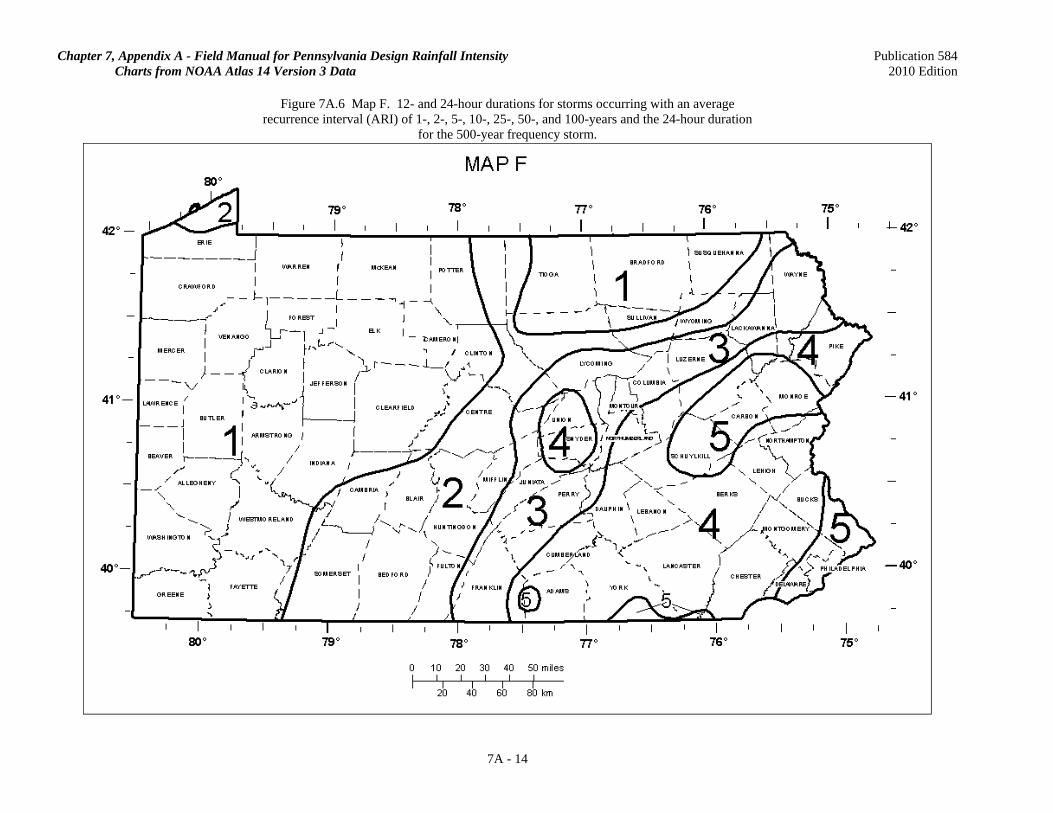
Figure 7A.6 Map F. 12- and 24-hour durations for storms occurring with an average recurrence interval (ARI) of 1-, 2-, 5-, 10-, 25-, 50-, and 100-years and the 24-hour duration
for the 500-year frequency storm.
7A - 14

Chapter 7, Appendix A - Field Manual for Pennsylvania Design Rainfall Intensity Publication 584 Charts from NOAA Atlas 14 Version 3 Data 2010 Edition
Figure 7A.7(a) Rainfall Intensity for 1- through 100-year Storms for Region 1 (Metric).
Figure 7A.7(b) Rainfall Amount for 1- through 100-year Storms for Region 1 (Metric).
7A - 15

Chapter 7, Appendix A - Field Manual for Pennsylvania Design Rainfall Intensity Publication 584 Charts from NOAA Atlas 14 Version 3 Data 2010 Edition
Figure 7A.8(a) Rainfall Intensity for 1- through 100-year Storms for Region 1 (U.S. Customary).
Figure 7A.8(b) Rainfall Amount for 1- through 100-year Storms for Region 1 (U.S. Customary).
7A - 16
Chapter 7, Appendix A - Field Manual for Pennsylvania Design Rainfall Intensity Publication 584 Charts from NOAA Atlas 14 Version 3 Data 2010 Edition
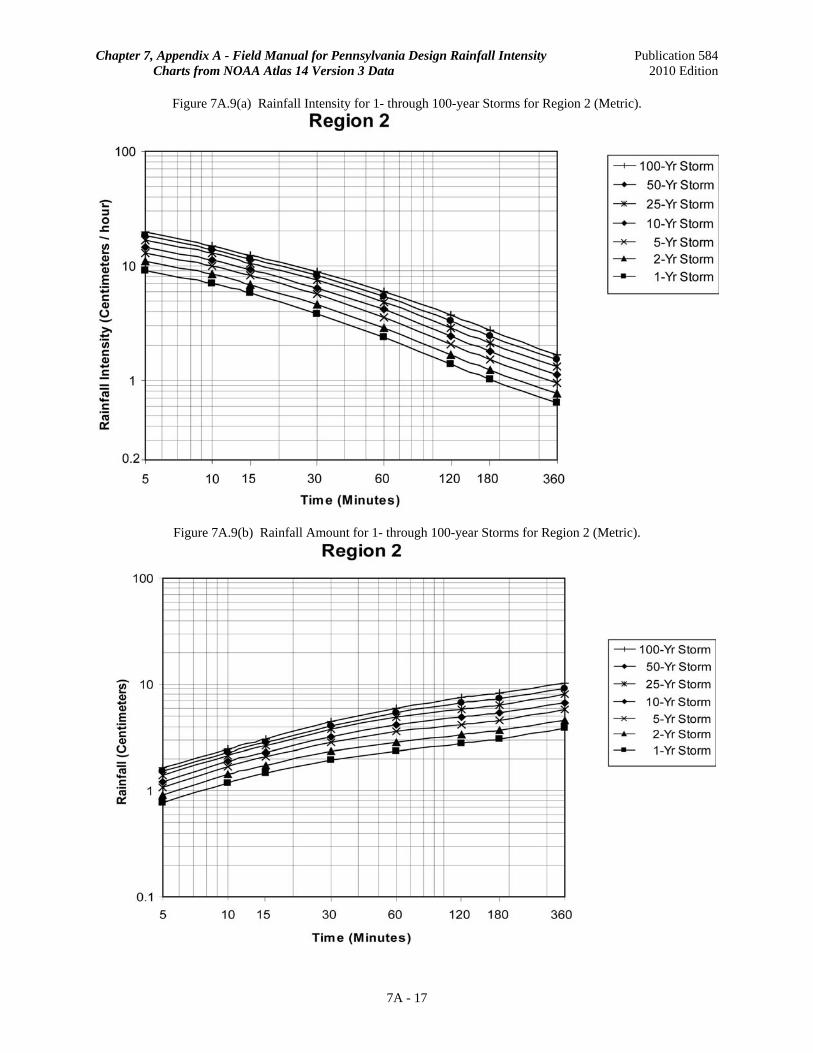
Figure 7A.9(a) Rainfall Intensity for 1- through 100-year Storms for Region 2 (Metric).
Figure 7A.9(b) Rainfall Amount for 1- through 100-year Storms for Region 2 (Metric).
7A - 17
Chapter 7, Appendix A - Field Manual for Pennsylvania Design Rainfall Intensity Publication 584 Charts from NOAA Atlas 14 Version 3 Data 2010 Edition
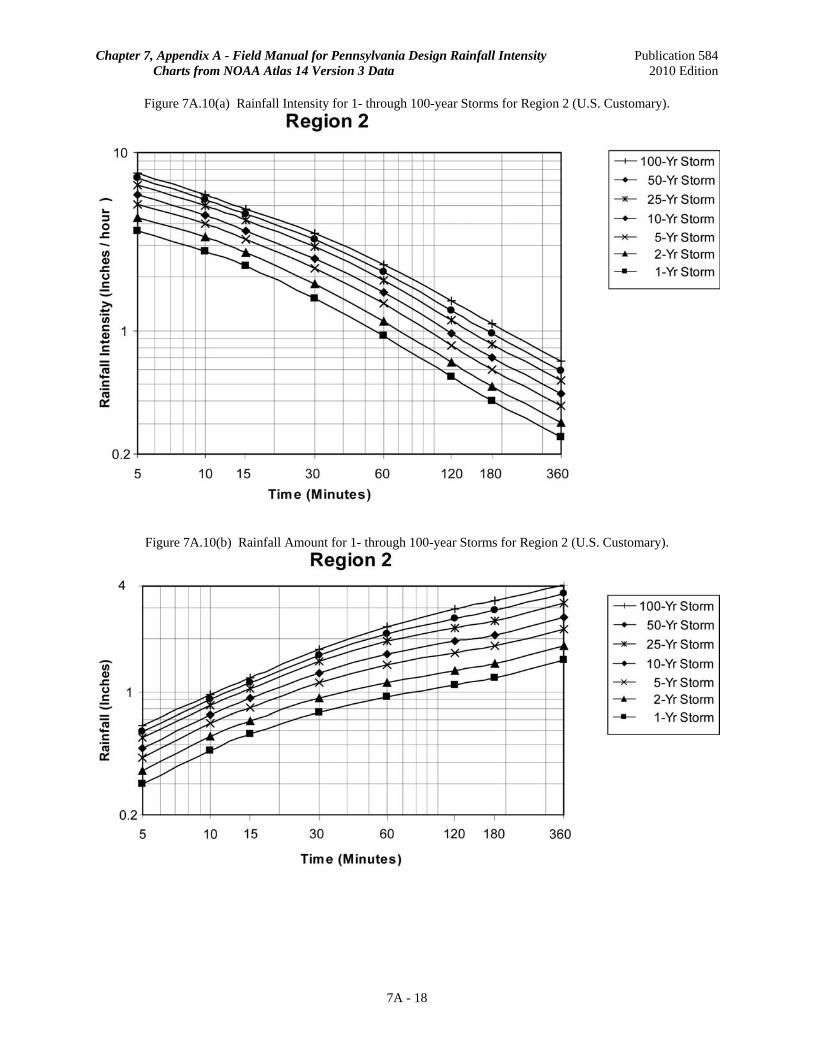
Figure 7A.10(a) Rainfall Intensity for 1- through 100-year Storms for Region 2 (U.S. Customary).
Figure 7A.10(b) Rainfall Amount for 1- through 100-year Storms for Region 2 (U.S. Customary).
7A - 18
Chapter 7, Appendix A - Field Manual for Pennsylvania Design Rainfall Intensity Publication 584 Charts from NOAA Atlas 14 Version 3 Data 2010 Edition
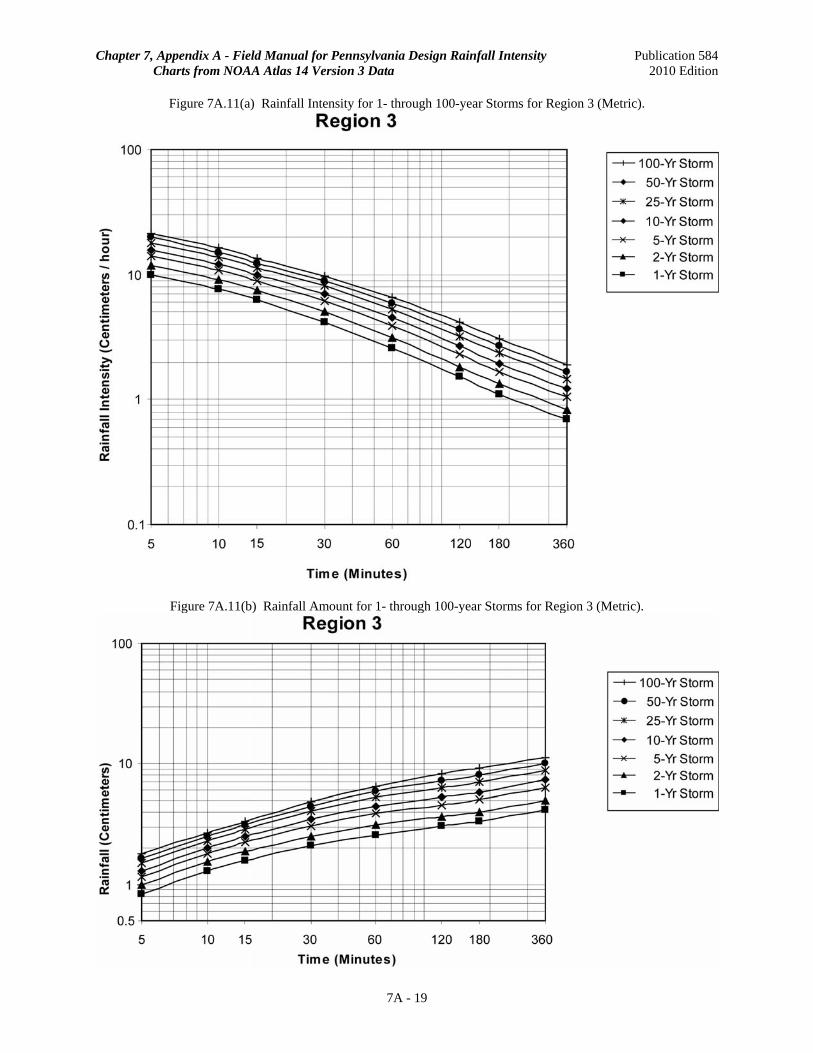
Figure 7A.11(a) Rainfall Intensity for 1- through 100-year Storms for Region 3 (Metric).
Figure 7A.11(b) Rainfall Amount for 1- through 100-year Storms for Region 3 (Metric).
7A - 19
Chapter 7, Appendix A - Field Manual for Pennsylvania Design Rainfall Intensity Publication 584 Charts from NOAA Atlas 14 Version 3 Data 2010 Edition
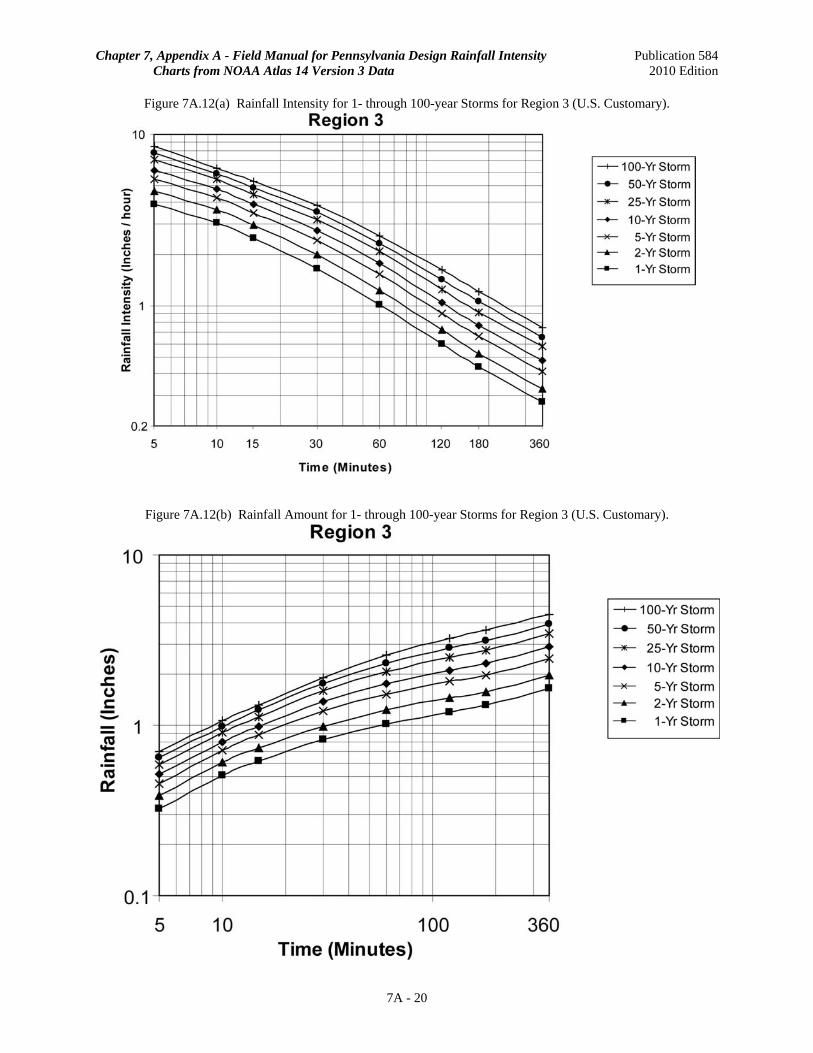
Figure 7A.12(a) Rainfall Intensity for 1- through 100-year Storms for Region 3 (U.S. Customary).
7A - 20
Figure 7A.12(b) Rainfall Amount for 1- through 100-year Storms for Region 3 (U.S. Customary).

Chapter 7, Appendix A - Field Manual for Pennsylvania Design Rainfall Intensity Publication 584 Charts from NOAA Atlas 14 Version 3 Data 2010 Edition
Figure 7A.13(a) Rainfall Intensity for 1- through 100-year Storms for Region 4 (Metric).
Figure 7A.13(b) Rainfall Amount for 1- through 100-year Storms for Region 4 (Metric).
7A - 21
Chapter 7, Appendix A - Field Manual for Pennsylvania Design Rainfall Intensity Publication 584 Charts from NOAA Atlas 14 Version 3 Data 2010 Edition
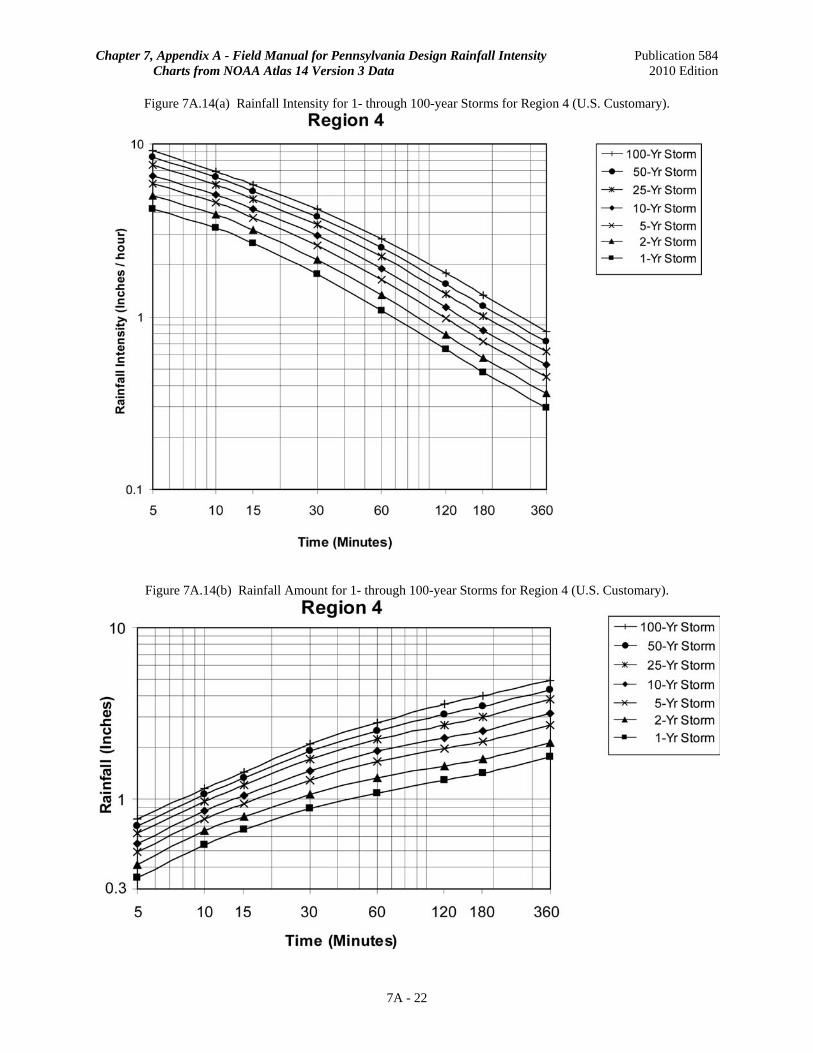
Figure 7A.14(a) Rainfall Intensity for 1- through 100-year Storms for Region 4 (U.S. Customary).
7A - 22
Figure 7A.14(b) Rainfall Amount for 1- through 100-year Storms for Region 4 (U.S. Customary).

Chapter 7, Appendix A - Field Manual for Pennsylvania Design Rainfall Intensity Publication 584 Charts from NOAA Atlas 14 Version 3 Data 2010 Edition
Figure 7A.15(a) Rainfall Intensity for 1- through 100-year Storms for Region 5 (Metric).
Figure 7A.15(b) Rainfall Amount for 1- through 100-year Storms for Region 5 (Metric).
7A - 23
Chapter 7, Appendix A - Field Manual for Pennsylvania Design Rainfall Intensity Publication 584 Charts from NOAA Atlas 14 Version 3 Data 2010 Edition
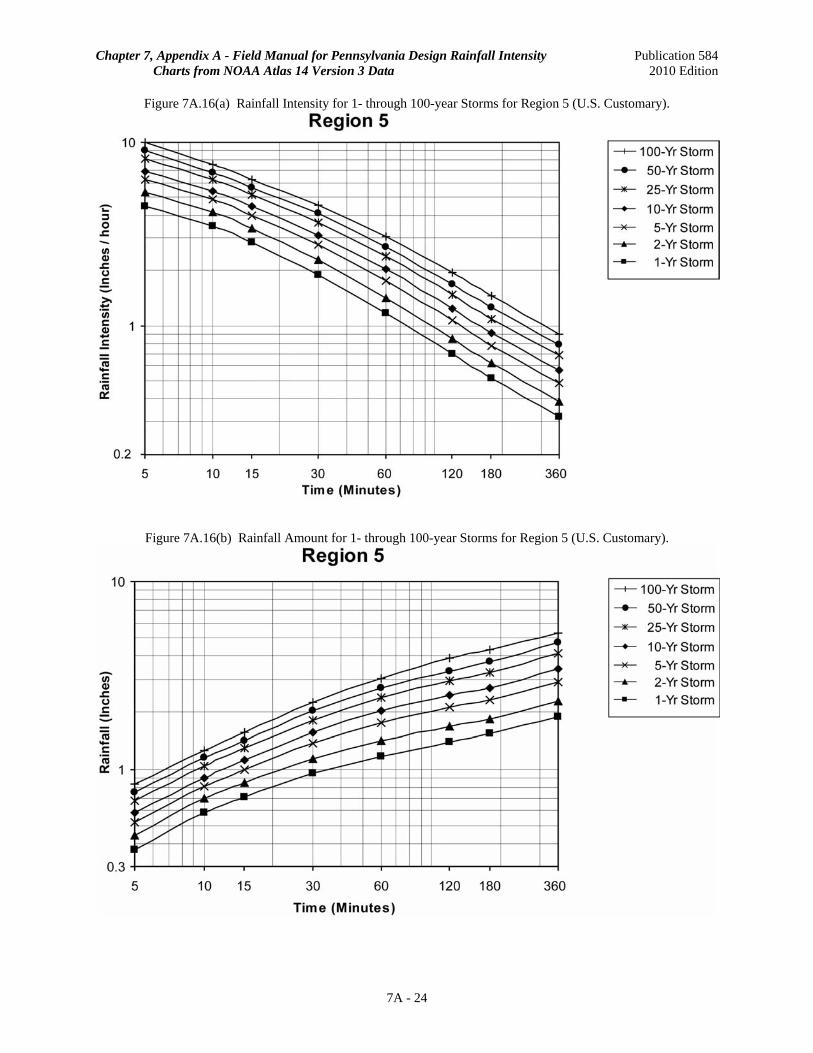
Figure 7A.16(a) Rainfall Intensity for 1- through 100-year Storms for Region 5 (U.S. Customary).
Figure 7A.16(b) Rainfall Amount for 1- through 100-year Storms for Region 5 (U.S. Customary).
7A - 24
Chapter 7, Appendix A - Field Manual for Pennsylvania Design Rainfall Intensity Publication 584 Charts from NOAA Atlas 14 Version 3 Data 2010 Edition
7A - 25
7A.2 SAMPLE PROBLEMS UTILIZING THE PDT-IDF CURVES AND DATA A. Sample 1. Rational Method – Rainfall Intensity – Computing Peak Flow (Q) for Storm Sewer and Inlet Sizing. For culvert and pipe sizing where drainage areas are less than 80 hectares (200 acres) and full hydrographs are not required, often the rational method is the most suitable method to compute peak rates of runoff for design. The following example provides the process of obtaining the rainfall intensity for the determination of the rational peak flow value (Q) for the 10-year design storm. Rational Method: 10-year Storm, the center of Armstrong County Determine the Q to an inlet along a road. Drainage Area (A): = 91.4 meters (300 feet) x 15.2 meters (50 feet) pavement width
= 1,389.3 square meters (15,000 sf) = 0.14 hectares (0.34 ac)
Tc = 5 min C = 0.95 from Table 7.6, page 7-27, Chapter 7, Hydraulics Rainfall: Step 1 Determine the appropriate rainfall region map using Table 7A.1. For the 10-year 5 minute storm, Map C
would be the appropriate map to determine rainfall region. Step 2 From Figure 7A.3, Map C, the center of Armstrong County would fall within Region 3 Step 3 From Figures 7A.11(a) or 7A.12(a), the 10-year, 5-minute rainfall intensity (I) would be 15.75 cm/hr (6.2
in/hr). Step 4 Convert cm/hr to mm/hr by multiplying the metric value from Figure 7.A.11(a) by 10 mm/cm to yield
157mm/hr, for use in the rational equation. NOTE: EQUATION 7.9 IN METRIC UNITS USES mm/hr AS THE RAINFALL UNIT, NOT
cm/hr. CHARTS IN APPENDIX 7A ARE IN UNITS OF cm/hr.
Step 5 From Equation 7.9, Compute the flow (Q)
C = 0.95 (Table 7.6) Cf = 1 (Table 7.7) I = 157.5 mm/hr (6.2 in/hr) A = 0.14 hectares (0.34 Ac)
METRIC
Q = CCfIA/360 = (.95)(1)(157.5)(.14)/360 = 0.058 m3/s (cfs)
US CUSTOMARY
Q = CCfIA (U.S. Customary) = (.95)(1)(6.2)(.34) = 2.0 cfs

Chapter 7, Appendix A - Field Manual for Pennsylvania Design Rainfall Intensity Publication 584 Charts from NOAA Atlas 14 Version 3 Data 2010 Edition
7A - 26
B. Sample 2. Rational Samples - Rainfall Intensity – Computing Peak Flow (Q) for Storm Culvert Sizing. Using the rational method, determine the Q25 to size three roadside culverts from three separate contributing drainage areas in central Pike County. Given:
Subarea D.A. (ha) D.A. (ac) C
(Table 7.6) Cf
(Table 7.7) Tc (min) 1 0.49 1.2 .95 1.1 5.1 2 4.33 10.7 .87 1.1 22.5 3 2.31 5.7 .79 1.1 12.6
Step 1 From Table 7A.1, determine the map needed in order to obtain the required rainfall region.
Subarea D.A. (ha) D.A. (ac) C Cf Tc (min) Map 1 0.49 1.2 .95 1.1 5.1 B 2 4.33 10.7 .87 1.1 22.5 A 3 2.31 5.7 .79 1.1 12.6 C
Step 2 From each map (Figures 7A.2,1 and 3 respectively), determine what region should be utilized.
Subarea D.A. (ha) D.A. (ac) C Cf Tc (min) Map Region 1 0.49 1.2 .95 1.1 5.1 B 3 2 4.33 10.7 .87 1.1 22.5 A 3 3 2.31 5.7 .79 1.1 12.6 C 4
Step 3 From the appropriate PDT-IDF curve, determine the rainfall intensity to be used for each subarea. NOTE: EQUATION 7.9 IN METRIC UNITS USES mm/hr AS THE RAINFALL UNIT, NOT cm/hr.
CHARTS IN APPENDIX 7A ARE IN UNITS OF cm/hr. THE RAINFALL INTENSITIES DERIVED FROM APPENDIX 7A WILL NEED TO BE CONVERTED FROM cm/hr TO mm/hr.
METRIC
Subarea D.A. (ha) C Cf
Tc (min) Map Region Figure
Rainfall Intensity
From Figure (cm/hr)
Rainfall Intensity
Conversion (mm/hr)
1 0.49 .95 1.1 5.1 B 3 7A.11(a) 17.78 177.80 2 4.33 .87 1.1 22.5 A 3 7A.11(a) 9.65 96.50 3 2.31 .79 1.1 12.6 C 4 7A.13(a) 13.71 137.10
US CUSTOMARY
Subarea D.A. (ac) C Cf
Tc (min) Map Region Figure
Rainfall Intensity (in/hr)
1 1.2 .95 1.1 5.1 B 3 7A.12(a) 7.0 2 10.7 .87 1.1 22.5 A 3 7A.12(a) 3.8 3 5.7 .79 1.1 12.6 C 4 7A.14(a) 5.4
Chapter 7, Appendix A - Field Manual for Pennsylvania Design Rainfall Intensity Publication 584 Charts from NOAA Atlas 14 Version 3 Data 2010 Edition
7A - 27
Step 4 From Equation 7.9, Compute the flow (Q). METRIC
Subarea Q = CCfIA/360 Q (m3/s) 1 = (.95)(1.1)(177.80)(0.49)/360 0.25 2 = (.87)(1.1)(96.52)(4.33)/360 1.11 3 = (.79)(1.1)(137.16)(2.31)/360 0.76
US CUSTOMARY
Subarea Q = CCfIA Q (cfs) 1 = (.95)(1.1)(7.0)(1.2) 8.8 2 = (.87)(1.1)(3.8)(10.7) 38.9 3 = (.79)(1.1)(5.4)(5.7) 26.7
C. Sample 3. 24-hour Storm Total and Composite Design Storms for PDT-IDF 'S' Curve and Hyetograph. In storm runoff modeling, design storms are often needed for a 24-hour storm represented by a typical 'S' curve. A composite 24-hour design storm, constructed as described below, will serve this purpose. The composite design storm should be generated such that the maximum rain falling over any time span (centered around the storm peak), equals the design storm depth indicated for the corresponding durations. As an example, a 50-year design storm for the same site will be constructed for a location in southeast Bucks County. The storm is to be defined in 15-minute intervals, for a total duration of 24 hours (1440 minutes). It is advisable to place the storm peak at or right after the center of the storm and that the storm shape be approximately symmetrical. The process is best set up in an Excel spreadsheet. Since we are obtaining the 50-year Average Recurrence Interval (ARI) storm, the following maps will be utilized for each storm duration rainfall amount. Step 1 From Table 7A.1, Determine which map applies to each duration for the 50-year storm as shown in Table
7A.8(a). Step 2 Find the region the site is located within for each map determined in Step 1.
For the 5-minute duration, Figure 7A.2 (Map B) yields Region 3 For the 10-, 15-, 30-, and 60-minute duration, Figure 7A.3 (Map C) yields Region 5 For the 2 and 3-hour duration, Figure 7A.4 (Map E) yields Region 5 For the 6-hour duration, Figure 7A.5 (Map D) yields Region 5 For the 12 and 24-hour duration, Figure 7A.6 (Map F) yields Region 5 To better smooth the curve, it may be necessary to obtain values for storm durations not specified in Table 7A.1, for example the 90, 500, 800, 1000, 1200, 1300, 1350, and 1400 minute durations shown in Table 7A.8 (a) and (b). If a storm duration does not appear in Table 7A.1, the map that should be utilized should be the one for the closest storm duration in Table 7A.1. For instance, a storm duration of 500 minutes is closer to the 6 hour (360 minutes) duration than the 12 hour (720 minutes) duration. Therefore, map D should be utilized for the 50-year storm. For storm durations that fall directly between two storm durations specified in Table 7A.1, the appropriate maps on either side of the selected time can be inspected to obtain the appropriate rainfall region. If the two maps place the site in two different regions the precipitation estimates for both regions should be obtained and the larger of the two precipitation values selected to complete the calculations. For instance, 90 minutes falls midway between the 60 and 120 minute durations. Therefore both maps C and E should be inspected. It should be noted that the values for these intermediate storms not shown in Table 7A.1 may be adjusted slightly to provide for a smoother fitting curve. The values in table 7A.1 may not be modified.

Chapter 7, Appendix A - Field Manual for Pennsylvania Design Rainfall Intensity Publication 584 Charts from NOAA Atlas 14 Version 3 Data 2010 Edition
7A - 28
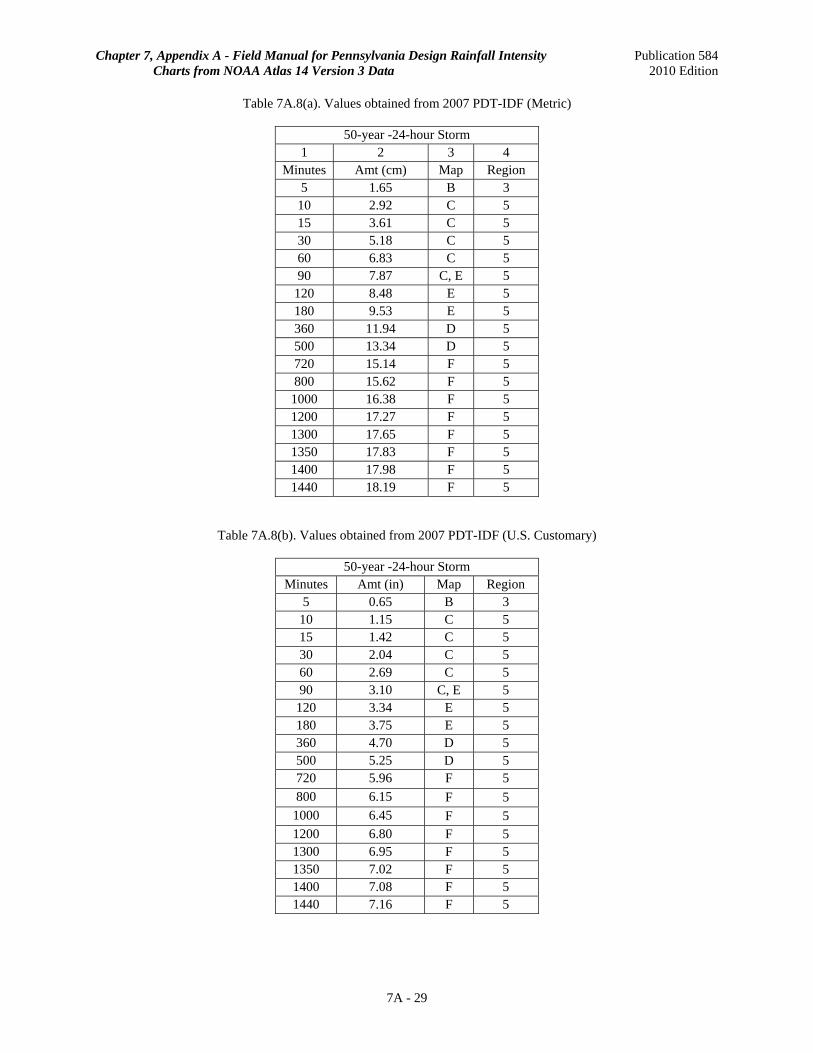
Step 3 From Tables 7A.4(a) and 7A.4(b) or Figures 7A.11(b) and 7A12(b) (Region 3), obtain 50-year rainfall
amount for the 5-minute duration. (1.65 cm (0.65 in)) From Tables 7A.6(a) and 7A.6(b) or Figures 7A.15(b) and 7A16.(b) (Region 5), obtain 50-year rainfall amounts for the 10-, 15-, 30-, 60-, 120-, 180-, 360-, 720-, and 1440-minute durations (from the appropriate map and region), and list them as in column (2) in Tables 7A.8(a/b) below. The Maps and Regions (columns 3 and 4) may be listed for reference. Therefore, per Table 7A.8 (a/b), the 50-year, 24-hour rainfall total amount would be 18.19 cm (7.16 inches), which may be utilized for the storm total in TR-55, HEC-HMS or other computations.
Chapter 7, Appendix A - Field Manual for Pennsylvania Design Rainfall Intensity Publication 584 Charts from NOAA Atlas 14 Version 3 Data 2010 Edition
7A - 29
Table 7A.8(a). Values obtained from 2007 PDT-IDF (Metric)
50-year -24-hour Storm 1 2 3 4
Minutes Amt (cm) Map Region 5 1.65 B 3
10 2.92 C 5 15 3.61 C 5 30 5.18 C 5 60 6.83 C 5 90 7.87 C, E 5
120 8.48 E 5 180 9.53 E 5 360 11.94 D 5 500 13.34 D 5 720 15.14 F 5 800 15.62 F 5 1000 16.38 F 5 1200 17.27 F 5 1300 17.65 F 5 1350 17.83 F 5 1400 17.98 F 5 1440 18.19 F 5
Table 7A.8(b). Values obtained from 2007 PDT-IDF (U.S. Customary)
50-year -24-hour Storm Minutes Amt (in) Map Region
5 0.65 B 3 10 1.15 C 5 15 1.42 C 5 30 2.04 C 5 60 2.69 C 5 90 3.10 C, E 5 120 3.34 E 5 180 3.75 E 5 360 4.70 D 5 500 5.25 D 5 720 5.96 F 5 800 6.15 F 5
1000 6.45 F 5 1200 6.80 F 5 1300 6.95 F 5 1350 7.02 F 5 1400 7.08 F 5 1440 7.16 F 5
Chapter 7, Appendix A - Field Manual for Pennsylvania Design Rainfall Intensity Publication 584 Charts from NOAA Atlas 14 Version 3 Data 2010 Edition
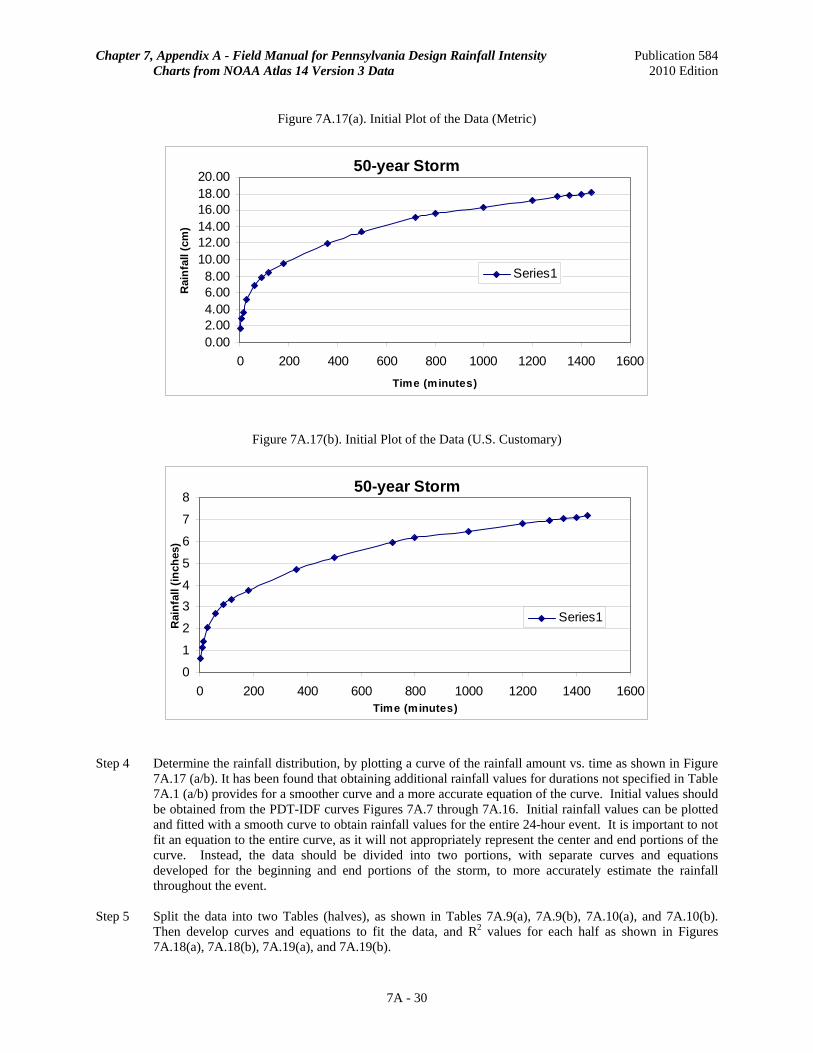
Figure 7A.17(a). Initial Plot of the Data (Metric)
50-year Storm
0.002.004.006.008.00
10.0012.0014.0016.0018.0020.00
0 200 400 600 800 1000 1200 1400 1600
Time (minutes)
Rai
nfal
l (cm
)
Series1
Figure 7A.17(b). Initial Plot of the Data (U.S. Customary)
50-year Storm
0
1
2
34
5
6
7
8
0 200 400 600 800 1000 1200 1400 1600Time (minutes)
Rai
nfal
l (in
ches
)
Series1
Step 4 Determine the rainfall distribution, by plotting a curve of the rainfall amount vs. time as shown in Figure 7A.17 (a/b). It has been found that obtaining additional rainfall values for durations not specified in Table 7A.1 (a/b) provides for a smoother curve and a more accurate equation of the curve. Initial values should be obtained from the PDT-IDF curves Figures 7A.7 through 7A.16. Initial rainfall values can be plotted and fitted with a smooth curve to obtain rainfall values for the entire 24-hour event. It is important to not fit an equation to the entire curve, as it will not appropriately represent the center and end portions of the curve. Instead, the data should be divided into two portions, with separate curves and equations developed for the beginning and end portions of the storm, to more accurately estimate the rainfall throughout the event.
Step 5 Split the data into two Tables (halves), as shown in Tables 7A.9(a), 7A.9(b), 7A.10(a), and 7A.10(b).
Then develop curves and equations to fit the data, and R2 values for each half as shown in Figures 7A.18(a), 7A.18(b), 7A.19(a), and 7A.19(b).
7A - 30

Chapter 7, Appendix A - Field Manual for Pennsylvania Design Rainfall Intensity Publication 584 Charts from NOAA Atlas 14 Version 3 Data 2010 Edition
Table 7A.9(a). Data from Time 0 to 500 Minutes (Metric)
Minutes Amt (cm) 5 1.65
10 2.92 15 3.61 30 5.18 60 6.83 90 7.87 120 8.48 180 9.53 360 11.94 500 13.34
Table 7A.9(b). Data from Time 0 to 500 Minutes (U.S. Customary)
Minutes Amount (in) 5 0.65
10 1.15 15 1.42 30 2.04 60 2.69 90 3.10 120 3.34 180 3.75 360 4.70 500 5.25
Figure 7A.18(a). Logarithmic Curve Developed from 0 to 500 Minutes (Metric)
y = 2.4861Ln(x) - 2.9826R2 = 0.9852
0
2
4
6
8
10
12
14
16
0 100 200 300 400 500 600
Time (minutes)
Rai
nfal
l (cm
)
Series1Log. (Series1)
7A - 31

Chapter 7, Appendix A - Field Manual for Pennsylvania Design Rainfall Intensity Publication 584 Charts from NOAA Atlas 14 Version 3 Data 2010 Edition
Figure 7A.18(b). Logarithmic Curve Developed from 0 to 500 Minutes (U.S. Customary)
y = 0.9788Ln(x) - 1.1742R2 = 0.9852
0.00
1.00
2.00
3.00
4.00
5.00
6.00
0 100 200 300 400 500 600
Time (minutes)
Rai
nfal
l (in
)
Series1Log. (Series1)
Table 7A.10(a). Data from Time 500 to 1440 Minutes (Metric)
Minutes Amt (cm) 500 13.34 720 15.14 800 15.62
1000 16.38 1200 17.27 1300 17.65 1350 17.83 1400 17.98 1440 18.19
Table 7A.10(b). Data from Time 500 to 1440 Minutes (U.S. Customary)
Minutes Amount (in) 500 5.25 720 5.96 800 6.15
1000 6.45 1200 6.8 1300 6.95 1350 7.02 1400 7.08 1440 7.16
7A - 32
Chapter 7, Appendix A - Field Manual for Pennsylvania Design Rainfall Intensity Publication 584 Charts from NOAA Atlas 14 Version 3 Data 2010 Edition
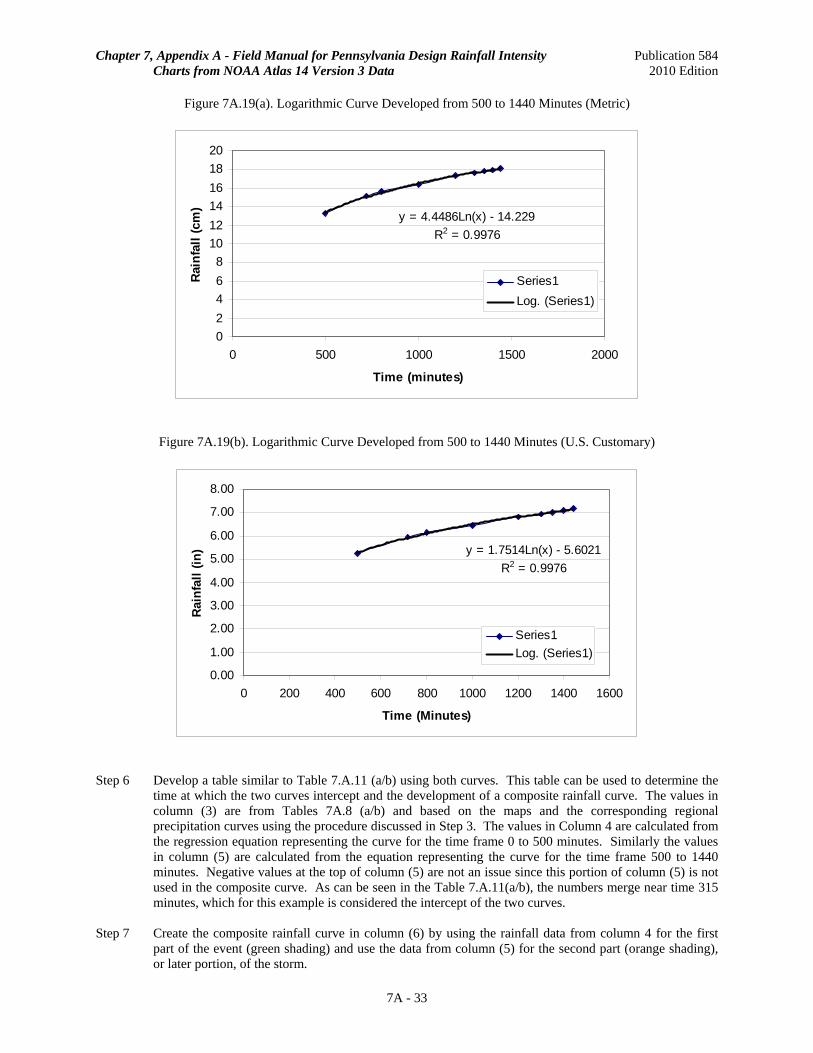
Figure 7A.19(a). Logarithmic Curve Developed from 500 to 1440 Minutes (Metric)
y = 4.4486Ln(x) - 14.229R2 = 0.9976
02468
101214161820
0 500 1000 1500 2000
Time (minutes)
Rain
fall
(cm
)
Series1Log. (Series1)
Figure 7A.19(b). Logarithmic Curve Developed from 500 to 1440 Minutes (U.S. Customary)
y = 1.7514Ln(x) - 5.6021R2 = 0.9976
0.00
1.00
2.00
3.00
4.00
5.00
6.00
7.00
8.00
0 200 400 600 800 1000 1200 1400 1600
Time (Minutes)
Rai
nfal
l (in
)
Series1Log. (Series1)
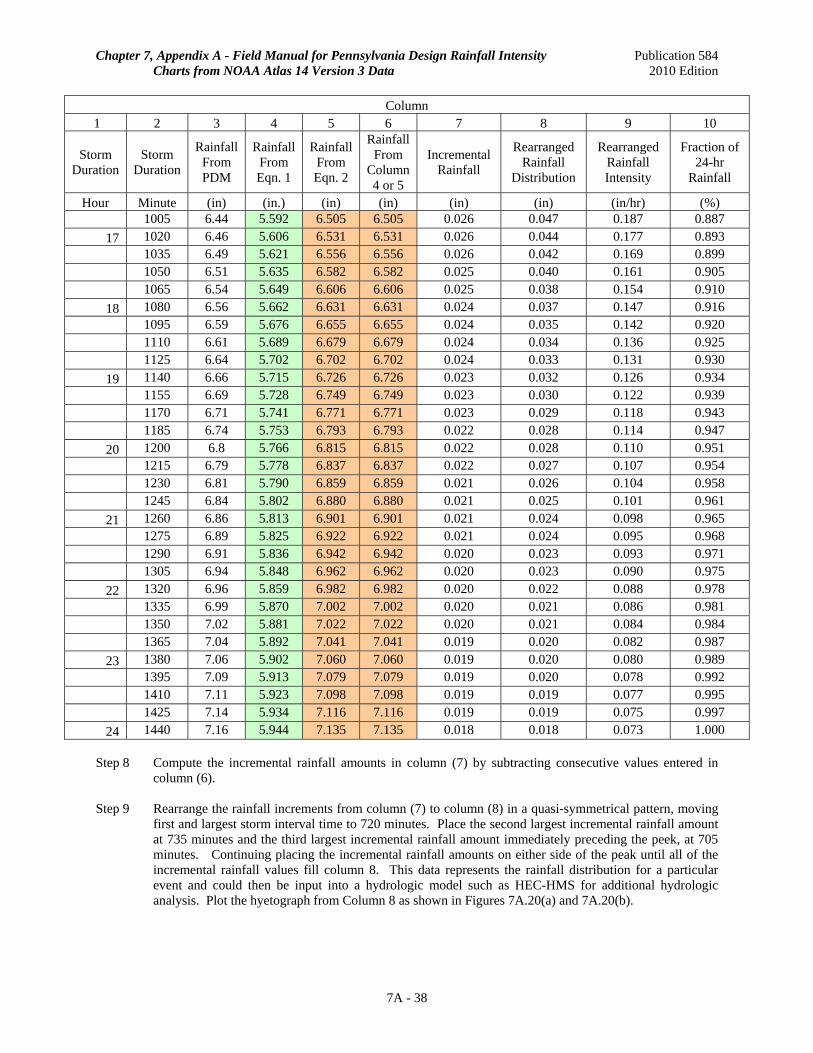
Step 6 Develop a table similar to Table 7.A.11 (a/b) using both curves. This table can be used to determine the
time at which the two curves intercept and the development of a composite rainfall curve. The values in column (3) are from Tables 7A.8 (a/b) and based on the maps and the corresponding regional precipitation curves using the procedure discussed in Step 3. The values in Column 4 are calculated from the regression equation representing the curve for the time frame 0 to 500 minutes. Similarly the values in column (5) are calculated from the equation representing the curve for the time frame 500 to 1440 minutes. Negative values at the top of column (5) are not an issue since this portion of column (5) is not used in the composite curve. As can be seen in the Table 7.A.11(a/b), the numbers merge near time 315 minutes, which for this example is considered the intercept of the two curves.
Step 7 Create the composite rainfall curve in column (6) by using the rainfall data from column 4 for the first
part of the event (green shading) and use the data from column (5) for the second part (orange shading), or later portion, of the storm.
7A - 33

Chapter 7, Appendix A - Field Manual for Pennsylvania Design Rainfall Intensity Publication 584 Charts from NOAA Atlas 14 Version 3 Data 2010 Edition
7A - 34
Table 7A.11(a). Composite Storm Development (Metric)
Column 1 2 3 4 5 6 7 8 9 10
Storm Duration
Storm Duration
Rainfall From PDM
Rainfall From Eqn. 1
Rainfall From Eqn. 2
Rainfall From
Column 4 or 5
Incremental Rainfall
Rearranged Rainfall
Distribution
Rearranged Rainfall Intensity
Fraction of 24-hr
Rainfall
Hour Minute (cm) (cm) (cm) (cm) (cm) (cm) (cm/hr) (%) 0 0 0.00 0.000 0.000 0.000 0.000 0.000 0.000 0.000 15 3.61 3.840 -2.182 3.840 3.840 0.047 0.188 0.003 30 5.18 5.563 0.902 5.563 1.723 0.048 0.192 0.005 45 6.01 6.571 2.705 6.571 1.008 0.049 0.197 0.008 1 60 6.83 7.286 3.985 7.286 0.715 0.050 0.201 0.011 75 7.42 7.841 4.978 7.841 0.555 0.051 0.206 0.014 90 7.87 8.294 5.789 8.294 0.453 0.053 0.211 0.016 105 8.23 8.678 6.475 8.678 0.383 0.054 0.216 0.019 2 120 8.48 9.010 7.069 9.010 0.332 0.055 0.221 0.023 135 8.84 9.302 7.593 9.302 0.293 0.057 0.227 0.026 150 9.09 9.564 8.061 9.564 0.262 0.058 0.233 0.029 165 9.32 9.801 8.485 9.801 0.237 0.060 0.239 0.032 3 180 9.53 10.018 8.872 10.018 0.216 0.061 0.245 0.036 195 9.80 10.217 9.228 10.217 0.199 0.063 0.252 0.039 210 10.06 10.401 9.558 10.401 0.184 0.065 0.260 0.043 225 10.31 10.572 9.865 10.572 0.172 0.067 0.268 0.046 4 240 10.49 10.733 10.152 10.733 0.160 0.069 0.276 0.050 255 10.64 10.884 10.422 10.884 0.151 0.071 0.285 0.054 270 10.82 11.026 10.676 11.026 0.142 0.074 0.294 0.058 285 10.97 11.160 10.917 11.160 0.134 0.076 0.304 0.062 5 300 11.18 11.288 11.145 11.288 0.128 0.079 0.315 0.067 315 11.40 11.409 11.362 11.409 0.121 0.082 0.327 0.071 330 11.54 11.525 11.569 11.569 0.160 0.085 0.339 0.076 345 11.74 11.635 11.767 11.767 0.198 0.088 0.352 0.081 6 360 11.94 11.741 11.956 11.956 0.189 0.092 0.367 0.086 375 12.12 11.842 12.138 12.138 0.182 0.096 0.383 0.091 390 12.14 11.940 12.312 12.312 0.174 0.100 0.400 0.097 405 12.29 12.034 12.480 12.480 0.168 0.105 0.419 0.102 7 420 12.37 12.124 12.642 12.642 0.162 0.110 0.439 0.108 435 12.47 12.211 12.798 12.798 0.156 0.116 0.462 0.115 450 12.60 12.296 12.949 12.949 0.151 0.121 0.485 0.121 465 12.67 12.377 13.094 13.094 0.146 0.125 0.501 0.128 8 480 12.80 12.456 13.236 13.236 0.141 0.129 0.516 0.135 495 12.88 12.533 13.373 13.373 0.137 0.134 0.538 0.143 510 13.00 12.607 13.505 13.505 0.133 0.141 0.565 0.151 525 13.40 12.679 13.634 13.634 0.129 0.146 0.583 0.159 9 540 13.54 12.749 13.760 13.760 0.125 0.151 0.603 0.167 555 13.67 12.817 13.882 13.882 0.122 0.160 0.640 0.176 570 13.80 12.883 14.000 14.000 0.119 0.162 0.647 0.185 585 13.94 12.948 14.116 14.116 0.116 0.172 0.686 0.194
10 600 14.07 13.011 14.228 14.228 0.113 0.182 0.726 0.204 615 14.20 13.072 14.338 14.338 0.110 0.189 0.757 0.215

Chapter 7, Appendix A - Field Manual for Pennsylvania Design Rainfall Intensity Publication 584 Charts from NOAA Atlas 14 Version 3 Data 2010 Edition
7A - 35
Column 1 2 3 4 5 6 7 8 9 10
Storm Duration
Storm Duration
Rainfall From PDM
Rainfall From Eqn. 1
Rainfall From Eqn. 2
Rainfall From
Column 4 or 5
Incremental Rainfall
Rearranged Rainfall
Distribution
Rearranged Rainfall Intensity
Fraction of 24-hr
Rainfall
Hour Minute (cm) (cm) (cm) (cm) (cm) (cm) (cm/hr) (%) 630 14.34 13.132 14.445 14.445 0.107 0.199 0.796 0.226
645 14.47 13.191 14.550 14.550 0.105 0.237 0.948 0.239 11 660 14.61 13.248 14.652 14.652 0.102 0.293 1.171 0.255
675 14.74 13.304 14.752 14.752 0.100 0.383 1.533 0.276 690 14.87 13.358 14.850 14.850 0.098 0.555 2.219 0.307 705 15.01 13.412 14.946 14.946 0.096 1.008 4.032 0.362
12 720 15.14 13.464 15.039 15.039 0.094 3.840 15.360 0.574 735 15.20 13.515 15.131 15.131 0.092 1.723 6.893 0.669 750 15.27 13.566 15.221 15.221 0.090 0.715 2.861 0.709 765 15.33 13.615 15.309 15.309 0.088 0.453 1.813 0.734
13 780 15.39 13.663 15.396 15.396 0.086 0.332 1.328 0.752 795 15.46 13.710 15.480 15.480 0.085 0.262 1.048 0.767 810 15.52 13.757 15.563 15.563 0.083 0.216 0.865 0.778 825 15.58 13.803 15.645 15.645 0.082 0.198 0.791 0.789
14 840 15.65 13.847 15.725 15.725 0.080 0.184 0.737 0.800 855 15.71 13.891 15.804 15.804 0.079 0.174 0.698 0.809 870 15.77 13.935 15.881 15.881 0.077 0.168 0.672 0.818 885 15.84 13.977 15.957 15.957 0.076 0.160 0.642 0.827
15 900 15.90 14.019 16.032 16.032 0.075 0.156 0.624 0.836 915 15.96 14.060 16.106 16.106 0.074 0.151 0.603 0.844 930 16.03 14.100 16.178 16.178 0.072 0.142 0.568 0.852 945 16.09 14.140 16.249 16.249 0.071 0.137 0.548 0.860
16 960 16.15 14.179 16.319 16.319 0.070 0.133 0.531 0.867 975 16.22 14.218 16.388 16.388 0.069 0.128 0.510 0.874 990 16.28 14.256 16.456 16.456 0.068 0.122 0.488 0.881 1005 16.34 14.293 16.523 16.523 0.067 0.119 0.475 0.887
17 1020 16.41 14.330 16.589 16.589 0.066 0.113 0.451 0.893 1035 16.47 14.366 16.654 16.654 0.065 0.107 0.429 0.899 1050 16.54 14.402 16.718 16.718 0.064 0.102 0.409 0.905 1065 16.60 14.437 16.781 16.781 0.063 0.098 0.391 0.910
18 1080 16.66 14.472 16.843 16.843 0.062 0.094 0.375 0.916 1095 16.73 14.506 16.905 16.905 0.061 0.090 0.359 0.921 1110 16.79 14.540 16.965 16.965 0.061 0.086 0.346 0.925 1125 16.85 14.574 17.025 17.025 0.060 0.083 0.333 0.930
19 1140 16.92 14.607 17.084 17.084 0.059 0.080 0.321 0.934 1155 16.98 14.639 17.142 17.142 0.058 0.077 0.309 0.939 1170 17.04 14.671 17.199 17.199 0.057 0.075 0.299 0.943 1185 17.11 14.703 17.256 17.256 0.057 0.072 0.289 0.947
20 1200 17.27 14.734 17.312 17.312 0.056 0.070 0.280 0.951 1215 17.23 14.765 17.367 17.367 0.055 0.068 0.272 0.954 1230 17.30 14.795 17.422 17.422 0.055 0.066 0.264 0.958 1245 17.36 14.826 17.476 17.476 0.054 0.064 0.256 0.961
21 1260 17.42 14.855 17.529 17.529 0.053 0.062 0.249 0.965 1275 17.49 14.885 17.582 17.582 0.053 0.061 0.242 0.968

Chapter 7, Appendix A - Field Manual for Pennsylvania Design Rainfall Intensity Publication 584 Charts from NOAA Atlas 14 Version 3 Data 2010 Edition
7A - 36
Column 1 2 3 4 5 6 7 8 9 10
Storm Duration
Storm Duration
Rainfall From PDM
Rainfall From Eqn. 1
Rainfall From Eqn. 2
Rainfall From
Column 4 or 5
Incremental Rainfall
Rearranged Rainfall
Distribution
Rearranged Rainfall Intensity
Fraction of 24-hr
Rainfall
Hour Minute (cm) (cm) (cm) (cm) (cm) (cm) (cm/hr) (%) 1290 17.55 14.914 17.634 17.634 0.052 0.059 0.236 0.971 1305 17.61 14.943 17.685 17.685 0.051 0.057 0.230 0.975
22 1320 17.68 14.971 17.736 17.736 0.051 0.056 0.224 0.978 1335 17.74 14.999 17.786 17.786 0.050 0.055 0.218 0.981 1350 17.83 15.027 17.836 17.836 0.050 0.053 0.213 0.984 1365 17.87 15.054 17.885 17.885 0.049 0.052 0.208 0.987
23 1380 17.93 15.082 17.934 17.934 0.049 0.051 0.203 0.989 1395 18.00 15.108 17.982 17.982 0.048 0.050 0.199 0.992 1410 18.06 15.135 18.029 18.029 0.048 0.049 0.194 0.995 1425 18.12 15.161 18.076 18.076 0.047 0.048 0.190 0.997
24 1440 18.19 15.187 18.123 18.123 0.047 0.047 0.186 1.000
Table 7A.11(b). Composite Storm Development (U.S. Customary)
Column 1 2 3 4 5 6 7 8 9 10
Storm Duration
Storm Duration
Rainfall From PDM
Rainfall From Eqn. 1
Rainfall From Eqn. 2
Rainfall From
Column 4 or 5
Incremental Rainfall
Rearranged Rainfall
Distribution
Rearranged Rainfall Intensity
Fraction of 24-hr
Rainfall
Hour Minute (in) (in.) (in) (in) (in) (in) (in/hr) (%) 0 0 0 0 0 0.000 0 0.000 0.000 0.000
15 1.42 1.476 -0.859 1.476 1.476 0.019 0.074 0.003 30 2.04 2.155 0.355 2.155 0.678 0.019 0.076 0.005 45 2.37 2.552 1.065 2.552 0.397 0.019 0.077 0.008
1 60 2.69 2.833 1.569 2.833 0.282 0.020 0.079 0.011 75 2.92 3.052 1.960 3.052 0.218 0.020 0.081 0.014 90 3.1 3.230 2.279 3.230 0.178 0.021 0.083 0.016 105 3.24 3.381 2.549 3.381 0.151 0.021 0.085 0.019
2 120 3.34 3.512 2.783 3.512 0.131 0.022 0.087 0.023 135 3.48 3.627 2.989 3.627 0.115 0.022 0.089 0.026 150 3.58 3.730 3.174 3.730 0.103 0.023 0.092 0.029 165 3.67 3.823 3.340 3.823 0.093 0.024 0.094 0.032
3 180 3.75 3.909 3.493 3.909 0.085 0.024 0.097 0.036 195 3.86 3.987 3.633 3.987 0.078 0.025 0.099 0.039 210 3.96 4.060 3.763 4.060 0.073 0.026 0.102 0.043 225 4.06 4.127 3.884 4.127 0.068 0.026 0.105 0.046
4 240 4.13 4.190 3.997 4.190 0.063 0.027 0.109 0.050 255 4.19 4.250 4.103 4.250 0.059 0.028 0.112 0.054 270 4.26 4.306 4.203 4.306 0.056 0.029 0.116 0.058 285 4.32 4.358 4.298 4.358 0.053 0.030 0.120 0.062
5 300 4.4 4.409 4.388 4.409 0.050 0.031 0.124 0.067 315 4.49 4.456 4.473 4.473 0.064 0.032 0.129 0.071 330 4.54 4.502 4.554 4.554 0.081 0.033 0.133 0.076

Chapter 7, Appendix A - Field Manual for Pennsylvania Design Rainfall Intensity Publication 584 Charts from NOAA Atlas 14 Version 3 Data 2010 Edition
7A - 37
Column 1 2 3 4 5 6 7 8 9 10
Storm Duration
Storm Duration
Rainfall From PDM
Rainfall From Eqn. 1
Rainfall From Eqn. 2
Rainfall From
Column 4 or 5
Incremental Rainfall
Rearranged Rainfall
Distribution
Rearranged Rainfall Intensity
Fraction of 24-hr
Rainfall
Hour Minute (in) (in.) (in) (in) (in) (in) (in/hr) (%) 345 4.62 4.545 4.632 4.632 0.078 0.035 0.139 0.081
6 360 4.7 4.587 4.707 4.707 0.075 0.036 0.144 0.086 375 4.77 4.627 4.778 4.778 0.071 0.038 0.151 0.091 390 4.78 4.665 4.847 4.847 0.069 0.039 0.157 0.097 405 4.84 4.702 4.913 4.913 0.066 0.041 0.165 0.102
7 420 4.87 4.738 4.977 4.977 0.064 0.043 0.173 0.108 435 4.91 4.772 5.038 5.038 0.061 0.045 0.182 0.115 450 4.96 4.806 5.098 5.098 0.059 0.048 0.191 0.121 465 4.99 4.838 5.155 5.155 0.057 0.049 0.197 0.128
8 480 5.04 4.869 5.211 5.211 0.056 0.051 0.203 0.135 495 5.07 4.899 5.265 5.265 0.054 0.053 0.212 0.143 510 5.12 4.928 5.317 5.317 0.052 0.056 0.222 0.151 525 5.28 4.956 5.368 5.368 0.051 0.057 0.230 0.159
9 540 5.33 4.984 5.417 5.417 0.049 0.059 0.238 0.167 555 5.38 5.011 5.465 5.465 0.048 0.063 0.253 0.176 570 5.44 5.037 5.512 5.512 0.047 0.066 0.264 0.185 585 5.49 5.062 5.557 5.557 0.045 0.069 0.275 0.195
10 600 5.54 5.087 5.601 5.601 0.044 0.073 0.290 0.205 615 5.59 5.111 5.645 5.645 0.043 0.078 0.311 0.216 630 5.65 5.135 5.687 5.687 0.042 0.085 0.341 0.228 645 5.7 5.158 5.728 5.728 0.041 0.098 0.392 0.242
11 660 5.75 5.180 5.768 5.768 0.040 0.115 0.461 0.258 675 5.8 5.202 5.808 5.808 0.039 0.151 0.604 0.279 690 5.86 5.224 5.846 5.846 0.038 0.218 0.874 0.309 705 5.91 5.245 5.884 5.884 0.038 0.397 1.587 0.365
12 720 5.96 5.266 5.921 5.921 0.037 1.476 5.906 0.572 735 5.99 5.286 5.957 5.957 0.036 0.678 2.714 0.667 750 6.01 5.306 5.992 5.992 0.035 0.282 1.126 0.707 765 6.04 5.325 6.027 6.027 0.035 0.178 0.714 0.732
13 780 6.06 5.344 6.061 6.061 0.034 0.131 0.523 0.750 795 6.09 5.363 6.094 6.094 0.033 0.103 0.413 0.764 810 6.11 5.381 6.127 6.127 0.033 0.093 0.373 0.777 825 6.14 5.399 6.159 6.159 0.032 0.078 0.313 0.788
14 840 6.16 5.416 6.191 6.191 0.032 0.075 0.298 0.799 855 6.19 5.434 6.222 6.222 0.031 0.071 0.286 0.809 870 6.21 5.451 6.252 6.252 0.030 0.068 0.270 0.818 885 6.24 5.468 6.282 6.282 0.030 0.064 0.255 0.827
15 900 6.26 5.484 6.312 6.312 0.029 0.061 0.246 0.836 915 6.29 5.500 6.341 6.341 0.029 0.059 0.237 0.844 930 6.31 5.516 6.369 6.369 0.028 0.056 0.224 0.852 945 6.34 5.532 6.397 6.397 0.028 0.054 0.216 0.860
16 960 6.36 5.547 6.425 6.425 0.028 0.052 0.209 0.867 975 6.39 5.562 6.452 6.452 0.027 0.050 0.201 0.874 990 6.41 5.577 6.479 6.479 0.027 0.048 0.192 0.881
Chapter 7, Appendix A - Field Manual for Pennsylvania Design Rainfall Intensity Publication 584 Charts from NOAA Atlas 14 Version 3 Data 2010 Edition
7A - 38
Column 1 2 3 4 5 6 7 8 9 10
Storm Duration
Storm Duration
Rainfall From PDM
Rainfall From Eqn. 1
Rainfall From Eqn. 2
Rainfall From
Column 4 or 5
Incremental Rainfall
Rearranged Rainfall
Distribution
Rearranged Rainfall Intensity
Fraction of 24-hr
Rainfall
Hour Minute (in) (in.) (in) (in) (in) (in) (in/hr) (%) 1005 6.44 5.592 6.505 6.505 0.026 0.047 0.187 0.887
17 1020 6.46 5.606 6.531 6.531 0.026 0.044 0.177 0.893 1035 6.49 5.621 6.556 6.556 0.026 0.042 0.169 0.899 1050 6.51 5.635 6.582 6.582 0.025 0.040 0.161 0.905 1065 6.54 5.649 6.606 6.606 0.025 0.038 0.154 0.910
18 1080 6.56 5.662 6.631 6.631 0.024 0.037 0.147 0.916 1095 6.59 5.676 6.655 6.655 0.024 0.035 0.142 0.920 1110 6.61 5.689 6.679 6.679 0.024 0.034 0.136 0.925 1125 6.64 5.702 6.702 6.702 0.024 0.033 0.131 0.930
19 1140 6.66 5.715 6.726 6.726 0.023 0.032 0.126 0.934 1155 6.69 5.728 6.749 6.749 0.023 0.030 0.122 0.939 1170 6.71 5.741 6.771 6.771 0.023 0.029 0.118 0.943 1185 6.74 5.753 6.793 6.793 0.022 0.028 0.114 0.947
20 1200 6.8 5.766 6.815 6.815 0.022 0.028 0.110 0.951 1215 6.79 5.778 6.837 6.837 0.022 0.027 0.107 0.954 1230 6.81 5.790 6.859 6.859 0.021 0.026 0.104 0.958 1245 6.84 5.802 6.880 6.880 0.021 0.025 0.101 0.961
21 1260 6.86 5.813 6.901 6.901 0.021 0.024 0.098 0.965 1275 6.89 5.825 6.922 6.922 0.021 0.024 0.095 0.968 1290 6.91 5.836 6.942 6.942 0.020 0.023 0.093 0.971 1305 6.94 5.848 6.962 6.962 0.020 0.023 0.090 0.975
22 1320 6.96 5.859 6.982 6.982 0.020 0.022 0.088 0.978 1335 6.99 5.870 7.002 7.002 0.020 0.021 0.086 0.981 1350 7.02 5.881 7.022 7.022 0.020 0.021 0.084 0.984 1365 7.04 5.892 7.041 7.041 0.019 0.020 0.082 0.987
23 1380 7.06 5.902 7.060 7.060 0.019 0.020 0.080 0.989 1395 7.09 5.913 7.079 7.079 0.019 0.020 0.078 0.992 1410 7.11 5.923 7.098 7.098 0.019 0.019 0.077 0.995 1425 7.14 5.934 7.116 7.116 0.019 0.019 0.075 0.997
24 1440 7.16 5.944 7.135 7.135 0.018 0.018 0.073 1.000 Step 8 Compute the incremental rainfall amounts in column (7) by subtracting consecutive values entered in
column (6). Step 9 Rearrange the rainfall increments from column (7) to column (8) in a quasi-symmetrical pattern, moving
first and largest storm interval time to 720 minutes. Place the second largest incremental rainfall amount at 735 minutes and the third largest incremental rainfall amount immediately preceding the peek, at 705 minutes. Continuing placing the incremental rainfall amounts on either side of the peak until all of the incremental rainfall values fill column 8. This data represents the rainfall distribution for a particular event and could then be input into a hydrologic model such as HEC-HMS for additional hydrologic analysis. Plot the hyetograph from Column 8 as shown in Figures 7A.20(a) and 7A.20(b).

Chapter 7, Appendix A - Field Manual for Pennsylvania Design Rainfall Intensity Publication 584 Charts from NOAA Atlas 14 Version 3 Data 2010 Edition
Figure 7A.20(a). Hyetograph for the 50-year Storm, Region 5 (Metric)
0.000.501.001.502.002.503.003.504.004.50
0 90 180
270
360
450
540
630
720
810
900
990
1080
1170
1260
1350
1440
Time (Minutes)
Rai
nfal
l (cm
)
Figure 7A.20(b). Hyetograph for the 50-year Storm, Region 5 (U.S. Customary)
0.00
0.20
0.40
0.60
0.80
1.00
1.20
1.40
1.60
0 90 180
270
360
450
540
630
720
810
900
990
1080
1170
1260
1350
1440
Time (Minutes)
Rain
fall
(in)
Step 10 (Optional) If incremental intensities are required, divide rearranged rainfall distribution in column (8) by
the time step (15 minutes) and multiply by 60 minutes as shown in Tables 7A.7(a/b) to obtain in incremental intensity in units of depth of rainfall/hour.
Step 11 (Optional) To plot the 'S' Curve of the rainfall pattern, the rearranged incremental rainfall values in
column (8) can be divided by the total 24-hour storm precipitation of 18.12 cm (7.16 in) to obtain the fraction of the 24-hour precipitation that has fallen for any given time increment. A running total of each time increment is placed in column (10) to obtain the total fraction of rainfall that has fallen with respect to time. The 'S' Curve is plotted using columns (2) and (10) as shown in Figure 7A.21. Since the 'S' curve is a plot of ratios of a unit of rainfall, the metric and U.S. customary units will plot identical.
7A - 39

Chapter 7, Appendix A - Field Manual for Pennsylvania Design Rainfall Intensity Publication 584 Charts from NOAA Atlas 14 Version 3 Data 2010 Edition
7A - 40
Figure 7A.21. S-Curve for the 50-year Storm, Region 5 (Metric and U.S. Customary)
24-Hour Rainfall Distribution
0.00
0.20
0.40
0.60
0.80
1.00
0 200 400 600 800 1000 1200 1400
Time (Minutes)
Frac
tion
of 2
4-H
our R
ainf
all
Note: It should be noted that the values obtained from the equations will vary slightly from the values obtained
from the PDT-IDF charts and graphs. The variation is typically not significant enough to have a significant impact on the hydrograph or peak flow results. However, if the engineer sees it justifiable, the columns could be multiplied by the ratio of the difference in values to match the exact number. Also, one may notice in the hyetograph and tables, that there is a slight shift in rainfall difference for each increment near the intercept. This will not significantly affect the peaks. If warranted, the user may readjust the values at each time increment to smooth the curve.
7A.3 REFERENCES Aron, G., D.J. Wall, E.L. White, C.N. Dunn, D.M. Kotz (1986). Field Manual of Pennsylvania Department of Transportation Storm Intensity-Duration-Frequency Charts (PDT-IDF). Department of Civil Engineering and Institute for Research on Land and Water Resources, The Pennsylvania State University. May 1986. Hershfield, D. M. (1961). Rainfall Frequency Atlas of the United States for Durations from 30 minutes to 24 hours and Return Periods from 1 to 100 years. Weather Bureau Technical Paper No. 40, U.S. Weather Bureau, Washington D.C.