chapter 7 · chapter 7 185 chapter 7 teacher preparation higher average reading achievement was...
TRANSCRIPT

PIRLS2011INTERNATIONALRESULTSINREADING CHAPTER7 185
Chapter7
Teacher PreparationHigher average reading achievement was associated with specialized education
in language or reading. Achievement also was related to teachers’ having more
experience and being satisfied with their careers.

PIRLS2011INTERNATIONALRESULTSINREADING186 CHAPTER7
In view of the importance of a well prepared teaching force to an effective education system, PIRLS 2011 collected a range of information about teacher education. In the PIRLS 2011 Encyclopedia, each country chapter describes the educational route to teacher certification, including any additional requirements such as passing an examination or completing an induction year. Each chapter also addresses the requirements and practices for ongoing teacher professional development. Chapter 7 provides information about teachers’ education, experience, professional development, and satisfaction with their teaching careers.
Reading Teachers’ Formal EducationThere is growing evidence that teacher preparation is a powerful predictor of students’ achievement, perhaps even overcoming socioeconomic and language background factors (Darling-Hammond, 2000).
Exhibit 7.1 presents teachers’ reports about their highest level of formal education. On average, internationally, across the fourth grade countries, 26 percent of the students had reading teachers with a postgraduate university degree, 53 percent had teachers with a bachelor’s degree, 15 percent had teachers who had completed post-secondary education (usually a 3-year teacher education program), and 6 percent had teachers with an upper secondary degree. However, it is clear from examining the country-by-country results across the fourth grade, sixth grade, benchmarking, and prePIRLS participants that different countries have different educational paths for becoming a primary level reading teacher.
Teachers’ Educational Emphasis on Language and Reading AreasIn addition to the importance of a college or university degree or advanced degree, the literature reports widespread agreement that teachers should have solid mastery of the content in the subject to be taught. Content knowledge may be obtained through a university major in the subject to be taught, although teacher education also needs to teach the skills of the craft (Tucker, 2011).
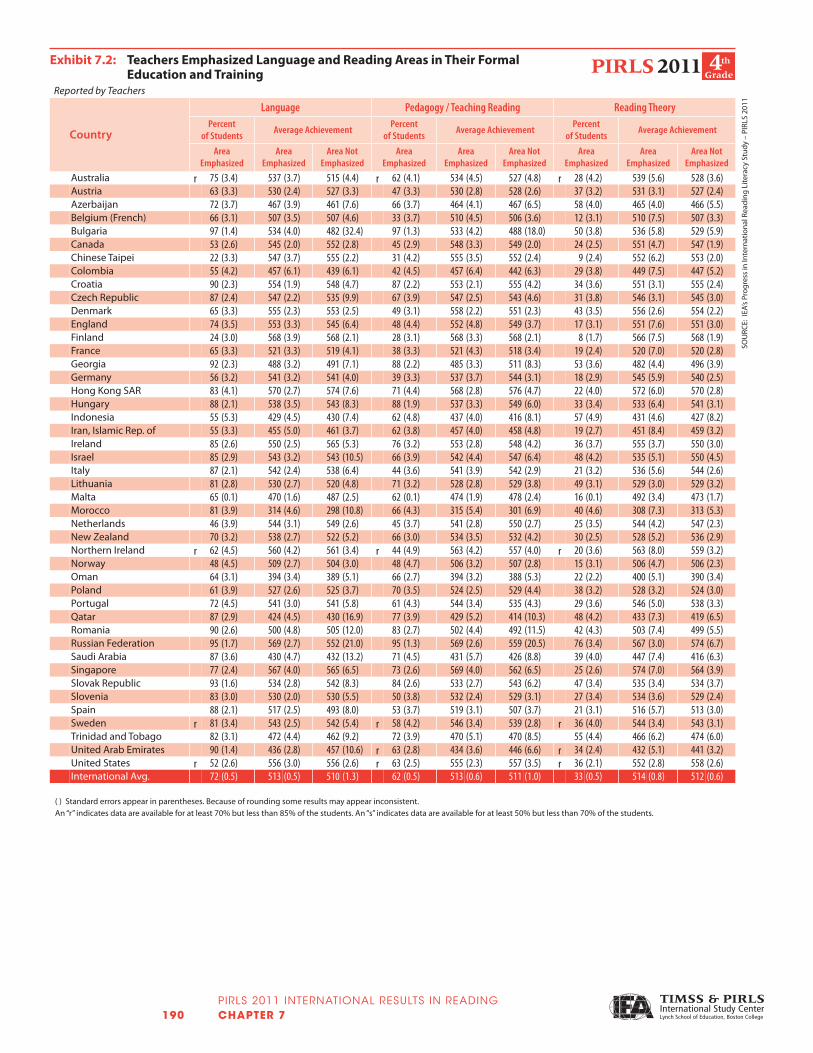
Exhibit 7.2 shows the percentages of students whose teachers had various areas of specialization in their formal education and training. Internationally, on average, across the fourth grade countries, 72 percent of the students had reading teachers with an emphasis on language, 62 percent had teachers with an emphasis on pedagogy/teaching reading, and 33 percent had teachers with
TEACHERPREPARATION CHAPTER7 187
an emphasis on reading theory. In all three instances, although differences were small, higher average reading achievement was associated with teachers having specialized education. This pattern can be detected for the sixth grade and prePIRLS participants to some extent, but was less consistent for the benchmarking participants.
Teachers’ Years of ExperienceIt is difficult to examine the effects of teacher experience on student achievement, because sometimes more experienced teachers are assigned to students of higher ability and fewer discipline problems, and other times the more experienced teachers are assigned to the lower-achieving students in need of more help. However, some research has addressed this selection bias problem; and experience can have a large positive impact primarily in the first few years of teaching, although the benefits can continue beyond the first five years of teacher’s career (Harris & Sass, 2011; Leigh, 2010).
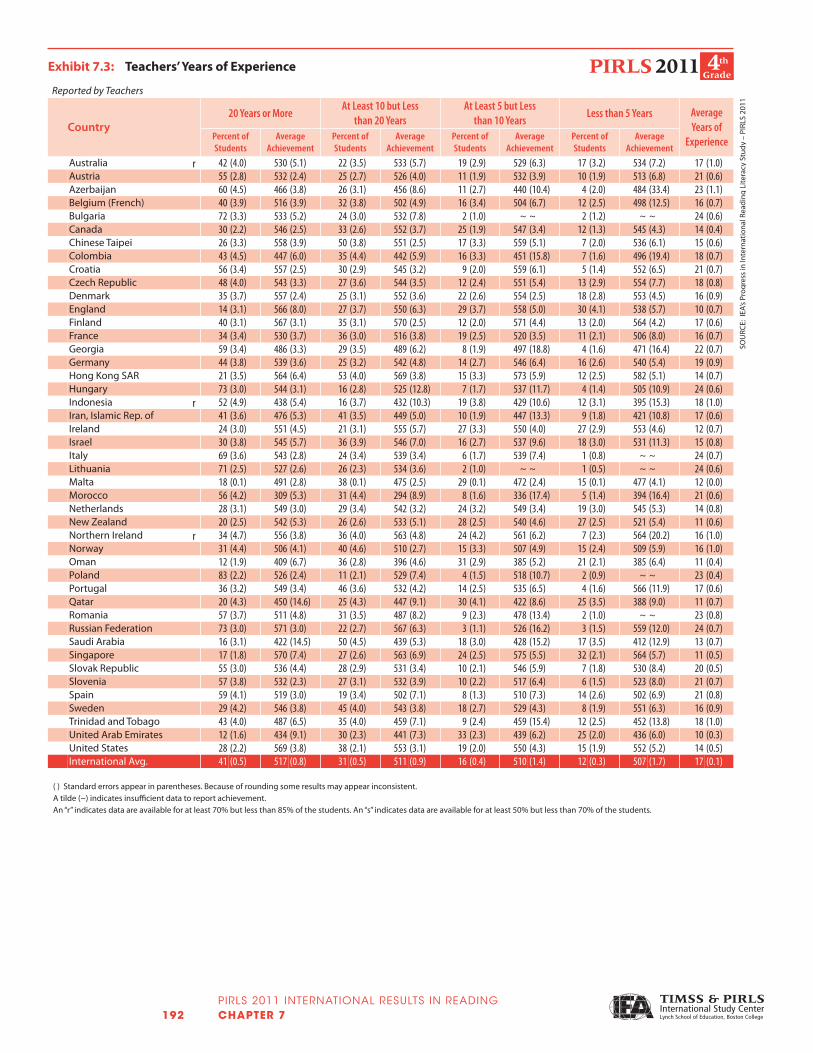
Exhibit 7.3 presents teachers’ reports about their years of experience. Internationally, on average, across countries, the fourth grade reading teachers had been teaching for an average of 17 years. Forty-one percent of the students, on average, had very experienced reading teachers with 20 years or more of experience, and another 31 percent had teachers with at least ten years of experience. Taken together, close to three-fourths of the students had very experienced teachers.
Average reading achievement was highest for students whose teachers had 20 or more years of experience and lowest for the 12 percent of students whose teachers had less than five years of experience. This achievement gap most likely is a reflection of more senior teachers receiving the preferred assignments, but also could reflect the fact that the newer teachers still are learning the most effective instructional approaches. There was variation in the results from country to country, including those at the sixth grade and in prePIRLS, as well as for the benchmarking participants.

PIRLS2011INTERNATIONALRESULTSINREADING188 CHAPTER7
Exhibit 7.1: Reading Teachers' Formal Education*
Reported by Teachers
Country
Percent of Students by Teacher Educational Level
Completed Postgraduate
University Degree**
Completed Bachelor's Degree or Equivalent but Not a Postgraduate Degree
Completed Post-secondary
Education but Not a Bachelor's Degree
No Further than Upper-secondary
Education
Australia r 64 (3.3) 29 (3.1) 5 (1.8) 1 (1.1)Austria 4 (1.3) 2 (0.9) 93 (1.6) 0 (0.3)Azerbaijan 8 (1.9) 55 (3.9) 35 (3.7) 2 (0.8)Belgium (French) 0 (0.0) 99 (0.5) 0 (0.0) 0 (0.0)Bulgaria 67 (3.2) 24 (2.8) 9 (2.0) 0 (0.0)Canada 15 (1.9) 84 (1.9) 1 (0.2) 0 (0.0)Chinese Taipei 26 (3.7) 72 (3.7) 2 (1.1) 0 (0.0)Colombia 35 (4.1) 59 (4.3) 6 (1.9) 1 (1.1)Croatia 1 (0.6) 30 (3.3) 69 (3.2) 1 (0.4)Czech Republic 93 (2.2) 1 (0.5) 3 (1.6) 3 (1.4)Denmark 4 (1.2) 75 (2.9) 19 (2.7) 1 (0.8)England 28 (4.3) 71 (4.3) 1 (0.5) 0 (0.0)Finland 82 (2.5) 17 (2.3) 0 (0.0) 2 (0.9)France 75 (3.0) 14 (2.6) 3 (1.1) 8 (1.9)Georgia 75 (3.4) 21 (3.1) 4 (1.5) 0 (0.0)Germany 1 (0.7) 83 (2.1) 9 (1.7) 7 (1.7)Hong Kong SAR 33 (4.1) 59 (4.2) 7 (2.6) 0 (0.0)Hungary 3 (1.0) 95 (1.5) 2 (1.1) 0 (0.0)Indonesia 1 (0.6) 56 (4.6) 31 (4.3) 13 (2.9)Iran, Islamic Rep. of 1 (0.8) 37 (3.4) 49 (3.4) 13 (2.2)Ireland 18 (2.8) 79 (2.7) 3 (1.3) 0 (0.0)Israel 13 (3.1) 78 (3.8) 9 (2.5) 0 (0.0)Italy 4 (1.3) 17 (2.7) 3 (1.3) 76 (3.2)Lithuania 15 (2.4) 76 (2.7) 8 (1.8) 0 (0.0)Malta 10 (0.1) 69 (0.1) 11 (0.1) 10 (0.1)Morocco 0 (0.2) 40 (3.9) 0 (0.0) 60 (4.0)Netherlands 5 (1.3) 89 (2.2) 5 (1.6) 1 (0.0)New Zealand 13 (2.0) 69 (2.9) 18 (2.1) 0 (0.0)Northern Ireland r 28 (4.1) 69 (4.3) 3 (1.5) 0 (0.0)Norway 1 (0.5) 96 (1.3) 3 (1.3) 0 (0.0)Oman 5 (0.9) 63 (3.0) 31 (3.0) 1 (0.6)Poland 96 (1.4) 3 (1.2) 1 (0.7) 0 (0.0)Portugal 3 (0.9) 91 (1.8) 6 (1.6) 0 (0.0)Qatar 23 (4.5) 70 (4.8) 6 (2.0) 1 (0.5)Romania 7 (2.1) 30 (3.5) 29 (4.0) 34 (3.5)Russian Federation 79 (2.6) 0 (0.0) 21 (2.6) 0 (0.0)Saudi Arabia 0 (0.0) 69 (3.7) 30 (3.7) 1 (0.8)Singapore 12 (2.1) 56 (2.8) 29 (2.4) 2 (0.8)Slovak Republic 99 (0.6) 0 (0.2) 1 (0.5) 0 (0.0)Slovenia 1 (0.5) 57 (3.9) 42 (3.9) 0 (0.0)Spain 2 (0.8) 98 (0.8) 0 (0.0) 0 (0.1)Sweden – – – – – – – –Trinidad and Tobago 4 (1.6) 39 (4.1) 46 (4.3) 10 (2.7)United Arab Emirates 24 (2.2) 67 (2.2) 9 (1.2) 0 (0.0)United States 65 (2.8) 35 (2.8) 0 (0.0) 0 (0.0)International Avg. 26 (0.3) 53 (0.4) 15 (0.3) 6 (0.2)
* Based on countries’ categorizations according to UNESCO’s International Standard Classification of Education (Operational Manual for ISCED-1997).** For example, doctorate, master’s, or other postgraduate degree or diploma.( ) Standard errors appear in parentheses. Because of rounding some results may appear inconsistent.A dash (–) indicates comparable data not available.An “r” indicates data are available for at least 70% but less than 85% of the students. An “s” indicates data are available for at least 50% but less than 70% of the students.
Exhibit 7.1: Reading Teachers’ Formal Education*
SOU
RCE:
IEA
’s Pr
ogre
ss in
Inte
rnat
iona
l Rea
ding
Lite
racy
Stu
dy –
PIR
LS 2
011

TEACHERPREPARATION CHAPTER7 189
Exhibit 7.1: Reading Teachers' Formal Education* (Continued)
Country
Percent of Students by Teacher Educational Level
Completed Postgraduate
University Degree**
Completed Bachelor's Degree or Equivalent but Not a Postgraduate Degree
Completed Post-secondary
Education but Not a Bachelor's Degree
No Further than Upper-secondary
Education
Sixth Grade Participants
Botswana 1 (0.0) 16 (3.6) 81 (3.7) 1 (1.0)Honduras 0 (0.0) 45 (3.7) 21 (3.7) 34 (4.1)Kuwait s 5 (2.5) 92 (3.2) 1 (0.1) 2 (1.6)Morocco r 0 (0.0) 27 (4.1) 0 (0.0) 73 (4.1)
Benchmarking Participants◊
Alberta, Canada 5 (1.7) 94 (2.0) 1 (0.9) 0 (0.0)Ontario, Canada 13 (3.1) 87 (3.1) 0 (0.0) 0 (0.0)Quebec, Canada 14 (3.3) 86 (3.4) 0 (0.1) 0 (0.0)Maltese – Malta r 12 (0.1) 70 (0.1) 9 (0.1) 10 (0.1)Eng/Afr (5) – RSA 15 (4.4) 39 (5.8) 37 (4.3) 9 (3.8)Andalusia, Spain 1 (0.8) 98 (1.0) 0 (0.0) 1 (0.0)Abu Dhabi, UAE 23 (3.9) 68 (4.0) 9 (2.0) 0 (0.0)Dubai, UAE 33 (2.0) 58 (2.4) 8 (1.6) 0 (0.0)Florida, US r 45 (5.4) 55 (5.4) 0 (0.0) 0 (0.0)◊ Republic of South Africa (RSA) tested 5th grade students receiving instruction in English (ENG) or Afrikaans (AFR).
Country Percent of Students by Teacher Educational Level
Country
Percent of Students by Teacher Educational Level
Completed Postgraduate
University Degree**
Completed Bachelor's Degree or Equivalent but Not a Postgraduate Degree
Completed Post-secondary
Education but Not a Bachelor's Degree
No Further than Upper–secondary
Education
Botswana 2 (1.2) 18 (3.2) 80 (3.5) 1 (0.0)Colombia 35 (4.1) 59 (4.3) 6 (1.9) 1 (1.1)South Africa r 12 (2.0) 32 (3.4) 41 (3.7) 15 (3.1)
Exhibit 7.1: Reading Teachers’ Formal Education* (Continued)
SOU
RCE:
IEA
’s Pr
ogre
ss in
Inte
rnat
iona
l Rea
ding
Lite
racy
Stu
dy –
PIR
LS 2
011
PIRLS2011INTERNATIONALRESULTSINREADING190 CHAPTER7
Exhibit 7.2: Teachers Emphasized Language and Reading Areas in Their Formal Education and Training
Reported by Teachers
Country
Language Pedagogy / Teaching Reading Reading TheoryPercent
of StudentsAverage Achievement
Percent of Students
Average AchievementPercent
of StudentsAverage Achievement
Area Emphasized
Area Emphasized
Area Not Emphasized
Area Emphasized
Area Emphasized
Area Not Emphasized
Area Emphasized
Area Emphasized
Area Not Emphasized
Australia r 75 (3.4) 537 (3.7) 515 (4.4) r 62 (4.1) 534 (4.5) 527 (4.8) r 28 (4.2) 539 (5.6) 528 (3.6)Austria 63 (3.3) 530 (2.4) 527 (3.3) 47 (3.3) 530 (2.8) 528 (2.6) 37 (3.2) 531 (3.1) 527 (2.4)Azerbaijan 72 (3.7) 467 (3.9) 461 (7.6) 66 (3.7) 464 (4.1) 467 (6.5) 58 (4.0) 465 (4.0) 466 (5.5)Belgium (French) 66 (3.1) 507 (3.5) 507 (4.6) 33 (3.7) 510 (4.5) 506 (3.6) 12 (3.1) 510 (7.5) 507 (3.3)Bulgaria 97 (1.4) 534 (4.0) 482 (32.4) 97 (1.3) 533 (4.2) 488 (18.0) 50 (3.8) 536 (5.8) 529 (5.9)Canada 53 (2.6) 545 (2.0) 552 (2.8) 45 (2.9) 548 (3.3) 549 (2.0) 24 (2.5) 551 (4.7) 547 (1.9)Chinese Taipei 22 (3.3) 547 (3.7) 555 (2.2) 31 (4.2) 555 (3.5) 552 (2.4) 9 (2.4) 552 (6.2) 553 (2.0)Colombia 55 (4.2) 457 (6.1) 439 (6.1) 42 (4.5) 457 (6.4) 442 (6.3) 29 (3.8) 449 (7.5) 447 (5.2)Croatia 90 (2.3) 554 (1.9) 548 (4.7) 87 (2.2) 553 (2.1) 555 (4.2) 34 (3.6) 551 (3.1) 555 (2.4)Czech Republic 87 (2.4) 547 (2.2) 535 (9.9) 67 (3.9) 547 (2.5) 543 (4.6) 31 (3.8) 546 (3.1) 545 (3.0)Denmark 65 (3.3) 555 (2.3) 553 (2.5) 49 (3.1) 558 (2.2) 551 (2.3) 43 (3.5) 556 (2.6) 554 (2.2)England 74 (3.5) 553 (3.3) 545 (6.4) 48 (4.4) 552 (4.8) 549 (3.7) 17 (3.1) 551 (7.6) 551 (3.0)Finland 24 (3.0) 568 (3.9) 568 (2.1) 28 (3.1) 568 (3.3) 568 (2.1) 8 (1.7) 566 (7.5) 568 (1.9)France 65 (3.3) 521 (3.3) 519 (4.1) 38 (3.3) 521 (4.3) 518 (3.4) 19 (2.4) 520 (7.0) 520 (2.8)Georgia 92 (2.3) 488 (3.2) 491 (7.1) 88 (2.2) 485 (3.3) 511 (8.3) 53 (3.6) 482 (4.4) 496 (3.9)Germany 56 (3.2) 541 (3.2) 541 (4.0) 39 (3.3) 537 (3.7) 544 (3.1) 18 (2.9) 545 (5.9) 540 (2.5)Hong Kong SAR 83 (4.1) 570 (2.7) 574 (7.6) 71 (4.4) 568 (2.8) 576 (4.7) 22 (4.0) 572 (6.0) 570 (2.8)Hungary 88 (2.1) 538 (3.5) 543 (8.3) 88 (1.9) 537 (3.3) 549 (6.0) 33 (3.4) 533 (6.4) 541 (3.1)Indonesia 55 (5.3) 429 (4.5) 430 (7.4) 62 (4.8) 437 (4.0) 416 (8.1) 57 (4.9) 431 (4.6) 427 (8.2)Iran, Islamic Rep. of 55 (3.3) 455 (5.0) 461 (3.7) 62 (3.8) 457 (4.0) 458 (4.8) 19 (2.7) 451 (8.4) 459 (3.2)Ireland 85 (2.6) 550 (2.5) 565 (5.3) 76 (3.2) 553 (2.8) 548 (4.2) 36 (3.7) 555 (3.7) 550 (3.0)Israel 85 (2.9) 543 (3.2) 543 (10.5) 66 (3.9) 542 (4.4) 547 (6.4) 48 (4.2) 535 (5.1) 550 (4.5)Italy 87 (2.1) 542 (2.4) 538 (6.4) 44 (3.6) 541 (3.9) 542 (2.9) 21 (3.2) 536 (5.6) 544 (2.6)Lithuania 81 (2.8) 530 (2.7) 520 (4.8) 71 (3.2) 528 (2.8) 529 (3.8) 49 (3.1) 529 (3.0) 529 (3.2)Malta 65 (0.1) 470 (1.6) 487 (2.5) 62 (0.1) 474 (1.9) 478 (2.4) 16 (0.1) 492 (3.4) 473 (1.7)Morocco 81 (3.9) 314 (4.6) 298 (10.8) 66 (4.3) 315 (5.4) 301 (6.9) 40 (4.6) 308 (7.3) 313 (5.3)Netherlands 46 (3.9) 544 (3.1) 549 (2.6) 45 (3.7) 541 (2.8) 550 (2.7) 25 (3.5) 544 (4.2) 547 (2.3)New Zealand 70 (3.2) 538 (2.7) 522 (5.2) 66 (3.0) 534 (3.5) 532 (4.2) 30 (2.5) 528 (5.2) 536 (2.9)Northern Ireland r 62 (4.5) 560 (4.2) 561 (3.4) r 44 (4.9) 563 (4.2) 557 (4.0) r 20 (3.6) 563 (8.0) 559 (3.2)Norway 48 (4.5) 509 (2.7) 504 (3.0) 48 (4.7) 506 (3.2) 507 (2.8) 15 (3.1) 506 (4.7) 506 (2.3)Oman 64 (3.1) 394 (3.4) 389 (5.1) 66 (2.7) 394 (3.2) 388 (5.3) 22 (2.2) 400 (5.1) 390 (3.4)Poland 61 (3.9) 527 (2.6) 525 (3.7) 70 (3.5) 524 (2.5) 529 (4.4) 38 (3.2) 528 (3.2) 524 (3.0)Portugal 72 (4.5) 541 (3.0) 541 (5.8) 61 (4.3) 544 (3.4) 535 (4.3) 29 (3.6) 546 (5.0) 538 (3.3)Qatar 87 (2.9) 424 (4.5) 430 (16.9) 77 (3.9) 429 (5.2) 414 (10.3) 48 (4.2) 433 (7.3) 419 (6.5)Romania 90 (2.6) 500 (4.8) 505 (12.0) 83 (2.7) 502 (4.4) 492 (11.5) 42 (4.3) 503 (7.4) 499 (5.5)Russian Federation 95 (1.7) 569 (2.7) 552 (21.0) 95 (1.3) 569 (2.6) 559 (20.5) 76 (3.4) 567 (3.0) 574 (6.7)Saudi Arabia 87 (3.6) 430 (4.7) 432 (13.2) 71 (4.5) 431 (5.7) 426 (8.8) 39 (4.0) 447 (7.4) 416 (6.3)Singapore 77 (2.4) 567 (4.0) 565 (6.5) 73 (2.6) 569 (4.0) 562 (6.5) 25 (2.6) 574 (7.0) 564 (3.9)Slovak Republic 93 (1.6) 534 (2.8) 542 (8.3) 84 (2.6) 533 (2.7) 543 (6.2) 47 (3.4) 535 (3.4) 534 (3.7)Slovenia 83 (3.0) 530 (2.0) 530 (5.5) 50 (3.8) 532 (2.4) 529 (3.1) 27 (3.4) 534 (3.6) 529 (2.4)Spain 88 (2.1) 517 (2.5) 493 (8.0) 53 (3.7) 519 (3.1) 507 (3.7) 21 (3.1) 516 (5.7) 513 (3.0)Sweden r 81 (3.4) 543 (2.5) 542 (5.4) r 58 (4.2) 546 (3.4) 539 (2.8) r 36 (4.0) 544 (3.4) 543 (3.1)Trinidad and Tobago 82 (3.1) 472 (4.4) 462 (9.2) 72 (3.9) 470 (5.1) 470 (8.5) 55 (4.4) 466 (6.2) 474 (6.0)United Arab Emirates 90 (1.4) 436 (2.8) 457 (10.6) r 63 (2.8) 434 (3.6) 446 (6.6) r 34 (2.4) 432 (5.1) 441 (3.2)United States r 52 (2.6) 556 (3.0) 556 (2.6) r 63 (2.5) 555 (2.3) 557 (3.5) r 36 (2.1) 552 (2.8) 558 (2.6)International Avg. 72 (0.5) 513 (0.5) 510 (1.3) 62 (0.5) 513 (0.6) 511 (1.0) 33 (0.5) 514 (0.8) 512 (0.6)
( ) Standard errors appear in parentheses. Because of rounding some results may appear inconsistent.An “r” indicates data are available for at least 70% but less than 85% of the students. An “s” indicates data are available for at least 50% but less than 70% of the students.
Exhibit 7.2: Teachers Emphasized Language and Reading Areas in Their Formal Education and Training (Continued)
Country
Language Pedagogy / Teaching Reading Reading TheoryPercent
of StudentsAverage Achievement
Percent of Students
Average AchievementPercent
of StudentsAverage Achievement
Area Emphasized
Area Emphasized
Area Not Emphasized
Area Emphasized
Area Emphasized
Area Not Emphasized
Area Emphasized
Area Emphasized
Area Not Emphasized
Sixth Grade Participants
Botswana 53 (4.4) 434 (7.0) 407 (5.1) r 45 (5.2) 439 (8.3) 405 (5.1) 32 (4.5) 445 (10.3) 409 (4.4)Honduras 49 (5.1) 443 (9.1) 453 (6.9) 37 (4.8) 447 (9.1) 446 (7.5) r 26 (3.7) 450 (9.7) 446 (7.2)Kuwait s 94 (2.8) 417 (7.5) 428 (46.1) s 69 (4.5) 417 (8.6) 418 (14.8) s 25 (4.7) 411 (15.8) 418 (8.5)Morocco r 85 (3.5) 420 (5.3) 427 (7.4) r 70 (4.4) 421 (5.1) 420 (9.8) r 37 (4.6) 424 (7.6) 418 (6.8)
Benchmarking Participants◊
Alberta, Canada 55 (3.4) 545 (4.5) 552 (3.9) 43 (3.7) 551 (4.5) 545 (3.7) 23 (3.1) 550 (5.0) 547 (3.3)Ontario, Canada 47 (4.4) 547 (4.5) 555 (3.5) 52 (3.9) 545 (3.4) 558 (3.8) 28 (3.8) 549 (5.3) 552 (3.0)Quebec, Canada 56 (4.3) 536 (3.3) 538 (3.0) 34 (4.0) 536 (3.1) 538 (2.7) 17 (3.8) 536 (4.1) 537 (2.4)Maltese - Malta s 67 (0.2) 456 (2.0) 465 (2.9) s 61 (0.2) 460 (2.2) 457 (3.0) s 15 (0.1) 465 (4.2) 458 (1.8)Eng/Afr (5) - RSA r 75 (5.2) 430 (8.3) 430 (17.4) r 52 (6.9) 423 (13.5) 447 (15.0) r 35 (5.9) 403 (14.5) 449 (13.2)Andalusia, Spain 88 (2.7) 517 (2.7) 505 (6.0) 62 (3.8) 516 (3.0) 511 (3.7) 20 (3.0) 519 (6.8) 513 (2.6)Abu Dhabi, UAE 90 (2.6) 422 (5.2) 449 (22.5) r 64 (4.7) 416 (5.7) 436 (11.8) r 43 (4.6) 413 (7.5) 431 (7.7)Dubai, UAE r 88 (2.3) 477 (2.8) 476 (10.7) r 57 (4.6) 479 (6.1) 477 (7.8) r 28 (3.3) 479 (7.0) 477 (3.8)Florida, US r 55 (4.2) 563 (5.5) 578 (5.1) r 76 (4.0) 567 (4.3) 576 (8.6) r 49 (4.8) 557 (5.3) 582 (5.4)◊ Republic of South Africa (RSA) tested 5th grade students receiving instruction in English (ENG) or Afrikaans (AFR).
Country
Language Pedagogy / Teaching Reading Reading TheoryPercent
of StudentsAverage Achievement
Percent of Students
Average AchievementPercent
of StudentsAverage Achievement
Area Emphasized
Area Emphasized
Area Not Emphasized
Area Emphasized
Area Emphasized
Area Not Emphasized
Area Emphasized
Area Emphasized
Area Not Emphasized
Botswana 54 (4.3) 470 (6.5) 455 (4.2) 44 (4.5) 474 (8.2) 455 (4.0) 33 (3.9) 482 (9.7) 454 (3.3)Colombia 55 (4.2) 584 (5.0) 570 (4.9) 42 (4.5) 584 (5.2) 572 (5.0) 29 (3.8) 578 (6.3) 577 (4.0)South Africa 63 (3.3) 471 (5.8) 445 (8.5) r 55 (3.9) 464 (6.5) 463 (7.5) r 36 (3.6) 452 (7.1) 468 (6.4)
Exhibit 7.2: Teachers Emphasized Language and Reading Areas in Their Formal Education and Training
SOU
RCE:
IEA
’s Pr
ogre
ss in
Inte
rnat
iona
l Rea
ding
Lite
racy
Stu
dy –
PIR
LS 2
011

TEACHERPREPARATION CHAPTER7 191
Exhibit 7.2: Teachers Emphasized Language and Reading Areas in Their Formal Education and Training (Continued)
Country
Language Pedagogy / Teaching Reading Reading TheoryPercent
of StudentsAverage Achievement
Percent of Students
Average AchievementPercent
of StudentsAverage Achievement
Area Emphasized
Area Emphasized
Area Not Emphasized
Area Emphasized
Area Emphasized
Area Not Emphasized
Area Emphasized
Area Emphasized
Area Not Emphasized
Sixth Grade Participants
Botswana 53 (4.4) 434 (7.0) 407 (5.1) r 45 (5.2) 439 (8.3) 405 (5.1) 32 (4.5) 445 (10.3) 409 (4.4)Honduras 49 (5.1) 443 (9.1) 453 (6.9) 37 (4.8) 447 (9.1) 446 (7.5) r 26 (3.7) 450 (9.7) 446 (7.2)Kuwait s 94 (2.8) 417 (7.5) 428 (46.1) s 69 (4.5) 417 (8.6) 418 (14.8) s 25 (4.7) 411 (15.8) 418 (8.5)Morocco r 85 (3.5) 420 (5.3) 427 (7.4) r 70 (4.4) 421 (5.1) 420 (9.8) r 37 (4.6) 424 (7.6) 418 (6.8)
Benchmarking Participants◊
Alberta, Canada 55 (3.4) 545 (4.5) 552 (3.9) 43 (3.7) 551 (4.5) 545 (3.7) 23 (3.1) 550 (5.0) 547 (3.3)Ontario, Canada 47 (4.4) 547 (4.5) 555 (3.5) 52 (3.9) 545 (3.4) 558 (3.8) 28 (3.8) 549 (5.3) 552 (3.0)Quebec, Canada 56 (4.3) 536 (3.3) 538 (3.0) 34 (4.0) 536 (3.1) 538 (2.7) 17 (3.8) 536 (4.1) 537 (2.4)Maltese - Malta s 67 (0.2) 456 (2.0) 465 (2.9) s 61 (0.2) 460 (2.2) 457 (3.0) s 15 (0.1) 465 (4.2) 458 (1.8)Eng/Afr (5) - RSA r 75 (5.2) 430 (8.3) 430 (17.4) r 52 (6.9) 423 (13.5) 447 (15.0) r 35 (5.9) 403 (14.5) 449 (13.2)Andalusia, Spain 88 (2.7) 517 (2.7) 505 (6.0) 62 (3.8) 516 (3.0) 511 (3.7) 20 (3.0) 519 (6.8) 513 (2.6)Abu Dhabi, UAE 90 (2.6) 422 (5.2) 449 (22.5) r 64 (4.7) 416 (5.7) 436 (11.8) r 43 (4.6) 413 (7.5) 431 (7.7)Dubai, UAE r 88 (2.3) 477 (2.8) 476 (10.7) r 57 (4.6) 479 (6.1) 477 (7.8) r 28 (3.3) 479 (7.0) 477 (3.8)Florida, US r 55 (4.2) 563 (5.5) 578 (5.1) r 76 (4.0) 567 (4.3) 576 (8.6) r 49 (4.8) 557 (5.3) 582 (5.4)◊ Republic of South Africa (RSA) tested 5th grade students receiving instruction in English (ENG) or Afrikaans (AFR).
Country
Language Pedagogy / Teaching Reading Reading TheoryPercent
of StudentsAverage Achievement
Percent of Students
Average AchievementPercent
of StudentsAverage Achievement
Area Emphasized
Area Emphasized
Area Not Emphasized
Area Emphasized
Area Emphasized
Area Not Emphasized
Area Emphasized
Area Emphasized
Area Not Emphasized
Botswana 54 (4.3) 470 (6.5) 455 (4.2) 44 (4.5) 474 (8.2) 455 (4.0) 33 (3.9) 482 (9.7) 454 (3.3)Colombia 55 (4.2) 584 (5.0) 570 (4.9) 42 (4.5) 584 (5.2) 572 (5.0) 29 (3.8) 578 (6.3) 577 (4.0)South Africa 63 (3.3) 471 (5.8) 445 (8.5) r 55 (3.9) 464 (6.5) 463 (7.5) r 36 (3.6) 452 (7.1) 468 (6.4)
Exhibit 7.2: Teachers Emphasized Language and Reading Areas in Their Formal Education and Training (Continued)
SOU
RCE:
IEA
’s Pr
ogre
ss in
Inte
rnat
iona
l Rea
ding
Lite
racy
Stu
dy –
PIR
LS 2
011
PIRLS2011INTERNATIONALRESULTSINREADING192 CHAPTER7
Exhibit 7.3: Teachers’ Years of Experience
Reported by Teachers
Country20 Years or More
At Least 10 but Less than 20 Years
At Least 5 but Less than 10 Years
Less than 5 Years Average Years of
ExperiencePercent of Students
Average Achievement
Percent of Students
Average Achievement
Percent of Students
Average Achievement
Percent of Students
Average Achievement
Australia r 42 (4.0) 530 (5.1) 22 (3.5) 533 (5.7) 19 (2.9) 529 (6.3) 17 (3.2) 534 (7.2) 17 (1.0)Austria 55 (2.8) 532 (2.4) 25 (2.7) 526 (4.0) 11 (1.9) 532 (3.9) 10 (1.9) 513 (6.8) 21 (0.6)Azerbaijan 60 (4.5) 466 (3.8) 26 (3.1) 456 (8.6) 11 (2.7) 440 (10.4) 4 (2.0) 484 (33.4) 23 (1.1)Belgium (French) 40 (3.9) 516 (3.9) 32 (3.8) 502 (4.9) 16 (3.4) 504 (6.7) 12 (2.5) 498 (12.5) 16 (0.7)Bulgaria 72 (3.3) 533 (5.2) 24 (3.0) 532 (7.8) 2 (1.0) ~ ~ 2 (1.2) ~ ~ 24 (0.6)Canada 30 (2.2) 546 (2.5) 33 (2.6) 552 (3.7) 25 (1.9) 547 (3.4) 12 (1.3) 545 (4.3) 14 (0.4)Chinese Taipei 26 (3.3) 558 (3.9) 50 (3.8) 551 (2.5) 17 (3.3) 559 (5.1) 7 (2.0) 536 (6.1) 15 (0.6)Colombia 43 (4.5) 447 (6.0) 35 (4.4) 442 (5.9) 16 (3.3) 451 (15.8) 7 (1.6) 496 (19.4) 18 (0.7)Croatia 56 (3.4) 557 (2.5) 30 (2.9) 545 (3.2) 9 (2.0) 559 (6.1) 5 (1.4) 552 (6.5) 21 (0.7)Czech Republic 48 (4.0) 543 (3.3) 27 (3.6) 544 (3.5) 12 (2.4) 551 (5.4) 13 (2.9) 554 (7.7) 18 (0.8)Denmark 35 (3.7) 557 (2.4) 25 (3.1) 552 (3.6) 22 (2.6) 554 (2.5) 18 (2.8) 553 (4.5) 16 (0.9)England 14 (3.1) 566 (8.0) 27 (3.7) 550 (6.3) 29 (3.7) 558 (5.0) 30 (4.1) 538 (5.7) 10 (0.7)Finland 40 (3.1) 567 (3.1) 35 (3.1) 570 (2.5) 12 (2.0) 571 (4.4) 13 (2.0) 564 (4.2) 17 (0.6)France 34 (3.4) 530 (3.7) 36 (3.0) 516 (3.8) 19 (2.5) 520 (3.5) 11 (2.1) 506 (8.0) 16 (0.7)Georgia 59 (3.4) 486 (3.3) 29 (3.5) 489 (6.2) 8 (1.9) 497 (18.8) 4 (1.6) 471 (16.4) 22 (0.7)Germany 44 (3.8) 539 (3.6) 25 (3.2) 542 (4.8) 14 (2.7) 546 (6.4) 16 (2.6) 540 (5.4) 19 (0.9)Hong Kong SAR 21 (3.5) 564 (6.4) 53 (4.0) 569 (3.8) 15 (3.3) 573 (5.9) 12 (2.5) 582 (5.1) 14 (0.7)Hungary 73 (3.0) 544 (3.1) 16 (2.8) 525 (12.8) 7 (1.7) 537 (11.7) 4 (1.4) 505 (10.9) 24 (0.6)Indonesia r 52 (4.9) 438 (5.4) 16 (3.7) 432 (10.3) 19 (3.8) 429 (10.6) 12 (3.1) 395 (15.3) 18 (1.0)Iran, Islamic Rep. of 41 (3.6) 476 (5.3) 41 (3.5) 449 (5.0) 10 (1.9) 447 (13.3) 9 (1.8) 421 (10.8) 17 (0.6)Ireland 24 (3.0) 551 (4.5) 21 (3.1) 555 (5.7) 27 (3.3) 550 (4.0) 27 (2.9) 553 (4.6) 12 (0.7)Israel 30 (3.8) 545 (5.7) 36 (3.9) 546 (7.0) 16 (2.7) 537 (9.6) 18 (3.0) 531 (11.3) 15 (0.8)Italy 69 (3.6) 543 (2.8) 24 (3.4) 539 (3.4) 6 (1.7) 539 (7.4) 1 (0.8) ~ ~ 24 (0.7)Lithuania 71 (2.5) 527 (2.6) 26 (2.3) 534 (3.6) 2 (1.0) ~ ~ 1 (0.5) ~ ~ 24 (0.6)Malta 18 (0.1) 491 (2.8) 38 (0.1) 475 (2.5) 29 (0.1) 472 (2.4) 15 (0.1) 477 (4.1) 12 (0.0)Morocco 56 (4.2) 309 (5.3) 31 (4.4) 294 (8.9) 8 (1.6) 336 (17.4) 5 (1.4) 394 (16.4) 21 (0.6)Netherlands 28 (3.1) 549 (3.0) 29 (3.4) 542 (3.2) 24 (3.2) 549 (3.4) 19 (3.0) 545 (5.3) 14 (0.8)New Zealand 20 (2.5) 542 (5.3) 26 (2.6) 533 (5.1) 28 (2.5) 540 (4.6) 27 (2.5) 521 (5.4) 11 (0.6)Northern Ireland r 34 (4.7) 556 (3.8) 36 (4.0) 563 (4.8) 24 (4.2) 561 (6.2) 7 (2.3) 564 (20.2) 16 (1.0)Norway 31 (4.4) 506 (4.1) 40 (4.6) 510 (2.7) 15 (3.3) 507 (4.9) 15 (2.4) 509 (5.9) 16 (1.0)Oman 12 (1.9) 409 (6.7) 36 (2.8) 396 (4.6) 31 (2.9) 385 (5.2) 21 (2.1) 385 (6.4) 11 (0.4)Poland 83 (2.2) 526 (2.4) 11 (2.1) 529 (7.4) 4 (1.5) 518 (10.7) 2 (0.9) ~ ~ 23 (0.4)Portugal 36 (3.2) 549 (3.4) 46 (3.6) 532 (4.2) 14 (2.5) 535 (6.5) 4 (1.6) 566 (11.9) 17 (0.6)Qatar 20 (4.3) 450 (14.6) 25 (4.3) 447 (9.1) 30 (4.1) 422 (8.6) 25 (3.5) 388 (9.0) 11 (0.7)Romania 57 (3.7) 511 (4.8) 31 (3.5) 487 (8.2) 9 (2.3) 478 (13.4) 2 (1.0) ~ ~ 23 (0.8)Russian Federation 73 (3.0) 571 (3.0) 22 (2.7) 567 (6.3) 3 (1.1) 526 (16.2) 3 (1.5) 559 (12.0) 24 (0.7)Saudi Arabia 16 (3.1) 422 (14.5) 50 (4.5) 439 (5.3) 18 (3.0) 428 (15.2) 17 (3.5) 412 (12.9) 13 (0.7)Singapore 17 (1.8) 570 (7.4) 27 (2.6) 563 (6.9) 24 (2.5) 575 (5.5) 32 (2.1) 564 (5.7) 11 (0.5)Slovak Republic 55 (3.0) 536 (4.4) 28 (2.9) 531 (3.4) 10 (2.1) 546 (5.9) 7 (1.8) 530 (8.4) 20 (0.5)Slovenia 57 (3.8) 532 (2.3) 27 (3.1) 532 (3.9) 10 (2.2) 517 (6.4) 6 (1.5) 523 (8.0) 21 (0.7)Spain 59 (4.1) 519 (3.0) 19 (3.4) 502 (7.1) 8 (1.3) 510 (7.3) 14 (2.6) 502 (6.9) 21 (0.8)Sweden 29 (4.2) 546 (3.8) 45 (4.0) 543 (3.8) 18 (2.7) 529 (4.3) 8 (1.9) 551 (6.3) 16 (0.9)Trinidad and Tobago 43 (4.0) 487 (6.5) 35 (4.0) 459 (7.1) 9 (2.4) 459 (15.4) 12 (2.5) 452 (13.8) 18 (1.0)United Arab Emirates 12 (1.6) 434 (9.1) 30 (2.3) 441 (7.3) 33 (2.3) 439 (6.2) 25 (2.0) 436 (6.0) 10 (0.3)United States 28 (2.2) 569 (3.8) 38 (2.1) 553 (3.1) 19 (2.0) 550 (4.3) 15 (1.9) 552 (5.2) 14 (0.5)International Avg. 41 (0.5) 517 (0.8) 31 (0.5) 511 (0.9) 16 (0.4) 510 (1.4) 12 (0.3) 507 (1.7) 17 (0.1)
( ) Standard errors appear in parentheses. Because of rounding some results may appear inconsistent.A tilde (~) indicates insufficient data to report achievement. An “r” indicates data are available for at least 70% but less than 85% of the students. An “s” indicates data are available for at least 50% but less than 70% of the students.
Exhibit 7.3: Teachers’ Years of Experience (Continued)
Country20 Years or More
At Least 10 but Less than 20 Years
At Least 5 but Less than 10 Years
Less than 5 Years Average Years of
ExperiencePercent of Students
Average Achievement
Percent of Students
Average Achievement
Percent of Students
Average Achievement
Percent of Students
Average Achievement
Sixth Grade Participants
Botswana 29 (4.0) 434 (9.2) 32 (4.1) 421 (10.4) 23 (3.7) 401 (8.4) 16 (3.0) 420 (9.8) 14 (0.8)Honduras 29 (4.2) 465 (6.4) 37 (4.6) 436 (7.9) 17 (3.7) 458 (7.2) 17 (4.0) 459 (20.6) 14 (0.9)Kuwait s 9 (2.9) 419 (7.2) 23 (4.5) 412 (16.5) 16 (3.8) 429 (21.7) 52 (4.9) 419 (12.8) 7 (0.7)Morocco r 53 (4.4) 422 (7.4) 38 (4.3) 407 (9.3) 7 (2.0) 468 (14.8) 2 (0.9) ~ ~ 21 (0.7)
Benchmarking Participants◊
Alberta, Canada 33 (3.8) 544 (4.2) 23 (3.2) 560 (5.8) 23 (3.6) 554 (6.2) 21 (3.1) 533 (5.5) 14 (0.8)Ontario, Canada 20 (2.9) 549 (6.3) 31 (4.0) 550 (5.1) 33 (3.5) 553 (4.9) 17 (2.7) 551 (7.3) 12 (0.5)Quebec, Canada 33 (4.2) 538 (3.7) 40 (4.6) 539 (3.2) 20 (3.6) 533 (6.7) 7 (1.9) 537 (6.4) 16 (0.7)Maltese - Malta r 17 (0.1) 467 (3.7) 35 (0.1) 456 (2.3) 34 (0.1) 454 (2.6) 14 (0.1) 460 (3.7) 12 (0.0)Eng/Afr (5) - RSA 43 (5.0) 415 (15.3) 24 (4.6) 420 (14.8) 15 (3.5) 450 (25.3) 17 (4.7) 455 (22.5) 17 (1.1)Andalusia, Spain 58 (3.9) 521 (3.2) 16 (3.1) 520 (5.7) 11 (2.6) 501 (8.7) 15 (2.8) 498 (7.2) 21 (1.0)Abu Dhabi, UAE 15 (3.2) 397 (12.8) 31 (4.4) 428 (13.5) 28 (4.1) 419 (10.4) 26 (3.7) 438 (9.7) 10 (0.6)Dubai, UAE r 13 (2.6) 492 (10.3) 28 (3.6) 477 (9.7) 38 (4.3) 482 (8.8) 21 (2.6) 470 (8.5) 11 (0.6)Florida, US r 26 (4.3) 572 (8.6) 33 (4.3) 576 (6.1) 30 (3.9) 566 (6.6) 11 (3.5) 563 (8.0) 15 (0.9)◊ Republic of South Africa (RSA) tested 5th grade students receiving instruction in English (ENG) or Afrikaans (AFR).
Country20 Years or More
At Least 10 but Less than 20 Years
At Least 5 but Less than 10 Years
Less than 5 Years Average Years of
ExperiencePercent of Students
Average Achievement
Percent of Students
Average Achievement
Percent of Students
Average Achievement
Percent of Students
Average Achievement
Botswana 26 (4.0) 473 (10.9) 33 (4.3) 474 (7.8) 11 (3.0) 444 (8.1) 30 (4.3) 451 (6.4) 14 (0.9)Colombia 43 (4.5) 576 (5.5) 35 (4.4) 570 (5.4) 16 (3.3) 580 (11.8) 7 (1.6) 617 (10.0) 18 (0.7)South Africa 40 (3.6) 471 (8.8) 31 (2.9) 463 (8.4) 13 (2.1) 440 (10.5) 16 (2.7) 455 (11.6) 17 (0.8)
Exhibit 7.3: Teachers’ Years of Experience
SOU
RCE:
IEA
’s Pr
ogre
ss in
Inte
rnat
iona
l Rea
ding
Lite
racy
Stu
dy –
PIR
LS 2
011

TEACHERPREPARATION CHAPTER7 193
Exhibit 7.3: Teachers’ Years of Experience (Continued)
Country20 Years or More
At Least 10 but Less than 20 Years
At Least 5 but Less than 10 Years
Less than 5 Years Average Years of
ExperiencePercent of Students
Average Achievement
Percent of Students
Average Achievement
Percent of Students
Average Achievement
Percent of Students
Average Achievement
Sixth Grade Participants
Botswana 29 (4.0) 434 (9.2) 32 (4.1) 421 (10.4) 23 (3.7) 401 (8.4) 16 (3.0) 420 (9.8) 14 (0.8)Honduras 29 (4.2) 465 (6.4) 37 (4.6) 436 (7.9) 17 (3.7) 458 (7.2) 17 (4.0) 459 (20.6) 14 (0.9)Kuwait s 9 (2.9) 419 (7.2) 23 (4.5) 412 (16.5) 16 (3.8) 429 (21.7) 52 (4.9) 419 (12.8) 7 (0.7)Morocco r 53 (4.4) 422 (7.4) 38 (4.3) 407 (9.3) 7 (2.0) 468 (14.8) 2 (0.9) ~ ~ 21 (0.7)
Benchmarking Participants◊
Alberta, Canada 33 (3.8) 544 (4.2) 23 (3.2) 560 (5.8) 23 (3.6) 554 (6.2) 21 (3.1) 533 (5.5) 14 (0.8)Ontario, Canada 20 (2.9) 549 (6.3) 31 (4.0) 550 (5.1) 33 (3.5) 553 (4.9) 17 (2.7) 551 (7.3) 12 (0.5)Quebec, Canada 33 (4.2) 538 (3.7) 40 (4.6) 539 (3.2) 20 (3.6) 533 (6.7) 7 (1.9) 537 (6.4) 16 (0.7)Maltese - Malta r 17 (0.1) 467 (3.7) 35 (0.1) 456 (2.3) 34 (0.1) 454 (2.6) 14 (0.1) 460 (3.7) 12 (0.0)Eng/Afr (5) - RSA 43 (5.0) 415 (15.3) 24 (4.6) 420 (14.8) 15 (3.5) 450 (25.3) 17 (4.7) 455 (22.5) 17 (1.1)Andalusia, Spain 58 (3.9) 521 (3.2) 16 (3.1) 520 (5.7) 11 (2.6) 501 (8.7) 15 (2.8) 498 (7.2) 21 (1.0)Abu Dhabi, UAE 15 (3.2) 397 (12.8) 31 (4.4) 428 (13.5) 28 (4.1) 419 (10.4) 26 (3.7) 438 (9.7) 10 (0.6)Dubai, UAE r 13 (2.6) 492 (10.3) 28 (3.6) 477 (9.7) 38 (4.3) 482 (8.8) 21 (2.6) 470 (8.5) 11 (0.6)Florida, US r 26 (4.3) 572 (8.6) 33 (4.3) 576 (6.1) 30 (3.9) 566 (6.6) 11 (3.5) 563 (8.0) 15 (0.9)◊ Republic of South Africa (RSA) tested 5th grade students receiving instruction in English (ENG) or Afrikaans (AFR).
Country20 Years or More
At Least 10 but Less than 20 Years
At Least 5 but Less than 10 Years
Less than 5 Years Average Years of
ExperiencePercent of Students
Average Achievement
Percent of Students
Average Achievement
Percent of Students
Average Achievement
Percent of Students
Average Achievement
Botswana 26 (4.0) 473 (10.9) 33 (4.3) 474 (7.8) 11 (3.0) 444 (8.1) 30 (4.3) 451 (6.4) 14 (0.9)Colombia 43 (4.5) 576 (5.5) 35 (4.4) 570 (5.4) 16 (3.3) 580 (11.8) 7 (1.6) 617 (10.0) 18 (0.7)South Africa 40 (3.6) 471 (8.8) 31 (2.9) 463 (8.4) 13 (2.1) 440 (10.5) 16 (2.7) 455 (11.6) 17 (0.8)
Exhibit 7.3: Teachers’ Years of Experience (Continued)
SOU
RCE:
IEA
’s Pr
ogre
ss in
Inte
rnat
iona
l Rea
ding
Lite
racy
Stu
dy –
PIR
LS 2
011

PIRLS2011INTERNATIONALRESULTSINREADING194 CHAPTER7
Teachers’ Professional DevelopmentAlthough a number of studies have been unable to detect an effect on student achievement associated with professional development, recent research shows a positive relationship between teacher professional development and student literacy achievement (Biancarosa, Bryk, & Dexter, 2010). A meta-analysis of nine studies indicated that the amount of professional development (more than 14 hours) was an important factor (Yoon, Duncan, Lee, Scarloss, & Shapley, 2007).
Exhibit 7.4 presents teachers’ reports about the time spent on professional development related to reading. In general, the teachers were not spending large amounts of time on reading professional development. On average, across the fourth grade countries, 24 percent of the students had teachers that had spent 16 hours or more in professional development in the past two years, 50 percent had teachers that had spent some time but less than 16 hours, and 25 percent had teachers that had not spent any time in professional development for reading. Consistent with considerable research showing little impact from small amounts of time spent on professional development, students had essentially the same average reading achievement for the different amounts of professional development from 0 to 16 hours or more. However, it should be emphasized that there was considerable variation across the countries including the fourth grade, sixth grade, benchmarking, and prePIRLS participants.
Teachers’ Career SatisfactionTeachers who are satisfied with their profession and the working conditions at their school are more motivated to teach and prepare their instruction. Further, having teachers that can provide leadership is a dimension of teacher quality. However, developing master teachers requires retention in the profession. Teachers need to be committed to the profession and like it enough to continue teaching. It may be that some subject areas and locales would benefit from policies to reduce teacher attrition in order to improve student achievement (Boyd, Grossman, Lankford, Loeb, & Wyckoff, 2009).

TEACHERPREPARATION CHAPTER7 195
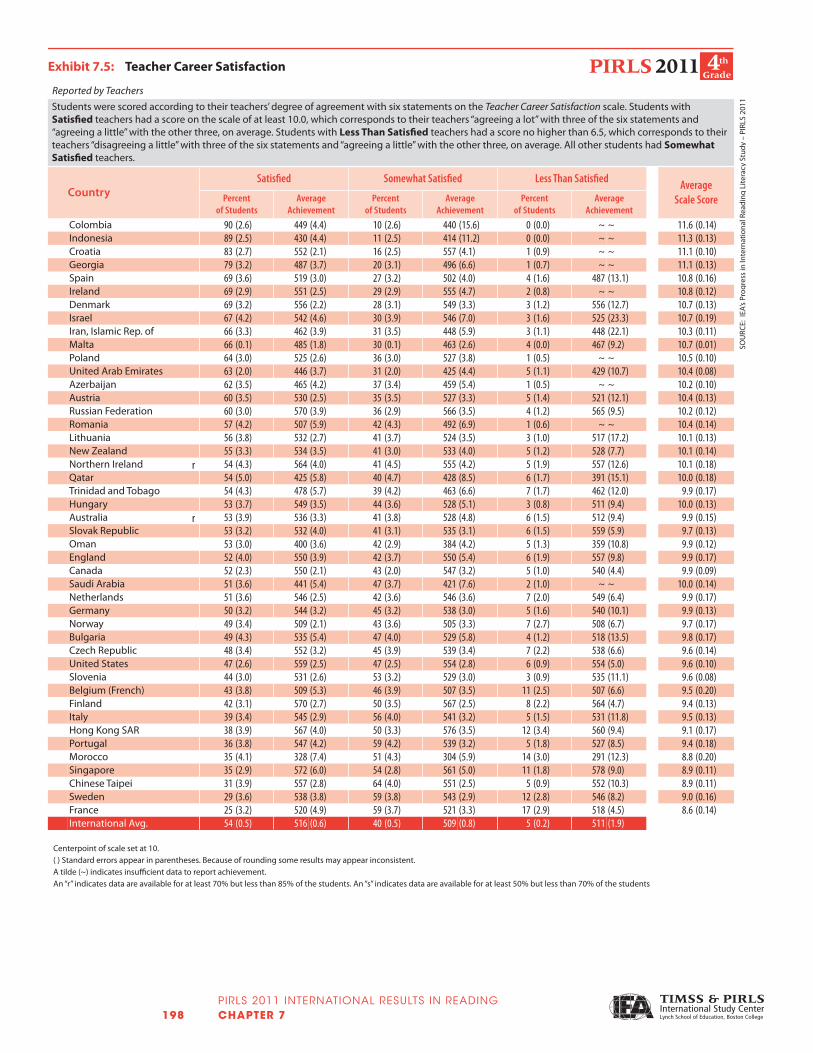
Exhibit 7.5 shows the results for the PIRLS 2011 Teacher Career Satisfaction scale, based on how much teachers agreed with each of the following six statements:
� I am content with my profession as a teacher;
� I am satisfied with being a teacher at this school;
� I had more enthusiasm when I began teaching than I have now (reverse coded);
� I do important work as a teacher;
� I plan to continue as a teacher for as long as I can; and
� I am frustrated as a teacher (reverse coded).
Students were scored according to their teachers responses, with Satisfied teachers “agreeing a lot” with three of the six statements and “agreeing a little” with the other three, on average. Internationally, on average, the majority of the fourth grade students had teachers Satisfied with their careers. Another 40 percent of the students, on average, had teachers that reported being Somewhat Satisfied (mostly agreed “a little” instead of “a lot”). Despite the fact that satisfaction could be relative, and dependent on the teaching situation, very few fourth grade students had reading teachers that expressed any dissatisfaction except in a small number of countries.
The Teacher Career Satisfaction scale was positively related to average reading achievement. On average, reading achievement was higher for the fourth grade students of Satisfied teachers than for students of somewhat or less than satisfied teachers. However, looking across the countries at the fourth grade, sixth grade, benchmarking, and prePIRLS participants, it is clear that there are differences from country to country. That is, the across-county patterns are less consistent than the within-country patterns, with some high-performing and low-performing countries having large percentages of students taught by Satisfied teachers as well as some high-performing and low-performing countries having large percentages of students taught by teachers reporting to be only Somewhat Satisfied.

PIRLS2011INTERNATIONALRESULTSINREADING196 CHAPTER7
Exhibit 7.4: Teacher Time Spent on Professional Development Relatedto Reading in the Past Two Years
Reported by Teachers
Country
16 Hours or MoreSome Time but Less
than 16 HoursNo Time
Percent of Students Whose Teachers Read
Children’s Books At Least Once a Month
for Professional Development
Percent of Students
Average Achievement
Percent of Students
Average Achievement
Percent of Students
Average Achievement
Australia r 30 (4.0) 525 (5.1) 57 (3.8) 532 (4.7) 13 (3.2) 546 (10.9) r 72 (3.7)Austria 17 (2.4) 530 (4.2) 76 (3.0) 529 (2.2) 7 (1.7) 525 (6.9) 63 (2.8)Azerbaijan 40 (3.9) 461 (5.1) 44 (3.7) 464 (5.1) 16 (2.8) 473 (5.8) 99 (0.4)Belgium (French) 9 (2.2) 506 (7.9) 51 (4.1) 504 (4.1) 41 (4.0) 512 (4.6) 64 (4.7)Bulgaria 8 (2.1) 544 (10.2) 38 (3.4) 537 (6.7) 54 (3.4) 527 (5.2) 87 (2.4)Canada 30 (2.2) 550 (2.6) 62 (2.3) 548 (2.3) 7 (1.1) 548 (4.2) 83 (1.8)Chinese Taipei 25 (3.5) 556 (2.6) 64 (3.9) 552 (2.5) 11 (1.9) 554 (5.2) 85 (2.8)Colombia 34 (3.8) 453 (7.2) 38 (3.8) 454 (7.4) 28 (4.4) 433 (7.1) 96 (1.3)Croatia 11 (2.6) 548 (5.9) 75 (3.5) 552 (2.0) 14 (2.9) 562 (6.0) 92 (2.2)Czech Republic 9 (2.2) 530 (12.5) 52 (4.1) 543 (2.7) 40 (4.0) 551 (3.2) 45 (3.8)Denmark 25 (2.6) 562 (2.7) 49 (2.8) 550 (2.5) 26 (2.6) 554 (3.7) 69 (3.3)England 7 (2.3) 539 (11.2) 66 (3.9) 550 (3.5) 27 (3.7) 556 (6.6) 72 (3.8)Finland 4 (1.3) 578 (11.8) 28 (3.5) 570 (3.2) 68 (3.3) 567 (2.1) 43 (3.8)France 2 (1.1) ~ ~ 38 (2.9) 518 (4.6) 60 (2.9) 520 (3.0) 64 (3.8)Georgia 42 (3.4) 488 (4.3) 32 (3.8) 493 (6.1) 25 (3.4) 480 (6.2) 93 (1.9)Germany 4 (1.4) 540 (7.7) 71 (3.2) 543 (2.7) 25 (2.8) 534 (4.8) 50 (3.2)Hong Kong SAR 29 (4.2) 568 (5.0) 63 (4.6) 572 (3.2) 8 (2.3) 570 (8.7) 65 (4.8)Hungary 31 (3.2) 542 (4.6) 48 (3.7) 537 (4.5) 21 (2.9) 537 (8.2) 68 (3.5)Indonesia 19 (4.8) 444 (8.8) 33 (4.2) 418 (8.3) 48 (4.4) 429 (5.5) 95 (2.3)Iran, Islamic Rep. of 47 (3.2) 451 (4.7) 25 (2.7) 467 (7.1) 28 (3.4) 461 (7.3) 70 (3.1)Ireland 11 (2.3) 540 (8.5) 52 (3.8) 550 (3.4) 37 (3.5) 558 (3.5) 44 (3.7)Israel 72 (3.8) 545 (3.5) 14 (3.2) 532 (13.8) 14 (3.1) 540 (13.2) 79 (3.7)Italy 21 (3.1) 537 (5.8) 48 (3.7) 544 (2.8) 30 (3.6) 542 (4.1) 73 (3.2)Lithuania 14 (2.3) 538 (4.2) 68 (2.9) 526 (2.6) 18 (2.9) 528 (5.5) 78 (2.8)Malta 19 (0.1) 478 (3.4) 58 (0.1) 471 (1.9) 23 (0.1) 493 (3.3) 73 (0.1)Morocco 4 (1.2) 305 (17.9) 24 (2.4) 342 (8.1) 71 (2.3) 301 (4.9) 69 (3.9)Netherlands 20 (2.9) 540 (4.6) 60 (3.8) 548 (2.3) 21 (3.2) 546 (4.8) 48 (3.5)New Zealand 27 (3.0) 526 (5.1) 60 (3.3) 539 (3.1) 13 (2.2) 525 (8.7) 70 (3.0)Northern Ireland r 12 (2.4) 562 (12.6) 69 (4.1) 556 (2.8) 19 (3.6) 575 (7.1) r 59 (4.6)Norway 18 (3.3) 514 (4.5) 49 (4.6) 507 (2.8) 32 (4.7) 502 (3.5) 46 (4.9)Oman 33 (2.9) 399 (3.5) 50 (2.9) 392 (4.0) 17 (2.6) 378 (6.5) 76 (2.6)Poland 15 (2.8) 533 (5.7) 69 (3.7) 525 (2.5) 16 (2.9) 523 (6.3) 90 (2.4)Portugal 45 (4.6) 545 (3.7) 36 (4.7) 537 (5.7) 19 (3.1) 536 (4.0) 93 (1.6)Qatar 32 (4.0) 422 (8.8) 55 (4.2) 423 (6.6) 14 (2.6) 434 (21.5) 85 (3.3)Romania 51 (4.1) 498 (5.9) 39 (4.0) 503 (6.9) 11 (2.4) 504 (15.5) 93 (1.7)Russian Federation 39 (3.3) 565 (4.7) 43 (3.2) 571 (4.0) 18 (2.8) 569 (6.7) 95 (1.4)Saudi Arabia 22 (3.6) 433 (8.1) 64 (4.5) 430 (7.1) 14 (3.6) 431 (11.1) 69 (3.7)Singapore 31 (2.5) 571 (6.9) 51 (2.8) 567 (4.2) 18 (2.2) 556 (7.6) 72 (2.6)Slovak Republic 13 (2.1) 532 (9.8) 38 (3.1) 539 (3.9) 49 (3.3) 533 (3.2) 63 (3.6)Slovenia 16 (2.7) 530 (4.4) 66 (3.4) 529 (2.4) 18 (2.5) 534 (5.4) 83 (2.7)Spain 33 (3.7) 518 (4.0) 29 (3.9) 518 (4.8) 38 (3.1) 505 (4.0) 62 (3.8)Sweden r 32 (3.7) 543 (4.1) 44 (4.3) 540 (3.2) 23 (3.8) 548 (3.7) r 46 (4.5)Trinidad and Tobago 33 (4.2) 467 (7.2) 46 (4.5) 473 (5.9) 21 (2.9) 474 (11.5) 92 (2.3)United Arab Emirates 24 (2.2) 425 (5.7) 59 (2.6) 437 (3.4) 17 (2.0) 467 (6.8) r 89 (1.8)United States 41 (2.3) 551 (3.3) 55 (2.4) 559 (2.5) 4 (1.1) 567 (11.4) r 78 (2.0)International Avg. 24 (0.5) 512 (1.1) 50 (0.5) 513 (0.7) 25 (0.5) 513 (1.1) 73 (0.5)
( ) Standard errors appear in parentheses. Because of rounding some results may appear inconsistent.A tilde (~) indicates insufficient data to report achievement. An “r” indicates data are available for at least 70% but less than 85% of the students. An “s” indicates data are available for at least 50% but less than 70% of the students.
Exhibit 7.4: Teacher Time Spent on Professional Development Relatedto Reading in the Past Two Years
SOU
RCE:
IEA
’s Pr
ogre
ss in
Inte
rnat
iona
l Rea
ding
Lite
racy
Stu
dy –
PIR
LS 2
011

TEACHERPREPARATION CHAPTER7 197
Exhibit 7.4: Teacher Time Spent on Professional Development Relatedto Reading in the Past Two Years (Continued)
Country
16 Hours or MoreSome Time but Less
than 16 HoursNo Time
Percent of Students Whose Teachers Read
Children’s Books At Least Once a Month
for Professional Development
Percent of Students
Average Achievement
Percent of Students
Average Achievement
Percent of Students
Average Achievement
Sixth Grade Participants
Botswana 10 (2.4) 440 (15.8) 41 (4.1) 417 (5.4) 49 (4.1) 418 (7.3) r 95 (2.0)Honduras 37 (4.8) 445 (12.3) 46 (4.8) 455 (6.8) 17 (3.7) 442 (8.4) 86 (3.6)Kuwait s 22 (4.6) 423 (11.7) 63 (5.4) 420 (8.9) 14 (3.6) 398 (27.3) s 83 (4.4)Morocco r 7 (1.5) 464 (10.5) 32 (4.6) 435 (13.0) 62 (4.5) 410 (5.7) r 61 (5.2)
Benchmarking Participants◊
Alberta, Canada 37 (3.5) 548 (4.4) 54 (3.5) 545 (4.3) 9 (2.5) 569 (8.8) 84 (3.1)Ontario, Canada 38 (3.7) 553 (4.8) 58 (3.6) 550 (3.5) 4 (1.8) 541 (8.2) 90 (2.3)Quebec, Canada 14 (2.9) 532 (4.5) 70 (4.0) 538 (2.8) 15 (3.2) 539 (7.0) r 73 (4.2)Maltese - Malta s 18 (0.1) 451 (4.7) 52 (0.2) 459 (2.3) 30 (0.2) 460 (3.4) s 72 (0.1)Eng/Afr (5) - RSA 16 (3.9) 389 (29.9) 53 (5.3) 433 (11.8) 31 (4.8) 441 (15.2) 77 (4.5)Andalusia, Spain 40 (4.2) 511 (4.1) 27 (3.6) 518 (5.3) 33 (4.1) 517 (4.2) 65 (4.0)Abu Dhabi, UAE 25 (3.6) 402 (10.5) 54 (4.7) 422 (7.8) 21 (4.1) 457 (7.8) r 90 (2.9)Dubai, UAE r 22 (2.3) 466 (7.9) 64 (2.4) 473 (3.2) 14 (2.0) 521 (8.0) r 87 (2.3)Florida, US r 57 (5.7) 565 (6.4) 43 (5.6) 575 (5.3) 1 (0.0) ~ ~ r 87 (3.0)◊ Republic of South Africa (RSA) tested 5th grade students receiving instruction in English (ENG) or Afrikaans (AFR).
Country
16 Hours or MoreSome Time but Less
than 16 HoursNo Time
Percent of Students Whose Teachers Read
Children’s Books At Least Once a Month
for Professional Development
Percent of Students
Average Achievement
Percent of Students
Average Achievement
Percent of Students
Average Achievement
Botswana 11 (2.6) 463 (14.5) 41 (4.0) 466 (5.7) 49 (4.3) 461 (6.1) 97 (1.6)Colombia 34 (3.8) 579 (6.0) 38 (3.8) 580 (5.8) 28 (4.4) 567 (6.6) 96 (1.3)South Africa 21 (2.9) 471 (11.0) 52 (3.8) 457 (7.0) 27 (3.8) 464 (11.3) 87 (1.9)
Exhibit 7.4: Teacher Time Spent on Professional Development Relatedto Reading in the Past Two Years (Continued)
SOU
RCE:
IEA
’s Pr
ogre
ss in
Inte
rnat
iona
l Rea
ding
Lite
racy
Stu
dy –
PIR
LS 2
011
PIRLS2011INTERNATIONALRESULTSINREADING198 CHAPTER7
Exhibit 7.5: Teacher Career Satisfaction
Reported by TeachersStudents were scored according to their teachers’ degree of agreement with six statements on the Teacher Career Satisfaction scale. Students with Satisfied teachers had a score on the scale of at least 10.0, which corresponds to their teachers “agreeing a lot” with three of the six statements and “agreeing a little” with the other three, on average. Students with Less Than Satisfied teachers had a score no higher than 6.5, which corresponds to their teachers “disagreeing a little” with three of the six statements and “agreeing a little” with the other three, on average. All other students had Somewhat Satisfied teachers.
CountrySatisfied Somewhat Satisfied Less Than Satisfied Average
Scale ScorePercent of Students
Average Achievement
Percent of Students
Average Achievement
Percent of Students
Average Achievement
Colombia 90 (2.6) 449 (4.4) 10 (2.6) 440 (15.6) 0 (0.0) ~ ~ 11.6 (0.14)Indonesia 89 (2.5) 430 (4.4) 11 (2.5) 414 (11.2) 0 (0.0) ~ ~ 11.3 (0.13)Croatia 83 (2.7) 552 (2.1) 16 (2.5) 557 (4.1) 1 (0.9) ~ ~ 11.1 (0.10)Georgia 79 (3.2) 487 (3.7) 20 (3.1) 496 (6.6) 1 (0.7) ~ ~ 11.1 (0.13)Spain 69 (3.6) 519 (3.0) 27 (3.2) 502 (4.0) 4 (1.6) 487 (13.1) 10.8 (0.16)Ireland 69 (2.9) 551 (2.5) 29 (2.9) 555 (4.7) 2 (0.8) ~ ~ 10.8 (0.12)Denmark 69 (3.2) 556 (2.2) 28 (3.1) 549 (3.3) 3 (1.2) 556 (12.7) 10.7 (0.13)Israel 67 (4.2) 542 (4.6) 30 (3.9) 546 (7.0) 3 (1.6) 525 (23.3) 10.7 (0.19)Iran, Islamic Rep. of 66 (3.3) 462 (3.9) 31 (3.5) 448 (5.9) 3 (1.1) 448 (22.1) 10.3 (0.11)Malta 66 (0.1) 485 (1.8) 30 (0.1) 463 (2.6) 4 (0.0) 467 (9.2) 10.7 (0.01)Poland 64 (3.0) 525 (2.6) 36 (3.0) 527 (3.8) 1 (0.5) ~ ~ 10.5 (0.10)United Arab Emirates 63 (2.0) 446 (3.7) 31 (2.0) 425 (4.4) 5 (1.1) 429 (10.7) 10.4 (0.08)Azerbaijan 62 (3.5) 465 (4.2) 37 (3.4) 459 (5.4) 1 (0.5) ~ ~ 10.2 (0.10)Austria 60 (3.5) 530 (2.5) 35 (3.5) 527 (3.3) 5 (1.4) 521 (12.1) 10.4 (0.13)Russian Federation 60 (3.0) 570 (3.9) 36 (2.9) 566 (3.5) 4 (1.2) 565 (9.5) 10.2 (0.12)Romania 57 (4.2) 507 (5.9) 42 (4.3) 492 (6.9) 1 (0.6) ~ ~ 10.4 (0.14)Lithuania 56 (3.8) 532 (2.7) 41 (3.7) 524 (3.5) 3 (1.0) 517 (17.2) 10.1 (0.13)New Zealand 55 (3.3) 534 (3.5) 41 (3.0) 533 (4.0) 5 (1.2) 528 (7.7) 10.1 (0.14)Northern Ireland r 54 (4.3) 564 (4.0) 41 (4.5) 555 (4.2) 5 (1.9) 557 (12.6) 10.1 (0.18)Qatar 54 (5.0) 425 (5.8) 40 (4.7) 428 (8.5) 6 (1.7) 391 (15.1) 10.0 (0.18)Trinidad and Tobago 54 (4.3) 478 (5.7) 39 (4.2) 463 (6.6) 7 (1.7) 462 (12.0) 9.9 (0.17)Hungary 53 (3.7) 549 (3.5) 44 (3.6) 528 (5.1) 3 (0.8) 511 (9.4) 10.0 (0.13)Australia r 53 (3.9) 536 (3.3) 41 (3.8) 528 (4.8) 6 (1.5) 512 (9.4) 9.9 (0.15)Slovak Republic 53 (3.2) 532 (4.0) 41 (3.1) 535 (3.1) 6 (1.5) 559 (5.9) 9.7 (0.13)Oman 53 (3.0) 400 (3.6) 42 (2.9) 384 (4.2) 5 (1.3) 359 (10.8) 9.9 (0.12)England 52 (4.0) 550 (3.9) 42 (3.7) 550 (5.4) 6 (1.9) 557 (9.8) 9.9 (0.17)Canada 52 (2.3) 550 (2.1) 43 (2.0) 547 (3.2) 5 (1.0) 540 (4.4) 9.9 (0.09)Saudi Arabia 51 (3.6) 441 (5.4) 47 (3.7) 421 (7.6) 2 (1.0) ~ ~ 10.0 (0.14)Netherlands 51 (3.6) 546 (2.5) 42 (3.6) 546 (3.6) 7 (2.0) 549 (6.4) 9.9 (0.17)Germany 50 (3.2) 544 (3.2) 45 (3.2) 538 (3.0) 5 (1.6) 540 (10.1) 9.9 (0.13)Norway 49 (3.4) 509 (2.1) 43 (3.6) 505 (3.3) 7 (2.7) 508 (6.7) 9.7 (0.17)Bulgaria 49 (4.3) 535 (5.4) 47 (4.0) 529 (5.8) 4 (1.2) 518 (13.5) 9.8 (0.17)Czech Republic 48 (3.4) 552 (3.2) 45 (3.9) 539 (3.4) 7 (2.2) 538 (6.6) 9.6 (0.14)United States 47 (2.6) 559 (2.5) 47 (2.5) 554 (2.8) 6 (0.9) 554 (5.0) 9.6 (0.10)Slovenia 44 (3.0) 531 (2.6) 53 (3.2) 529 (3.0) 3 (0.9) 535 (11.1) 9.6 (0.08)Belgium (French) 43 (3.8) 509 (5.3) 46 (3.9) 507 (3.5) 11 (2.5) 507 (6.6) 9.5 (0.20)Finland 42 (3.1) 570 (2.7) 50 (3.5) 567 (2.5) 8 (2.2) 564 (4.7) 9.4 (0.13)Italy 39 (3.4) 545 (2.9) 56 (4.0) 541 (3.2) 5 (1.5) 531 (11.8) 9.5 (0.13)Hong Kong SAR 38 (3.9) 567 (4.0) 50 (3.3) 576 (3.5) 12 (3.4) 560 (9.4) 9.1 (0.17)Portugal 36 (3.8) 547 (4.2) 59 (4.2) 539 (3.2) 5 (1.8) 527 (8.5) 9.4 (0.18)Morocco 35 (4.1) 328 (7.4) 51 (4.3) 304 (5.9) 14 (3.0) 291 (12.3) 8.8 (0.20)Singapore 35 (2.9) 572 (6.0) 54 (2.8) 561 (5.0) 11 (1.8) 578 (9.0) 8.9 (0.11)Chinese Taipei 31 (3.9) 557 (2.8) 64 (4.0) 551 (2.5) 5 (0.9) 552 (10.3) 8.9 (0.11)Sweden 29 (3.6) 538 (3.8) 59 (3.8) 543 (2.9) 12 (2.8) 546 (8.2) 9.0 (0.16)France 25 (3.2) 520 (4.9) 59 (3.7) 521 (3.3) 17 (2.9) 518 (4.5) 8.6 (0.14)International Avg. 54 (0.5) 516 (0.6) 40 (0.5) 509 (0.8) 5 (0.2) 511 (1.9) - -
Centerpoint of scale set at 10.( ) Standard errors appear in parentheses. Because of rounding some results may appear inconsistent.A tilde (~) indicates insufficient data to report achievement.An “r” indicates data are available for at least 70% but less than 85% of the students. An “s” indicates data are available for at least 50% but less than 70% of the students
Exhibit 7.5: Teacher Career Satisfaction
SOU
RCE:
IEA
’s Pr
ogre
ss in
Inte
rnat
iona
l Rea
ding
Lite
racy
Stu
dy –
PIR
LS 2
011

TEACHERPREPARATION CHAPTER7 199
Exhibit 7.5: Teacher Career Satisfaction (Continued)
CountrySatisfied Somewhat Satisfied Less Than Satisfied Average
Scale ScorePercent of Students
Average Achievement
Percent of Students
Average Achievement
Percent of Students
Average Achievement
Sixth Grade Participants
Honduras 95 (1.8) 450 (5.3) 5 (1.8) 441 (21.7) 0 (0.0) ~ ~ 12.1 (0.12)Kuwait s 66 (5.0) 425 (9.1) 27 (5.0) 396 (14.5) 6 (1.6) 435 (19.1) 10.3 (0.19)Morocco r 39 (4.5) 428 (8.9) 48 (4.5) 419 (7.8) 13 (2.5) 412 (7.8) 9.0 (0.14)Botswana 24 (3.3) 425 (9.4) 64 (3.9) 419 (5.7) 12 (2.9) 419 (9.5) 8.6 (0.13)
Benchmarking Participants◊
Andalusia, Spain 74 (3.6) 514 (2.8) 23 (3.5) 523 (5.9) 3 (1.5) 493 (11.8) 11.1 (0.17)Abu Dhabi, UAE 70 (3.8) 429 (6.2) 26 (3.4) 411 (8.7) 4 (1.7) 423 (8.4) 10.7 (0.17)Maltese - Malta r 69 (0.1) 462 (1.7) 29 (0.1) 451 (3.2) 2 (0.0) ~ ~ 10.8 (0.01)Dubai, UAE 64 (2.7) 487 (4.4) 31 (2.9) 459 (6.6) 4 (1.5) 473 (15.6) 10.5 (0.12)Ontario, Canada 60 (4.1) 549 (3.4) 36 (4.1) 553 (4.2) 4 (1.6) 553 (9.2) 10.2 (0.15)Florida, US r 57 (5.5) 573 (5.9) 36 (5.5) 569 (7.0) 8 (2.5) 554 (10.3) 9.8 (0.20)Alberta, Canada 52 (3.6) 550 (4.2) 43 (3.5) 547 (4.2) 5 (1.7) 545 (12.1) 10.0 (0.15)Eng/Afr (5) - RSA 51 (5.0) 436 (13.8) 42 (5.3) 410 (10.7) 7 (2.2) 432 (14.0) 9.7 (0.16)Quebec, Canada 40 (3.6) 542 (3.7) 50 (4.1) 534 (3.2) 10 (2.8) 536 (4.7) 9.4 (0.15)◊ Republic of South Africa (RSA) tested 5th grade students receiving instruction in English (ENG) or Afrikaans (AFR).
CountrySatisfied Somewhat Satisfied Less Than Satisfied Average
Scale ScorePercent of Students
Average Achievement
Percent of Students
Average Achievement
Percent of Students
Average Achievement
Colombia 90 (2.6) 577 (3.4) 10 (2.6) 564 (15.6) 0 (0.0) ~ ~ 11.6 (0.14)South Africa 51 (3.4) 453 (6.1) 44 (3.5) 461 (7.6) 6 (1.6) 523 (21.9) 9.7 (0.11)Botswana 34 (4.2) 473 (8.9) 55 (4.5) 458 (4.4) 10 (2.8) 458 (10.6) 9.0 (0.16)
How much do you agree with the following statements?
Agree Agree Disagree Disagreea lot a little a little a lot
1) I am content with my profession as a teacher ------- A A A A2) I am satisfi ed with being a teacher at this school --- A A A A3) I had more enthusiasm when I began teaching
than I have now* -------------------------------------------- A A A A4) I do important work as a teacher ----------------------- A A A A5) I plan to continue as a teacher for as long as I can -- A A A A
6) I am frustrated as a teacher* ----------------------------- A A A A
* Reverse coded
P3r01162
SomewhatSatisfi ed
Less Than Satisfi edSatisfi ed
10.0 6.5
Exhibit 7.5: Teacher Career Satisfaction (Continued)
SOU
RCE:
IEA
’s Pr
ogre
ss in
Inte
rnat
iona
l Rea
ding
Lite
racy
Stu
dy –
PIR
LS 2
011
