chapter 8 isolation and characterization of...
TRANSCRIPT
146
CHAPTER 8
ISOLATION AND CHARACTERIZATION OF
PHYTOCONSTITUENTS BY COLUMN
CHROMATOGRAPHY
8.1 INTRODUCTION
Column chromatography is an isolation technique in which the
phytoconstituents are being eluted by adsorption. The principle involved in
this separation of constituents is adsorption at the interface between solid and
liquid. The component must have various degree of affinity towards adsorbent
and also reversible interaction to achieve successful separation. No two
compounds are alike in the above aspect. Low affinity compounds will elute
first. The columns of different sizes were used for the present studies.
Since the methanolic extract was found to possess significant
pharmacological activity when compared to other extracts an attempt was
made to fractionate the methanol extract by column chromatography.
The elution was done by using solvents of different polarity like n-
hexane, ethyl acetate and methanol.
8.2 MATERIALS AND METHODS
Type of extract : Methanol extract
Method : Dry packing method
Packing material : Silica gel G 70 -325

147
Procedure
The methanol extract was subjected to Silica gel column
chromatography for the isolation of the phytoconstituents.
An appropriate column sized 5cm diameter and 50cm length was
used. It was washed with water and rinsed with acetone and then dried
completely. Little of pure cotton was placed at the bottom of column with the
help of a big glass rod. Solvent hexane was poured into the column upto ¾th
level. Methanol extract was mixed with equal amount of graded silica gel
until it became free flowing powder. When it reached a defined state it was
slowly poured into the column containing hexane solvent with slight
movement of stirring by glass rod to avoid clogging. Little cotton was placed
on top of silica gel- extract mixture pack to get neat column pack. The knob at
the bottom was slowly opened to release the solvent. The elution was done
using hexane, ethyl acetate and methanol in different ratios like Hexane
(100%- broad fraction 1), Hexane: Ethyl acetate (50:50- broad fraction 2),
Ethyl acetate (100%- broad fraction 3), Ethyl acetate: Methanol (50:50 –
broad fraction 4) and methanol (100%- broad fraction 5).
All the five broad fractions were collected separately and subjected
to TLC. The solvents were evaporated by rotary vacuum evaporator. Since
there was no yield in the Hexane fraction (100%) and very less yield in broad
fractions 2 and 3, fractions 4, 5 were selected and again subjected to sub
column fractionation.

148
Isolation of Compound I and II
The 5th fraction (methanol 100%) on concentrating on a rotary
vacuum evaporator yielded light yellow sedimentation. It was then filtered
and the light yellow powder was dried. The filtrate was concentrated and a
brown semisolid was obtained. Both the fractions were subjected to thin layer
chromatographic studies. The yellow coloured powder was named as
compound I and the brown semisolid was named as compound II.
Isolation of compound III
The broad fraction 4 (Ethyl acetate: Methanol 50:50) was again
subjected to sub column fractionation using different ratios of Iso propyl
alcohol(IPA) and ethyl acetate. The fractions were collected and subjected to
thin layer chromatographic studies. The similar fractions were mixed together
and evaporated using rotary vacuum evaporator. The fractions 10 -60 (5%
IPA and 95% Ethyl acetate) on evaporation yielded a light brown solid which
was named as compound III.
The pure compounds obtained were then subjected to spectral
analysis for the determination of the structure of the compound.
8.3 TLC
As soon as the fractions were eluted, it was analysed by using ready
made TLC plate with suitable mobile solvent according to the polarity of
elute. The developed chromatogram was observed under UV and also
derivatized with detecting agent.
8.4 SPECTRAL ANALYSIS[128-130]
The isolated compounds were taken to determine the structure by
instrumental spectral analysis such as

149
IR spectroscopy
NMR - 1H and 13 C
Mass spectroscopy
8.4.1 IR
IR spectrum is considered as vibrational-rotational spectra. KBr
pellet technique is used for solid compound, for liquid compound Nujol mull
method is followed. It is very helpful record which would give information
about functional group present in the organic compounds. Mechanism of bond
stretching and bending is happened when electromagnetic radiation ranging
from 500cm 1 to 4000 cm 1 passed through sample. Instrument used was
ABD BOWMEN Spectrometer.
8.4.2 NMR
Nuclear magnetic spectrum is the most powerful spectral technique
used to detect chemical structure of the molecules. The differences in the
chemical environment around the different nuclei are exploited to obtain this
information and is expressed in terms of chemical shifts in parts per million.
When sample absorbs radiation at different radio frequency region which
causes to excite type of proton or certain nuclei contained in the sample
against magnetic field.
The most commonly used NMR technique are the 1H and 13C. The
instrument used was for detection is PROBHD Nuclear Magnetic Resonance
spectrometer.
1H NMR
Most commonly used NMR is Proton NMR, because of the
sensitivity and wide range of characteristic information. Range of chemical

150
shift ( ) from 0 – 14 ppm. Chemical shift of the test unknown compound was
compared with TMS protons which are attributed at 0 ppm. But, the shift
extends for the organic compound range 0 – 14 for the component.
13C – NMR
It is new technique but natural abundance is very low 1.1%. So, this
further reduces the sensitivity of the absorption. The range of chemical shift
) from 0 -180 ppm with use of TMS internal reference. An advantage is one
can directly observe the functional group contained carbon atom.
8.4.3 Mass Spectroscopy
It is an accurate method to determine the molecular mass of the
compound. The main advantage is very small amount of sample is required
for analysis than any other spectral methods. The mass spectroscopy uses the
electric and magnetic fields to produce electrically charged ions of chemical
substance under analysis.
Instrument used to determine the spectrum was JOEL Gcmate Mass
spectrometer. The record spectrum tells about the mass, relative abundance of
the molecular ions and positively charged fragments formed by electronic
bombardment. Sample was dissolved in CDCl3 and injected through direct
probe inlet. Electronic impact ionization method was used.
151
8.5 RESULTS
8.5.1 Column Chromatography
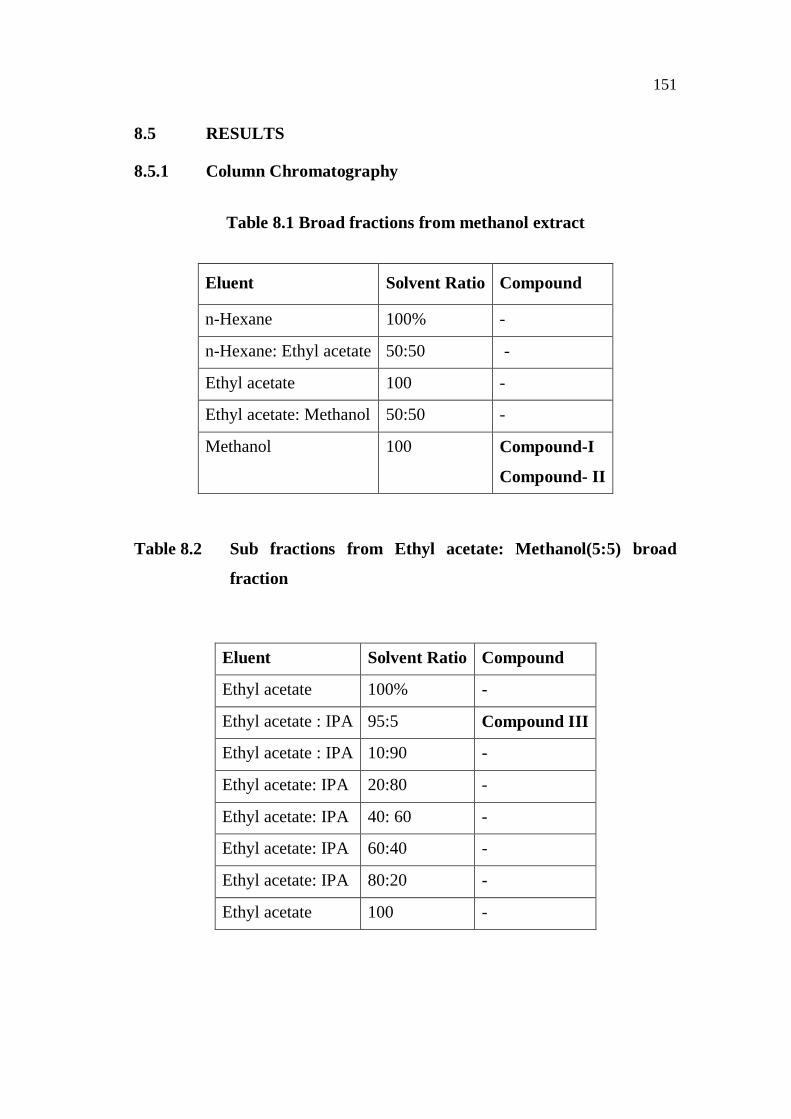
Table 8.1 Broad fractions from methanol extract
Eluent Solvent Ratio Compound
n-Hexane 100% -
n-Hexane: Ethyl acetate 50:50 -
Ethyl acetate 100 -
Ethyl acetate: Methanol 50:50 -
Methanol 100 Compound-I
Compound- II
Table 8.2 Sub fractions from Ethyl acetate: Methanol(5:5) broad
fraction
Eluent Solvent Ratio Compound
Ethyl acetate 100% -
Ethyl acetate : IPA 95:5 Compound III
Ethyl acetate : IPA 10:90 -
Ethyl acetate: IPA 20:80 -
Ethyl acetate: IPA 40: 60 -
Ethyl acetate: IPA 60:40 -
Ethyl acetate: IPA 80:20 -
Ethyl acetate 100 -

152
SPECTRAL ANALYSIS
The compounds (C-I, II and III) obtained with the methanol extract
have identified and spectral data’s were depicted in the Figures 8.1 to 8.12
8.5.2 Characterization of Compound – I
Light yellow solid (1.5gm) was obtained which is soluble in
methanol and water, the melting point was found to be 190-1950C. The
isolated compound answered the test for sugars. The various spectral data’s
obtained were given in Figures 8.1, 8.2, 8.3 and 8.4.
Ir cm-1: Nujol mull
Wave Numbers (cm-1) Type
3391 OH
2922 CH3, CH2, CH
1695 C=C
1415 (C-O)
1246 (C-O)
1196 (C-O)
1052 (C-O)
897 (CH)
732 (CH)

153
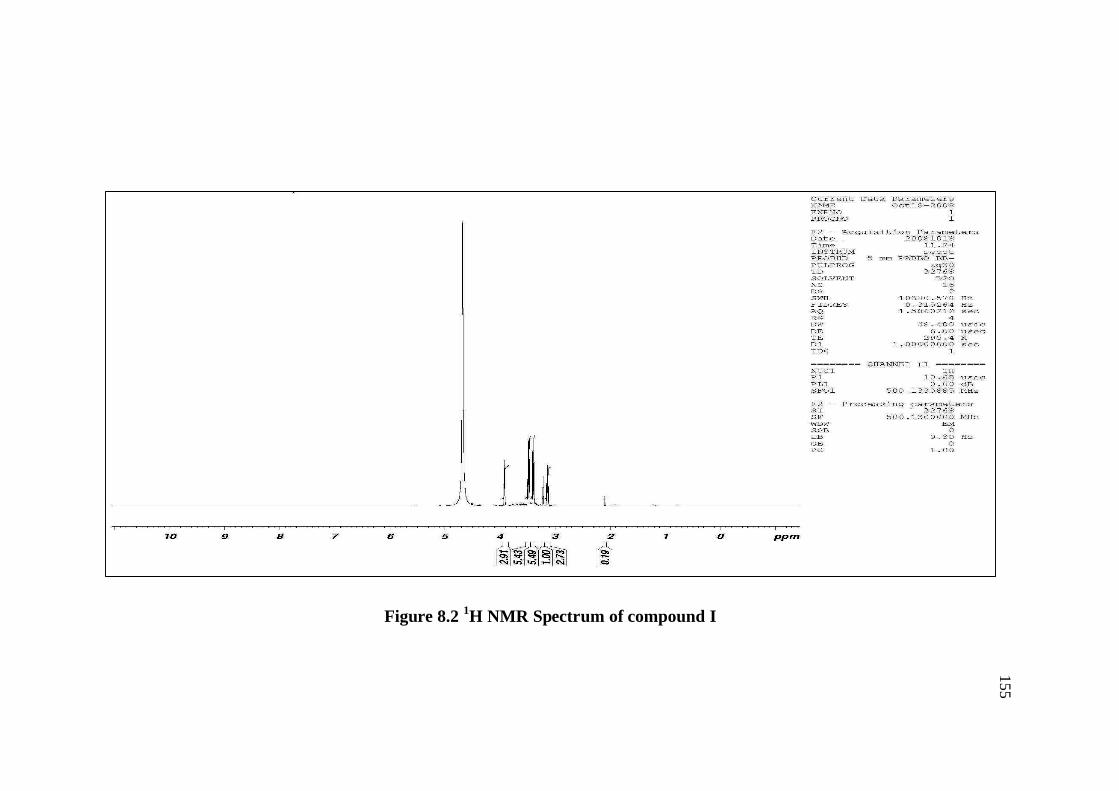
Bruker NMR: 500MHz (solvent: D2O, ,ppm) , ppm: Parts per million
Atom Carbon, , ppm Hydrogen, , ppm
1 165.47 -
2 75.89 3.40 (d, 1H, J = 2.50 Hz)
3 95.85 3.92 (d, 1H, J = 2.50 Hz)
4 74.29 3.13 (t, 1H, J = 9.00 Hz)
5 71.08 3.48 (t, 1H, J = 9.50 Hz)
6 72.35 3.38 (m, 1H)
Properties
Name Glucuronic acid
Molecular formula C6H10O7
Molecular weight 194
Melting point 190-195 °C
Mass (m/z) 194[M+1]
Colour Yellow
Nature Solid
Solubility Soluble in methanol and water
TLC studies Methanol: Ethyl acetate:water:aceticacid(2:6:1:1)
Structure
O OH
OH
OH
HO
O
OH
12 3
4
56

154
Figure 8.1 IR Spectrum of compound I
155
Figure 8.2 1H NMR Spectrum of compound I

156
Figure 8.3 13C NMR Spectrum of compound I
157
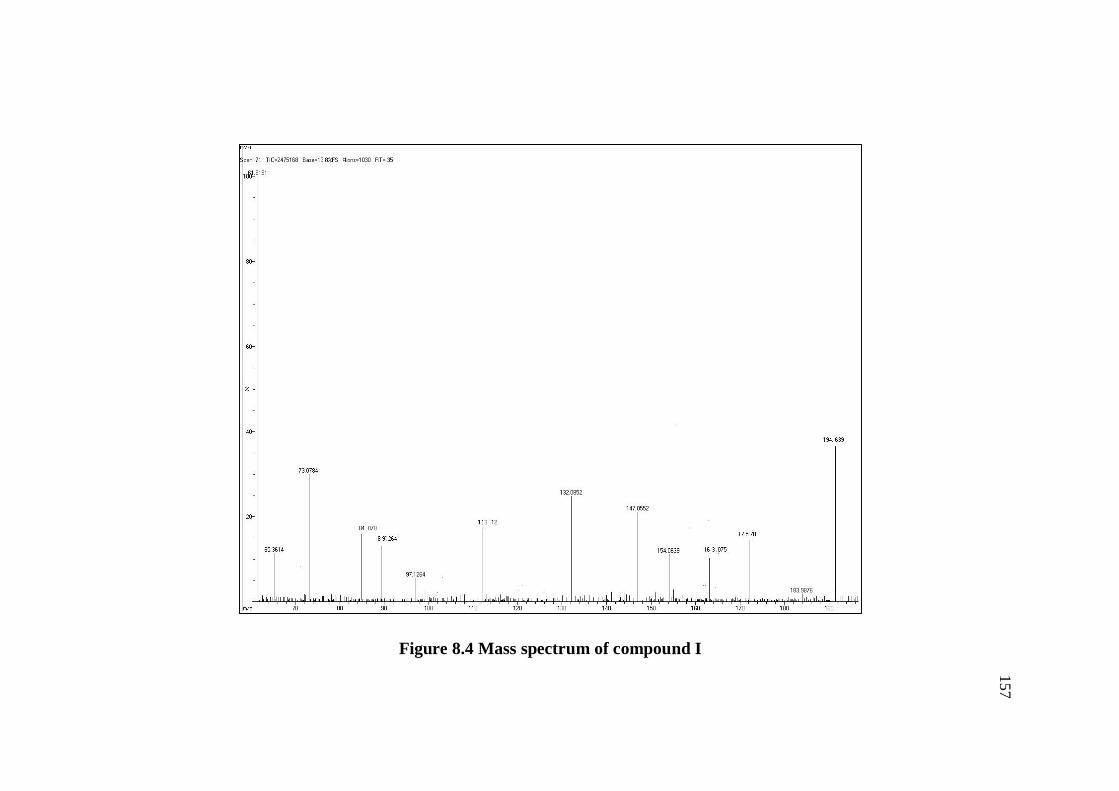
Figure 8.4 Mass spectrum of compound I

158
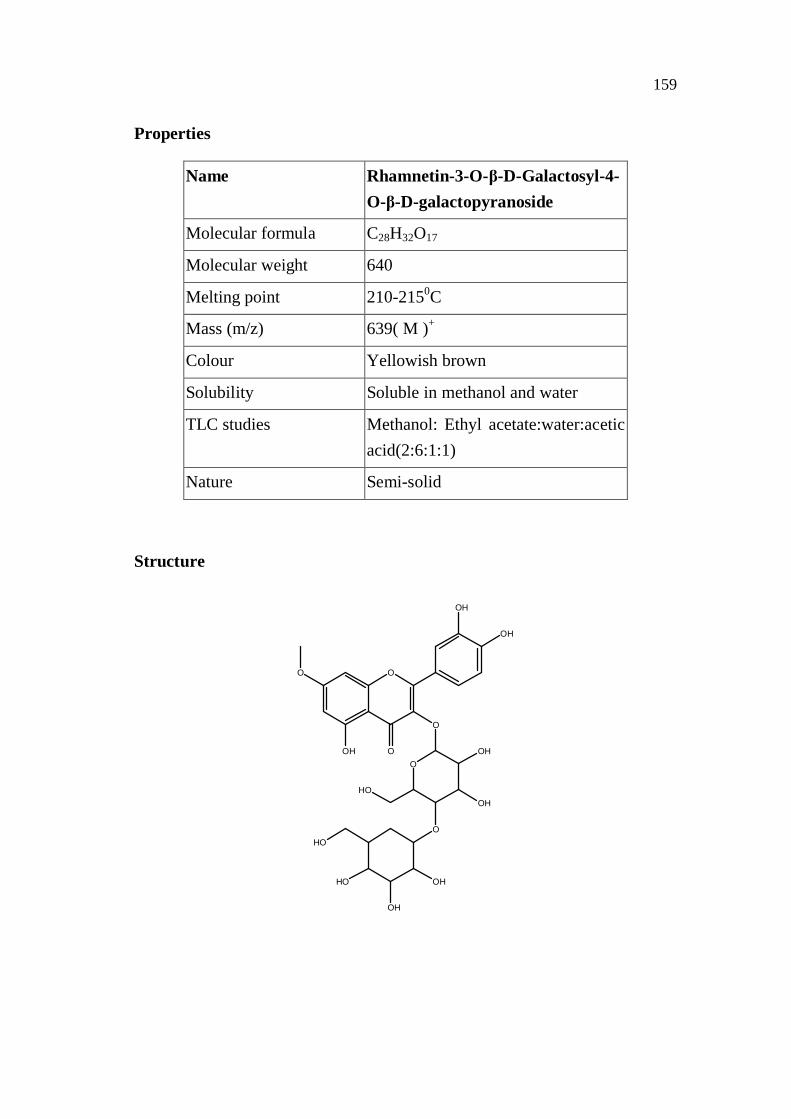
8.5.3 Characterization of Compound – II
Yellowish brown semisolid mass (2gm) was obtained which is
soluble in methanol and water, the melting point was found to be 190-1950C.
The isolated compound answered the test for flavanoids. The various spectral
data’s obtained were given in the Figures 8.5, 8.6, 8.7 and 8.8.
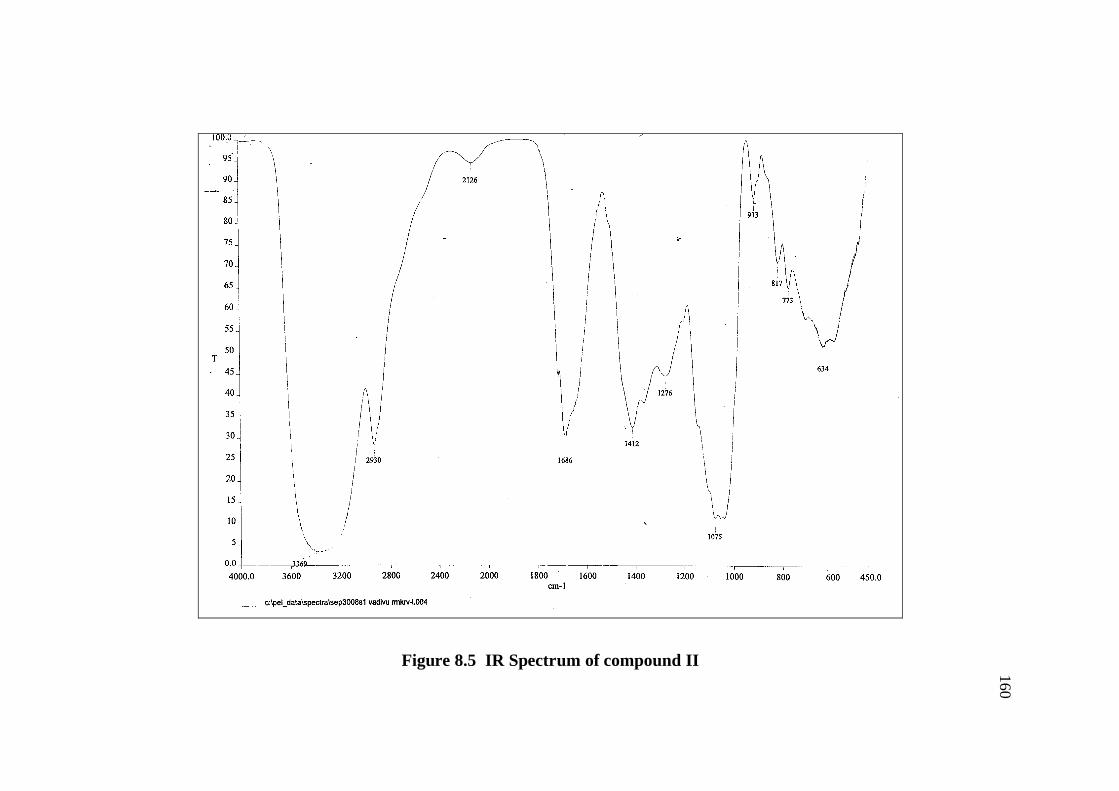
Ir cm-1: Nujol mull
WAVE NUMBERS (cm-1) TYPE3369 OH2930 CH3, CH2, CH1686 C=C1412 (C-O)1276 (C-O)1075 (C-O)913 (C-O)634 (CH)
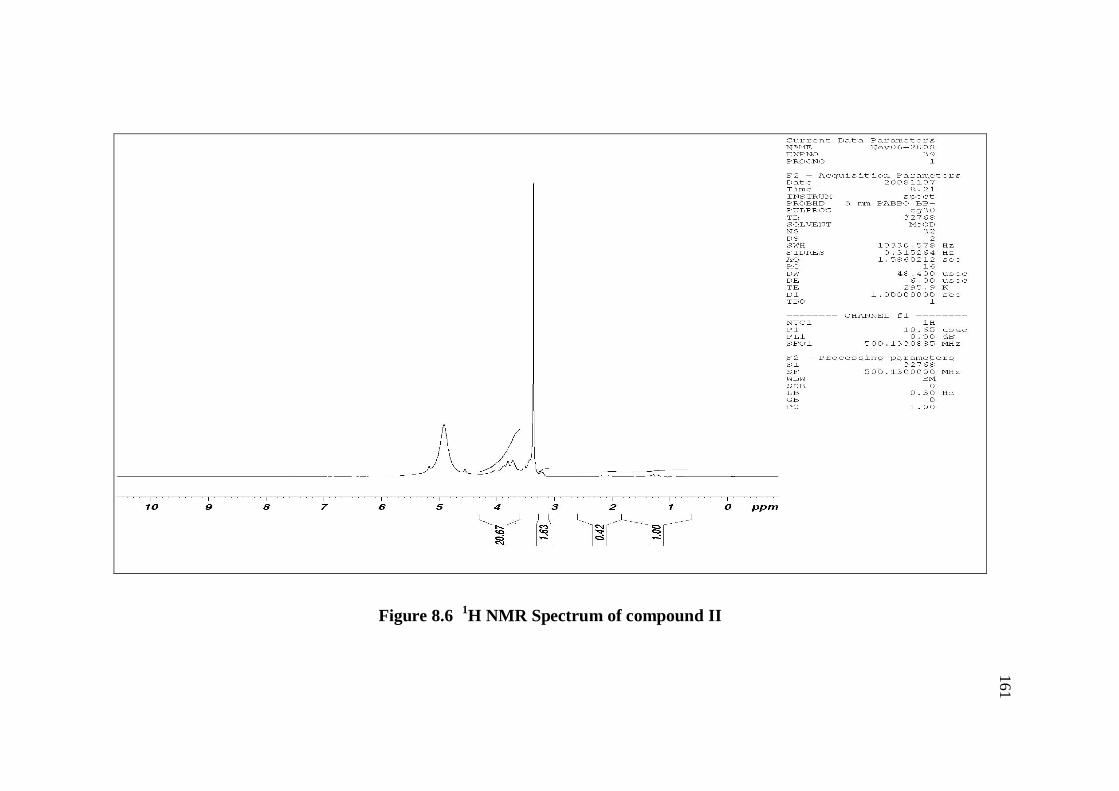
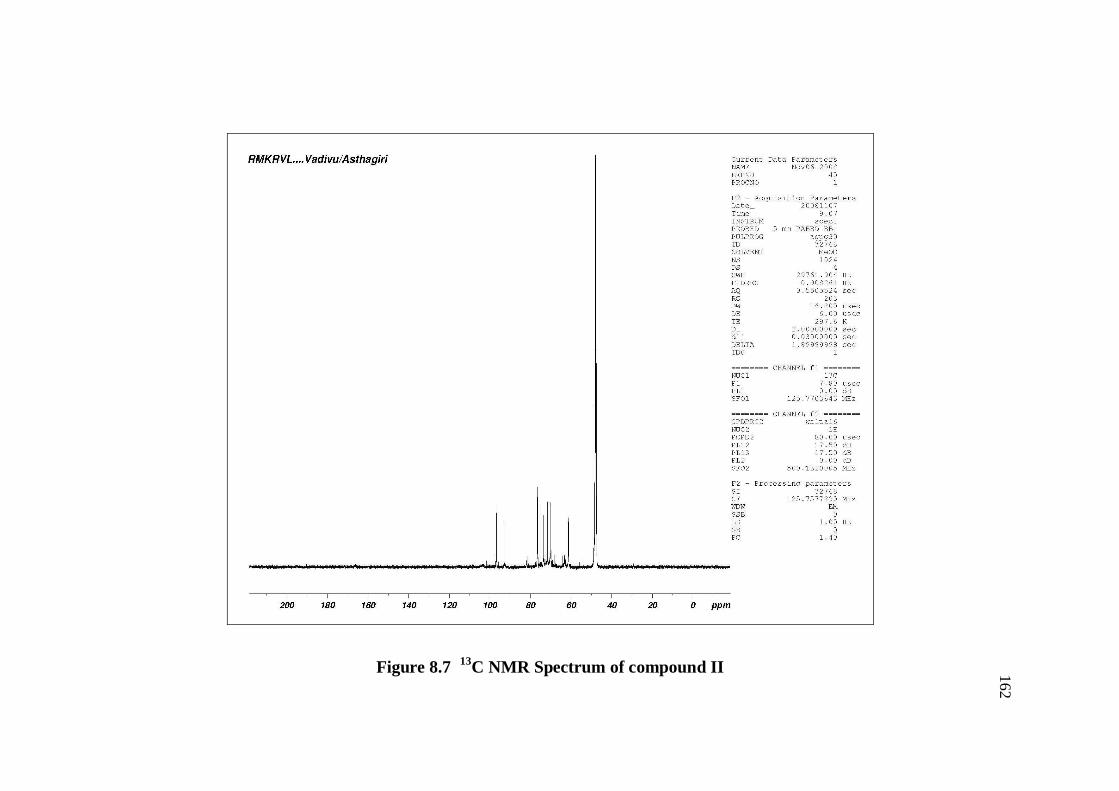
Bruker NMR (500MHz, ,ppm in values):ppm:parts per million
Atom Carbon, , ppm Hydrogen, , ppm1 73.41 3.36 – 4.04 (m, 1H)2 73.62 3.36 – 4.04 (m, 1H)3 101.78 4.91 – 5.17 (m, 1H)4 64.36 3.36 – 4.04 (m, 2H)5 75.25 3.36 – 4.04 (m, 1H)6 71.82 3.36 – 4.04 (m, 1H)7 72.40 3.36 – 4.04 (m, 1H)8 76.46 3.36 – 4.04 (m, 1H)9 97.98 4.91 – 5.17 (m, 1H)10 71.62 3.36 – 4.04 (m, 1H)11 76.52 3.36 – 4.04 (m, 1H)12 61.35 3.36 – 4.04 (m, 2H)
159
Properties
Name Rhamnetin-3-O- -D-Galactosyl-4-O- -D-galactopyranoside
Molecular formula C28H32O17
Molecular weight 640
Melting point 210-2150C
Mass (m/z) 639( M )+
Colour Yellowish brown
Solubility Soluble in methanol and water
TLC studies Methanol: Ethyl acetate:water:aceticacid(2:6:1:1)
Nature Semi-solid
Structure
O
O
O
O
OH
OH
HO
HO
HO
OH
OH
O
OH O
OH
OH
160
Figure 8.5 IR Spectrum of compound II
161
Figure 8.6 1H NMR Spectrum of compound II
162
Figure 8.7 13C NMR Spectrum of compound II
163
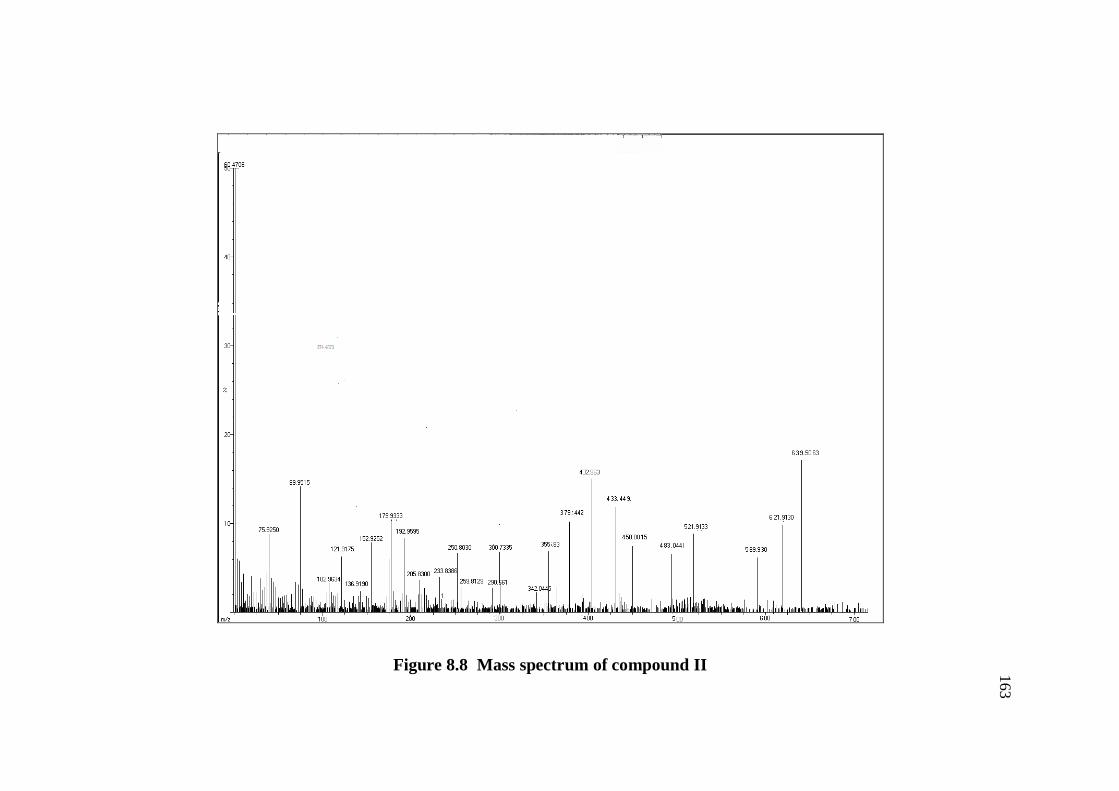
Figure 8.8 Mass spectrum of compound II

164
8.5.4 Characterization of Compound – III
The compound III was obtained as brown solid and the melting
point was found to be 225-2280C. The isolated compound answered the test
for triterpenoids. The various spectral data’s obtained were given in the
Figures 8.9, 8.10, 8.11 and 8.12.
Ir cm-1: Nujol mull
WAVE NUMBERS(cm-1) TYPE
3392 OH
2926 CH3, CH2, CH
1726 -C=O
1646 (C=C)
1367 (C-O)
1076 (C-O)
1035 (-CH)
824 (C-O)
775 (C-H)

165
Bruker NMR (500MHz, , ppm in values)
Atom Carbon, , ppm Hydrogen, , ppm
1 33.77 1.18 – 1.38
2 25.52 1.18 – 1.38
3 82.94 3.20
4 39.98 -
5 56.81 1.18 – 1.38
6 20.83 1.18 – 1.38
7 34.87 1.18 – 1.38
8 40.52 1.18 – 1.38
9 47.84 1.18 – 1.38
10 37.70 1.18 – 1.38
11 25.35 2.01
12 123.60 5.16
13 144.64 -
14 39.98 -
15 29.91 1.18 – 1.38
16 25.04 1.18 – 1.38
17 56.81 -
18 32.87 -
19 42.74 1.18 – 1.38
20 28.44 -
21 42.40 1.18 – 1.38
22 26.78 1.18 – 1.38
23 25.20 1.18 – 1.38
24 25.20 1.18 – 1.38
25 21.61 1.18 – 1.38
26 21.96 1.18 – 1.38
27 16.94 1.18 – 1.38
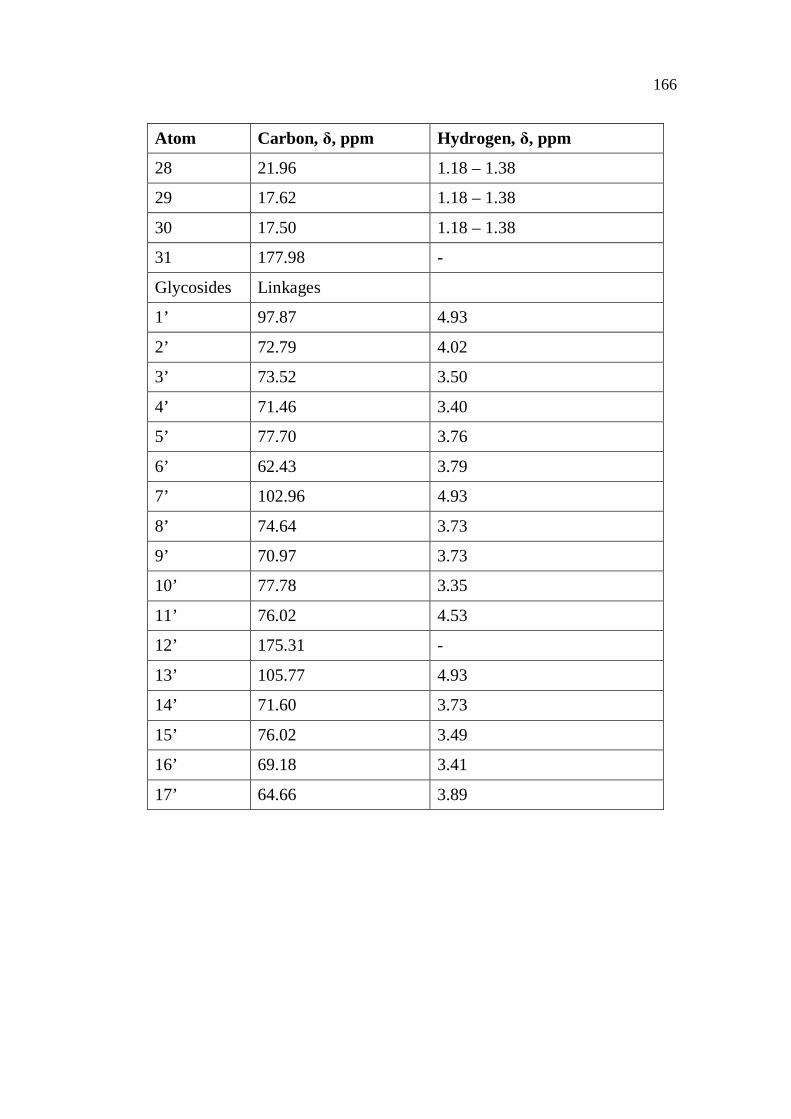
166
Atom Carbon, , ppm Hydrogen, , ppm
28 21.96 1.18 – 1.38
29 17.62 1.18 – 1.38
30 17.50 1.18 – 1.38
31 177.98 -
Glycosides Linkages
1’ 97.87 4.93
2’ 72.79 4.02
3’ 73.52 3.50
4’ 71.46 3.40
5’ 77.70 3.76
6’ 62.43 3.79
7’ 102.96 4.93
8’ 74.64 3.73
9’ 70.97 3.73
10’ 77.78 3.35
11’ 76.02 4.53
12’ 175.31 -
13’ 105.77 4.93
14’ 71.60 3.73
15’ 76.02 3.49
16’ 69.18 3.41
17’ 64.66 3.89

167
Properties
Name 3-O-[ -l-Arabinopyranosyl-(1,4)-O- -D-glucuronopyranosyl)]-31-O-( -D-glucopyranosyl) oleanolic acid
Molecular formula C48H68O18
Molecular weight 932
Melting point 225-228°C
Mass (m/z) 825 ( M )+
Colour Brown
Nature Sticky mass
Solubility Soluble in water
Structure
OO
O
HO
OOH
OH
O
O
O
HOOH
OH
OH
O
OH
OH
OH
1
2
3 45
67
8
9
10
1112
13
14
1516
17
18
1920 21
22
23 24
25
26
2728
29 30
31
1' 2'
3'
4'5'
6'
7'
8'
9'10 '
11'12'
13'
14'
15 '16 '17'

168
Figure 8.9 IR Spectrum of compound III

169
Figure 8.10 1H NMR Spectrum of compound III
170
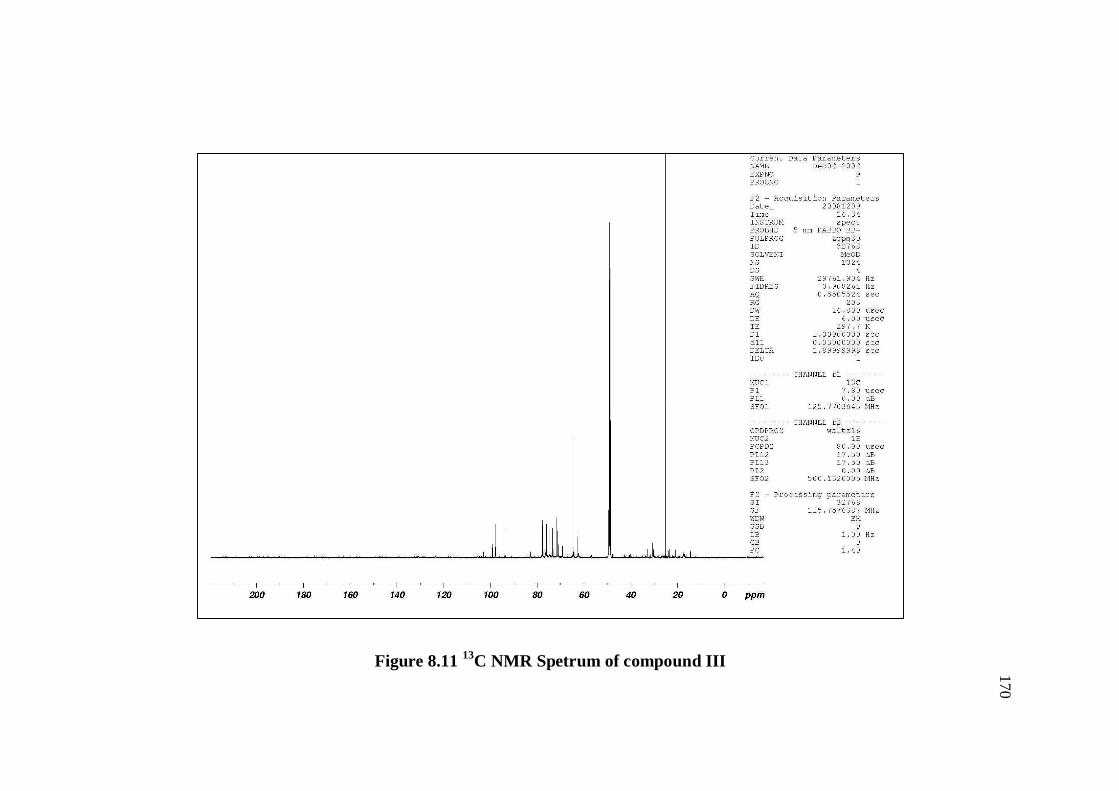
Figure 8.11 13C NMR Spetrum of compound III
171
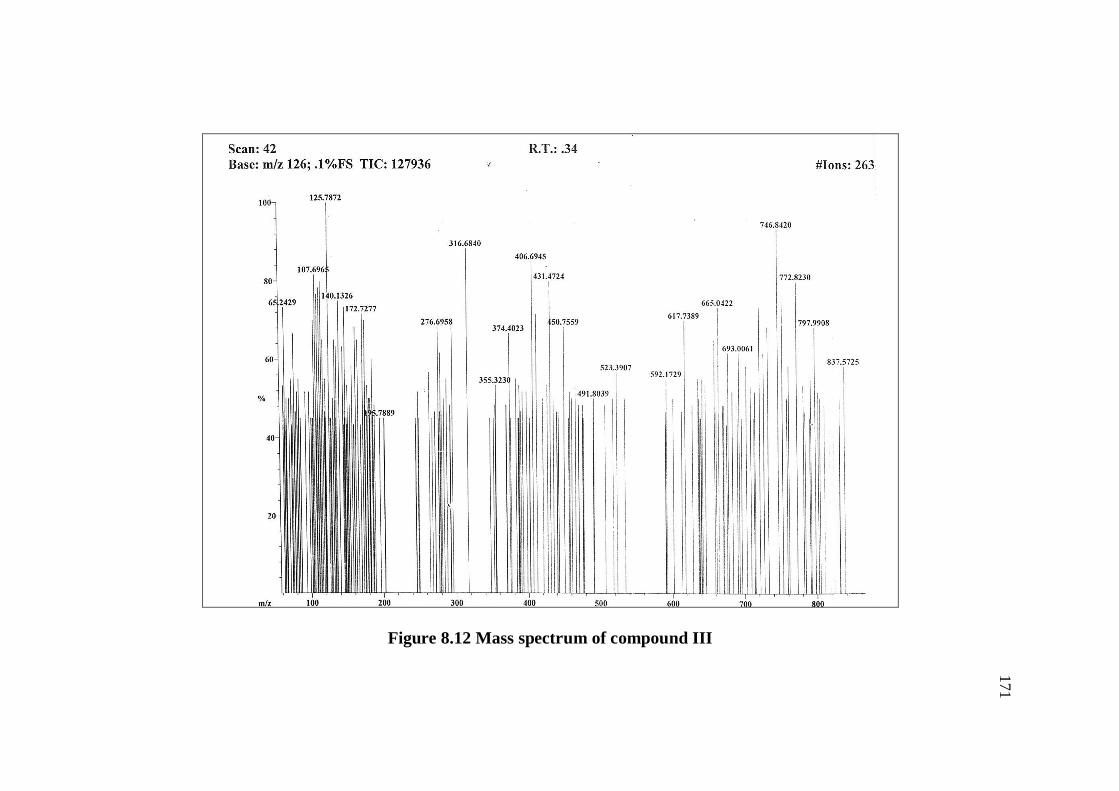
Figure 8.12 Mass spectrum of compound III

172
8.6 DISCUSSION
Methanolic extract was found to possess significant pharmacological
activity when compared to other extracts it was subjected to column
chromatography for the isolation of phytoconstituents. Three compounds
were isolated from the extract and their structures were identified by spectral
studies.
The structure of the isolated compound I was analysed by
spectroscopic techniques like IR, NMR and mass spectroscopy. The melting
point of the compound was found to be 190-195 0C and it answered the test
for sugars. It had IR absorptions at 3391(hydroxyl), 2922 (C-H stretching of
alkanes), 1686 (carbonyl group of acid), 1415, 1246, 1196 and 1052 (C-O
vibrations of alcohols).
The 1H NMR spectrum showed the presence of 5 protons on
saturated carbon atoms. The value at 3.40 (d, 1H, J = 2.50Hz) and 3,92(d, 1H, J
= 2.50Hz) showed the doublet protons . The other two protons were present as
triplet with the value of 3.13(d, 1H, J = 9.00 Hz) and 3.48 (d, 1H, J = 2.50Hz).
The value at 3.38 (M,1H) showed the presence of multiplet.
The 13C NMR spectrum showed peaks at 75.89, 95.85, 74.29,
71.08 and 72.35 corresponding to carbon connected to oxygen linkage. The
peak at 165.47 corresponds to the carbonyl carbon. Mass spectrum of the
compound showed the molecular ion peak at m/z 194. From the spectral
studies the possible structure of compound I may be glucoronic acid.
The structure of the isolated compound II was analysed by
spectroscopic techniques and the melting point of the compound was found to
be 210-2150C. It answered the test for flavanoids. It had IR absorptions at
3369(hydroxyl), 2930 (C-H stretching of alkanes), 1412,1276, 1075 and 913
(C-O vibrations of alcohols) and 634 (C-H bending vibration of alkanes.

173
The 1H NMR spectrum showed the presence of 14 protons on
saturated carbon atoms. The protons are multiplet with the value of 3.36- 4.04
(M,H) in up field and the value at 4.19- 5.17 (M,H) showed the protons in the
down field. The peak appeared in the range between 3.36-4.04 ppm corresponds
to carbon connected to oxygen linkage. 1H and 13C NMR spectrum of the
compound showed the peaks at 73.41, 73.62, 75.25, 71.82, 72.40, 76.46,
71.62 and 76.52 indicated the carbon connected to oxygen linkage.
Mass spectrum of the compound showed the molecular ion peak at
m/z 639. From the spectral studies the possible structure of compound II may
be Rhamnetin-3-O- -D-Galactosyl-4- O- -D-galactopyranoside.
The melting point of the compound III was found to be 225-228 0C
and it answered the test for triterpenoids. It had IR absorptions at
3392(hydroxyl), 2926 (C-H stretching of alkanes), 1726 (C=O stretching
vibration of ketones), 1646 (C=C stretching vibration of alkanes), 1367, 1076
(C-O stretching vibraton of alcohols), 1035 (C-H bending vibration of
alkenes), 824(C-O bending vibration of alcohols) and 725 (C-H bending
vibration of alkanes).
The 1H NMR spectrum showed the presence of 50 protons in which
8 methyl protons were present with value of 1.18- 1.38. the 1H NMR signal
at 3.20 was found to be secondary hydroxyl group. It showed the presence
of olefinic proton with 5.16ppm.
13C NMR spectrum showed peaks at 82.94, 171.98 corresponds to
carbon connected to oxygen. The peak at 177.98 showed the presence of
carbonyl carbon and at 123.60 , 144.63 showed the presence of double bond.
Mass spectrum of the compound III showed the molecular ion peak
at m/z 825. From the spectral studies the possible structure of compound II
may be oleanolic acid derivative.