chapter eight activity-based costing: a tool to aid … eight activity-based costing: a tool to aid...
TRANSCRIPT
Chapter Eight
Activity-BasedCosting: A Tool to AidDecision Making
Business FocusDiamond Courier was startedby Claudia Post shortly afterhaving been fired as a salesper-son for another courier service.Her downtown bicycle messen-ger service grew quickly—reaching $1 million in saleswithin 17 months. Seeingopportunities to sell other serv-ices, she added truck deliveries,airfreight services, a parts-distribution service, and a legalservice that served subpoenasand prepared court filings.Within three years of begin-ning operations, DiamondCourier had $3.1 million inannual sales and employedabout 40 bike messengers and25 back-office staffers in addi-tion to providing work forabout 50 independent drivers.
The company had one prob-lem—it was losing money. Post
had to sell her jewellery inorder to meet the payroll andpay bills. With the help of anadvisor, Post took a seriouslook at the profitability of eachof the company’s lines of busi-ness. Post had assumed that ifshe charged a competitive rate,kept clients happy, andincreased sales, she wouldmake money. However, an ABCanalysis of her overhead costsindicated that the average costof a bike delivery—includingoverhead—was $9.24, but shewas charging only $4.69. “Thebicycle division, which shethought of as Diamond’s corebusiness, generated just 10%of total sales and barely cov-ered its own direct-labour andinsurance costs. Worse, thedivision created more logisticaland customer-service night-
mares than any other singlebusiness, thereby generating adisproportionate share of over-head costs.” Since smaller,focused competitors werecharging as little as $3 perdelivery, there was little alter-native except to drop the bicy-cle messenger business andconcentrate on the other, moreprofitable, lines of business. Asimilar analysis led her to alsoclose the airfreight and parts-distribution businesses. At lastreport, Diamond Courier hasregained a good chunk ofthe lost sales of $400,000from closing these lines ofbusiness and is now operatingprofitably.
Source: Susan Greco, “Are WeMaking Money Yet?” Inc., July 1996,pp. 52–61.
34944ch08.qxd 9/12/00 10:06 AM Page 336
The cost accounting systems described in Chapters2, 3, and 4 were designed primarily to provide unit product costs for external report-ing purposes. Variable costing, which was described in Chapter 7, is intended to providemanagers with product cost and other information for decisions that do not affect fixedcosts and capacity. Both absorption costing and variable costing focus on costing prod-ucts or services that are sold. Cost behaviour resulting from these costing methods isbased on sales or production volumes or bases such as direct labour- and machines-hours that in turn are based on sales or production volumes. Recently, there has beeninterest in activity-based costing. Activity-based costing (ABC)is a costing methodthat is designed to provide managers with cost information for strategic and other deci-sions that potentially affect capacity and therefore “fixed” costs. Activity-based costingis also used as an element of activity-based management, an approach to managementthat focuses on activities. The focus of ABC is on activities that make up products orservices rather than the products or services themselves. Thus here the base for costbehaviour is activity rather than sales or production volume. Activities serve as thebase for allocating costs. Once the costs are allocated to activities, it may be desirableto allocate the activity cost to products or services. This allocation results in moreelaborate and accurate costs than the use of machine-hours or direct labour costs as thebase for allocating overhead to products or services.
In practice, there are many “flavours” of activity-based costing. Consultantsemphasize different aspects of activity-based costing, and companies interpret activity-based costing differently. Since so much variation occurs in practice, we focus ourattention in this chapter on what we consider to be “the best practice”—those tech-niques that provide managers with the most useful information for making strategicdecisions. We will assume that the ABC system is used as a supplement to, rather thanas a replacement for, the company’s formal cost accounting system. The cost account-ing methods described in Chapters 2, 3, and 4 would continue to be used to determineproduct costs for external financial reports. Activity-based costing would be used todetermine product and other costs for special management reports. To keep the dis-cussion simple, we gloss over some of the relatively unimportant details that can add
1 Explain the major differencesbetween activity-based cost-ing and a traditional costingsystem.
2 Distinguish between unit-level, batch-level, product-level,customer-level, and organiza-tion-sustaining activities.
3 Assign costs to cost poolsusing a first-stage allocation.
4 Compute activity rates forcost pools and explain how theycan be used to target processimprovements.
5 Assign costs to a costobject using a second-stageallocation.
6 Prepare a report showingactivity-based costing productmargins from an activity view.
7 Prepare an action analysisreport using activity-basedcosting data and interpret thereport.
8 Use the simplified approachto compute activity-based costsand margins.
9 (Appendix 8A) Record theflow of costs in an activity-basedcosting system.
Learning Objectives
After studying Chapter 8, you should be able to:
Activity-based costing(ABC) A costingmethod based on activitiesthat is designed to providemanagers with cost infor-mation for strategic andother decisions that poten-tially affect capacity andtherefore fixed costs.
34944ch08.qxd 9/12/00 10:06 AM Page 337
enormously to the complexity of activity-based costing. Even so, you are likely to findthis chapter especially challenging.
In the traditional cost accounting systems described in Chapters 2, 3, and 4, theobjective is to properly value inventories and cost of goods sold for external financialreports. In activity-based costing, the objective is to understand overhead and theprofitability of products and customers. As a consequence of these differences inobjectives, “best practice” activity-based costing differs in a number of ways from tra-ditional cost accounting.
In activity-based costing:
1. Nonmanufacturing as well as manufacturing costs may be assigned to products.2. Some manufacturing costs may be excluded from product costs.3. There are a number of overhead cost pools, each of which is allocated to
products and other costing objects using its own unique measure of activity.4. The allocation bases often differ from those used in traditional costing systems.5. The overhead rates, or activity rates, may be based on the level of activity at
capacity rather than on the budgeted level of activity.
As we will see later in the chapter, these differences from traditional cost accountingsystems can have dramatic impacts on the apparent costs of products and the prof-itability of products and customers. But first, we will briefly discuss the reasons forthese departures from traditional cost accounting practices.
How Costs Are Treated Under Activity-Based Costing
Nonmanufacturing Costs and Activity-Based CostingIn traditional cost accounting, only manufacturing costs are assigned to products.Selling, general, and administrative expenses are treated as period expenses and arenot assigned to products. However, many of these nonmanufacturing costs are alsopart of the costs of producing, selling, distributing, and servicing products. For exam-ple, commissions paid to salespersons, shipping costs, and warranty repair costs can beeasily traced to individual products. To determine the profitability of products and ser-vices, such nonmanufacturing costs are assigned to products in activity-based costing.
Manufacturing Costs and Activity-Based CostingIn traditional cost accounting, all manufacturing costs are assigned to products—even manufacturing costs that are not caused by the products. For example, a portion ofthe factory security guard’s wages would be allocated to each product even though theguard’s wages are totally unaffected by which products are made or not made during aperiod. In activity-based costing, a cost is assigned to a product only if there is goodreason to believe that the cost would be affected by decisions concerning the product.
PLANTWIDE OVERHEAD RATE Our discussion in Chapter 3 assumed that asingle overhead rate, called a plantwide overhead rate,was being used throughout anentire factory and that the allocation base was direct labour-hours or machine-hours.This simple approach to overhead assignment can result in distorted unit product costswhen it is used for decision-making purposes.
When cost systems were developed in the 1800s, direct labour was a larger com-ponent of product costs than it is today. Data relating to direct labour were readilyavailable and convenient to use, and managers believed there was a high positive cor-relation between direct labour and overhead costs. (A positive correlation between twothings means that they tend to move in tandem.) Consequently, direct labour was a use-ful allocation base for overhead.
338 Part II: The Central Theme: Planning and Control
Objective 1Explain the major
differences betweenactivity-based costing
and a traditionalcosting system.
34944ch08.qxd 9/12/00 10:07 AM Page 338
However, a plantwide overhead rate based on direct labour may no longer be sat-isfactory. First, in many companies, direct labour may no longer be highly correlatedwith (i.e., move in tandem with) overhead costs. Second, because of the large varietyof activities encompassed in overhead, no single allocation base may be able to ade-quately reflect the demands that products place on overhead resources.
On an economywide basis, direct labour and overhead costs have been movingin opposite directions for a long time. As a percentage of total cost, direct labour hasbeen declining, whereas overhead has been increasing.1 Many tasks that used to bedone by hand are now done with largely automated equipment—a component of over-head. Furthermore, product diversity has increased. Companies are creating new prod-ucts and services at an ever-accelerating rate that differ in volume, batch size, andcomplexity. Managing and sustaining this product diversity requires many more over-head resources such as production schedulers and product design engineers, and manyof these overhead resources have no obvious connection with direct labour.
Nevertheless, direct labour remains a viable base for applying overhead to prod-ucts in many companies—particularly for external reports. In some companies there isstill a high positive correlation between overhead costs and direct labour. And mostcompanies throughout the world continue to base overhead allocations on direct labouror machine-hours. However, in those instances in which factorywide overhead costs donot move in tandem with factorywide direct labour, some other means of assigningcosts must be found or product costs will be distorted.
DEPARTMENTAL OVERHEAD RATES Rather than use a plantwide overheadrate, many companies use departmental overhead rates. The allocation bases used inthese departmental overhead rates depend on the nature of the work performed in eachdepartment. For example, overhead costs in a machining department may be allocatedon the basis of the machine-hours in that department. In contrast, the overhead costs inan assembly department may be allocated on the basis of direct labour-hours in thatdepartment.
Unfortunately, even departmental overhead rates will not correctly assign over-head costs in situations where a company has a range of products that differ in volume,batch size, or complexity of production.2 The reason is that the departmental approachusually relies on volume as the factor in allocating overhead cost to products. Forexample, if the machining department’s overhead is applied to products on the basis ofmachine-hours, it is assumed that the department’s overhead costs are caused by,and are directly proportional to, machine-hours. However, the department’s over-head costs are probably more complex than this and are caused by a variety of factors,including the range of products processed in the department, the number of batchsetups that are required, the complexity of the products, and so on. Activity-basedcosting is a technique that is designed to reflect these diverse factors more accuratelywhen costing products. It attempts to accomplish this goal by identifying the majoractivitiessuch as batch setups, purchase order processing, and so on, that consumeoverhead resources. An activity is any event that causes the consumption of overheadresources. The costs of carrying out these activities are assigned to the products thatcause the activities.
Chapter 8: Activity-Based Costing: A Tool to Aid Decision Making 339
1. Germain Böer provides some data concerning these trends in “Five Modern Management AccountingMyths,” Management Accounting(January 1994), pp. 22–27. Data maintained by the U.S. Departmentof Commerce shows that since 1849, on average, material cost as a percentage of manufacturing costhas been fairly constant at 55% of sales. Labour cost has always been relatively less important and hasdeclined steadily from 23% in 1849 to about 10% in 1987. Overhead has grown from about 18% ofsales in 1947 to about 33% of sales 50 years later.
2. See Robin Cooper and Robert S. Kaplan, “How Cost Accounting Distorts Product Costs,” ManagementAccounting(April 1988), pp. 20–27.
Activity An event thatcauses the consumption ofoverhead resources in anorganization.
34944ch08.qxd 9/12/00 10:07 AM Page 339

The Costs of Idle Capacity in Activity-Based CostingIn traditional cost accounting, predetermined overhead rates are computed by dividingbudgeted overhead costs by a measure of budgeted activity such as budgeted directlabour-hours. This practice results in applying the costs of unused, or idle, capacity toproducts, and it results in unstable unit product costs as discussed in Appendix 3A. Ifbudgeted activity falls, the overhead rate increases because the fixed components ofoverhead are spread over a smaller base, resulting in increased unit product costs.
In contrast to traditional cost accounting, in activity-based costing, products arecharged for the costs of capacity they use—not for the costs of capacity they do notuse. In other words, the costs of idle capacity are not charged to products. This resultsin more stable unit costs and is consistent with the objective of assigning only thosecosts to products that are actually caused by the products.
Designing an Activity-Based Costing (ABC) SystemExperts agree on several essential characteristics of any successful implementation ofactivity-based costing. First, the initiative to implement activity-based costing must bestrongly supported by top management. Second, the design and implementation of anABC system should be the responsibility of a cross-functional team rather than of theaccounting department. The team should include representatives from each area thatwill use the data provided by the ABC system. Ordinarily, this would include repre-sentatives from marketing, production, engineering, and top management as well astechnically trained accounting staff. Sometimes an outside consultant who specializesin activity-based costing acts as an advisor to the team.
The reason for insisting on strong top-management support and a multifunctionteam approach is rooted in the fact that it is difficult to implement changes in organiza-tions unless those changes have the full support of those who are affected. Activity-based costing changes “the rules of the game” since it changes some of the keymeasures that managers use for their decision making and for evaluating individuals’performance. Unless the managers who are directly affected by the changes in the ruleshave a say, there will inevitably be resistance. In addition, designing a good ABC sys-tem requires intimate knowledge of many parts of the organization’s overall operations.This knowledge can only come from the people who are familiar with those operations.
Top managers must support the initiative for two reasons. First, without leader-ship from top management, some managers may not see any reason to change. Second,if top managers do not support the ABC system and continue to play the game by theold rules, their subordinates will quickly get the message and abandon the ABC sys-tem. Time after time, when accountants have attempted to implement an ABC systemon their own without top-management support and active cooperation from other man-agers, the results have been ignored.
Classic Brass, Inc., makes finely machined brass fittings for a variety of appli-cations including stanchions, cleats, and helms for luxury yachts. The presi-dent of the company, John Towers, recently attended a managementconference at which activity-based costing was discussed. Following theconference, he called a meeting of the top managers in the company todiscuss what he had learned. Attending the meeting were the productionmanager Susan Ritcher, the marketing manager Tom Olafson, and theaccounting manager Mary Goodman.
340 Part II: The Central Theme: Planning and Control
ManagerialAccounting
in ActionTHE ISSUE
Cla
ssic Brass, Inc.
34944ch08.qxd 9/12/00 10:07 AM Page 340
John: I’m glad we could all get together this morning. The conference Ijust attended dealt with some issues that we have all been wonderingabout for some time.Susan: Did anyone at the conference explain why my equipment alwaysbreaks down at the worst possible moment?John: Sorry Susan, I guess it must be bad karma or something.Tom: Did the conference tell you why we’ve been losing all those bidslately on our high-volume routine work?John: Tom, you probably weren’t expecting this answer, but, yes, theremay be a simple reason why we’ve been losing those bids.Tom: Let me guess. We’ve been losing the bids because we have morecompetition.John: Yes, the competition has a lot to do with it. But Tom, we may havebeen shooting ourselves in the foot.Tom: How so? I don’t know about anyone else, but my salespeople havebeen hustling like crazy to get more business for the company.Susan: Wait a minute Tom, my production people have been turning intremendous improvements in defect rates, on-time delivery, and so on.John: Whoa everybody. Calm down. I don’t think anyone is to blame forlosing the bids. Tom, when you talk with our customers, what reasons dothey give for taking their business to our competitors? Is it a problem withthe quality of our products or our on-time delivery?Tom: No, they don’t have any problem with our products or with ourservice—our customers readily admit we’re among the best in the business.Susan: Darn right!John: Then what’s the problem?Tom: Price. The competition is undercutting our prices on the high-volumework.John: Why are our prices too high?Tom: Our prices aren’t too high. Theirs are too low. Our competitors mustbe pricing below their cost.John: Tom, why do you think that?Tom: Well, if we charged the prices on high-volume work that ourcompetitors are quoting, we’d be pricing below our cost, and I know weare just as efficient as any competitor.Susan: Tom, why would our competitors price below their cost?Tom: They are out to grab market share.Susan: Does that make any sense? What good does more market share doif they are pricing below their cost?John: I think Susan has a point Tom. Mary, you’re the expert with thenumbers. Can you suggest another explanation?Mary: I was afraid you would ask that. Those unit product cost figures ourdepartment reports to you are primarily intended to be used to valueinventories and determine cost of goods sold for our external financialstatements. I am awfully uncomfortable about using them for bidding. Infact, I have mentioned this several times, but no one was interested.John: Now I’m interested. Mary, are you telling us that the product costfigures we have been using for bidding are wrong? Perhaps the competitionisn’t pricing below our cost—we just don’t know what our cost is?Mary: Yes, that could be the problem. I just wish someone had listenedearlier.John: Does everyone agree with Mary that this is a problem we shouldwork on?Tom: Sure, if it means we can win more bids.
Chapter 8: Activity-Based Costing: A Tool to Aid Decision Making 341
34944ch08.qxd 9/12/00 10:07 AM Page 341
John: Okay, I want each of you to appoint one of your top people to aspecial team to investigate how we cost products.Susan: Isn’t this something Mary can handle with her staff?John: Perhaps she could, but you know more about your operations thanshe does and besides, I want to make sure you agree with the results ofthe study and use them. Mary, do you agree?Mary: Absolutely.
After studying the existing cost accounting system at Classic Brass and review-ing articles in professional and trade journals, the special team decided to implementan activity-based costing (ABC) system. Like most other ABC implementations, thenew ABC system would supplement, rather than replace, the existing cost accountingsystem, which would continue to be used for external financial reports. The new ABCsystem would be used to prepare special reports for management decisions such as bid-ding on new business.
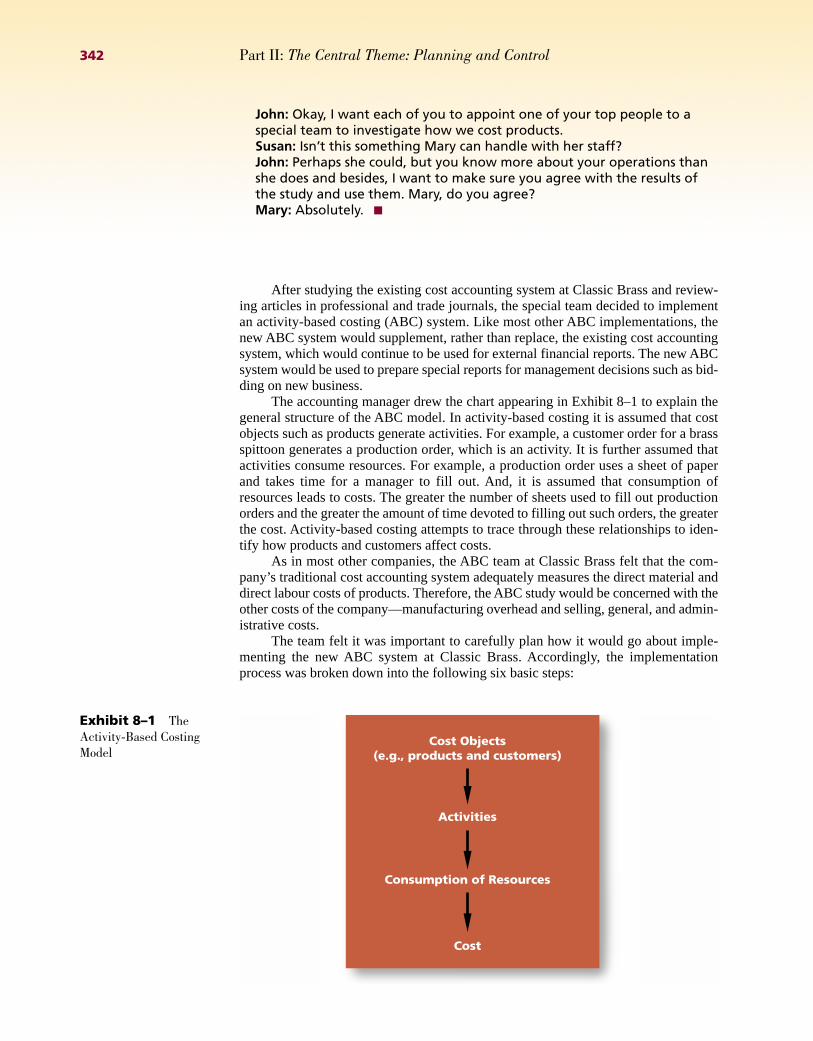
The accounting manager drew the chart appearing in Exhibit 8–1 to explain thegeneral structure of the ABC model. In activity-based costing it is assumed that costobjects such as products generate activities. For example, a customer order for a brassspittoon generates a production order, which is an activity. It is further assumed thatactivities consume resources. For example, a production order uses a sheet of paperand takes time for a manager to fill out. And, it is assumed that consumption ofresources leads to costs. The greater the number of sheets used to fill out productionorders and the greater the amount of time devoted to filling out such orders, the greaterthe cost. Activity-based costing attempts to trace through these relationships to iden-tify how products and customers affect costs.
As in most other companies, the ABC team at Classic Brass felt that the com-pany’s traditional cost accounting system adequately measures the direct material anddirect labour costs of products. Therefore, the ABC study would be concerned with theother costs of the company—manufacturing overhead and selling, general, and admin-istrative costs.
The team felt it was important to carefully plan how it would go about imple-menting the new ABC system at Classic Brass. Accordingly, the implementationprocess was broken down into the following six basic steps:
342 Part II: The Central Theme: Planning and Control
Exhibit 8–1 TheActivity-Based CostingModel
Cost Objects(e.g., products and customers)
Activities
Consumption of Resources
Cost
34944ch08.qxd 9/12/00 10:08 AM Page 342
Steps for Implementing Activity-Based Costing:
1. Identify and define activities and activity pools.2. Wherever possible, directly trace costs to activities and cost objects.3. Assign costs to activity cost pools.4. Calculate activity rates.5. Assign costs to cost objects using the activity rates and activity measures.6. Prepare management reports.
Identifying Activities to Include in the ABC SystemThe first major step in implementing an ABC system is to identify the activities thatwill form the foundation for the system. This can be difficult, time-consuming, andinvolves a great deal of judgment. A common procedure is for the individuals on theABC implementation team to interview everyone—or at least all supervisors and man-agers—in overhead departments and ask them to describe their major activities.Ordinarily, this results in a very long list of activities.
The length of such lists of activities poses a problem. On the one hand, thegreater the number of activities tracked in the ABC system, the more accurate the costsare likely to be. On the other hand, it is costly to design, implement, maintain, and usea complex system involving large numbers of activities. Consequently, the originallengthy list of activities is usually reduced to a handful by combining similar activities.For example, several actions may be involved in handling and moving raw materials—from receiving raw materials on the loading dock to sorting them into the appropriatebins in the storeroom. All of these activities might be combined into a single activitycalled material handling.
A useful way to think about activities and how to combine them is to organizethem into five general levels: unit-level, batch-level, product-level, customer-level, andorganization-sustaining activities. These levels are described as follows:3
1. Unit-level activities are performed each time a unit is produced. The costs ofunit-level activities should be proportional to the number of units produced. Forexample, providing power to run processing equipment would be a unit-levelactivity since power tends to be consumed in proportion to the number of unitsproduced.
2. Batch-level activitiesare performed each time a batch is handled or processed,regardless of how many units are in the batch. For example, tasks such as placingpurchase orders, setting up equipment, and arranging for shipments to customersare batch-level activities. They are incurred each time there is a batch (or acustomer order). Costs at the batch level depend on the number of batchesprocessed rather than on the number of units produced, the number of units sold, orother measures of volume. For example, the cost of setting up a machine for batchprocessing is the same regardless of whether the batch contains one or 5,000 items.
3. Product-level activitiesrelate to specific products and typically must be carriedout regardless of how many batches are run or units of product are produced orsold. For example, activities such as designing a product, advertising a product,and maintaining a product manager and staff are all product-level activities.
4. Customer-level activitiesrelate to specific customers and include activities suchas sales calls, catalogue mailings, and general technical support that are not tiedto any specific product.
5. Organization-sustaining activitiesare carried out regardless of which customersare served, which products are produced, how many batches are run, or howmany units are made. This category includes activities such as cleaning executive
Chapter 8: Activity-Based Costing: A Tool to Aid Decision Making 343
Objective 2Distinguish between
unit-level, batch-level, product-level,customer-level, and
organization-sustaining activities.
Unit-level activitiesActivities that arise as aresult of the total volumeof goods and services thatare produced, and that areperformed each time aunit is produced.
Batch-level activitiesActivities that are per-formed each time a batchof goods is handled orprocessed, regardless ofhow many units are in abatch. The amount ofresource consumeddepends on the number ofbatches run rather than onthe number of units in thebatch.
Customer-level activitiesActivities that are carriedout to support customersbut that are not related toany specific product.
Organization-sustainingactivities Activities thatare carried out regardlessof which customers areserved, which productsare produced, how manybatches are run, or howmany units are made.
3. Robin Cooper, “Cost Classification in Unit-Based and Activity-Based Manufacturing Cost Systems,”Journal of Cost Management(Fall 1990), pp. 4–14.
Product-level activitiesActivities that relate tospecific products thatmust be carried outregardless of how manyunits are produced andsold or batches run.
34944ch08.qxd 9/12/00 10:08 AM Page 343
offices, providing a computer network, arranging for loans, preparing annualreports to shareholders, and so on. These activities are not consumed by theproducts or services.
When combining activities in an ABC system, activities should be groupedtogether at the appropriate level. Batch-level activities should not be combined withunit-level activities or product-level activities with batch-level activities and so on. Ingeneral, it is best to combine only those activities that are highly correlated with eachother within a level. Activities are correlated with each other if they tend to move intandem. For example, the number of customer orders received is likely to be highlycorrelated with the number of completed customer orders shipped, so these two batch-level activities (receiving and shipping orders) can usually be combined with little lossof accuracy.
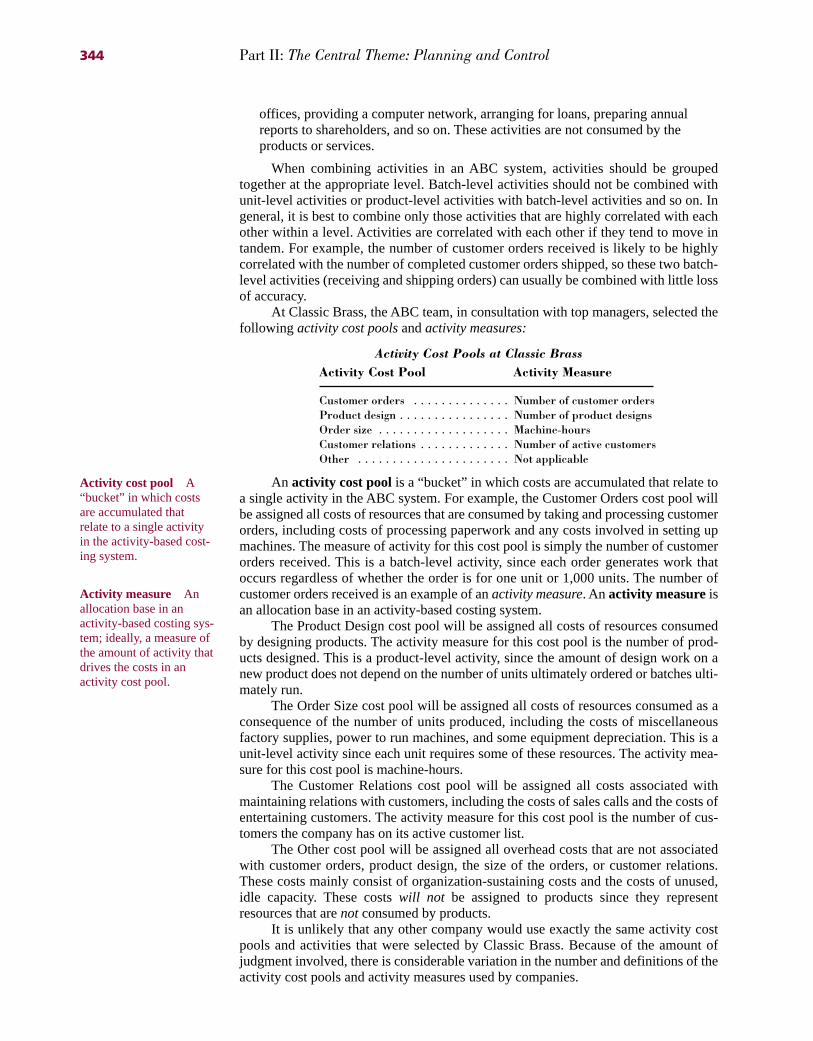
At Classic Brass, the ABC team, in consultation with top managers, selected thefollowing activity cost poolsand activity measures:
Activity Cost Pools at Classic BrassActivity Cost Pool Activity Measure
Customer orders . . . . . . . . . . . . . . Number of customer ordersProduct design . . . . . . . . . . . . . . . . Number of product designsOrder size . . . . . . . . . . . . . . . . . . . Machine-hoursCustomer relations . . . . . . . . . . . . . Number of active customersOther . . . . . . . . . . . . . . . . . . . . . . Not applicable
An activity cost pool is a “bucket” in which costs are accumulated that relate toa single activity in the ABC system. For example, the Customer Orders cost pool willbe assigned all costs of resources that are consumed by taking and processing customerorders, including costs of processing paperwork and any costs involved in setting upmachines. The measure of activity for this cost pool is simply the number of customerorders received. This is a batch-level activity, since each order generates work thatoccurs regardless of whether the order is for one unit or 1,000 units. The number ofcustomer orders received is an example of an activity measure. An activity measureisan allocation base in an activity-based costing system.
The Product Design cost pool will be assigned all costs of resources consumedby designing products. The activity measure for this cost pool is the number of prod-ucts designed. This is a product-level activity, since the amount of design work on anew product does not depend on the number of units ultimately ordered or batches ulti-mately run.
The Order Size cost pool will be assigned all costs of resources consumed as aconsequence of the number of units produced, including the costs of miscellaneousfactory supplies, power to run machines, and some equipment depreciation. This is aunit-level activity since each unit requires some of these resources. The activity mea-sure for this cost pool is machine-hours.
The Customer Relations cost pool will be assigned all costs associated withmaintaining relations with customers, including the costs of sales calls and the costs ofentertaining customers. The activity measure for this cost pool is the number of cus-tomers the company has on its active customer list.
The Other cost pool will be assigned all overhead costs that are not associatedwith customer orders, product design, the size of the orders, or customer relations.These costs mainly consist of organization-sustaining costs and the costs of unused,idle capacity. These costs will not be assigned to products since they representresources that are notconsumed by products.
It is unlikely that any other company would use exactly the same activity costpools and activities that were selected by Classic Brass. Because of the amount ofjudgment involved, there is considerable variation in the number and definitions of theactivity cost pools and activity measures used by companies.
344 Part II: The Central Theme: Planning and Control
Activity cost pool A“bucket” in which costsare accumulated thatrelate to a single activityin the activity-based cost-ing system.
Activity measure Anallocation base in anactivity-based costing sys-tem; ideally, a measure ofthe amount of activity thatdrives the costs in anactivity cost pool.
34944ch08.qxd 9/12/00 10:08 AM Page 344
The Mechanics of Activity-Based CostingAfter the ABC system had been designed, the team was ready to begin the process ofactually computing the costs of products, customers, and other objects of interest.
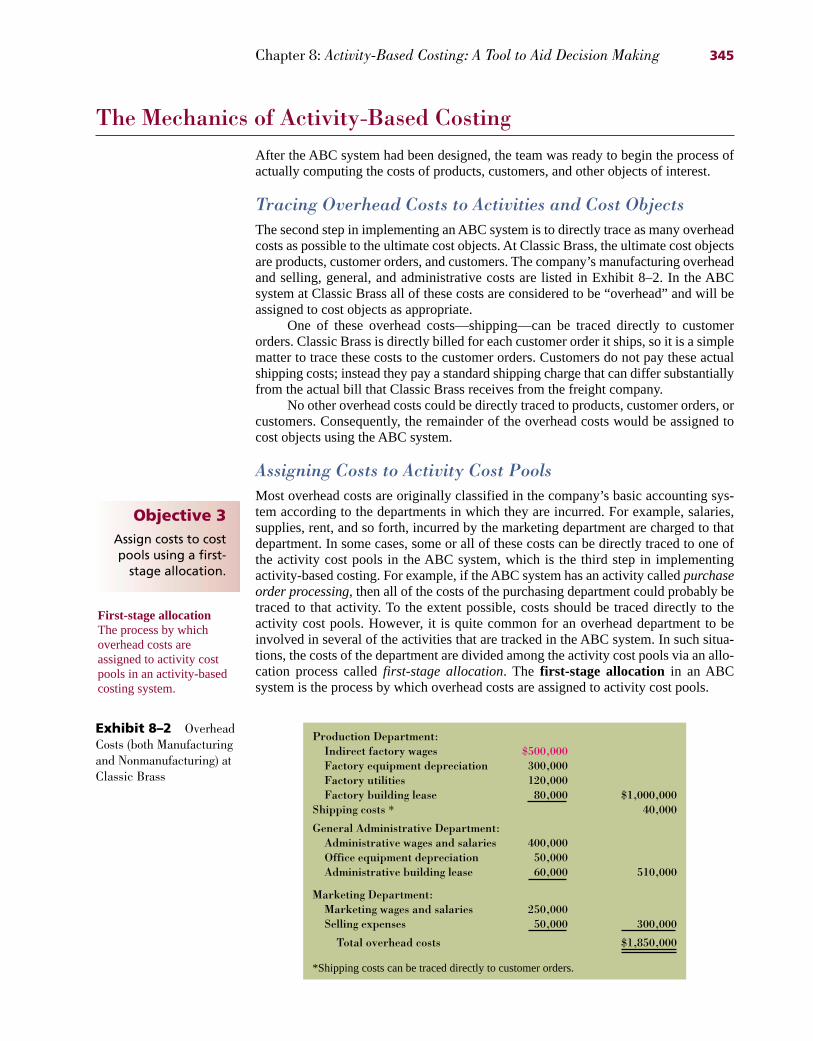
Tracing Overhead Costs to Activities and Cost ObjectsThe second step in implementing an ABC system is to directly trace as many overheadcosts as possible to the ultimate cost objects. At Classic Brass, the ultimate cost objectsare products, customer orders, and customers. The company’s manufacturing overheadand selling, general, and administrative costs are listed in Exhibit 8–2. In the ABCsystem at Classic Brass all of these costs are considered to be “overhead” and will beassigned to cost objects as appropriate.
One of these overhead costs—shipping—can be traced directly to customerorders. Classic Brass is directly billed for each customer order it ships, so it is a simplematter to trace these costs to the customer orders. Customers do not pay these actualshipping costs; instead they pay a standard shipping charge that can differ substantiallyfrom the actual bill that Classic Brass receives from the freight company.
No other overhead costs could be directly traced to products, customer orders, orcustomers. Consequently, the remainder of the overhead costs would be assigned tocost objects using the ABC system.
Assigning Costs to Activity Cost PoolsMost overhead costs are originally classified in the company’s basic accounting sys-tem according to the departments in which they are incurred. For example, salaries,supplies, rent, and so forth, incurred by the marketing department are charged to thatdepartment. In some cases, some or all of these costs can be directly traced to one ofthe activity cost pools in the ABC system, which is the third step in implementingactivity-based costing. For example, if the ABC system has an activity called purchaseorder processing,then all of the costs of the purchasing department could probably betraced to that activity. To the extent possible, costs should be traced directly to theactivity cost pools. However, it is quite common for an overhead department to beinvolved in several of the activities that are tracked in the ABC system. In such situa-tions, the costs of the department are divided among the activity cost pools via an allo-cation process called first-stage allocation. The first-stage allocation in an ABCsystem is the process by which overhead costs are assigned to activity cost pools.
Chapter 8: Activity-Based Costing: A Tool to Aid Decision Making 345
Exhibit 8–2 OverheadCosts (both Manufacturingand Nonmanufacturing) atClassic Brass
Production Department:Indirect factory wages $500,000Factory equipment depreciation 300,000Factory utilities 120,000Factory building lease 80,000 $1,000,000
Shipping costs * 40,000
General Administrative Department:Administrative wages and salaries 400,000Office equipment depreciation 50,000Administrative building lease 60,000 510,000
Marketing Department:Marketing wages and salaries 250,000Selling expenses 50,000 300,000
Total overhead costs $1,850,000
*Shipping costs can be traced directly to customer orders.
Objective 3Assign costs to costpools using a first-
stage allocation.
First-stage allocationThe process by whichoverhead costs areassigned to activity costpools in an activity-basedcosting system.
34944ch08.qxd 9/12/00 10:09 AM Page 345

The immediate problem is to figure out how to divide, for example, the $500,000of indirect factory wages at Classic Brass shown in Exhibit 8–2 among the variousactivity cost pools in the ABC system. The point of activity-based costing is to deter-mine the resources consumed by cost objects. Since indirect factory worker time is aresource, we need some way of estimating the amount of indirect factory worker timethat is consumed by each activity in the ABC system. Often, the best way to get thiskind of information is to ask the people who are directly involved. Members of theABC team interview indirect factory workers (e.g., supervisors, engineers, qualityinspectors, etc.) and ask them what percentage of time they spend dealing with cus-tomer orders, with product design, with processing units of product (i.e., order size),and with customer relations. These interviews are conducted with considerable care.Those who are interviewed must thoroughly understand what the activities encompassand what is expected of them in the interview. In addition, departmental managers areinterviewed to determine how the nonpersonnel costs should be distributed across theactivity cost pools. In each case the key question is “What percentage of the availableresource is consumed by this activity?” For example, the production manager wouldbe asked, “What percentage of the available machine capacity is consumed as a con-sequence of the number of units processed (i.e., size of orders)?”
The results of the interviews at Classic Brass are displayed in Exhibit 8–3. Forexample, factory equipment depreciation is distributed 20%to Customer Orders, 60%to Order Size, and 20%to the Other cost pool. The resource in this instance is machinetime. According to the estimate made by the production manager, 60% of the totalavailable time was used to actually process units to fill orders. Each customer orderrequires setting up, which also requires machine time. This activity consumes 20% ofthe total available machine time and is entered under the Customer Orders column.The remaining 20% of available machine time represents idle time and is entered underthe Other column.
Exhibit 8–3 and many of the other exhibits in this chapter are presented in theform of Excel spreadsheets. It is often a good idea to use spreadsheet software inactivity-based costing because of the large number of calculations involved. You cando all of the calculations by hand, but setting up an activity-based costing system on aspreadsheet or using other special ABC software can save a lot of work in the longrun—particularly in companies that intend to periodically update their ABC systems.
346 Part II: The Central Theme: Planning and Control
*Shipping costs are not included in this and subsequent tables because they are directly tracedto customer orders rather than being allocated using the ABC system.
NA � Not applicable.
Exhibit 8–3 Results ofInterviews: Distribution ofActivities
34944ch08.qxd 9/12/00 10:10 AM Page 346
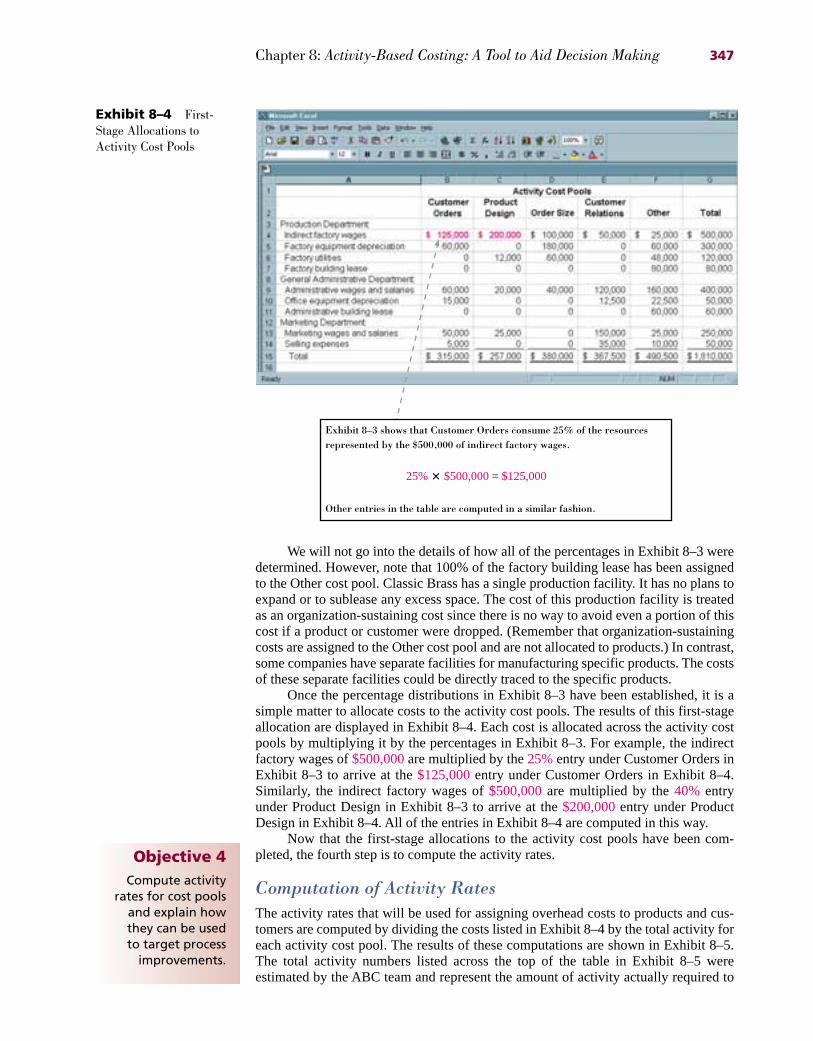
We will not go into the details of how all of the percentages in Exhibit 8–3 weredetermined. However, note that 100% of the factory building lease has been assignedto the Other cost pool. Classic Brass has a single production facility. It has no plans toexpand or to sublease any excess space. The cost of this production facility is treatedas an organization-sustaining cost since there is no way to avoid even a portion of thiscost if a product or customer were dropped. (Remember that organization-sustainingcosts are assigned to the Other cost pool and are not allocated to products.) In contrast,some companies have separate facilities for manufacturing specific products. The costsof these separate facilities could be directly traced to the specific products.
Once the percentage distributions in Exhibit 8–3 have been established, it is asimple matter to allocate costs to the activity cost pools. The results of this first-stageallocation are displayed in Exhibit 8–4. Each cost is allocated across the activity costpools by multiplying it by the percentages in Exhibit 8–3. For example, the indirectfactory wages of $500,000are multiplied by the 25%entry under Customer Orders inExhibit 8–3 to arrive at the $125,000entry under Customer Orders in Exhibit 8–4.Similarly, the indirect factory wages of $500,000are multiplied by the 40% entryunder Product Design in Exhibit 8–3 to arrive at the $200,000entry under ProductDesign in Exhibit 8–4. All of the entries in Exhibit 8–4 are computed in this way.
Now that the first-stage allocations to the activity cost pools have been com-pleted, the fourth step is to compute the activity rates.
Computation of Activity RatesThe activity rates that will be used for assigning overhead costs to products and cus-tomers are computed by dividing the costs listed in Exhibit 8–4 by the total activity foreach activity cost pool. The results of these computations are shown in Exhibit 8–5.The total activity numbers listed across the top of the table in Exhibit 8–5 wereestimated by the ABC team and represent the amount of activity actually required to
Chapter 8: Activity-Based Costing: A Tool to Aid Decision Making 347
Exhibit 8–4 First-Stage Allocations toActivity Cost Pools
Exhibit 8–3 shows that Customer Orders consume 25% of the resourcesrepresented by the $500,000 of indirect factory wages.
25% � $500,000 = $125,000
Other entries in the table are computed in a similar fashion.
Objective 4Compute activity
rates for cost poolsand explain how they can be used to target process
improvements.
34944ch08.qxd 9/12/00 10:11 AM Page 347
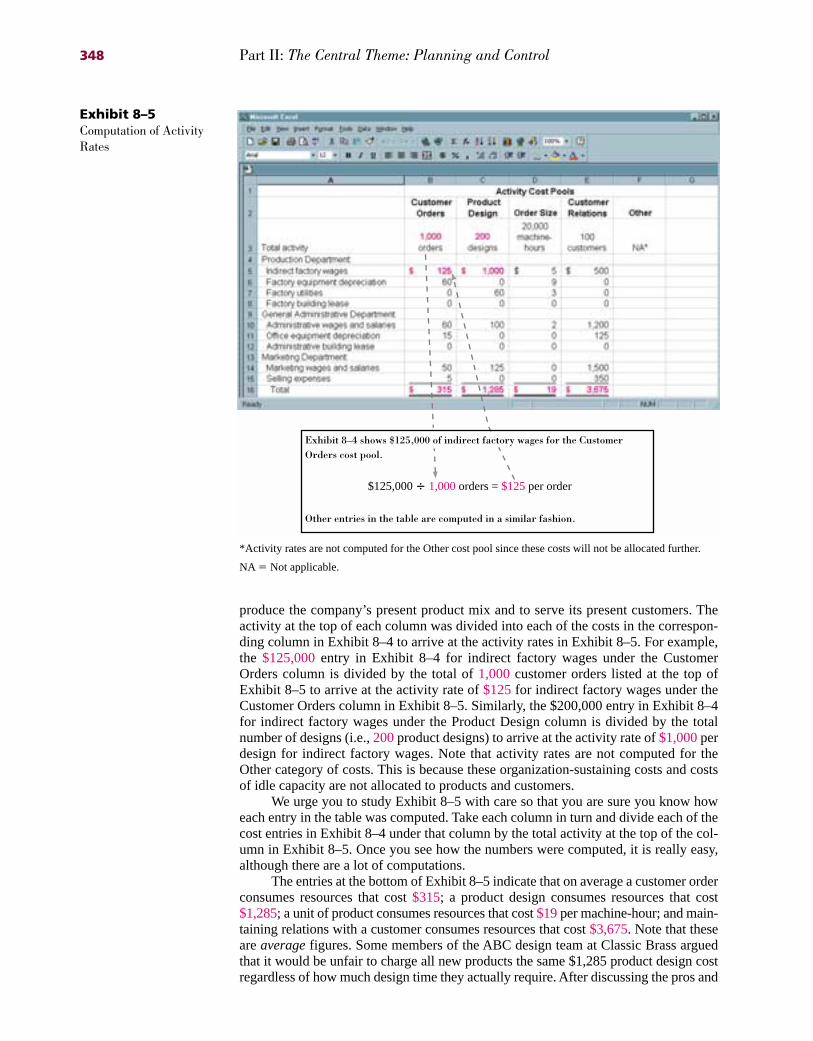
produce the company’s present product mix and to serve its present customers. Theactivity at the top of each column was divided into each of the costs in the correspon-ding column in Exhibit 8–4 to arrive at the activity rates in Exhibit 8–5. For example,the $125,000entry in Exhibit 8–4 for indirect factory wages under the CustomerOrders column is divided by the total of 1,000customer orders listed at the top ofExhibit 8–5 to arrive at the activity rate of $125for indirect factory wages under theCustomer Orders column in Exhibit 8–5. Similarly, the $200,000 entry in Exhibit 8–4for indirect factory wages under the Product Design column is divided by the totalnumber of designs (i.e., 200product designs) to arrive at the activity rate of $1,000perdesign for indirect factory wages. Note that activity rates are not computed for theOther category of costs. This is because these organization-sustaining costs and costsof idle capacity are not allocated to products and customers.
We urge you to study Exhibit 8–5 with care so that you are sure you know howeach entry in the table was computed. Take each column in turn and divide each of thecost entries in Exhibit 8–4 under that column by the total activity at the top of the col-umn in Exhibit 8–5. Once you see how the numbers were computed, it is really easy,although there are a lot of computations.
The entries at the bottom of Exhibit 8–5 indicate that on average a customer orderconsumes resources that cost $315; a product design consumes resources that cost$1,285; a unit of product consumes resources that cost $19per machine-hour; and main-taining relations with a customer consumes resources that cost $3,675. Note that theseare averagefigures. Some members of the ABC design team at Classic Brass arguedthat it would be unfair to charge all new products the same $1,285 product design costregardless of how much design time they actually require. After discussing the pros and
348 Part II: The Central Theme: Planning and Control
*Activity rates are not computed for the Other cost pool since these costs will not be allocated further.
NA � Not applicable.
Exhibit 8–5Computation of ActivityRates
Exhibit 8–4 shows $125,000 of indirect factory wages for the Customer Orders cost pool.
$125,000 � 1,000 orders = $125 per order
Other entries in the table are computed in a similar fashion.
34944ch08.qxd 9/12/00 10:12 AM Page 348

cons, the team concluded that it would not be worth the effort at the present time to keeptrack of actual design time spent on each new product. Similarly, some team memberswere uncomfortable assigning the same $3,675 cost to each customer. Some customersare undemanding—ordering standard products well in advance of their needs. Othersare very demanding and consume large amounts of marketing and administrative stafftime. These are generally customers who order customized products, who tend to orderat the last minute, and who change their minds. While everyone agreed with this obser-vation, the data that would be required to measure individual customers’ demands onresources was not currently available. Rather than delay implementation of the ABCsystem, the team decided to defer such refinements to a later date.
Before proceeding further, it would be helpful to get a better idea of the overallprocess of assigning costs to products and other cost objects in an ABC system. Exhibit8–6 provides a visual perspective of the ABC system at Classic Brass. We recommendthat you carefully go over this exhibit. In particular, note that the Other category, whichcontains organization-sustaining costs and costs of idle capacity, is not allocated toproducts or customers.
Targeting Process ImprovementsActivity-based costing can be used to identify areas that would benefit from processimprovements. Indeed, managers often cite this as the major benefit of activity-basedcosting.4 When used in this way, activity-based costing is often called activity-basedmanagement. Basically, activity-based management (ABM)focuses on managingactivities as a way of eliminating waste and reducing delays and defects. Activity-based management is used in organizations as diverse as manufacturing companies,hospitals, and the Royal Canadian Mint.5 When “forty percent of the cost of running a
Chapter 8: Activity-Based Costing: A Tool to Aid Decision Making 349
Exhibit 8–6 The Activity-Based Costing Model at Classic Brass
Traced
DirectMaterials
Cost Objects:Products, Customer Orders, Customers
Unallocated
CustomerOrders
OrderSize
CustomerRelations
OtherProductDesign
$/DLH
DirectLabour
Traced
$/MH $/Order $/Design $/Customer
ShippingCosts
Overhead Costs(Manufacturing and Nonmanufacturing)
First-Stage Allocations
Second-Stage Allocations
Activity-based manage-ment (ABM) A man-agement approach thatfocuses on managingactivities as a way ofeliminating waste andreducing delays anddefects.
4. Dan Swenson, “The Benefits of Activity-Based Cost Management to the Manufacturing Industry,”Journal of Management Accounting Research7 (Fall 1995), pp. 168–80.
5. Michael Senyshen, “ABC/M in the Federal Government,” CGA Magazine(December 1997), p. 19.
34944ch08.qxd 9/12/00 10:12 AM Page 349
hospital involves storing, collecting and moving information,” there is obviously agreat deal of room for eliminating waste and for improvement.6
The first step in any improvement program is to decide what to improve. Thetheory of constraints approach discussed in Chapter 1 is a powerful tool for target-ing the area in an organization whose improvement will yield the greatest benefit.Activity-based management provides another approach. The activity rates computed inactivity-based costing can provide valuable clues concerning where there is waste andscope for improvement in an organization. For example, managers at Classic Brasswere surprised at the high cost of customer orders. Some customer orders are for lessthan $100 worth of products, and yet it costs, on average, $315 to process an orderaccording to the activity rates calculated in Exhibit 8–5. This seemed like an awful lotof money for an activity that adds no value to the product. As a consequence, the cus-tomer order processing activity was targeted for improvement using TQM and processreengineering as discussed in Chapter 1.
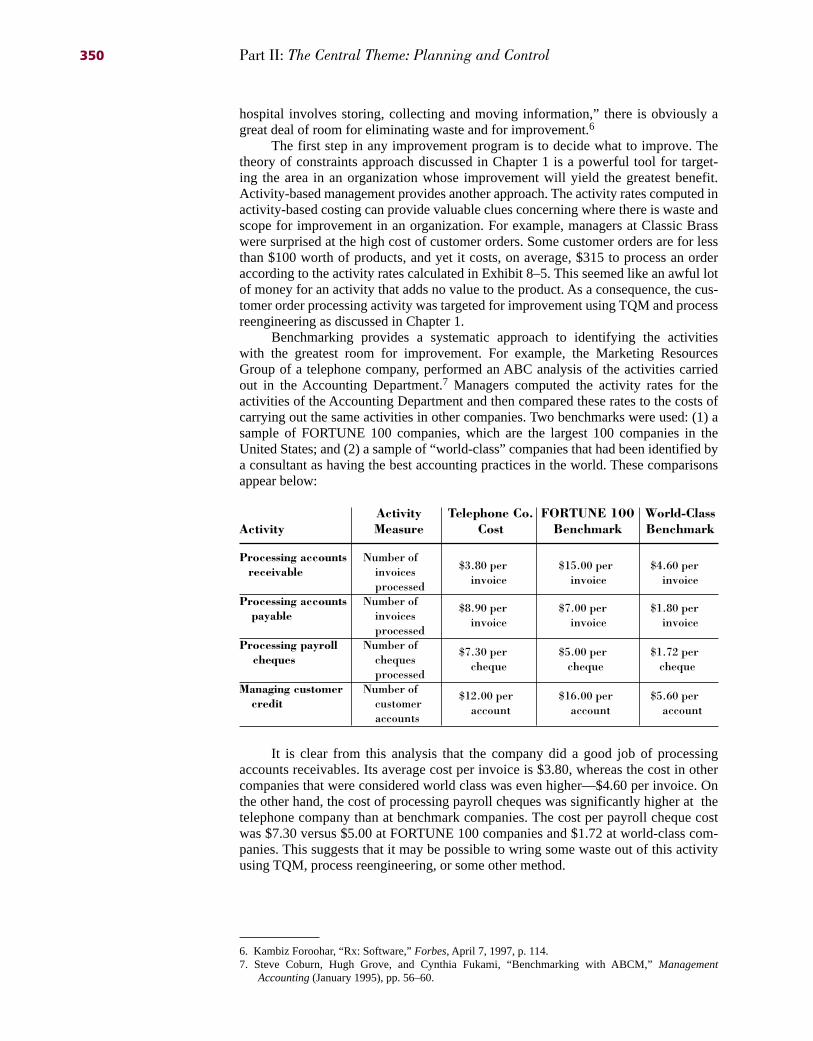
Benchmarking provides a systematic approach to identifying the activitieswith the greatest room for improvement. For example, the Marketing ResourcesGroup of a telephone company, performed an ABC analysis of the activities carriedout in the Accounting Department.7 Managers computed the activity rates for theactivities of the Accounting Department and then compared these rates to the costs ofcarrying out the same activities in other companies. Two benchmarks were used: (1) asample of FORTUNE 100 companies, which are the largest 100 companies in theUnited States; and (2) a sample of “world-class” companies that had been identified bya consultant as having the best accounting practices in the world. These comparisonsappear below:
Activity Telephone Co. FORTUNE 100 World-ClassActivity Measure Cost Benchmark Benchmark
Processing accounts Number of receivable invoices $3.80 per $15.00 per $4.60 per
processed invoice invoice invoice
Processing accounts Number of $8.90 per $7.00 per $1.80 perpayable invoices invoice invoice invoice
processedProcessing payroll Number of $7.30 per $5.00 per $1.72 per
cheques cheques cheque cheque chequeprocessed
Managing customer Number of $12.00 per $16.00 per $5.60 per credit customer account account account
accounts
It is clear from this analysis that the company did a good job of processingaccounts receivables. Its average cost per invoice is $3.80, whereas the cost in othercompanies that were considered world class was even higher—$4.60 per invoice. Onthe other hand, the cost of processing payroll cheques was significantly higher at thetelephone company than at benchmark companies. The cost per payroll cheque costwas $7.30 versus $5.00 at FORTUNE 100 companies and $1.72 at world-class com-panies. This suggests that it may be possible to wring some waste out of this activityusing TQM, process reengineering, or some other method.
350 Part II: The Central Theme: Planning and Control
6. Kambiz Foroohar, “Rx: Software,” Forbes, April 7, 1997, p. 114.7. Steve Coburn, Hugh Grove, and Cynthia Fukami, “Benchmarking with ABCM,” Management
Accounting(January 1995), pp. 56–60.
34944ch08.qxd 9/12/00 10:12 AM Page 350
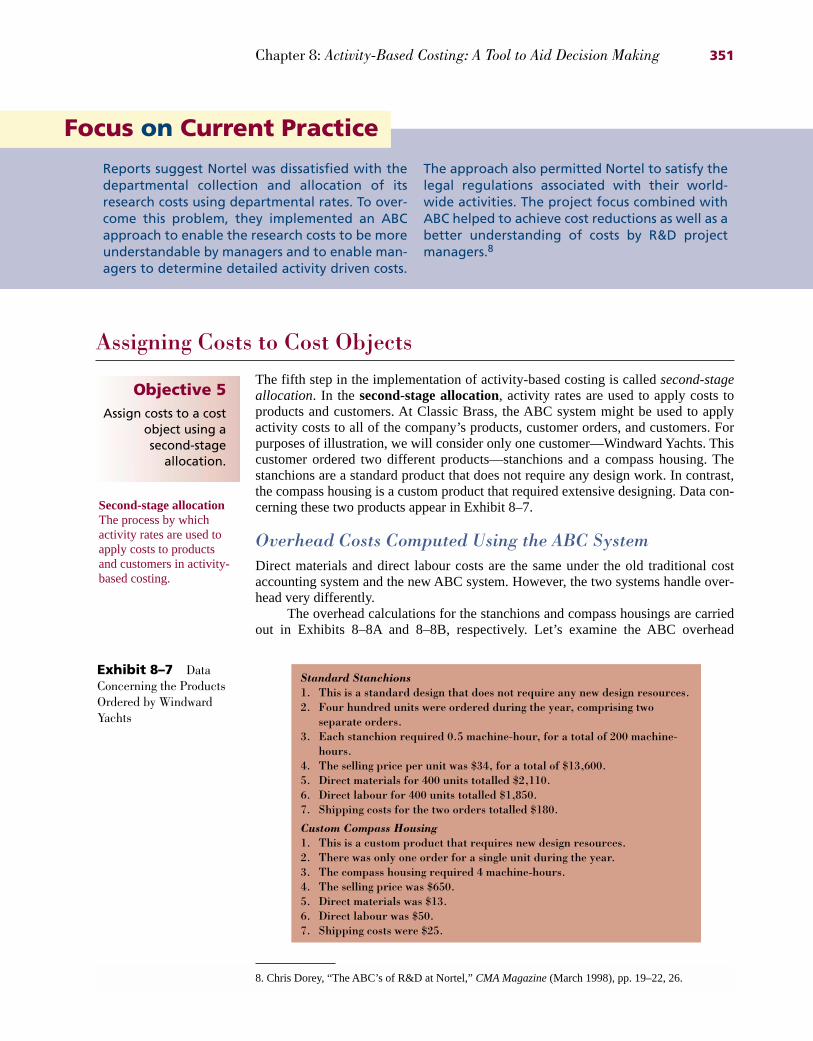
Assigning Costs to Cost ObjectsThe fifth step in the implementation of activity-based costing is called second-stageallocation. In the second-stage allocation, activity rates are used to apply costs toproducts and customers. At Classic Brass, the ABC system might be used to applyactivity costs to all of the company’s products, customer orders, and customers. Forpurposes of illustration, we will consider only one customer—Windward Yachts. Thiscustomer ordered two different products—stanchions and a compass housing. Thestanchions are a standard product that does not require any design work. In contrast,the compass housing is a custom product that required extensive designing. Data con-cerning these two products appear in Exhibit 8–7.
Overhead Costs Computed Using the ABC SystemDirect materials and direct labour costs are the same under the old traditional costaccounting system and the new ABC system. However, the two systems handle over-head very differently.
The overhead calculations for the stanchions and compass housings are carriedout in Exhibits 8–8A and 8–8B, respectively. Let’s examine the ABC overhead
Chapter 8: Activity-Based Costing: A Tool to Aid Decision Making 351
Reports suggest Nortel was dissatisfied with thedepartmental collection and allocation of itsresearch costs using departmental rates. To over-come this problem, they implemented an ABCapproach to enable the research costs to be moreunderstandable by managers and to enable man-agers to determine detailed activity driven costs.
The approach also permitted Nortel to satisfy thelegal regulations associated with their world-wide activities. The project focus combined withABC helped to achieve cost reductions as well as abetter understanding of costs by R&D projectmanagers.8
Focus on Current Practice
Exhibit 8–7 DataConcerning the ProductsOrdered by WindwardYachts
Standard Stanchions1. This is a standard design that does not require any new design resources.2. Four hundred units were ordered during the year, comprising two
separate orders.3. Each stanchion required 0.5 machine-hour, for a total of 200 machine-
hours.4. The selling price per unit was $34, for a total of $13,600.5. Direct materials for 400 units totalled $2,110.6. Direct labour for 400 units totalled $1,850.7. Shipping costs for the two orders totalled $180.
Custom Compass Housing1. This is a custom product that requires new design resources.2. There was only one order for a single unit during the year.3. The compass housing required 4 machine-hours.4. The selling price was $650.5. Direct materials was $13.6. Direct labour was $50.7. Shipping costs were $25.
Objective 5Assign costs to a cost
object using asecond-stage
allocation.
Second-stage allocationThe process by whichactivity rates are used toapply costs to productsand customers in activity-based costing.
8. Chris Dorey, “The ABC’s of R&D at Nortel,” CMA Magazine(March 1998), pp. 19–22, 26.
34944ch08.qxd 9/12/00 10:13 AM Page 351
352 Part II: The Central Theme: Planning and Control
NA � Not applicable.
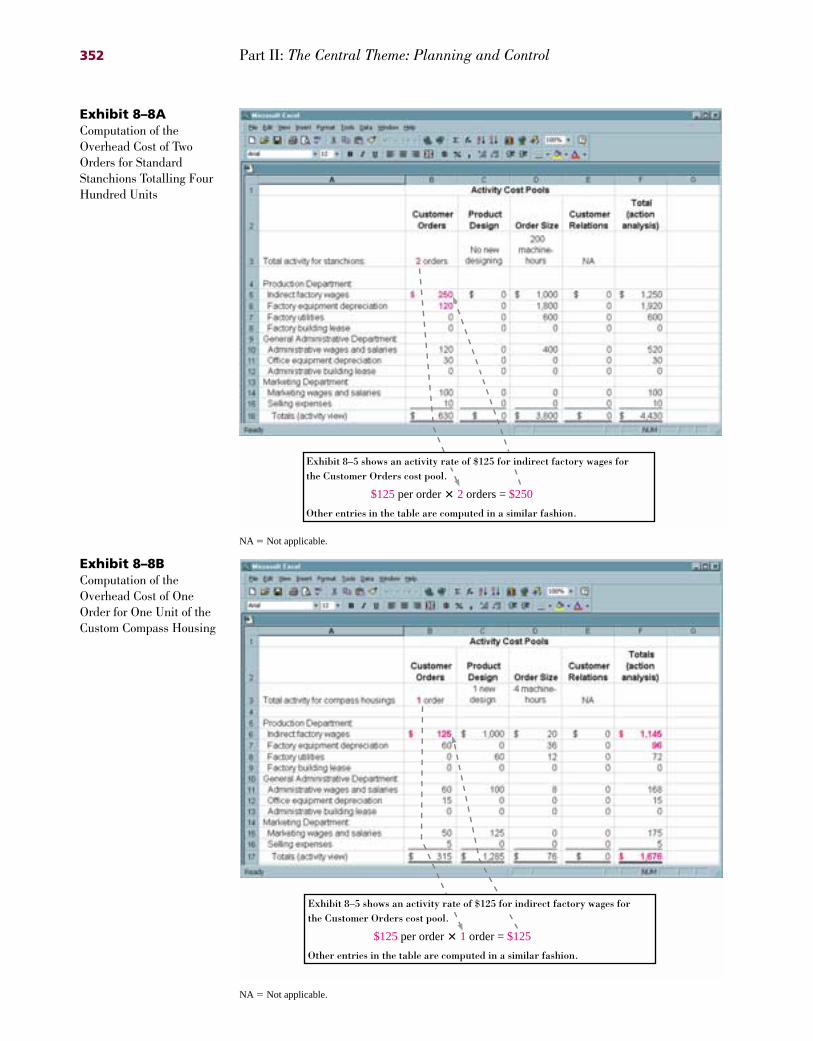
Exhibit 8–8AComputation of theOverhead Cost of TwoOrders for StandardStanchions Totalling FourHundred Units
Exhibit 8–5 shows an activity rate of $125 for indirect factory wages forthe Customer Orders cost pool.
$125 per order � 2 orders = $250
Other entries in the table are computed in a similar fashion.
NA � Not applicable.
Exhibit 8–8BComputation of theOverhead Cost of OneOrder for One Unit of theCustom Compass Housing
Exhibit 8–5 shows an activity rate of $125 for indirect factory wages forthe Customer Orders cost pool.
$125 per order � 1 order = $125
Other entries in the table are computed in a similar fashion.
34944ch08.qxd 9/12/00 10:15 AM Page 352
calculations for the stanchions in Exhibit 8–8A. First note that none of the CustomerRelations costs have been allocated to the stanchions. A customer-level cost is assignedto customers directly; it is not assigned to products. The activities required to fill thetwo orders for stanchions totalling 400 units are listed across the top of the exhibit.Since this is a standard product, no new designing is required and hence no designcosts are allocated to the order. However, there are two orders, so each of the activityrates under the Customer Orders column in Exhibit 8–5 is multiplied by 2 to determinethe Customer Orders costs for this product. For example, the activity rate for indirectfactory wages for Customer Orders in Exhibit 8–5 is $125per order. Since there aretwo orders, 2 � $125 � $250is allocated to this product and appears as the first entryunder the Customer Orders column in Exhibit 8–8A. Similarly, the activity rate for fac-tory equipment depreciation for Customer Orders in Exhibit 8–5 is $60 per order.Since there are two orders, the product is charged $120. This appears as the secondentry under Customer Orders in Exhibit 8–8A.
As with Exhibit 8–5, we urge you to study Exhibits 8–8A and 8–8B carefully tomake sure you know how each entry in the table was computed. Take each column inturn and multiply each of the activity rates in Exhibit 8–5 under that column by thetotal activity at the top of the column in Exhibit 8–8A (and 8–8B). As before, once yousee how the numbers are computed, it is not difficult, although there are a lot ofcomputations.
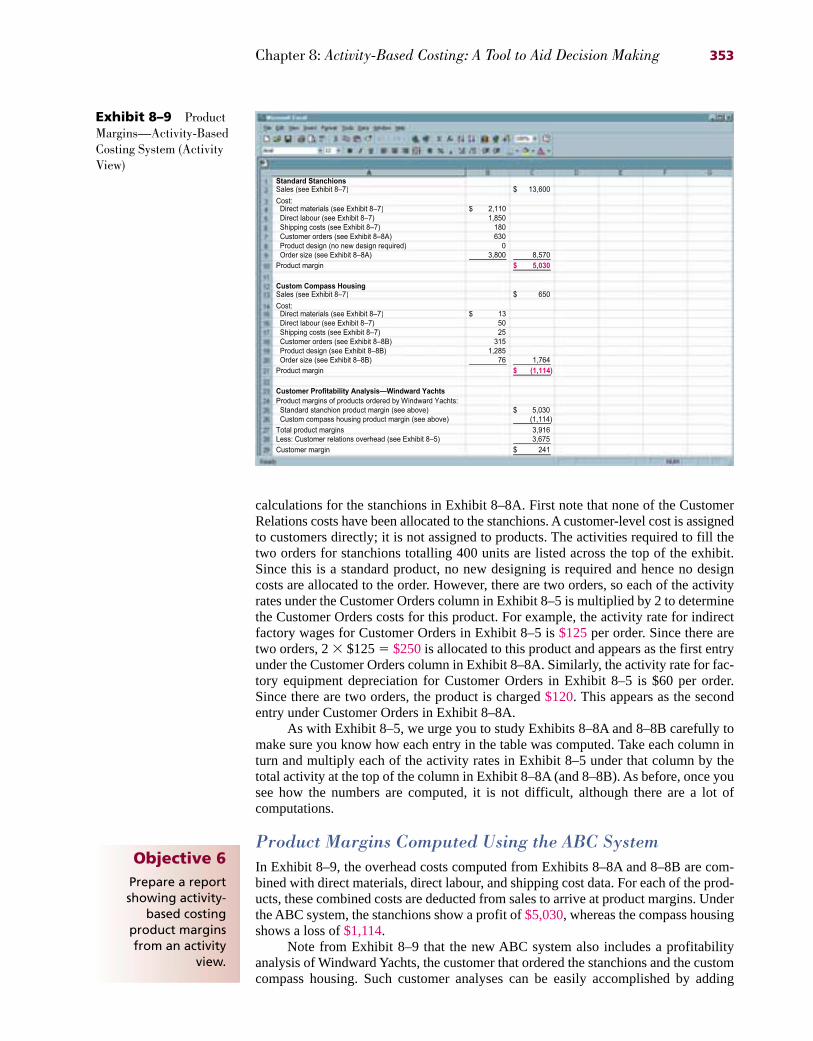
Product Margins Computed Using the ABC SystemIn Exhibit 8–9, the overhead costs computed from Exhibits 8–8A and 8–8B are com-bined with direct materials, direct labour, and shipping cost data. For each of the prod-ucts, these combined costs are deducted from sales to arrive at product margins. Underthe ABC system, the stanchions show a profit of $5,030, whereas the compass housingshows a loss of $1,114.
Note from Exhibit 8–9 that the new ABC system also includes a profitabilityanalysis of Windward Yachts, the customer that ordered the stanchions and the customcompass housing. Such customer analyses can be easily accomplished by adding
Chapter 8: Activity-Based Costing: A Tool to Aid Decision Making 353
Exhibit 8–9 ProductMargins—Activity-BasedCosting System (ActivityView)
Standard StanchionsSales (see Exhibit 8Ð7) 13,600$
Cost:Direct materials (see Exhibit 8Ð7) 2,110$Direct labour (see Exhibit 8Ð7) 1,850Shipping costs (see Exhibit 8Ð7) 180Customer orders (see Exhibit 8Ð8A) 630Product design (no new design required) 0Order size (see Exhibit 8Ð8A) 3,800 8,570
Product margin 5,030$
Custom Compass HousingSales (see Exhibit 8Ð7) 650$
Cost:Direct materials (see Exhibit 8Ð7) 13$Direct labour (see Exhibit 8Ð7) 50Shipping costs (see Exhibit 8Ð7) 25Customer orders (see Exhibit 8Ð8B) 315Product design (see Exhibit 8Ð8B) 1,285Order size (see Exhibit 8Ð8B) 76 1,764
Product margin (1,114)$
Customer Profitability AnalysisÑWindward Yachts
Product margins of products ordered by Windward Yachts:Standard stanchion product margin (see above) 5,030$Custom compass housing product margin (see above) (1,114)
Total product margins 3,916Less: Customer relations overhead (see Exhibit 8Ð5) 3,675
Customer margin 241$
Objective 6Prepare a reportshowing activity-
based costing product margins from an activity
view.
34944ch08.qxd 9/12/00 10:17 AM Page 353
together the product margins for each of the products a customer has ordered and thensubtracting the average charge of $3,675 for Customer Relations.
Comparison of Traditional and ABC Product CostsNow that the product margins have been computed using activity-based costing, itwould be interesting to compare them to the product margins computed using the com-pany’s traditional cost system.
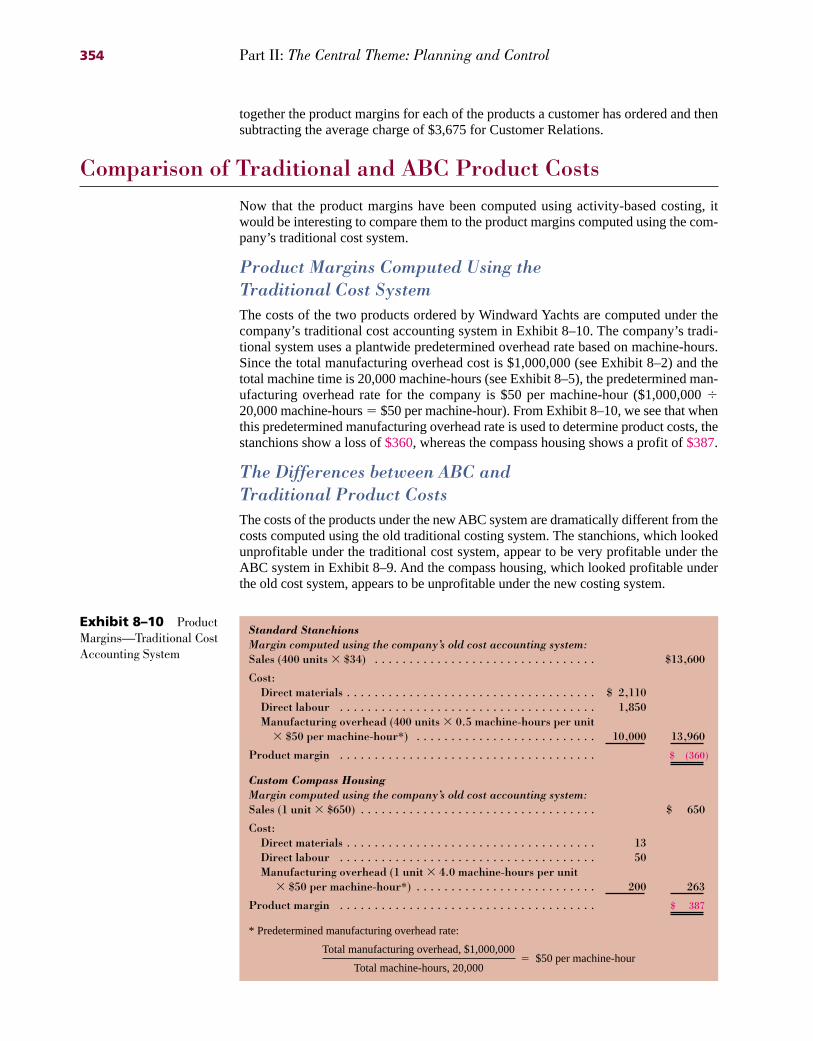
Product Margins Computed Using the Traditional Cost SystemThe costs of the two products ordered by Windward Yachts are computed under thecompany’s traditional cost accounting system in Exhibit 8–10. The company’s tradi-tional system uses a plantwide predetermined overhead rate based on machine-hours.Since the total manufacturing overhead cost is $1,000,000 (see Exhibit 8–2) and thetotal machine time is 20,000 machine-hours (see Exhibit 8–5), the predetermined man-ufacturing overhead rate for the company is $50 per machine-hour ($1,000,000 �20,000 machine-hours � $50 per machine-hour). From Exhibit 8–10, we see that whenthis predetermined manufacturing overhead rate is used to determine product costs, thestanchions show a loss of $360, whereas the compass housing shows a profit of $387.
The Differences between ABC and Traditional Product CostsThe costs of the products under the new ABC system are dramatically different from thecosts computed using the old traditional costing system. The stanchions, which lookedunprofitable under the traditional cost system, appear to be very profitable under theABC system in Exhibit 8–9. And the compass housing, which looked profitable underthe old cost system, appears to be unprofitable under the new costing system.
354 Part II: The Central Theme: Planning and Control
Exhibit 8–10 ProductMargins—Traditional CostAccounting System
Standard StanchionsMargin computed using the company’s old cost accounting system:Sales (400 units � $34) . . . . . . . . . . . . . . . . . . . . . . . . . . . . . . . . $13,600
Cost:Direct materials . . . . . . . . . . . . . . . . . . . . . . . . . . . . . . . . . . . . $ 2,110Direct labour . . . . . . . . . . . . . . . . . . . . . . . . . . . . . . . . . . . . . 1,850Manufacturing overhead (400 units � 0.5 machine-hours per unit
� $50 per machine-hour*) . . . . . . . . . . . . . . . . . . . . . . . . . . 10,000 13,960
Product margin . . . . . . . . . . . . . . . . . . . . . . . . . . . . . . . . . . . . . $ (360)
Custom Compass HousingMargin computed using the company’s old cost accounting system:Sales (1 unit � $650) . . . . . . . . . . . . . . . . . . . . . . . . . . . . . . . . . . $ 650
Cost:Direct materials . . . . . . . . . . . . . . . . . . . . . . . . . . . . . . . . . . . . 13Direct labour . . . . . . . . . . . . . . . . . . . . . . . . . . . . . . . . . . . . . 50Manufacturing overhead (1 unit � 4.0 machine-hours per unit
� $50 per machine-hour*) . . . . . . . . . . . . . . . . . . . . . . . . . . 200 263
Product margin . . . . . . . . . . . . . . . . . . . . . . . . . . . . . . . . . . . . . $ 387
* Predetermined manufacturing overhead rate:
Total manufacturing overhead, $1,000,000� $50 per machine-hour
Total machine-hours, 20,000
34944ch08.qxd 9/12/00 10:17 AM Page 354
There are two major reasons for these changes in apparent profitability. First,under the old cost system the costs of designing products were spread across all prod-ucts without regard to whether they actually required design work. Under the newABC system, these costs are assigned only to products that actually require designwork. Consequently, under the ABC system, design costs have been shifted from stan-dard products like stanchions, which do not require any design work, to custom prod-ucts like the compass housing.
Second, the Customer Orders costs, which are batch-level costs, were applied onthe basis of machine-hours, a unit-level base, under the old cost system. Therefore,under the old cost system, high-volume products absorbed the bulk of these batch-levelcosts even though they caused no more of these costs than low-volume products thatare ordered as frequently. Under the new cost system, these batch-level costs areassigned as a lump-sum to each customer order. Consequently, the new cost systemshifts these costs from high-volume orders like the stanchions to low-volume orderslike the compass housing.
When there are batch-level or product-level costs, activity-based costing will ordi-narily shift costs from high-volume products produced in large batches to low-volumeproducts produced in small batches. This cost shifting will usually have a greater impacton theper unitcosts of low-volume products than on the per unit costs of high-volumeproducts. For example, suppose that a total of $100 in batch-level cost is shifted from ahigh-volume, 100-unit product to a low-volume, 1-unit product. This shifting of costwill decrease the cost of the high-volume product by $1 per unit, on average, but willincrease the cost of the low-volume product by $100 for the single unit. In summary,implementing activity-based costing will typically shift costs from high-volume to low-volume products, but the effects will be much more dramatic on the per unit costs of thelow-volume products. The per unit costs of the low-volume products will increase farmore than the per unit costs of the high-volume products will decrease.
It is important to remember another major difference between the costs of productsas computed under the new ABC system at Classic Brass and product costs as computedunder the old traditional cost system. Under a traditional system, only manufacturingcosts are assigned to products. Under the new ABC system at Classic Brass, nonmanu-facturing costs are assigned to products as well as the manufacturing costs. In addition,the organization-sustaining manufacturing costs and the costs of idle capacity are notassigned to products under the ABC system, whereas they areassigned to products underthe old traditional costing system. For these reasons, the term product costin this chap-ter has a different meaning than it had in Chapters 2, 3, and 4. In the context of an ABCsystem like the one implemented at Classic Brass, product costs include the costs of allresources consumed by the product, whether they are manufacturing costs or not.
Chapter 8: Activity-Based Costing: A Tool to Aid Decision Making 355
The application of ABC concepts to differentindustries requires careful consideration that thedesign specifics should vary for different indus-tries. Insurance, banking, telephone, railroads,and distribution industries all present peculiari-ties for the system’s designer from those presentin traditional manufacturing. Activities for distri-bution companies include market research, prod-uct acquisition, marketing and inventorying.Insurance companies have activities such as sell-
ing, claim processing, policy processing andsustaining. Telephone companies have serviceactivities such as selling, service, billing and main-tenance. Banking involves data centres, net-works, and different products similar to insuranceand telephone. The system for each of theseindustries should contain a careful identificationof cost objects, activities and overall structure,not a pre-configured design applied fromanother industry.9
Focus on Current Practice
9. Paul Sharman, “ABC Systems Architecture,” CMA Magazine(May 1998), pp. 15–18.
34944ch08.qxd 9/12/00 10:17 AM Page 355
ABC Product Costs—An Action AnalysisThe sixth step in implementing an ABC system is preparing management reports. Theactivity view of product and customer margins, as illustrated in Exhibit 8–9, may beone of those reports. However, the overhead computations in Exhibits 8–8A and 8–8Ballow another view of the ABC product costs that emphasizes who in the organizationis responsible for the costs and how easy it would be to actually adjust the costs in theevent that the products were dropped. To help in this supplemental analysis, the ABCteam applied a simple colour coding scheme to the company’s costs.
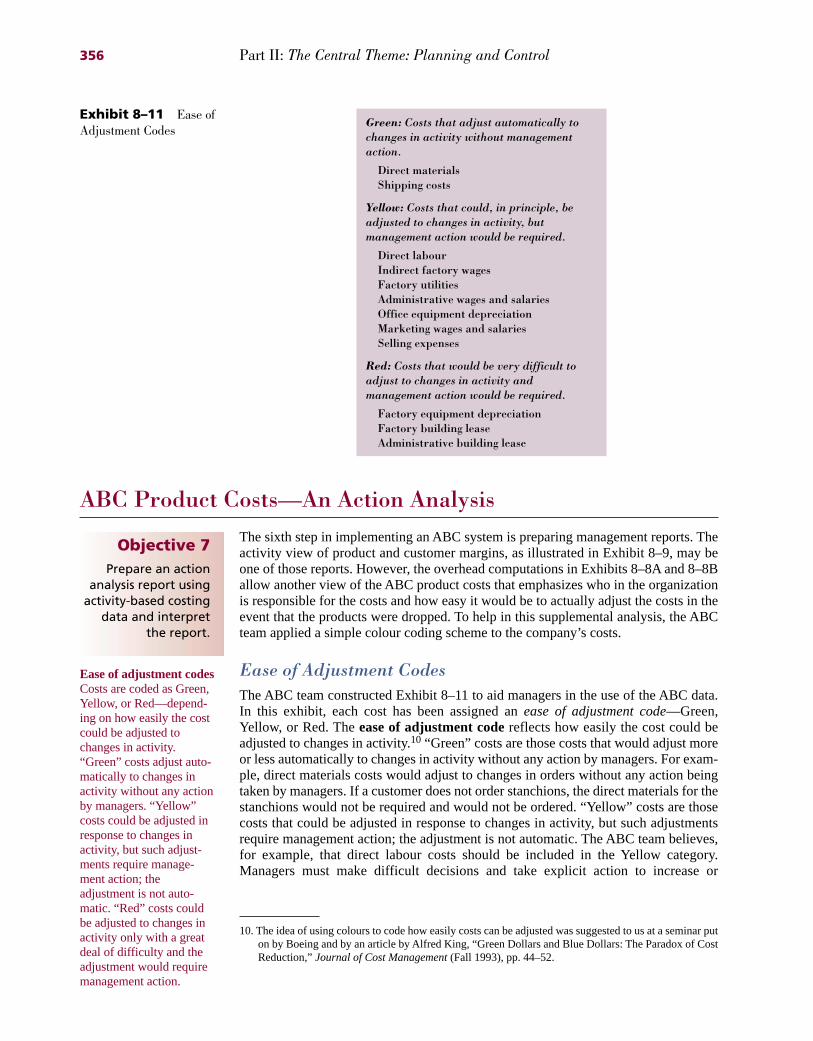
Ease of Adjustment CodesThe ABC team constructed Exhibit 8–11 to aid managers in the use of the ABC data.In this exhibit, each cost has been assigned an ease of adjustment code—Green,Yellow, or Red. The ease of adjustment codereflects how easily the cost could beadjusted to changes in activity.10 “Green” costs are those costs that would adjust moreor less automatically to changes in activity without any action by managers. For exam-ple, direct materials costs would adjust to changes in orders without any action beingtaken by managers. If a customer does not order stanchions, the direct materials for thestanchions would not be required and would not be ordered. “Yellow” costs are thosecosts that could be adjusted in response to changes in activity, but such adjustmentsrequire management action; the adjustment is not automatic. The ABC team believes,for example, that direct labour costs should be included in the Yellow category.Managers must make difficult decisions and take explicit action to increase or
356 Part II: The Central Theme: Planning and Control
10. The idea of using colours to code how easily costs can be adjusted was suggested to us at a seminar puton by Boeing and by an article by Alfred King, “Green Dollars and Blue Dollars: The Paradox of CostReduction,” Journal of Cost Management (Fall 1993), pp. 44–52.
Ease of adjustment codesCosts are coded as Green,Yellow, or Red—depend-ing on how easily the costcould be adjusted tochanges in activity.“Green” costs adjust auto-matically to changes inactivity without any actionby managers. “Yellow”costs could be adjusted inresponse to changes inactivity, but such adjust-ments require manage-ment action; theadjustment is not auto-matic. “Red” costs couldbe adjusted to changes inactivity only with a greatdeal of difficulty and theadjustment would requiremanagement action.
Exhibit 8–11 Ease ofAdjustment Codes
Green: Costs that adjust automatically tochanges in activity without managementaction.
Direct materialsShipping costs
Yellow: Costs that could, in principle, beadjusted to changes in activity, butmanagement action would be required.
Direct labourIndirect factory wagesFactory utilitiesAdministrative wages and salariesOffice equipment depreciationMarketing wages and salariesSelling expenses
Red: Costs that would be very difficult toadjust to changes in activity andmanagement action would be required.
Factory equipment depreciationFactory building leaseAdministrative building lease
Objective 7Prepare an action
analysis report usingactivity-based costing
data and interpretthe report.
34944ch08.qxd 9/12/00 10:17 AM Page 356

decrease, in aggregate, direct labour costs—particularly since the company has a nolayoff policy. “Red” costs are costs that could be adjusted to changes in activity onlywith a great deal of difficulty, and the adjustment would require management action.The building leases fall into this category, since it would be very difficult and expen-sive to break the leases.
The Action Analysis View of the ABC DataLooking at Exhibit 8–8B, the totals on the right-hand side of the table indicate that the$1,676of overhead cost for the custom housing consists of $1,145of indirect factorywages, $96of factory equipment depreciation, and so on. These data are displayed inExhibit 8–12, which shows an action analysisof the custom compass housing product.An action analysis reportis a report showing what costs have been assigned to thecost object, such as a product or customer, and how difficult it would be to adjust thecost if there is a change in activity. Note that the Red margin at the bottom ofExhibit 8–12, ($1,114), is exactly the same as the product margin for the custom com-pass housing in Exhibit 8–9.
The cost data in the action analysis in Exhibit 8–12 are arranged by the colourcoded ease of adjustment. All of the Green costs—those that adjust more or lessautomatically to changes in activity—appear together at the top of the list of costs.These costs total $38and are subtracted from the sales of $650to yield a Green mar-gin of $612. The same procedure is followed for the Yellow and Red costs. This actionanalysis indicates exactly what costs would have to be cut and how difficult it wouldbe to cut them if the custom compass housing product were dropped. Prior to makingany decision about dropping products, the managers responsible for the costs mustagree to either eliminate the resources represented by those costs or to transfer theresources to an area in the organization that really needs the resources—namely, a con-straint. If managers do not make such a commitment, it is likely that the costs wouldcontinue to be incurred. As a result, the company would lose the sales from the prod-ucts without really saving the costs.
Chapter 8: Activity-Based Costing: A Tool to Aid Decision Making 357
Exhibit 8–12 ActionAnalysis of CustomCompass Housing:Activity-Based CostingSystem Custom Compass Housing
Sales (see Exhibit 8Ð7) 650$
Green costs:
Direct materials (see Exhibit 8Ð7) 13$Shipping costs (see Exhibit 8Ð7) 25 38
Green margin 612
Yellow costs:
Direct labour (see Exhibit 8Ð7) 50Indirect factory wages (see Exhibit 8Ð8B) 1,145
Factory utilities (see Exhibit 8Ð8B) 72
Administrative wages and salaries (see Exhibit 8Ð8B) 168
Office equipment depreciation (see Exhibit 8Ð8B) 15
Marketing wages and salaries (see Exhibit 8Ð8B) 175Selling expenses (see Exhibit 8Ð8B) 5 1,630
Yellow margin (1,018)
Red costs:
Factory equipment depreciation (see Exhibit 8Ð8B) 96
Factory building lease (see Exhibit 8Ð8B) 0
Administrative building lease (see Exhibit 8Ð8B) 0 96
Red margin (1,114)$
Action analysis reportA report showing whatcosts have been assignedto a cost object, such as aproduct or customer, andhow difficult it would beto adjust the cost if thereis a change in activity.
34944ch08.qxd 9/12/00 10:18 AM Page 357